 Yuki Takemoto1
 Naoki Tanimine1*
 Hisaaki Yoshinaka1
 Yuka Tanaka1
 Toshiro Takafuta2
 Aya Sugiyama3
 Junko Tanaka3
 Hideki Ohdan1*
- 1Department of Gastroenterological and Transplant Surgery, Graduate School of Biomedical and Health Sciences, Hiroshima University, Hiroshima, Japan
- 2Department of Internal Medicine, Hiroshima City Funairi Citizens Hospital, Hiroshima, Japan
- 3Department of Epidemiology, Infectious Disease Control and Prevention, Graduate School of Biomedical and Health Sciences, Hiroshima University, Hiroshima, Japan
Background: Vaccination against severe acute respiratory syndrome coronavirus type 2 is highly effective in preventing infection and reducing the severity of coronavirus disease (COVID-19). However, acquired humoral immunity wanes within six months. Focusing on the different tempo of acquisition and attenuation of specific antibody titers in individuals, we investigated the impact of genetic polymorphisms on antibody production after COVID-19 vaccination.
Methods: In total 236 healthcare workers from a Japanese municipal hospital, who received two doses of the vaccine were recruited. We employed a candidate gene approach to identify the target genetic polymorphisms affecting antibody production after vaccination. DNA samples from the study populations were genotyped for 33 polymorphisms in 15 distinct candidate genes encoding proteins involved in antigen-presenting cell activation, T cell activation, T-B interaction, and B cell survival. We measured total anti-SARS-Cov2 spike IgG antibody titers and analyzed the association with genetic polymorphisms at several time points after vaccination using an unbiased statistical method, and stepwise logistic regression following multivariate regression.
Results: Significant associations were observed between seven SNPs in NLRP3, OAS1, IL12B, CTLA4, and IL4, and antibody titers at 3 weeks after the first vaccination as an initial response. Six SNPs in NLRP3, TNF, OAS1, IL12B, and CTLA4 were associated with high responders with serum antibody titer > 4000 BAU/ml as boosting effect at 3 weeks after the second vaccination. Analysis of long-term maintenance showed the significance of the three SNPs in IL12B, IL7R, and MIF for the maintenance of antibody titers and that in BAFF for attenuation of neutralizing antibodies. Finally, we proposed a predictive model composed of gene profiles to identify the individuals with rapid antibody attenuation by receiver operating characteristic (ROC) analysis (area under the curve (AUC)= 0.76, sensitivity = 82.5%, specificity=67.8%).
Conclusions: The candidate gene approach successfully showed shifting responsible gene profiles and initial and boosting effect mainly related to the priming phase into antibody maintenance including B cell survival, which traces the phase of immune reactions. These gene profiles provide valuable information for further investigation of humoral immunity against COVID-19 and for building a strategy for personalized vaccine schedules.
1 Introduction
The severe acute respiratory syndrome coronavirus type 2 (SARS-CoV-2) pandemic has caused a major global health crisis (1, 2), and vaccines have been developed worldwide (3). Several randomized trials have shown that mRNA vaccines are highly effective in preventing infection and reducing the severity of COVID-19 (4–6). Almost of cases could obtain sufficient amounts of specific antibody production immediately after the vaccination, however, a marked decrease in serum antibody titers was observed at approximately 6 months after the second vaccination (7–9). Along with a decrease in antibody titers, waning immunity against COVID-19 infection preventive effect has been reported, especially in males and older individuals (8).
Host factors such as age, sex, comorbidities, and genetic polymorphisms have been shown to influence individual immune status including acquired immunity after vaccination (10, 11). The effect of host-side genetic factors on vaccine response has been demonstrated in conventional vaccines, such as hepatitis B virus, pneumococcus pneumoniae, and measles (12–17). However, it is unclear whether an association exists between genetic polymorphisms and responses to vaccination against COVID-19.
In the present study, we employed a candidate gene approach, which selects a series of target genes based on the rationale of biological response or mechanism (18), to investigate the impact of genetic polymorphisms on antibody production after COVID-19 vaccination. Furthermore, we analyzed the effects of the gene profile in an immunological network using an unbiased statistical method, a stepwise regression method, and identified genetic factors as predictors of high response and antibody maintenance.
2 Materials and methods
2.1 Study participants
Our study population was similar to the previous report (19). A total of 236 Japanese healthcare workers working at Funairi Citizens Hospital in Japan who received their first dose of the vaccine between March and May 2021 participated in the study. All the participants received two doses of BNT162b2 (Pfizer/Biotech). The vaccinations were administered at the intervals specified in the protocol, that is the second dose was administered three weeks after the first dose. Ultimately, 213 participants with no missing data were included in the analysis, including 35 males (16.4%) and 178 females (83.6%). The age distribution was as follows: 20–29 years: n=29 (13.6%), 30–39 years: n=54 (25.4%), 40–49 years: n=58 (27.2%), 50–59 years: n=45(21.1%), and ≥60 years: n=27 (12.7%).
This study was approved by the Ethics Committee for Human Genome Analysis at Hiroshima University (Hi-258). Written informed consent was obtained from all the participants.
2.2 Measurement of anti-SARS-Cov-2 spike IgG antibodies
Blood samples were collected three weeks after the first vaccination (just before the second vaccination), three weeks after the second vaccination, and five months after the second vaccination. Total anti-SARS-Cov2 spike IgG antibodies were quantitatively measured using the VITROS SARS-Cov-2 S1 Quant IgG antibody reagent (CLEIA, Ortho Clinical Diagnostics). Quantitative values were determined using the WHO standard binding antibody unit/ml (BAU/ml) (20). The upper limit of quantification was 4000 BAU/ml. Participants with specific N-antibodies detected by the Elecsys®Anti-SARS-CoV-2 (ECLIA, Roche Diagnostics) were defined as previously infected and excluded from the analysis.
2.3 Candidate gene polymorphisms
DNA samples from the study subjects were genotyped for 33 functional polymorphisms in 15 candidate genes. The candidate genes were selected on pathophysiological hypotheses based on the best evidence from studies published under the keywords, “vaccine,” “immune response,” and “antibody production.” Single nucleotide polymorphisms (SNPs) in genes encoding functional molecules involved in the immune responses that lead to the establishment of vaccine-induced acquired immunity were investigated. These processes can be categorized into the following four phases: 1) antigen-presenting cell (APC) activation, 2) T cell activation, 3) T cell and B cell (T-B) interaction, and 4) B cell survival (Figure 1). If there were more than four candidate polymorphisms in a gene, selection was based on the number of publications in the single nucleotide polymorphism (SNP) database of the National Center for Biotechnology Information (21, 22). The list of each SNPs and its allele frequency is presented in Table 1 (12–17, 23–51).
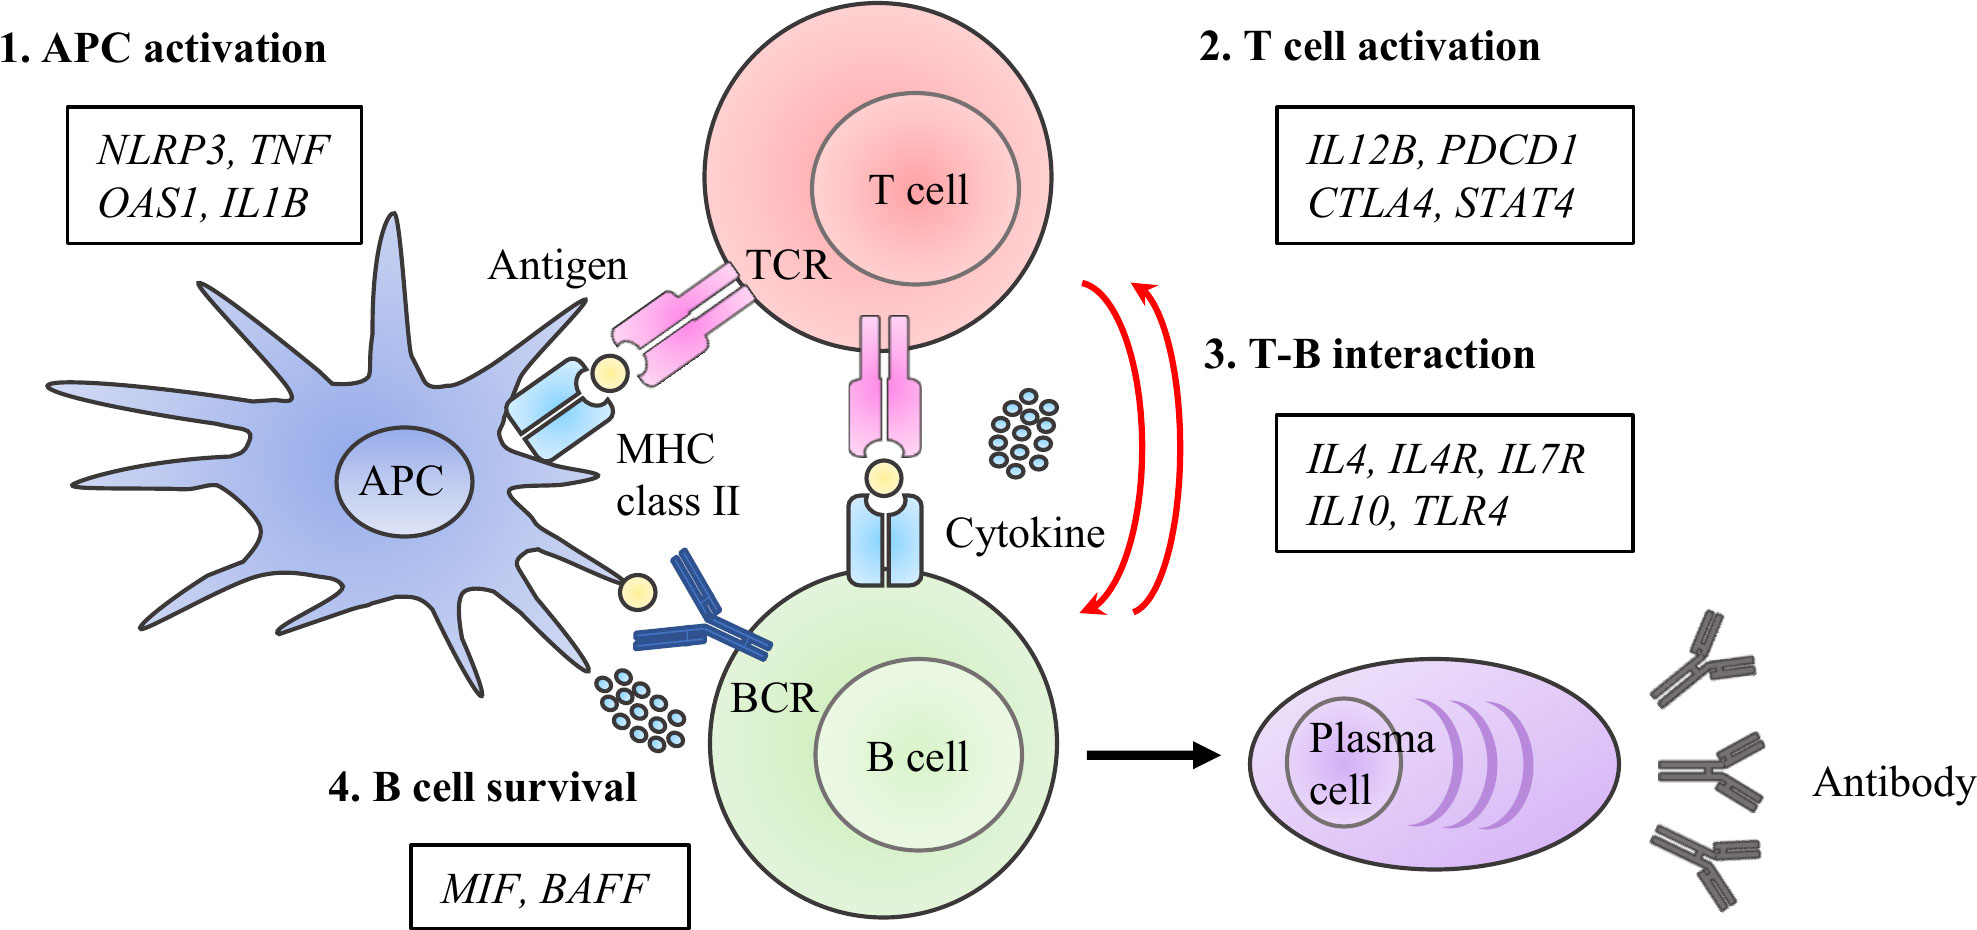
Figure 1 Immuno-network for antibody production after COVID-19 vaccine. We selected 15 molecules and 33 SNPs categorized into priming- associated APC and T cell activation, B cell activation with T -B interactions, and B cell survival, which are key immunological steps for enhancing to enhance specific antibody production after antigen exposure.
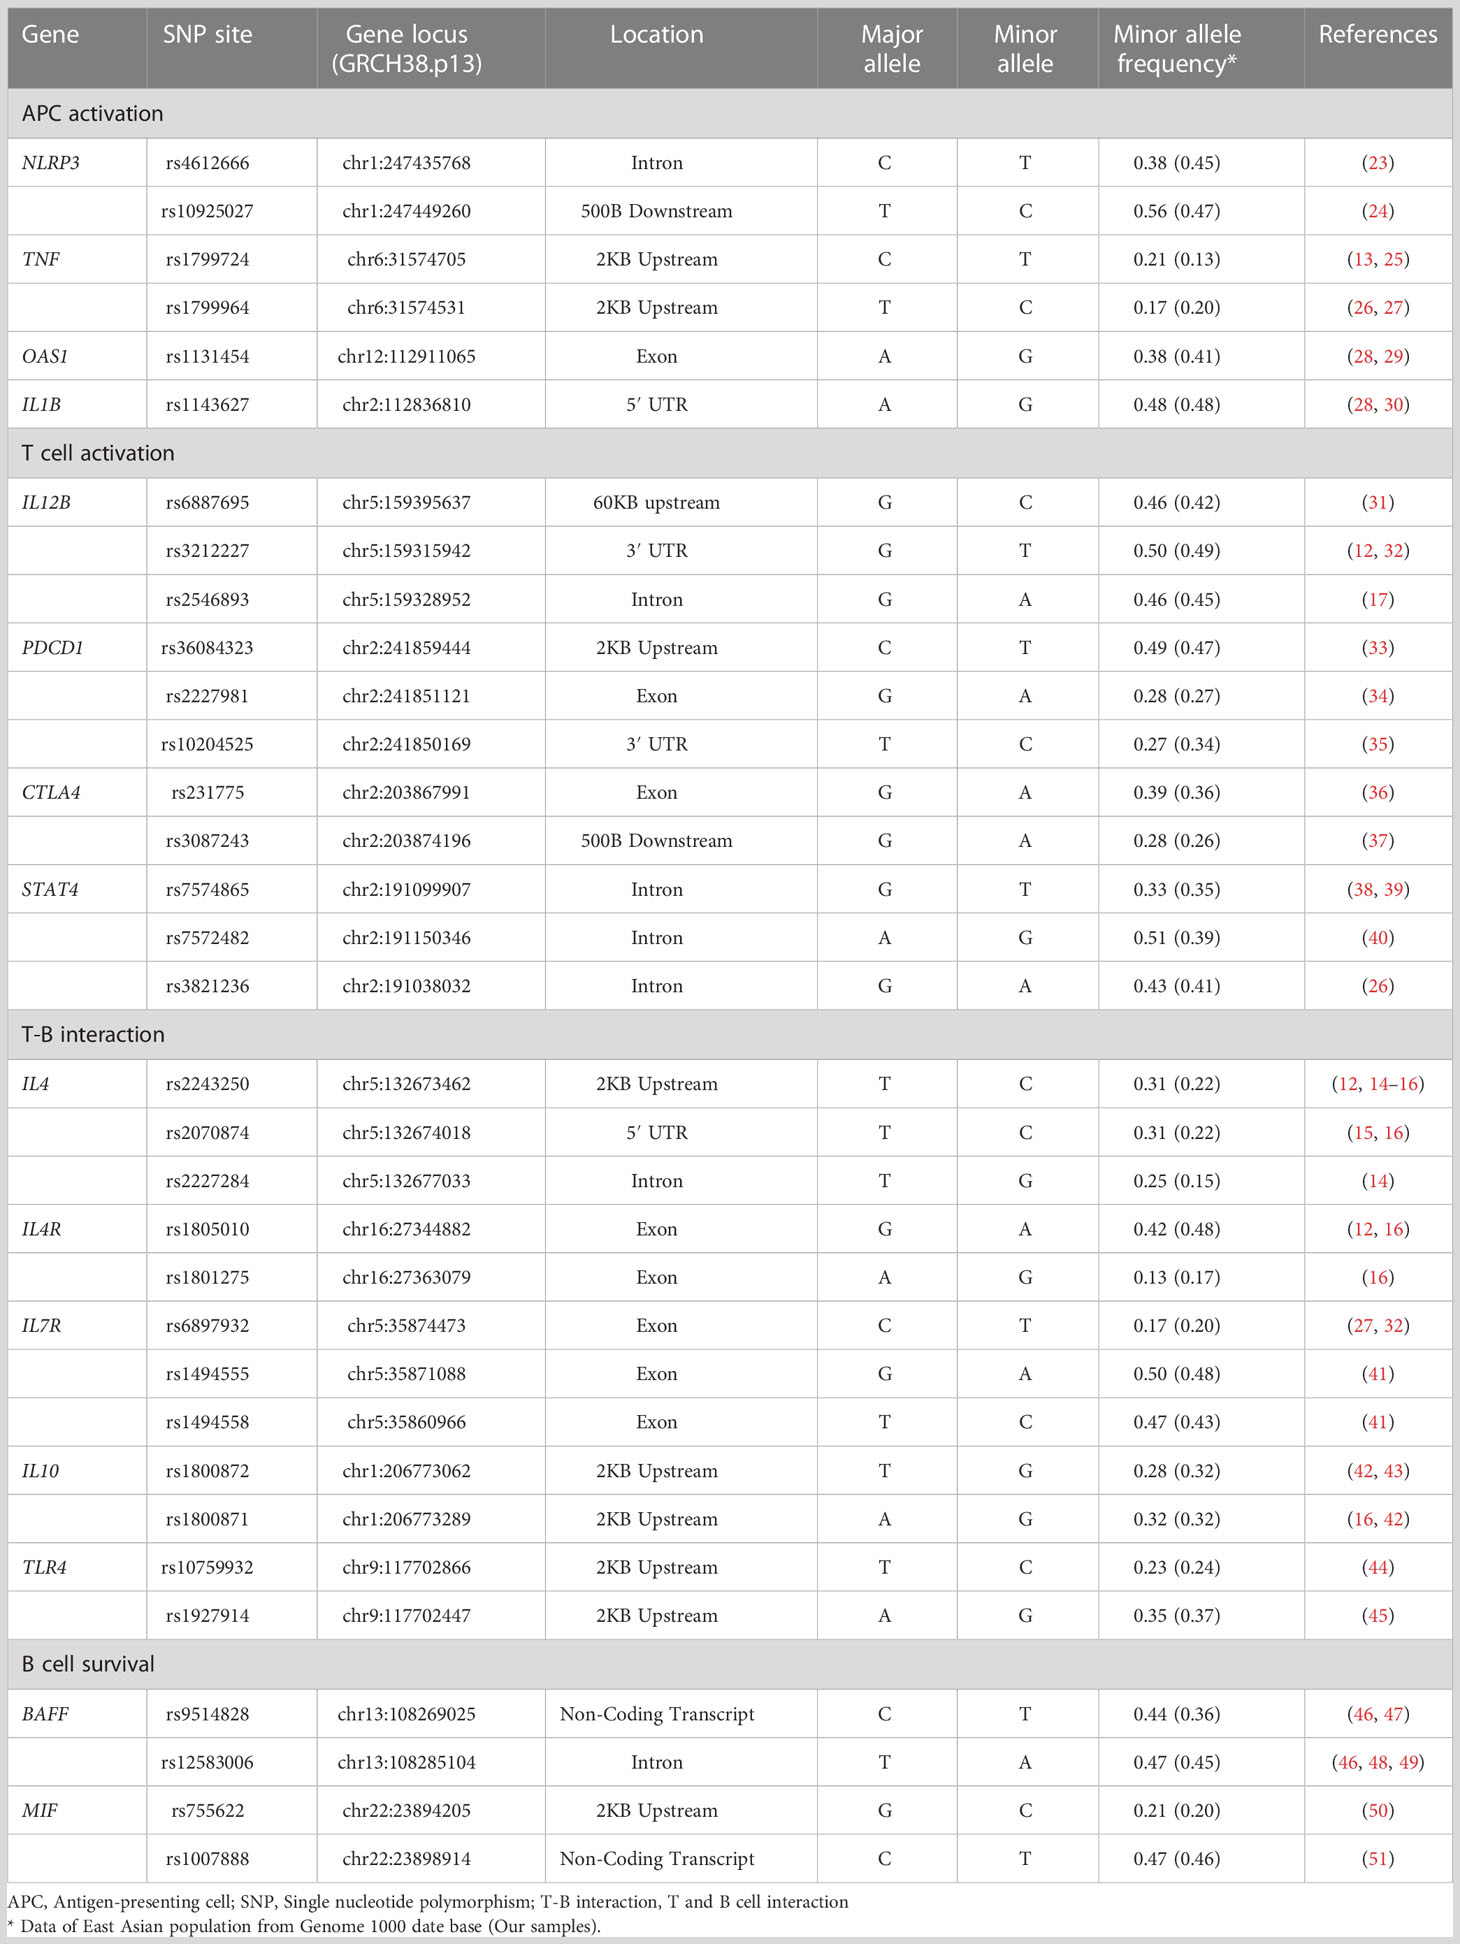
Table 1 Description of candidate genes related to humoral immunity.
2.4 Genotyping
Genetic analyses were performed as previously described (28). Briefly, blood samples from the study subjects were collected in EDTA tubes and assigned a blinded unique identification number. Genomic DNA was extracted from whole blood samples using a QIA Cube (QIAGEN, Hilden, Germany). SNP genotyping was performed using TaqMan SNP Genotyping Assays (Thermo Fisher Scientific, MA) according to the manufacturer’s protocol. Two allele specific TaqMan probes containing different fluorescent dyes and polymerase chain reaction (PCR) primer pairs were used to detect specific SNP targets. Quantitative PCR was performed using a Rotor-GeneQ (QIAGEN). We described the zygosity of the A>G SNP as AA or GG and AG in the case of homozygosity and heterozygosity, respectively. Genotypes were analyzed in either a recessive or dominant model, which was selected as the more impactful model based on the results of previous studies or our data set.
2.5 Effects of gene profiles on antibody titers after vaccination
We analyzed the association between antibody titers and genetic polymorphisms at 3 weeks after the first vaccination, 3 weeks after the second vaccination, and 5 months after the second vaccination, which was analyzed as initial response, boosting effect, and maintenance ability of antibodies, respectively.
Analyzing the impact of genetic profile for boosting effect, we divided subjects into 2 groups: the individuals with a serum antibody level ≥4000 BAU/ml (upper limit of measurement) defined as high responders and those with <4000 BAU/ml defined as low responders at 3 weeks after the second vaccination.
To account for the level of antibody titer at boosting effect for following maintenance ability, subjects were categorized into three groups by the antibody titers at 3 weeks after the second vaccination (≥4000 BAU/ml, ≥1825 BAU/ml, and <4000 BAU/mL, or <1825 BAU/ml). The median antibody titer at 3 weeks after the second vaccination was 1825 BAU/ml, excluding high responders.
To analyze of the maintenance of protective antibodies, we focused on the neutralizing antibodies. Previously, our collaborators have reported a proportional relationship between the total IgG levels of anti-S protein antibodies and neutralizing activity (19). The predictive formula was as follows: neutralizing inhibitory activity (%) = 48.2 × log (total IgG level of anti-S protein BAU/ml) - 53.5. The negative threshold for neutralizing activity was evaluated using a surrogate virus neutralization test, which showed 30% inhibition compared with negative sera (52). A total IgG level of 54 BAU/ml, which was expected to maintain 30% neutralizing activity, was calculated using a predictive formula. We analyzed the predictive gene profiles below the negative threshold.
2.6 Statistical analysis
All statistical analyses were performed using JMP Pro statistical software package 15.0.0 (SAS Institute, Cary, NC, USA). We used multivariate multiple regression and multivariate logistic regression analyses to identify the factors that were significantly associated with antibody production and maintenance. We used stepwise logistic regression with forward-backward elimination to determine the best combination of variables. The accuracy of the predictive model for high responders and maintenance was assessed using the area under the receiver operating characteristic (ROC) curve.
3 Results
3.1 Polymorphic gene profiles affect the initial response after the first COVID-19 vaccination
First, we analyzed the demographic and genetic variables associated with specific antibody production in the initial response phase after the first COVID-19 vaccination. Ten of the 33 candidate SNPs were defined as potential factors by stepwise regression, and seven of the 10 SNPs and young age (<60 years) were significantly associated with the absolute titer of anti-SARS-CoV-2 spike IgG in the initial response phase (Table 2). The statistically significant seven SNPs were within genes encoding immune function molecules belonging to multiple phases, i.e., rs4612666 (NLRP3), rs10925027 (NLRP3), and rs1131454 (OAS1) upon APC activation phase; rs3212227 (IL12B), rs2546893 (IL12B), and rs3087243 (CTLA4) on T cell activation phase, and rs2227284 (IL4) on T-B interaction phase. Thus, SNPs in genes encoding molecules responsible for functions in immunological processes from the priming to B cell activation phases were important predictors in favor of antibodies in response to the initial vaccine, whereas SNPs encoding molecules belonging to the B cell survival phase showed no significant association.
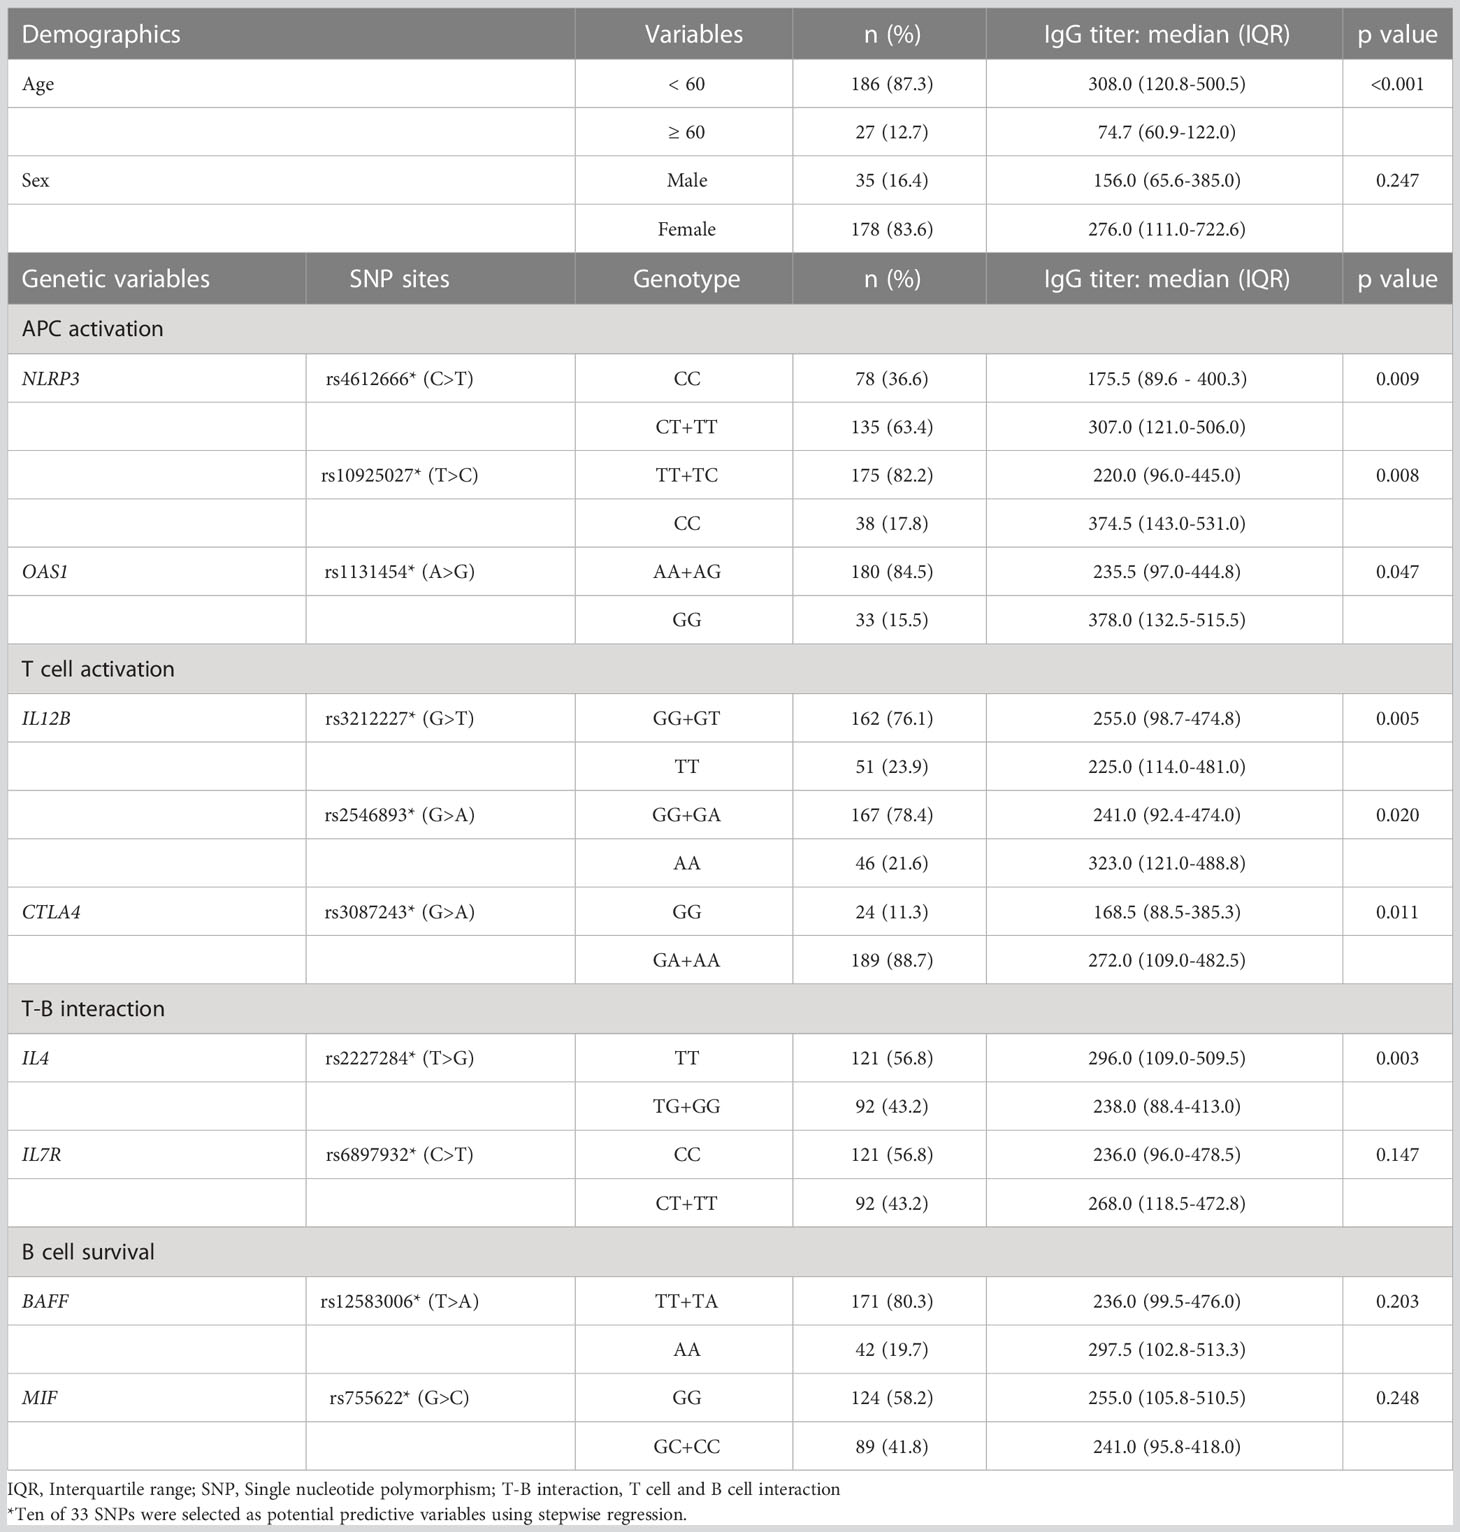
Table 2 Demographic and genetic valuables associated with higher antibody titer in an initial response phase.
3.2 The boosting response is also associated with priming phase gene profiles
Three weeks after the second vaccination, we observed 53 high responders with anti-SARS-CoV-2 spike IgG at more than 4000 BAU/ml. Ten SNPs in the 33 candidate genes were defined as potential factors using stepwise regression, and six SNPs and young age were significantly associated with high responders (Table 3). Four of the six genes related to high responders overlapped with those related to initial response, i.e., rs4612666 (NLRP3) and rs1131454 (OAS1) on APC activation phase, and rs3212227 and rs2546893 (IL12B) on T cell activation phase.
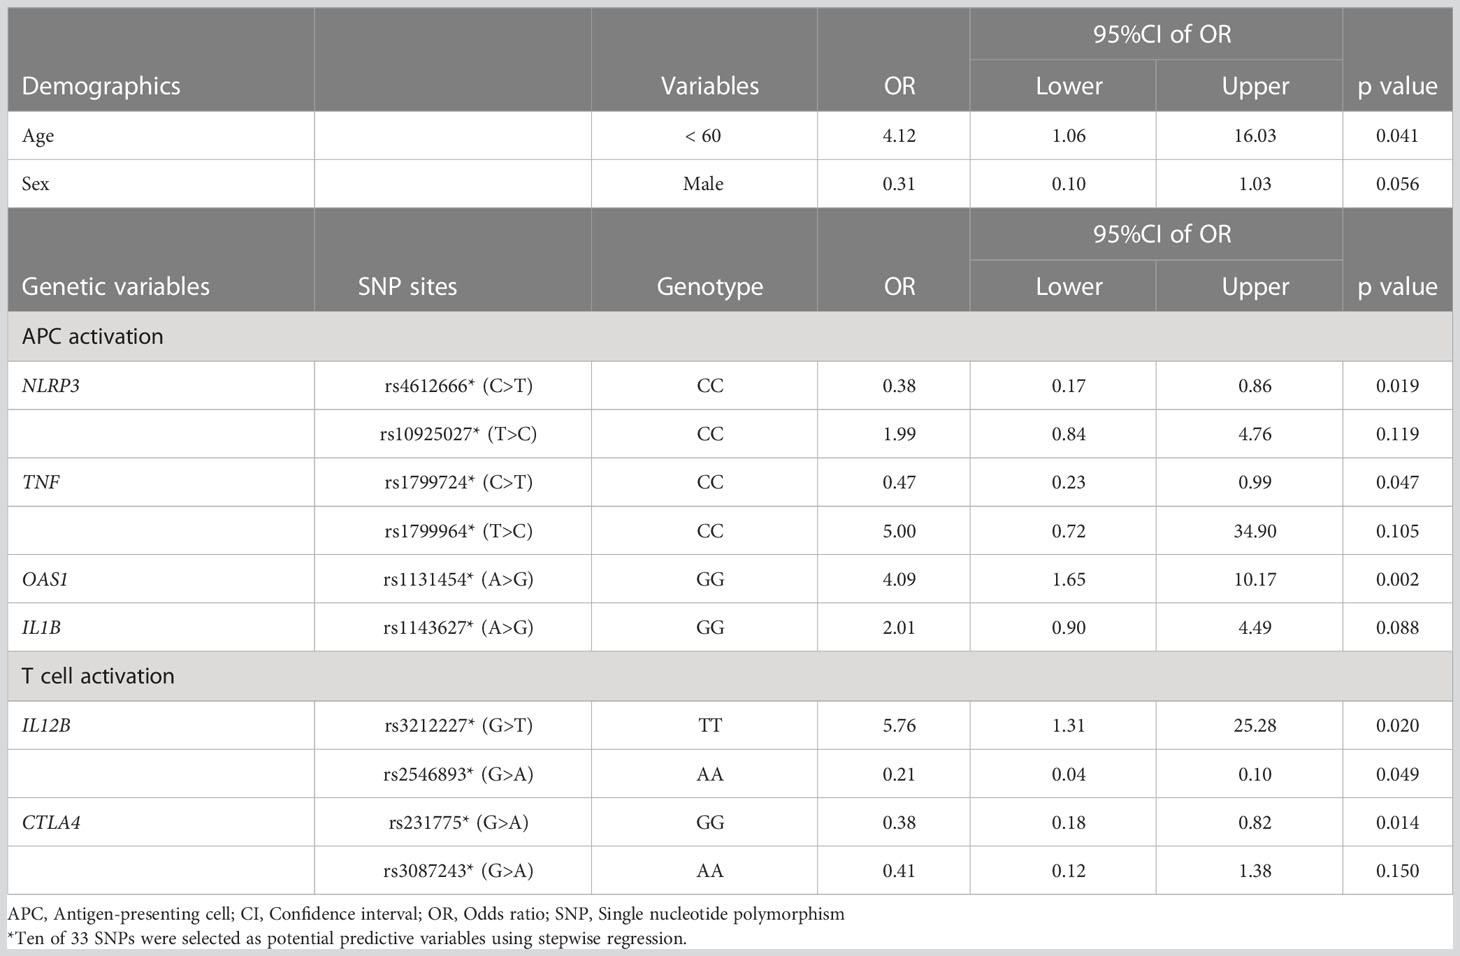
Table 3 Demographic and genetic valuables for predicting high responders in a boost response phase.
We proposed a model for predicting high responders using polygenetic factors and age with a receiver operating characteristic (ROC) curve analysis (area under the curve (AUC) =0.74, Figure 2). The model equation was as follows; prediction score (P) = 1/(1+e-x) x = -1.09 + 0.71×(age: -1 if 60 years, 1 if under 60)+ 0.58×(sex: -1 if male, 1 if female)+ 0.48×(NLRP3 rs4612666: -1 if CC, 1 if T carrier)+ 0.35×(NLRP3 rs10925027: -1 if T carrier, 1 if CC)+ 0.37×(TNF rs1799724: -1 if CC, 1 if T carrier)+ 0.80×(TNF rs1799964: -1 if T carrier, 1 if CC)+ 0.70×(OAS1 rs1131454: -1 if A carrier, 1 if GG)+ 0.35×(IL1B rs1143627: -1 if A carrier, 1 if GG)+ 0.88×(IL12B rs3212227: -1 if G carrier, 1 if TT)+ 0.77×(IL12B rs2546893: -1 if AA, 1 if G carrier)+ 0.48×(CTLA4 rs231775: -1 if GG, 1 if A carrier)+ 0.44×(CTLA4 rs3087243: -1 if AA, 1 if G carrier).
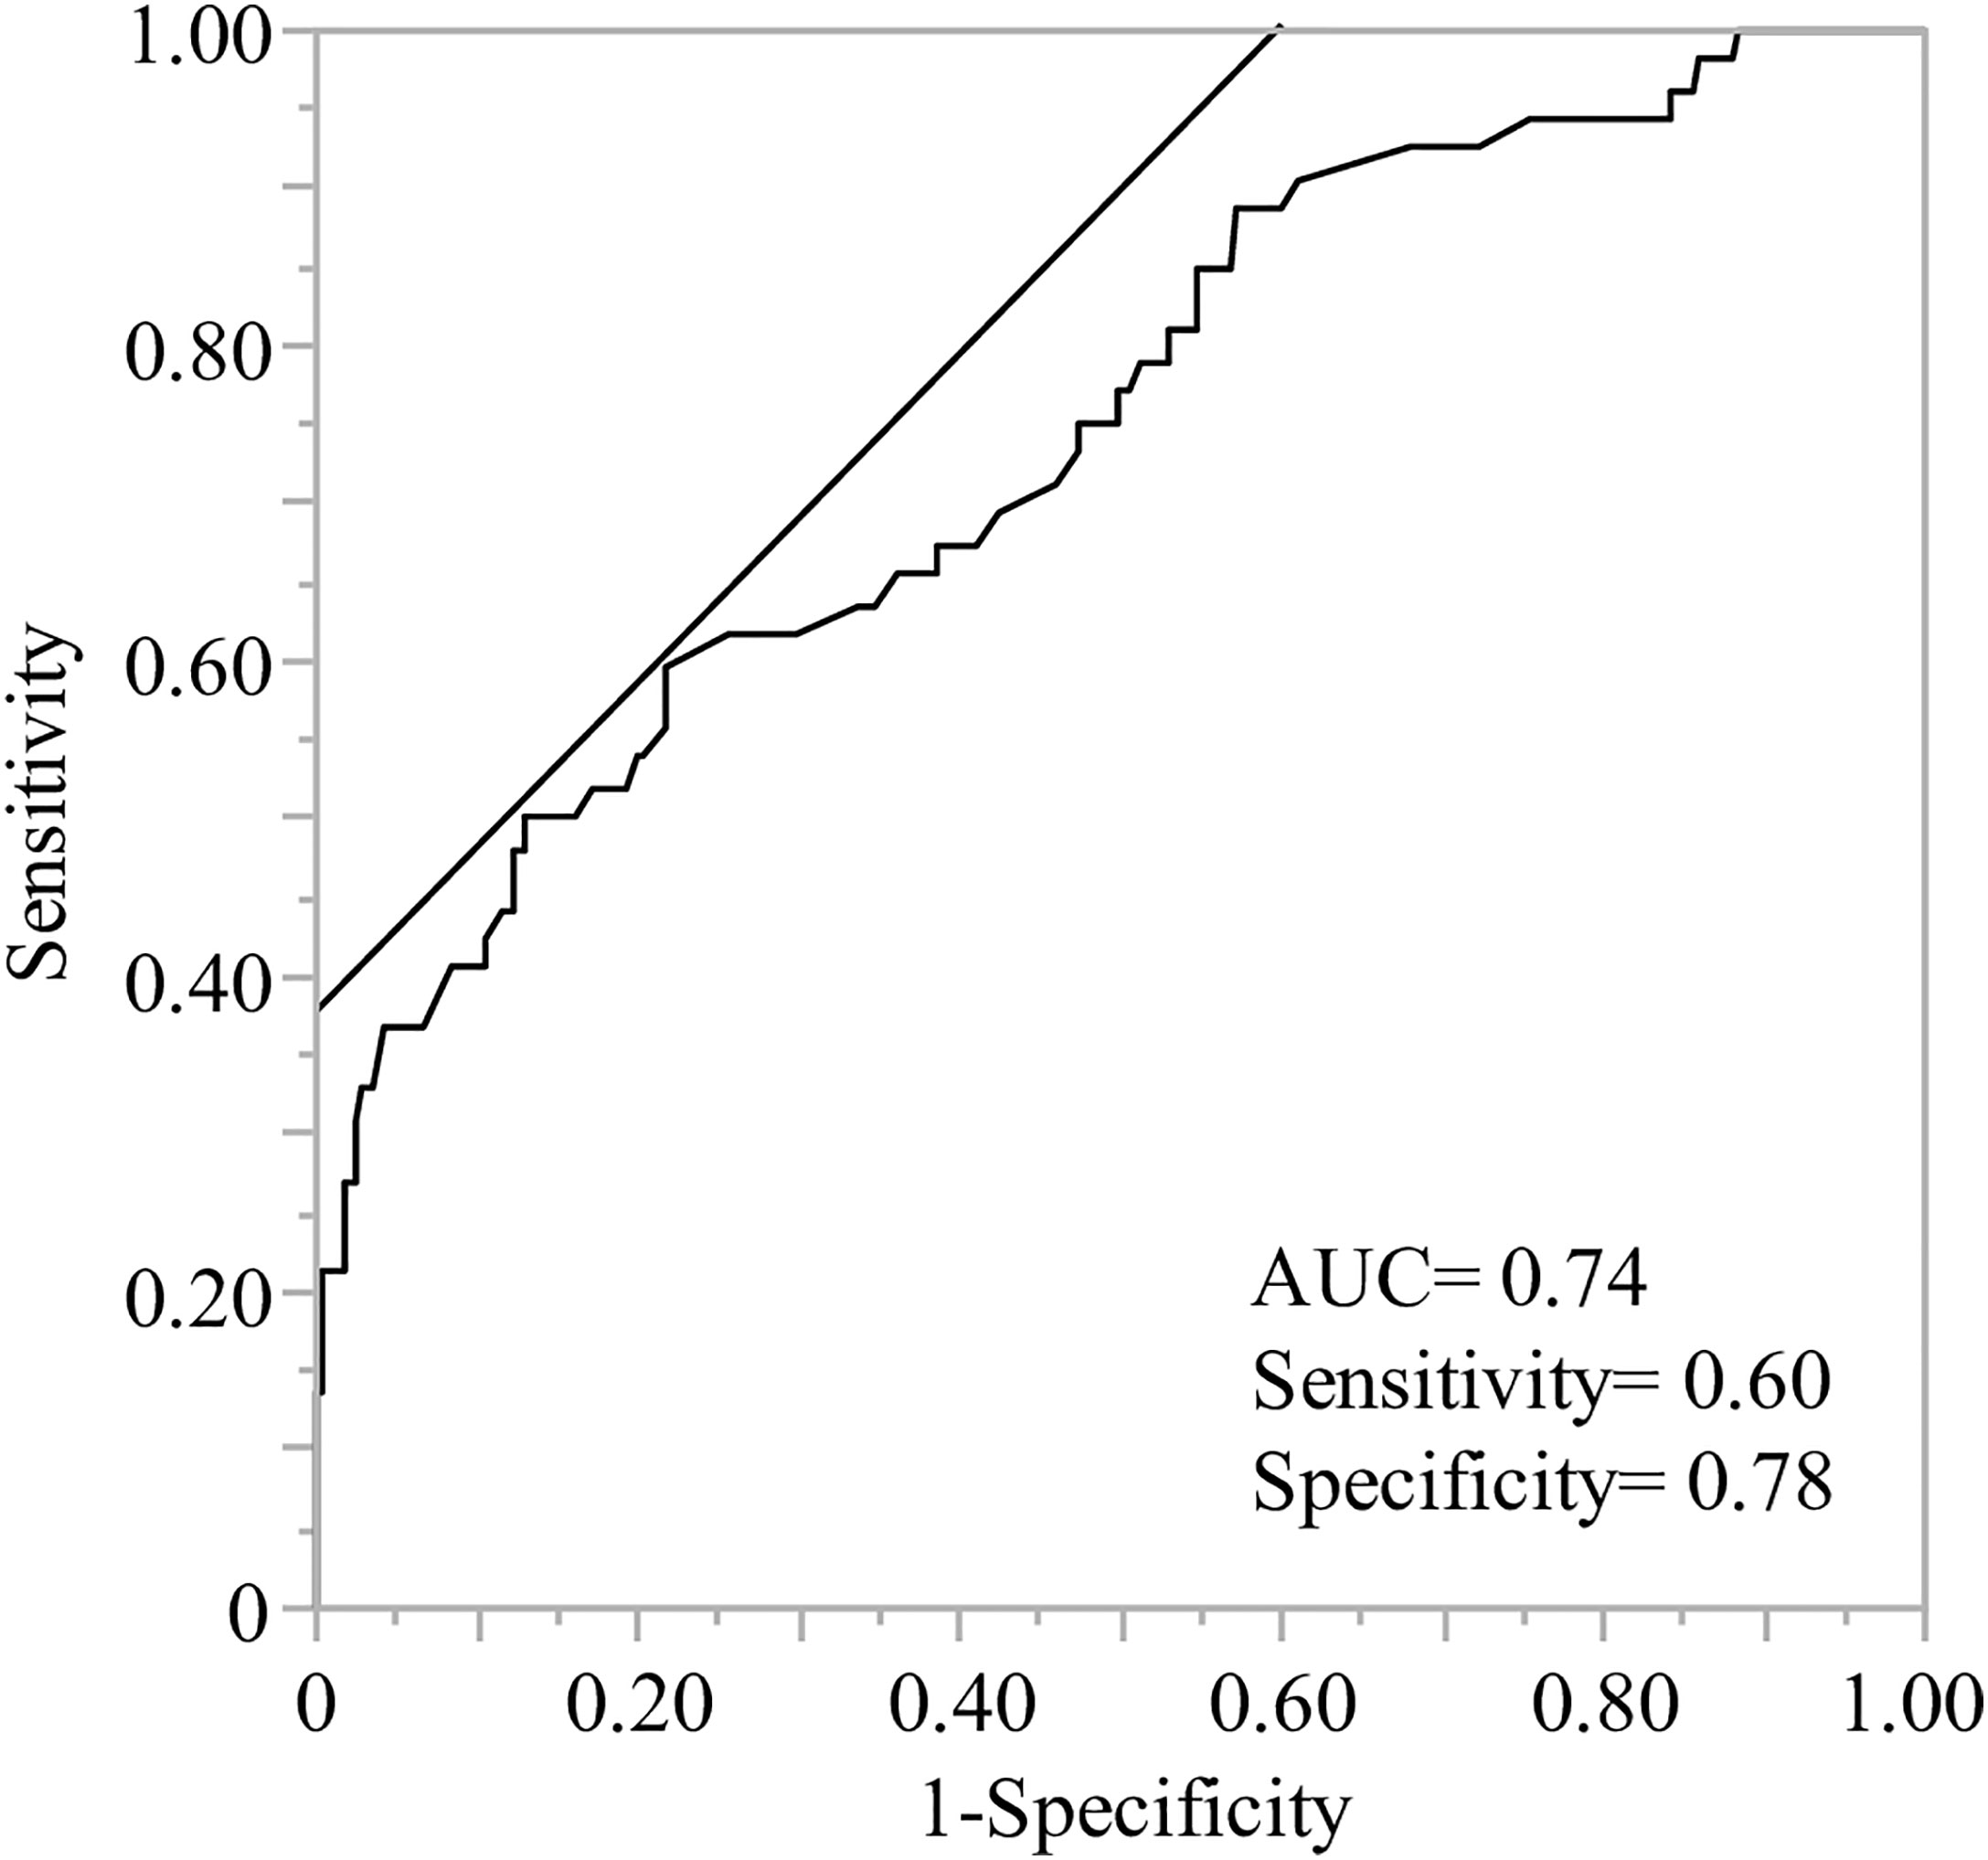
Figure 2 Receiver operating characteristic (ROC) analysis of predictive models to identify the high responders after the second vaccination. ROC curve analysis was performed using the indicated age, sex, and genetic factors to calculate the predictive value, area under the curve (AUC), sensitivity, and specificity. The demographics and ten genes indicated age less than 60, sex (female) and rs4612666 and rs10925027 (NLRP3), rs1799724 and rs1799964 (TNF), rs1131454 (OAS1), rs1143627 (IL1B), rs3212227 and rs2546893 (IL12B), rs231775 and rs3087243 (CTLA4), respectively (details are described in Table 3).
3.3 Polymorphic gene profile for long-term maintenance of specific antibody after vaccination
By analyzing the effect of gene profiles on the ability to maintain antibody titers 5 months after the second vaccination, seven SNPs were defined as potential factors by stepwise regression. Three of the 7 SNPs, rs3212227 (IL12B) in the T cell activation phase, rs1494555 (IL7R) in the T-B interaction phase, and rs1007888 (MIF) in the B cell survival phase, were significantly associated with the maintenance of high titers of anti-SARS-CoV-2 spike IgG (Table 4).
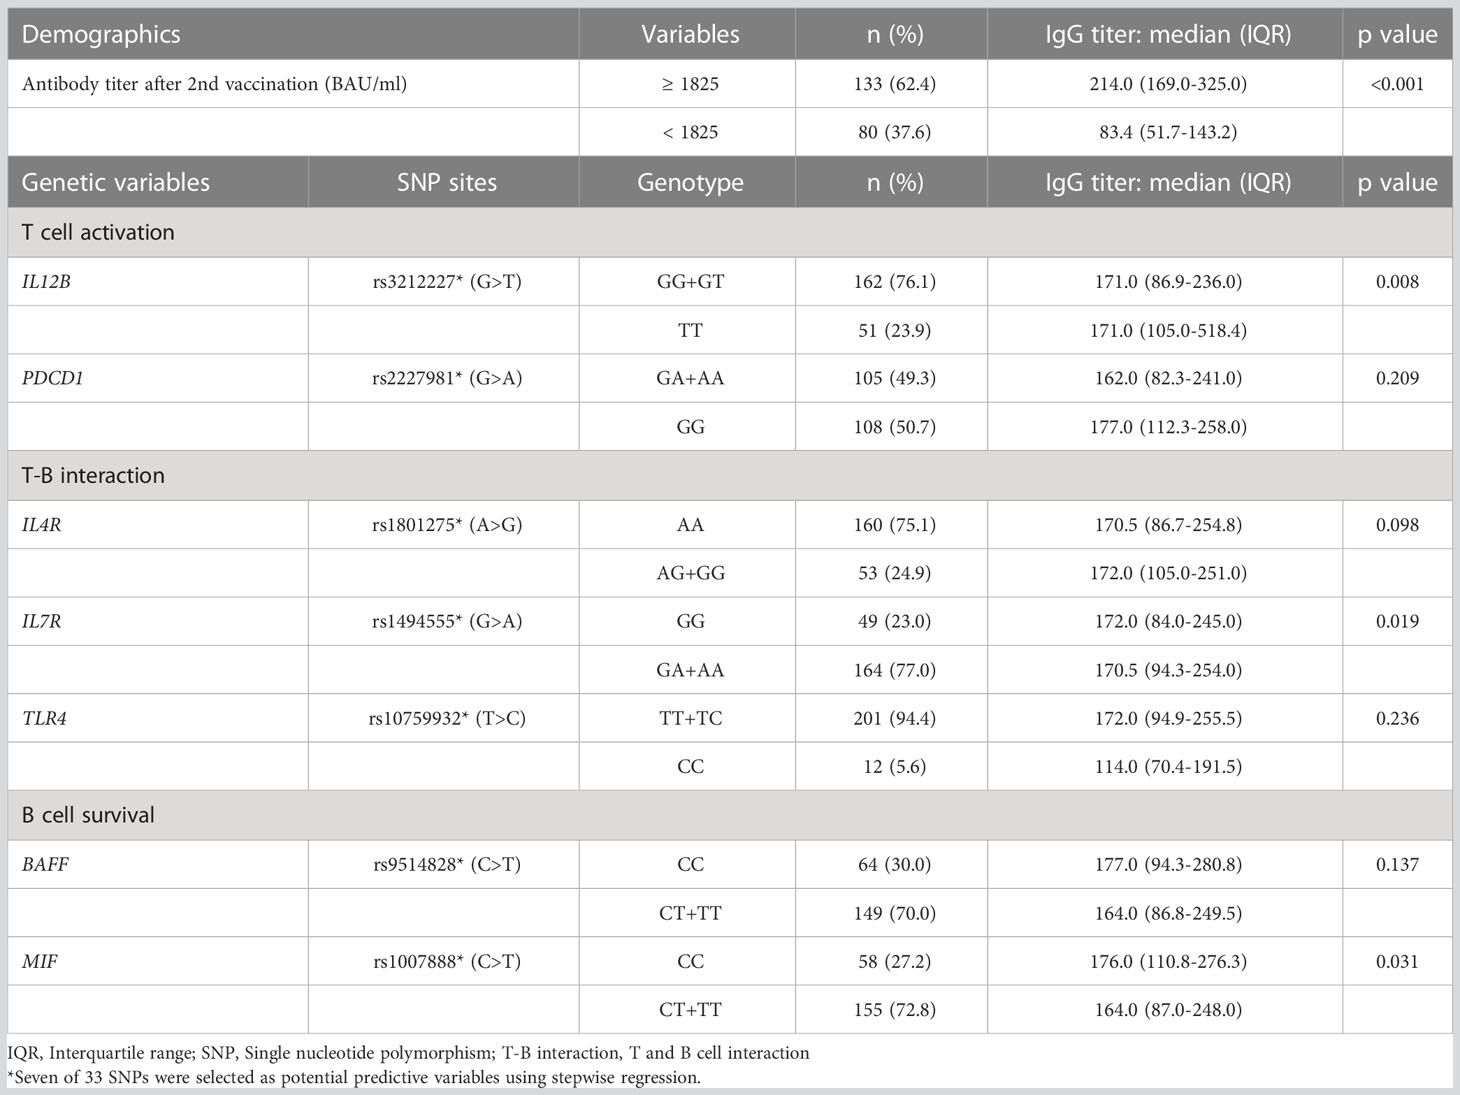
Table 4 Demographic and genetic variables associated with higher antibody titer in a long-term maintenance phase.
One of the current topics in COVID-19 prevention is the breakthrough infection after vaccination. It has been reported that the neutralizing potency, which is proportional to anti-SARS-CoV-2 spike receptor-binding domain IgG levels, is key to preventing COVID-19 infection (53, 54). We evaluated predictive factors for the individuals whose anti-SARS-CoV-2 spike IgG titer dropped below the negative threshold (details in Material and method) and found that rs12583006 (BAFF) was exclusively identified as a genetic risk factor for rapid attenuation of anti-SARS-CoV-2 IgG (aOR 0.23, 95%CI 0.07-0.80) (Table 5). We proposed a predictive model to identify individuals with rapid anti-SARS-CoV-2 IgG attenuation using ROC curve analysis with or without antibody titer information (AUC=0.86, and 0.76, respectively, Figures 3A, B). Although the prediction model with anti-SARS-CoV-2 IgG titer information was more accurate, the model consisting of the gene profile alone without antibody titer remained informative. The model equation was as follows; predicted score (P)=1/(1+e-x) x=-1.16 + 0.50×(sex: 1 if male, -1 if female)+ 0.42×(age: 1 if 60 years, -1 if under 60 years)+ 0.38×(NLRP3 rs4612666: -1 if T carrier, 1 if CC)+ 0.91×(NLRP3 rs10925027: -1 if CC, 1 if T carrier)+ 0.40×(IL12B rs6887695: -1 if G carrier, 1 if CC)+ 0.47×(STAT4 rs7572482: -1 if A carrier, 1 if GG)+ 0.51×(IL4R rs1805010: -1 if A carrier, 1 if GG)+ 0.40×(IL7R rs1494555: -1 if A carrier, 1 if GG)+ 0.50×(BAFF rs12583006: -1 if T carrier, 1 if AA), (AUC=0.76, Figure 3B).
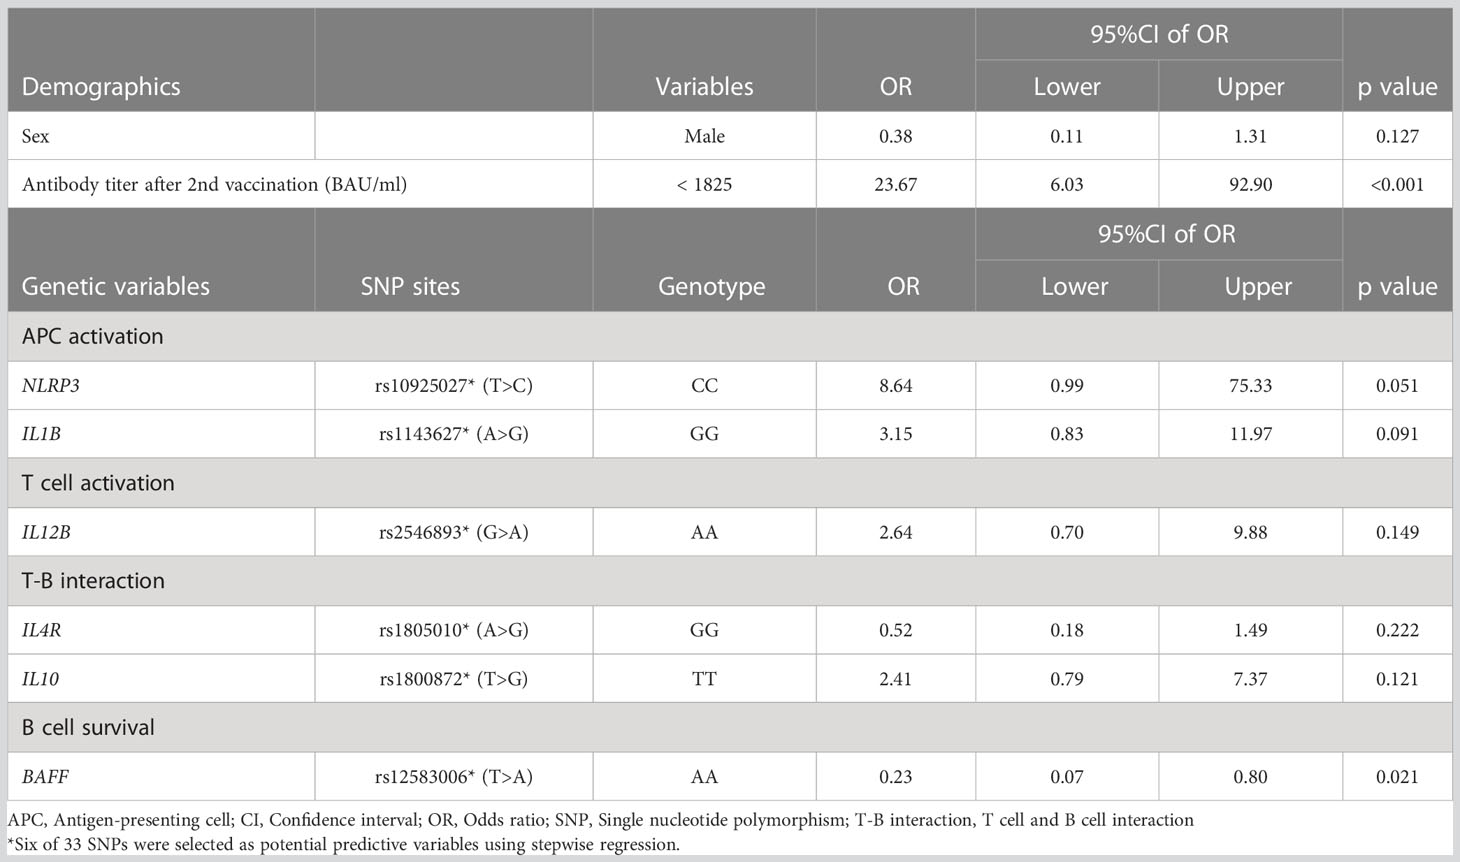
Table 5 Demographic and genetic variables associated with rapid neutralizing antibody attenuation.
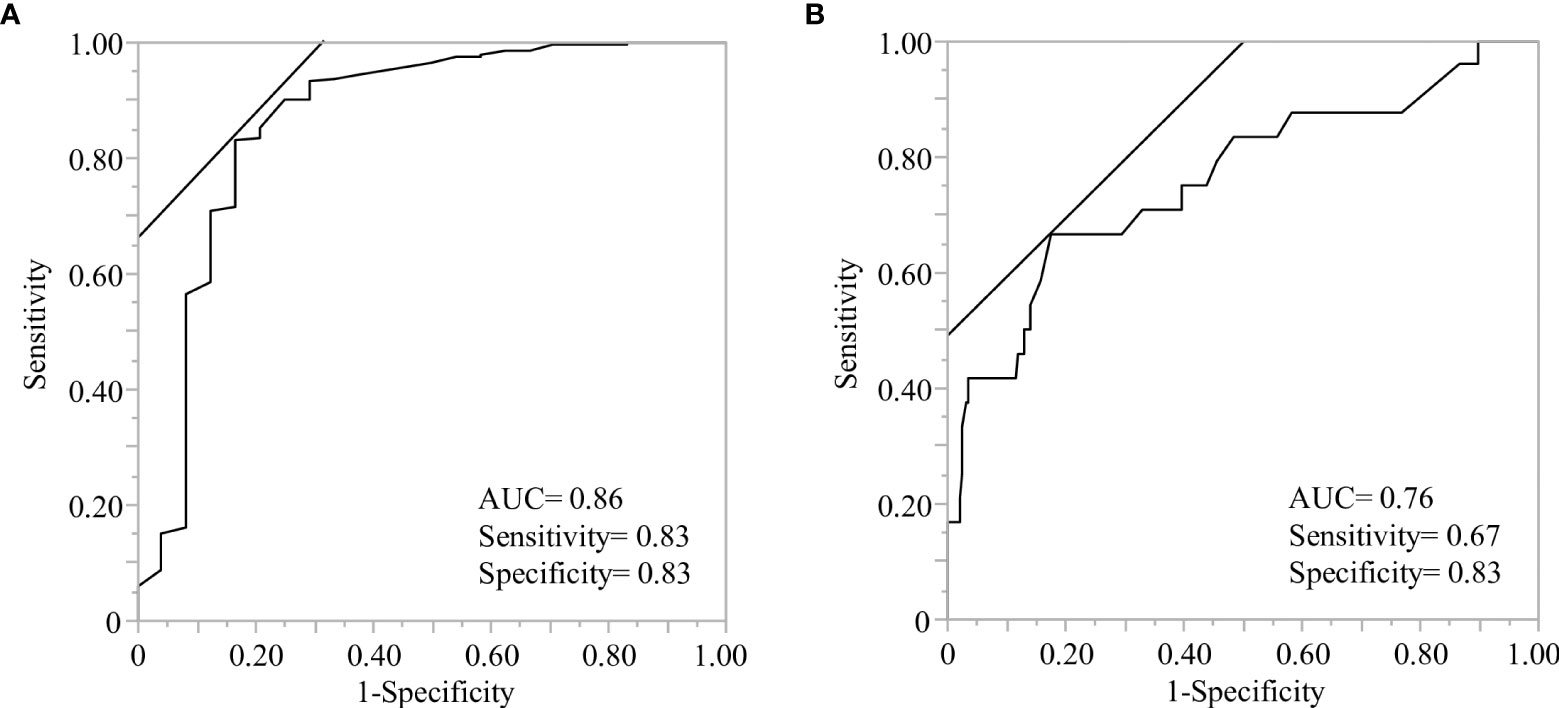
Figure 3 Receiver operating characteristic (ROC) analysis of predictive models to identify the individuals with rapid antibody attenuation. ROC curve analysis was performed using the indicated genetic factors with or without antibody titers, after the second vaccination. (A) The model consisted of the indicated genetic factors and antibody titers after the second vaccination. The demographics and six genes indicated gender(male), antibody titer after the second vaccination less than 1825 BAU/ml, rs10925027 (NLRP3), rs1143627 (IL1B), rs2546893 (IL12B), rs1805010 (IL4R), rs1800872 (IL10), and rs12583006 (BAFF) (details are described in Table 5). (B) Model consisting of demographics and indicated genetic factors without antibody titer information. The demographics and seven genes indicated age less than 60 years, sex (male), rs4612666 and rs10925027 (NLRP3), rs6887695 (IL12B), rs7572482 (STAT4), rs1805010 (IL4R), rs1494555 (IL7R), and rs12583006 (BAFF).
4 Discussion
In this study, we investigated the effects of host genetic factors on the production and maintenance of specific antibodies after COVID-19 vaccination. Currently, the entire genome can be examined using comprehensive strategies such as genome-wide association studies (GWAS). Although the GWAS has the advantage of identifying novel variant-associated lesions and covering rare variants without any bias, it requires the large number of participants and amount of expense to carry out a study (18, 55). In a previous study, we employed a candidate gene approach to identify genetic factors associated with the severity of COVID-19 infection (28). Our study with a relatively small cohort successfully identified OAS1 (rs1311454) as a risk factor for severe infection, consistent with the results of a large GWAS (56). We applied this approach as an efficient way, to analyze the association between specific antibody production after COVID-19 vaccination and host immune-associated gene polymorphisms. This is the first report to investigate the impact of genetic polymorphisms for COVID-19 vaccine response in the candidate gene approach.
Based on a series of immune responses, we selected 15 molecules and 33 SNPs categorized as priming associated APC and T cell activation, B cell activation with T-B interaction, and B cell survival, which are key immunological steps in enhancing specific antibody production after antigen exposure (11, 57, 58). To understand the immune response as a multi-directional interacting network, genetic polymorphisms were analyzed using unbiased statistical methods such as stepwise regression. Genetic analyses have revealed gene profiles that reflect the immune response after vaccination to produce and maintain a specific antibody against the SARS-CoV-2 spike receptor-binding domain. Antigen exposure triggers a series of responses in which APCs present antigens to T cells and antigen presented T cells activate B cells by activating molecules and cytokines resulting in the generation of memory B cells in a germinal center reaction (T cell-dependent pathway) (59). Grifoni et al. recently reported the significance of T cell responses to SARS-CoV-2 in specific antibody production by showing that spike-specific CD4+ T cell responses correlated with the magnitude of specific IgG titers in recovered COVID-19 patients (60). Simultaneously, APCs promote B cell activation and differentiation, such as class-switching recombination, in a T cell-independent manner (61, 62). In line with these mechanistic steps of B cell activation, we observed that the initial response and boosting effect were significantly associated with gene profiles of APC activation, T cell activation, and T-B interactions. Although some B cells differentiate into plasma cells to establish long-term humoral immunity after activation, several reports have suggested that current COVID-19 vaccines do not induce the differentiation into long-lived plasma cells, since the kinetics of antibody titers show a decrease in the following several months without exception in immunologically normal individuals (7–9). Therefore, antibody maintenance after COVID-19 vaccination depend on B cell survival. The maturation and survival of memory B cells depend on B cell receptor signaling and several cytokines such as BAFF and MIF (63, 64). Our data showed that the tempo of IgG decline after the second vaccination varied among individuals, and B cell survival-related genes affected the attenuation difference along with T cell activation and T-B interaction related genes. Thus, the transition of the responsible gene profile from the initial/boosting effects to antibody maintenance reflect the phase transition of immune responses, supporting the validity of the candidate gene approach employed in this study.
Among the gene profiles demonstrated in this study, the SNPs of NLRP3 and IL12B were consistently defined as potential factors for specific antibody production and maintenance after COVID-19 vaccination. These molecules and the SNPs in the genes encoding them may be key elements for further investigations into efficient vaccine development. Emerging reports have suggested that the cellular immunity induced by the COVID-19 vaccine may play an important role in protection against COVID-19 (65). The impact of genetic profiles on cellular immunity will be of great interest in future studies.
OAS1, a gene polymorphism in rs1131454 reported as a risk factor for severe COVID-19 infection (28, 56), is induced by IFN-γ and directly suppresses viral replication through viral RNA degradation (66). A recent report showed that OAS1 gain-of-function variants cause exogenous RNA-independent immunodeficiency disease through RNase L-mediated RNA cleavage leading to transcriptomic alterations, translational arrest, dysfunction and apoptosis of monocytes, macrophages, and B-cells (67). Because the mRNA vaccine itself induces type I IFN expression through MDA5 signaling (68), we included rs1131454 (OAS1) as a target gene in this study. We found that homozygosity of the minor allele in rs1131454 (OAS1) was associated with a high response to antibody production after vaccination, consistent with the protective effect against B cell/APC dysfunction through cellular RNA -cleavage.
Finally, our predictive model based on genetic polymorphisms could be useful for predicting individual vaccine efficacy and building a strategy for personalized vaccination schedules (Figures 3A, B). A third COVID-19 vaccine dose was recommended based on the reduction in vaccine effectiveness over time. One report showed that the protective effectiveness calculated using the Cox hazard model decreased from 88% at 1 month after the second vaccination to 47% after 5–6 months (69). However, little information is available on the development of appropriate vaccination schedules for individuals. Although routine measurement of antibody titers could be useful for monitoring immune status and vaccine efficacy, repeated measurements with routine follow-ups are inefficient in identifying declining antibody titers. Genetic profiling with basic demographics provides information to distinguish the potential for an early decline in antibody titers. Predictive models composed solely of genetic polymorphisms can provide useful information in clinical practice (Figure 3B).
This study had several limitations. First, we cannot discard the potential selection bias, as the enrolled population was female -dominant and consisted of a single Japanese race. Second, the modest sample size may have limited the power of the study. We believe that an appropriate methodology, such as the candidate gene approach can reveal the valuable effects of gene polymorphisms even with a modest sample size. Further studies involving other cohorts are required to validate our findings.
5 Conclusions
We revealed that the kinetics of anti-SARS-CoV-2 IgG titers after COVID-19 vaccination were associated with a rationalized multi-phasic gene profile, rather than physical senescence. These gene profiles provide valuable information for further investigations of humoral immunity against COVID-19 and for building a strategy for personalized vaccine schedules.
Data availability statement
The original contributions presented in the study are included in the article/supplementary materials. Further inquiries can be directed to the corresponding authors.
Ethics statement
The studies involving human participants were reviewed and approved by The Ethics Committee for Human Genome Analysis at Hiroshima University (Hi-258). The participants provided their written informed consent to participate in this study.
Author contributions
YTak participated in acquisition, analysis and interpretation of data, and drafting of the manuscript. NT participated in study design, analysis and interpretation of data and drafting of the manuscript. HY participated in acquisition of data. YTan participated in critical revision of the manuscript for important intellectual contents. TT and AS participated in sample collection. JT participated in critical revision of the manuscript for important intellectual contents and obtaining fund. HO participated in study concept and design, interpretation of data, obtained funding, administrative and study supervision. All authors contributed to the article and approved the submitted version.
Funding
This research was supported by AMED under Grant Number JP20fk0108453 and JP21fk0108550.
Acknowledgments
The authors thank to Doskali Marlen, Akhmet Seidakhmetov, and Jinlian Piao for their help to process the samples.
Conflict of interest
The authors declare that the research was conducted in the absence of any commercial or financial relationships that could be construed as a potential conflict of interest.
Publisher’s note
All claims expressed in this article are solely those of the authors and do not necessarily represent those of their affiliated organizations, or those of the publisher, the editors and the reviewers. Any product that may be evaluated in this article, or claim that may be made by its manufacturer, is not guaranteed or endorsed by the publisher.
References
1. Johns Hopkins University. COVID-19 Dashboard by the Center for Systems Science and Engineering (CSSE) at Johns Hopkins University (2020). Available at: https://coronavirus.jhu.edu/map.html.
2. Cutler DM, Summers LH. The COVID-19 pandemic and the $16 trillion virus. JAMA (2020) 324:1495–6. doi: 10.1001/jama.2020.19759
3. Bok K, Sitar S, Graham BS, Mascola JR. Accelerated COVID-19 vaccine development: milestones, lessons, and prospects. Immunity (2021) 54:1636–51. doi: 10.1016/j.immuni.2021.07.017
4. Polack FP, Thomas SJ, Kitchin N, Absalon J, Gurtman A, Lockhart S, et al. Safety and efficacy of the BNT162b2 mRNA Covid-19 vaccine. N Engl J Med (2020) 383:2603–15. doi: 10.1056/NEJMoa2034577
5. Baden LR, El Sahly HM, Essink B, Kotloff K, Frey S, Novak R, et al. Efficacy and safety of the mRNA-1273 SARS-CoV-2 vaccine. N Engl J Med (2021) 384:403–16. doi: 10.1056/NEJMoa2035389
6. Falsey AR, Sobieszczyk ME, Hirsch I, Sproule S, Robb ML, Corey L, et al. Phase 3 safety and efficacy of AZD1222 (ChAdOx1 nCoV-19) Covid-19 vaccine. N Engl J Med (2021) 385:2348–60. doi: 10.1056/NEJMoa2105290
7. Keshavarz B, Richards NE, Workman LJ, Patel J, Muehling LM, Canderan G, et al. Trajectory of IgG to SARS-CoV-2 after vaccination with BNT162b2 or mRNA-1273 in an employee cohort and comparison with natural infection. Front Immunol (2022) 13:850987. doi: 10.3389/fimmu.2022.850987
8. Levin EG, Lustig Y, Cohen C, Fluss R, Indenbaum V, Amit S, et al. Waning immune humoral response to BNT162b2 Covid-19 vaccine over 6 months. N Engl J Med (2021) 385:e84. doi: 10.1056/NEJMoa2114583
9. Tré-Hardy M, Cupaiolo R, Wilmet A, Antoine-Moussiaux T, Della Vecchia A, Horeanga A, et al. Immunogenicity of mRNA-1273 COVID vaccine after 6 months surveillance in health care workers; a third dose is necessary. J Infect (2021) 83:559–64. doi: 10.1016/j.jinf.2021.08.031
10. Falahi S, Kenarkoohi A. Host factors and vaccine efficacy: implications for COVID-19 vaccines. J Med Virol (2022) 94:1330–5. doi: 10.1002/jmv.27485
11. Pardi N, Hogan MJ, Porter FW, Weissman D. mRNA vaccines - a new era in vaccinology. Nat Rev Drug Discovery (2018) 17:261–79. doi: 10.1038/nrd.2017.243
12. Yucesoy B, Johnson VJ, Fluharty K, Kashon ML, Slaven JE, Wilson NW, et al. Influence of cytokine gene variations on immunization to childhood vaccines. Vaccine (2009) 27:6991–7. doi: 10.1016/j.vaccine.2009.09.076
13. Yukimasa N, Sato S, Oboshi W, Watanabe T, Uzawa R. Influence of single nucleotide polymorphisms of cytokine genes on anti-HBs antibody production after hepatitis B vaccination in a Japanese young adult population. J Med Invest (2016) 63:256–61. doi: 10.2152/jmi.63.256
14. Roh EY, Song EY, Yoon JH, Oh S, Chang JY, Park H, et al. Effects of interleukin-4 and interleukin-12B gene polymorphisms on hepatitis B virus vaccination. Ann Hepatol (2017) 16:63–70. doi: 10.5604/16652681.1226816
15. Wang Y, Xu P, Zhu D, Zhang S, Bi Y, Hu Y, et al. Association of polymorphisms of cytokine and TLR-2 genes with long-term immunity to hepatitis B in children vaccinated early in life. Vaccine (2012) 30:5708–13. doi: 10.1016/j.vaccine.2012.07.010
16. Wiertsema SP, Baynam G, Khoo SK, Veenhoven RH, van Heerbeek N, Zhang G, et al. Impact of genetic variants in IL-4, IL-4 RA and IL-13 on the anti-pneumococcal antibody response. Vaccine (2007) 25:306–13. doi: 10.1016/j.vaccine.2006.07.024
17. Kennedy RB, Ovsyannikova IG, Haralambieva IH, O’Byrne MM, Jacobson RM, Pankratz VS, et al. Multigenic control of measles vaccine immunity mediated by polymorphisms in measles receptor, innate pathway, and cytokine genes. Vaccine (2012) 30:2159–67. doi: 10.1016/j.vaccine.2012.01.025
18. Amos W, Driscoll E, Hoffman JI. Candidate genes versus genome-wide associations: which are better for detecting genetic susceptibility to infectious disease? Proc Biol Sci (2011) 278:1183–8. doi: 10.1098/rspb.2010.1920
19. Nagashima S, Kitahara H, Sugiyama A, Okimoto M, Bunthen E, Serge O, et al. Quantitative Measurement of the SARS-CoV-2 IgG Antibody and Surrogate Neutralizing Antibody Responses among mRNA COVID-19 Vaccine-Inoculated Medical Staff in Designated Medical Institutions for Infectious Diseases. J J A Inf D (2022) 96:52–5. doi: 10.11150/kansenshogakuzasshi.96.52
20. Giada M. Establishment of the WHO International Standard and Reference Panel for anti-SARS-CoV-2 antibody. Emma MB, editor. WHO Expert Committee on Biological Standardization (2020).
21. Sherry ST, Ward MH, Kholodov M, Baker J, Phan L, Smigielski EM, et al. DbSNP: the NCBI database of genetic variation. Nucleic Acids Res (2001) 29:308–11. doi: 10.1093/nar/29.1.308
22. Sayers EW, Barrett T, Benson DA, Bolton E, Bryant SH, Canese K, et al. Database resources of the National Center for Biotechnology Information. Nucleic Acids Res (2010) 38:D5–16. doi: 10.1093/nar/gkaa892
23. Hitomi Y, Ebisawa M, Tomikawa M, Imai T, Komata T, Hirota T, et al. Associations of functional NLRP3 polymorphisms with susceptibility to food-induced anaphylaxis and aspirin-induced asthma. J Allergy Clin Immunol (2009) 124:779–85.e6. doi: 10.1016/j.jaci.2009.07.044
24. Granell M, Urbano-Ispizua A, Pons A, Aróstegui JI, Gel B, Navarro A, et al. Common variants in NLRP2 and NLRP3 genes are strong prognostic factors for the outcome of HLA-identical sibling allogeneic stem cell transplantation. Blood (2008) 112:4337–42. doi: 10.1182/blood-2007-12-129247
25. Dhiman N, Ovsyannikova IG, Vierkant RA, Pankratz VS, Jacobson RM, Poland GA. Associations between cytokine/cytokine receptor single nucleotide polymorphisms and humoral immunity to measles, mumps and rubella in a Somali population. Tissue Antigens (2008) 72:211–20. doi: 10.1111/j.1399-0039.2008.01097.x
26. Abelson AK, Delgado-Vega AM, Kozyrev SV, Sánchez E, Velázquez-Cruz R, Eriksson N, et al. STAT4 associates with systemic lupus erythematosus through two independent effects that correlate with gene expression and act additively with IRF5 to increase risk. Ann Rheum Dis (2009) 68:1746–53. doi: 10.1136/ard.2008.097642
27. Gregory SG, Schmidt S, Seth P, Oksenberg JR, Hart J, Prokop A, et al. Interleukin 7 receptor alpha chain (IL7R) shows allelic and functional association with multiple sclerosis. Nat Genet (2007) 39:1083–91. doi: 10.1038/ng2103
28. Tanimine N, Takei D, Tsukiyama N, Yoshinaka H, Takemoto Y, Tanaka Y, et al. Identification of aggravation-predicting gene polymorphisms in coronavirus disease 2019 patients using a candidate gene approach associated with multiple phase pathogenesis: A study in a Japanese city of 1 million people. Crit Care Explor (2021) 3:e0576. doi: 10.1097/CCE.0000000000000576
29. Hamano E, Hijikata M, Itoyama S, Quy T, Phi NC, Long HT, et al. Polymorphisms of interferon-inducible genes OAS-1 and MxA associated with SARS in the Vietnamese population. Biochem Biophys Res Commun (2005) 329:1234–9. doi: 10.1016/j.bbrc.2005.02.101
30. Chen J, Liang Z, Lu F, Fang X, Liu S, Zeng Y, et al. Toll-like receptors and cytokines/cytokine receptors polymorphisms associate with non-response to hepatitis B vaccine. Vaccine (2011) 29:706–11. doi: 10.1016/j.vaccine.2010.11.023
31. Glas J, Seiderer J, Wagner J, Olszak T, Fries C, Tillack C, et al. Analysis of IL12B gene variants in inflammatory bowel disease. PloS One (2012) 7:e34349. doi: 10.1371/journal.pone.0034349
32. Haralambieva IH, Ovsyannikova IG, Umlauf BJ, Vierkant RA, Shane Pankratz V, Jacobson RM, et al. Genetic polymorphisms in host antiviral genes: associations with humoral and cellular immunity to measles vaccine. Vaccine (2011) 29:8988–97. doi: 10.1016/j.vaccine.2011.09.043
33. Liu C, Jiang J, Gao L, Hu X, Wang F, Shen Y, et al. A promoter region polymorphism in PDCD-1 gene is associated with risk of rheumatoid arthritis in the Han Chinese population of Southeastern China. Int J Genomics (2014) 2014:247637. doi: 10.1155/2014/247637
34. Huyen PTM, Dung DTN, Weiß PJ, Hoan PQ, Giang DP, Uyen NT, et al. Circulating level of sPD-1 and PD-1 genetic variants are associated with hepatitis B infection and related liver disease progression. Int J Infect Dis (2022) 115:229–36. doi: 10.1016/j.ijid.2021.12.325
35. Xiao W, Zhang Q, Deng XZ, Jiang LF, Zhu DY, Pei JP, et al. Genetic variations of IL-28B and PD-1 are in association with the susceptibility and outcomes of HCV infection in Southeast China. Infect Genet Evol (2015) 32:89–96. doi: 10.1016/j.meegid.2015.02.022
36. Chistiakov DA, Savost’anov KV, Turakulov RI, Efremov IA, Demurov LM. Genetic analysis and functional evaluation of the C/T (–318) and A/G (–1661) polymorphisms of the CTLA-4 gene in patients affected with Graves’ disease. Clin Immunol (2006) 118:233–42. doi: 10.1016/j.clim.2005.09.017
37. Plenge RM, Padyukov L, Remmers EF, Purcell S, Lee AT, Karlson EW, et al. Replication of putative candidate-gene associations with rheumatoid arthritis in >4,000 samples from North America and Sweden: association of susceptibility with PTPN22, CTLA4, and PADI4. Am J Hum Genet (2005) 77:1044–60. doi: 10.1086/498651
38. Remmers EF, Plenge RM, Lee AT, Graham RR, Hom G, Behrens TW, et al. STAT4 and the risk of rheumatoid arthritis and systemic lupus erythematosus. N Engl J Med (2007) 357:977–86. doi: 10.1056/NEJMoa073003
39. Jiang DK, Sun J, Cao G, Liu Y, Lin D, Gao YZ, et al. Genetic variants in STAT4 and HLA-DQ genes confer risk of hepatitis B virus-related hepatocellular carcinoma. Nat Genet (2013) 45:72–5. doi: 10.1038/ng.2483
40. Svensson A, Tunbäck P, Nordström I, Shestakov A, Padyukov L, Eriksson K. STAT4 regulates antiviral gamma interferon responses and recurrent disease during herpes simplex virus 2 infection. J Virol (2012) 86:9409–15. doi: 10.1128/JVI.00947-12
41. Shamim Z, Ryder LP, Christensen IJ, Toubert A, Norden J, Collin M, et al. Prognostic significance of interleukin-7 receptor-α gene polymorphisms in allogeneic stem-cell transplantation: a confirmatory study. Transplantation (2011) 91:731–6. doi: 10.1097/TP.0b013e31820f08b2
42. Edwards-Smith CJ, Jonsson JR, Purdie DM, Bansal A, Shorthouse C, Powell EE. Interleukin-10 promoter polymorphism predicts initial response of chronic hepatitis C to interferon alfa. Hepatology (1999) 30:526–30. doi: 10.1002/hep.510300207
43. Lin YJ, Lan YC, Wan L, Lin TH, Chen DY, Tsai CH, et al. Serological surveillance and IL-10 genetic variants on anti-HBs titers: hepatitis B vaccination 20 years after neonatal immunization in Taiwan. Clin Chim Acta (2011) 412:766–73. doi: 10.1016/j.cca.2011.01.006
44. Hwang YH, Ro H, Choi I, Kim H, Oh KH, Hwang JI, et al. Impact of polymorphisms of TLR4/CD14 and TLR3 on acute rejection in kidney transplantation. Transplantation (2009) 88:699–705. doi: 10.1097/TP.0b013e3181b2f34a
45. Zhang Q, Qian FH, Zhou LF, Wei GZ, Jin GF, Bai JL, et al. Polymorphisms in toll-like receptor 4 gene are associated with asthma severity but not susceptibility in a Chinese Han population. J Investig Allergol Clin Immunol (2011) 21:370–7.
46. Han Q, Yang C, Li N, Li F, Sang J, Lv Y, et al. Association of genetic variation in B-cell activating factor with chronic hepatitis B virus infection. Immunol Lett (2017) 188:53–8. doi: 10.1016/j.imlet.2017.06.005
47. Novak AJ, Grote DM, Ziesmer SC, Kline MP, Manske MK, Slager S, et al. Elevated serum B-lymphocyte stimulator levels in patients with familial lymphoproliferative disorders. J Clin Oncol (2006) 24:983–7. doi: 10.1200/JCO.2005.02.7938
48. Novak AJ, Slager SL, Fredericksen ZS, Wang AH, Manske MM, Ziesmer S, et al. Genetic variation in B-cell-activating factor is associated with an increased risk of developing B-cell non-Hodgkin lymphoma. Cancer Res (2009) 69:4217–24. doi: 10.1158/0008-5472.CAN-08-4915
49. Theodorou E, Nezos A, Antypa E, Ioakeimidis D, Koutsilieris M, Tektonidou M, et al. B-cell activating factor and related genetic variants in lupus related atherosclerosis. J Autoimmun (2018) 92:87–92. doi: 10.1016/j.jaut.2018.05.002
50. Donn R, Alourfi Z, De Benedetti F, Meazza C, Zeggini E, Lunt M, et al. Mutation screening of the macrophage migration inhibitory factor gene: positive association of a functional polymorphism of macrophage migration inhibitory factor with juvenile idiopathic arthritis. Arthritis Rheum (2002) 46:2402–9. doi: 10.1002/art.10492
51. Herder C, Klopp N, Baumert J, Müller M, Khuseyinova N, Meisinger C, et al. Effect of macrophage migration inhibitory factor (MIF) gene variants and MIF serum concentrations on the risk of type 2 diabetes: results from the Monica/KORA Augsburg Case-Cohort Study, 1984–2002. Diabetologia (2008) 51:276–84. doi: 10.1007/s00125-007-0800-3
52. Tan CW, Chia WN, Qin X, Liu P, Chen MI, Tiu C, et al. A SARS-CoV-2 surrogate virus neutralization test based on antibody-mediated blockage of ACE2-spike protein-protein interaction. Nat Biotechnol (2020) 38:1073–8. doi: 10.1038/s41587-020-0631-z
53. Maeda K, Amano M, Uemura Y, Tsuchiya K, Matsushima T, Noda K, et al. Correlates of neutralizing/SARS-CoV-2-S1-binding antibody response with adverse effects and immune kinetics in BNT162b2-vaccinated individuals. Sci Rep (2021) 11:22848. doi: 10.1038/s41598-021-01930-y
54. Garcia-Beltran WF, Lam EC, Astudillo MG, Yang D, Miller TE, Feldman J, et al. COVID-19-neutralizing antibodies predict disease severity and survival. Cell (2021) 184:476–488.e11. doi: 10.1016/j.cell.2020.12.015
55. Tam V, Patel N, Turcotte M, Bossé Y, Paré G, Meyre D. Benefits and limitations of genome-wide association studies. Nat Rev Genet (2019) 20:467–84. doi: 10.1038/s41576-019-0127-1
56. Banday AR, Stanifer ML, Florez-Vargas O, Onabajo OO, Papenberg BW, Zahoor MA, et al. Genetic regulation of OAS1 nonsense-mediated decay underlies association with COVID-19 hospitalization in patients of European and African ancestries. Nat Genet (2022) 54:1103–16. doi: 10.1038/s41588-022-01113-z
57. Sewell HF, Agius RM, Stewart M, Kendrick D. Cellular immune responses to Covid-19. BMJ (2020) 370:m3018. doi: 10.1136/bmj.m3018
58. Pardi N, Hogan MJ, Naradikian MS, Parkhouse K, Cain DW, Jones L, et al. Nucleoside-modified mRNA vaccines induce potent T follicular helper and germinal center B cell responses. J Exp Med (2018) 215:1571–88. doi: 10.1084/jem.20171450
59. Kapsenberg ML. Dendritic-cell control of pathogen-driven T-cell polarization. Nat Rev Immunol (2003) 3:984–93. doi: 10.1038/nri1246
60. Grifoni A, Weiskopf D, Ramirez SI, Mateus J, Dan JM, Moderbacher CR, et al. Targets of T cell responses to SARS-CoV-2 coronavirus in humans with COVID-19 disease and unexposed individuals. Cell (2020) 181:1489–1501.e15. doi: 10.1016/j.cell.2020.05.015
61. Xu W, Banchereau J. The antigen presenting cells instruct plasma cell differentiation. Front Immunol (2014) 4:504. doi: 10.3389/fimmu.2013.00504
62. Fagarasan S, Honjo T. T-Independent immune response: new aspects of B cell biology. Science (2000) 290:89–92. doi: 10.1126/science.290.5489.89
63. Cohen S, Shachar I. Cytokines as regulators of proliferation and survival of healthy and malignant peripheral B cells. Cytokine (2012) 60:13–22. doi: 10.1016/j.cyto.2012.06.019
64. Smulski CR, Eibel H. BAFF and BAFF-receptor in B cell selection and survival. Front Immunol (2018) 9:2285. doi: 10.3389/fimmu.2018.02285
65. Turner JS, O’halloran JA, Kalaidina E, Kim W, Schmitz AJ, Zhou JQ, et al. SARS-CoV-2 mRNA vaccines induce persistent human germinal centre responses. Nature (2021) 596:109–13. doi: 10.1038/s41586-021-03738-2
66. Silverman RH. Viral encounters with 2′,5′-oligoadenylate synthetase and RNase L during the interferon antiviral response. J Virol (2007) 81:12720–9. doi: 10.1128/JVI.01471-07
67. Magg T, Okano T, Koenig LM, Boehmer DFR, Schwartz SL, Inoue K, et al. Heterozygous OAS1 gain-of-function variants cause an autoinflammatory immunodeficiency. Sci Immunol (2021) 6. doi: 10.1126/sciimmunol.abf9564
68. Li C, Lee A, Grigoryan L, Arunachalam PS, Scott MKD, Trisal M, et al. Mechanisms of innate and adaptive immunity to the Pfizer-BioNTech BNT162b2 vaccine. Nat Immunol (2022) 23:543–55. doi: 10.1038/s41590-022-01163-9
Keywords: candidate gene approach, gene polymorphism, COVID-19, vaccine, humoral immunity, specific antibody
Citation: Takemoto Y, Tanimine N, Yoshinaka H, Tanaka Y, Takafuta T, Sugiyama A, Tanaka J and Ohdan H (2023) Multi-phasic gene profiling using candidate gene approach predict the capacity of specific antibody production and maintenance following COVID-19 vaccination in Japanese population. Front. Immunol. 14:1217206. doi: 10.3389/fimmu.2023.1217206
Received: 05 May 2023; Accepted: 07 July 2023;
Published: 26 July 2023.
Edited by:
Yongjun Sui, National Institutes of Health (NIH), United StatesReviewed by:
Mithil Soni, Columbia University, United StatesRavi Kant Narayan, Dr. B. C. Roy Multispeciality Medical Research Center (under IIT Kharagpur), India
Copyright © 2023 Takemoto, Tanimine, Yoshinaka, Tanaka, Takafuta, Sugiyama, Tanaka and Ohdan. This is an open-access article distributed under the terms of the Creative Commons Attribution License (CC BY). The use, distribution or reproduction in other forums is permitted, provided the original author(s) and the copyright owner(s) are credited and that the original publication in this journal is cited, in accordance with accepted academic practice. No use, distribution or reproduction is permitted which does not comply with these terms.
*Correspondence: Naoki Tanimine, dGFuaW1pbmVAaGlyb3NoaW1hLXUuYWMuanA=; Hideki Ohdan, aG9oZGFuQGhpcm9zaGltYS11LmFjLmpw