 Louisa Röhl1
 Jana Wellhausen1Michael Berszin1Irene Krücken2
 Veit Zebralla1Markus Pirlich1
 Susanne Wiegand1
 Andreas Dietz1Theresa Wald1†
 Gunnar Wichmann1*†
- 1Department of Otorhinolaryngology, Head and Neck surgery, University Hospital Leipzig, Leipzig, Germany
- 2Institute of Pathology, University Hospital Leipzig, Leipzig, Germany
Background: Immune-checkpoint blockade (ICB) of programmed-death-1 (PD-1) with pembrolizumab or nivolumab is approved for treating recurrent/metastatic (R/M) head and neck squamous cell carcinoma (HNSCC). NadiHN and ADRISK are phase IIB trials investigating in locally advanced (LA) HNSCC having low or high risk of recurrence the potential benefits from adding nivolumab to post-operative radiotherapy or pembrolizumab to cisplatin-based radio-chemotherapy.
Methods: Along five randomized controlled ICB trials including NadiHN and ADRISK, blood samples were taken before and after starting ICB in n=25 patients. Concentrations of vascular endothelial growth factor A (VEGF), CCL2 (MCP-1), interleukin-6 (IL-6), IL-8, interferon-gamma (IFN-γ), and CXCL10 (IP-10) pre- and post-ICB in EDTA-anticoagulated plasma and serum were compared. We used receiver operating characteristic (ROC) curves to identify optimal cutoff for defining subgroups before analyzing overall survival (OS) applying Kaplan–Meier plots and multivariate Cox regression.
Results: We detected huge heterogeneity between cytokine patterns in pre-and post-ICB plasma and serum. We observed high correlation between concentrations of some cytokines. Despite absent systematic OS differences after ICB with pembrolizumab or nivolumab or between LA-HNSCC versus R/M HNSCC patients, we noticed improved outcome of patients having lower IFN-γ concentrations pre- and post-ICB and following ICB reduced concentrations of VEGF, IL-6, and IL-8 but not MCP-1. Contrarily, increases in IL-6, IL-8, and VEGF levels correlated with impaired outcome. Multivariate Cox regression revealed five independent OS predictors among cytokines; using natural logarithms of their hazard ratios to estimate an individual’s risk of dying, three cytokine-expression pattern (CEP)-risk groups with no death within mean (95% confidence interval) follow-up of 29.2 (22.1–36.2) months and median OS of 11.3 (8.8–13.8) and 2.9 (0.4-5.4) months were found.
Conclusion: Whereas individual pre- or post-ICB cytokine concentrations in serum or plasma alone failed to predict the survivor group, CEP-risk groups may support the identification of individual patients with long-lasting benefit from ICB.
Introduction
The tumor immune microenvironment (TIME) reflects ongoing immunological processes and is of central importance for either immune tolerance and proangiogenic growth support or suppression and elimination of neoplastic transformed cells. Tumors employ various mechanisms to escape immune surveillance and antigen-specific (adaptive) attack by tumor-infiltrating cytotoxic T cells (Tc) or natural killer (NK) cells belonging to the innate immune system. While NK cells respond to various NK cell receptors, Tc detect tumor-associated antigen (TAA)-derived peptides presented in proteins belonging to the major histocompatibility complex (MHC), the so-called human leukocyte antigen (HLA) proteins in man. Tc and NK responses, however, not only depend on ligand–receptor interaction of surface membrane receptors with surface–membrane receptors on tumor cells. In the TIME, interactions of Tc and antigen-presenting cells (APC) and Tc and NK cells with tumor cells are orchestrated by cytokines and other soluble factors. These soluble factors either stimulate or suppress particular signaling pathways. This contributes to either an effective anti-tumoral immune response eliminating the tumor or adaptive immune resistance (AIR), allowing for immune escape. One well-known AIR mechanism contributing to AIR is the response of tumors to an ongoing immune response through the induction of CD274 (PD-L1) expression through interferon-γ (IFN-γ) (1, 2). This is important, as increased PD-L1 expression allows PD-L1 binding to programmed-death-1 (PD-1) expressed on Tc and NK cells and consequently inhibits their anti-tumoral activity (3).
Pembrolizumab (Keytruda®, MK-3475, Merck Sharp & Dohme Corp, Whitehouse Station, USA) and nivolumab (Opdivo®, BMS-936558-01, Bristol-Myers Squibb Company, New York City, USA) are humanized monoclonal antibodies targeting the PD-1 protein and blocking the binding of PD-L1. They are currently under investigation in randomized controlled trials (RCTs) in head and neck squamous cell carcinoma (HNSCC) either alone or in combination with other chemotherapeutic drugs. Both immune checkpoint inhibitors have led to promising therapy regimens in the treatment of various malignancies including HNSCC (4). Following the results of the open-label, multicenter, phase IB trial KEYNOTE-012 and the randomized open-label, phase III study KEYNOTE-48, pembrolizumab received approval for the first-line treatment of recurrent and/or metastatic HNSCC (R/M HNSCC) (5–8). The ADRISK study, a multicenter randomized phase II study, is currently investigating if the addition of pembrolizumab to postoperative adjuvant radio-chemotherapy (aRCH) with cisplatin can improve the event-free survival (EFS) compared with aRCH alone in locally advanced intermediate and high-risk HNSCC (ClinicalTrials.gov NCT03480672). Nivolumab was approved for the treatment of R/M HNSCC after progress on standard-of-care platinum-based therapy following the multicenter randomized open-label phase III CheckMate-141 trial (9). The NadiHN trial, an open-label randomized phase II trial, investigating the response of intermediate-risk HNSCC patients after surgery to treatment with nivolumab plus radiotherapy versus radiotherapy alone stopped further accrual of patients (EudraCT No. 2016-004787-20).
Even though several studies confirm the efficacy of pembrolizumab and nivolumab in recurrent HNSCC, anti-PD-1 antibodies are not effective in every patient (10, 11). There is neither a definitive biomarker that allows sufficient patient selection nor one that allows distinction between a non-responder experiencing progress and a responder with prolonged overall survival (OS). Therefore, a definitive biomarker is needed to guide patient selection and to provide early on-treatment indicators of response, but none is available until now (12).
As stated above, PD-L1 overexpression can promote immune evasion and is found in over 55% of HNSCC (13, 14). This indicates that PD-L1 expression is a mechanism for cancer to escape immune-mediated destruction (15), and PD-L1 expression on tumor and/or immune cells is associated with a better response to anti-PD-1 therapy (10, 13, 16).
Taking the percentage of PD-L1 expression of tumor cells and immune cells into account, the tumor-positivity score (TPS) and immune score (IC) can be determined and a combined positive score (CPS) calculated to describe the PD-L1 status in HNSCC (14) that is linked to differences in response and survival of patients (8, 17, 18). This is reflected in the approval of pembrolizumab only for the treatment of R/M HNSCC with TPS ≥50% or CPS ≥1 (5–8). However, there are non-responders within CPS ≥ 1 and responders within CPS < 1 HNSCC patients (5–8, 17, 18). Therefore, other biomarkers that are not solely linked to IFN-γ signaling might be essential contributors to AIR.
Cytokines, chemokines, growth factors, and other soluble signaling proteins are produced not only by many immune cells but also endothelial and epithelial cells. They are pleiotropic stimulators or regulators of immune responses and have high biological activity (19, 20). Therefore, their concentration in body fluids, e.g., blood, in healthy individuals is mostly present at pg/ml concentrations (21). During the activation of a cytokine pathway associated with inflammation or disease progression, their concentration can increase up to 1,000-fold (22). The role of cytokines as potential biomarkers in cancer has been investigated by many studies (23–26) including our group (27, 28). Some cytokines are excessively produced by tumor cells (29), and consequently, varying cytokine concentrations seem to be valid predictors for disease progression and the effects of treatment (30, 31). Dysregulated expression of cytokines and chemokines and their receptors is a hallmark of many cancers, including HNSCC (32). However, the same is true for growth factors and their receptors, for instance the vascular endothelial growth factor A (VEGF) and others. We recently demonstrated and validated that pre-therapy VEGF plasma concentrations are an independent predictor of outcome in HNSCC (27). VEGF expression in HNSCC correlates with the expression of particular cytokines (28) ex vivo and in the TIME and contributes to malignant pathogenesis, and changes in pre- and post-treatment levels of these cytokines have been evaluated as markers for treatment outcome (33, 34). A decrease in plasma interleukin 6 (IL-6) levels correlated with improved PFS in NSCLC patients under anti-PD-1 therapy (35). Low serum levels of IL-6 and VEGF were associated with better clinical outcomes in HNSCC patients treated with cetuximab (26). Lower VEGF levels were also identified to be prognostic biomarkers in HNSCC patients among multiple cohorts (27, 36). Interleukin-8 (CXCL8, IL-8) is mainly produced by tumor cells themselves and via an autocrine loop, and paracrine signaling exerts pro-tumoral functions, so its serum concentration has been shown to correlate with tumor burden (37). IL-8 has been found to promote tumor growth, metastasis, chemo-resistance, and angiogenesis in different malignancies, including HNSCC (38–41). Serum levels of IL-8 were found to be consistently elevated in patients with recurrent or metastatic HNSCC (42).
To gain information about the predictive value of pre- and post-therapy cytokines in plasma and serum of HNSCC patients receiving ICB utilizing PD-1 antibodies for outcome, we set up a feasibility study and report about a signature linked to prolonged progression-free and OS.
Materials and methods
Study population and patient samples
The study was conducted according to the guidelines of the Declaration of Helsinki and approved by the Ethics Committee of the University Leipzig (vote NICEI-CIH 341-15-ff). Included in this study were patients with histopathologically confirmed HNSCC who received anti-PD-1 checkpoint inhibitor therapy between 2017 and 2022 at the university hospital of Leipzig in either curative or palliative settings. Subgroups of our cohort were participants of various studies including ADRISK (NCT03480672), NadiHN (EUDRA-CT 2016-004787-20), ELDORANDO (NCT03193931), CheckMate 651 (NCT02741570), and NIS-HANNA (NCT03114163).
Clinical data including TNM categories and staging according to criteria of Union for International Cancer Control (UICC) and information about the clinical course of patients were taken from the tumor database of the Otorhinolaryngology Department. Patient characteristics, such as their self-reported tobacco smoking history and status, and daily alcohol consumption and history, were collected at date of registration (Table 1).
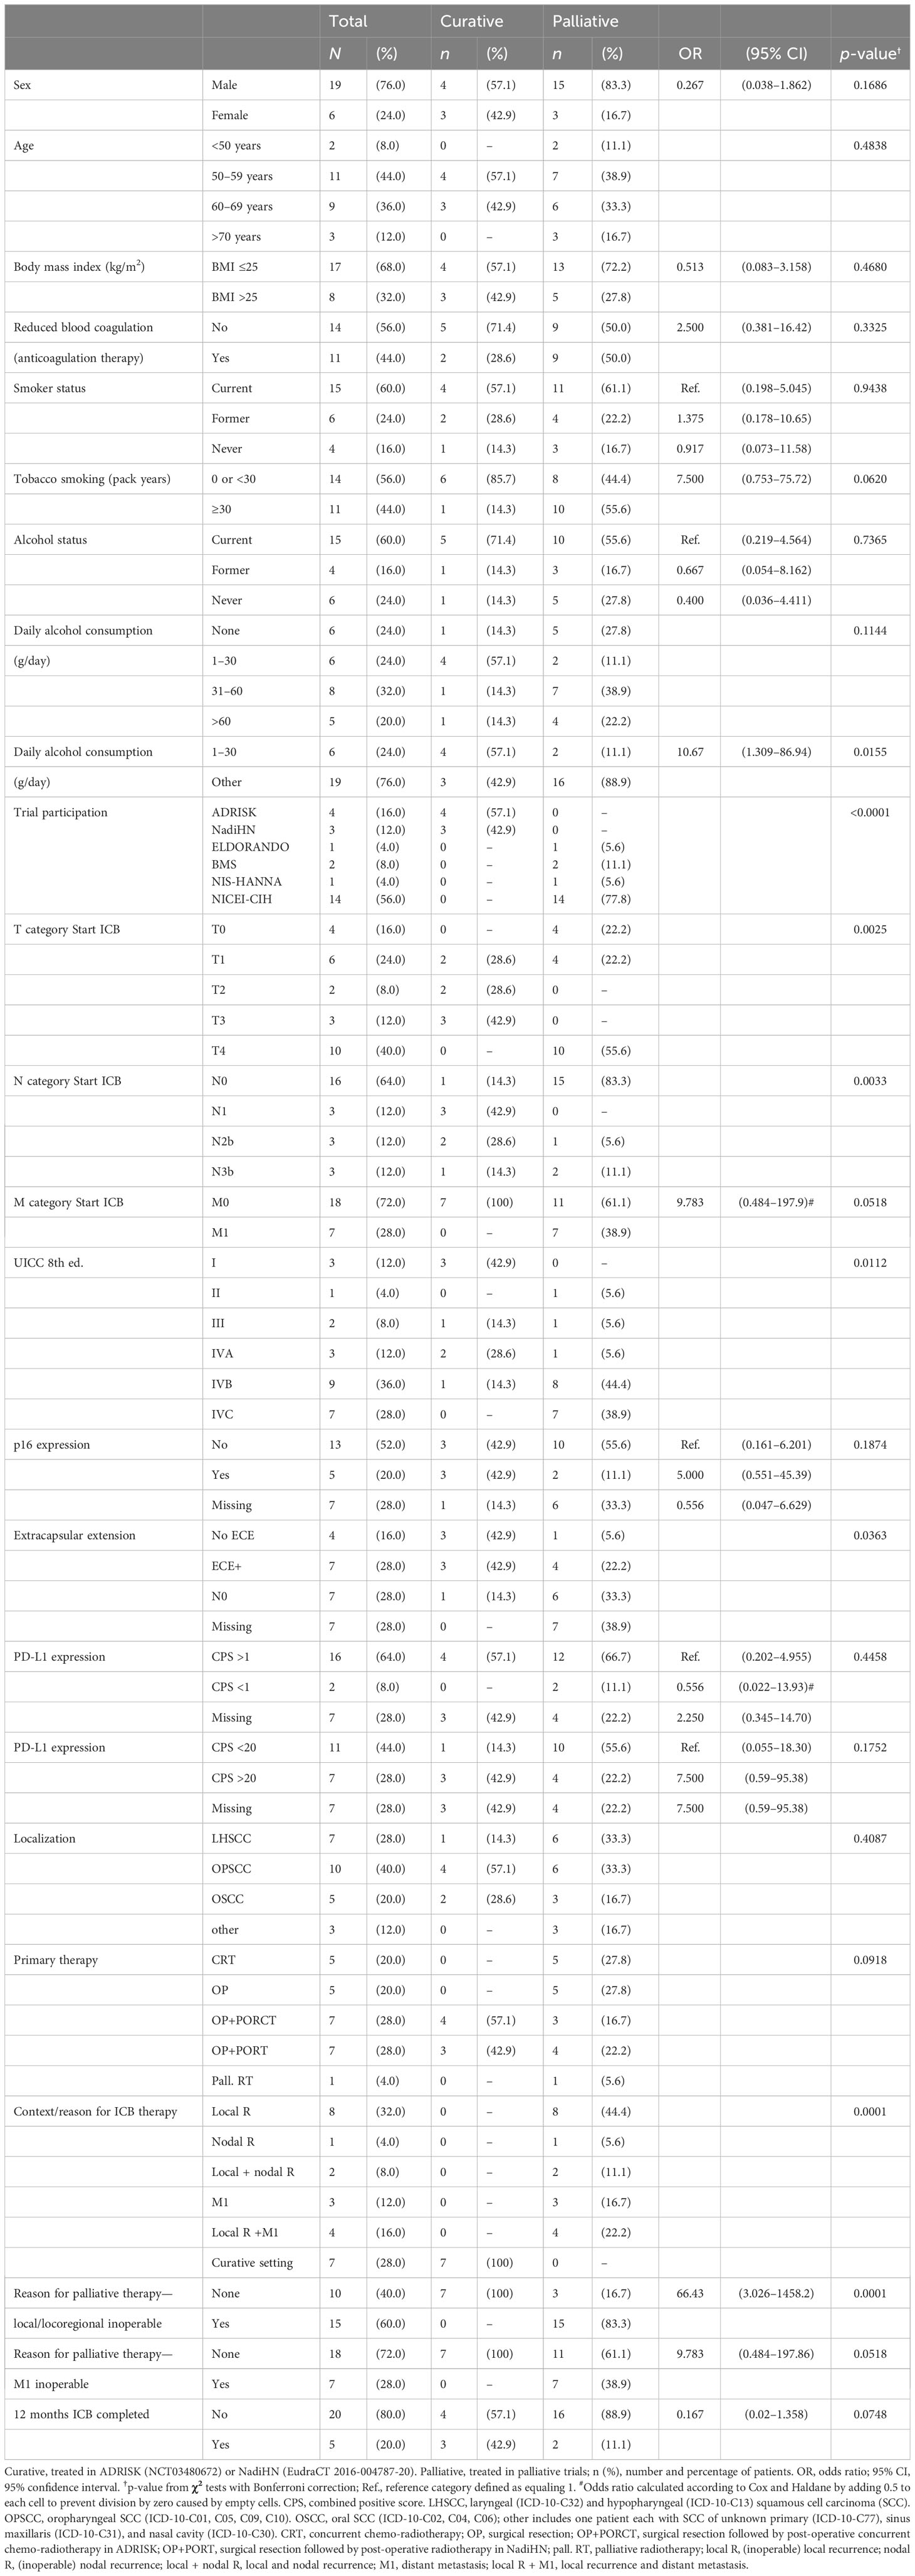
Table 1 Baseline characteristics of the study population comparing patients receiving anti-PD-1 ICB in the curative or palliative setting.
Materials
We used serum-gel and EDTA-plasma S-Monovettes® (Sarstedt, Nübrecht, Germany) to collect venous blood samples from patients according to standardized operating procedures. Approximately 60 min after blood draw, Monovettes were centrifuged for 10 min at 2,720 x g. Aliquoted serum and plasma samples were stored at −80°C until analysis.
To measure the cytokine concentrations in serum and plasma, we performed indirect Sandwich ELISAs. OptEIA™ Kits (BD Biosciences, Heidelberg, Germany) were utilized to quantify IL-6, IL-8, IP-10, MCP-1, and IFN-γ, and VEGF-EDK kits (#900-K10; Peprotech, Hamburg, Germany) were utilized to quantify VEGF according to the manufacturers’ instructions. Dulbecco’s phosphate-buffered saline (PBS) from Biochrom AG (Berlin, Germany) was used for coating the microtiter plates (Greiner Bio-One, Nürtingen, Germany) with 50 μl/well diluted capture antibody overnight at 4°C. PBS containing 0.025% Tween® 20 from Sigma-Aldrich (Darmstadt, Germany) was used for washing. After a 30-min blocking step with PBS containing 5% heat-inactivated fetal calf serum (FCS; Thermo-Fisher Scientific, Waltham, MA, USA), 50 μl of sample (plasma or serum) and a serial dilution of the appropriate standard for calibration were incubated for 120 min, followed by washing and adding 50 μl/well biotinylated antibodies. After three further washing steps, streptavidin-horseradish peroxidase conjugate (HRP) was added to the wells and incubated for 60 min followed by six washing steps. Then tetramethyl benzidine 1-StepTM Ultra (Pierce via Thermo-Fisher Scientific, Waltham, MA, USA) was added as the substrate. TMB 1-Step™ Ultra conversion by HRP was stopped by adding the same volume of 1 M sulfuric acid. After measuring optical densities at λ1 = 450 nm and λ2 = 620 nm on the Synergy2™ multi-mode microplate reader (BioTek Instruments, Inc., Winooski, VT, USA), we calculated the calibration curves using Gen5™ software (BioTek Instruments, Inc., Winooski, VT, USA). We converted optical densities to pg/ml concentrations using four-parameter calibration curves. The lower limit of detection and the lower limit of quantification were calculated as described and were always ≤ 4 pg/ml for all cytokines.
To obtain a unique measure, mean values of at least one pre-therapy sample and mean of at least two measurements from samples taken at a minimum of 2 weeks after first cycle ICB were used. We compared cytokine concentrations in serum or plasma according to various reference points with or without normalization to estimate changes in cytokine levels related to ICB. We used the derived values of the individual patient to identify in receiver-operating characteristic (ROC) curves the optimum cut-off values (maximum Youden index) for binary classification patients to assess their impact on OS.
Statistical analysis
Patient characteristics and follow-up data were analyzed in relation to the results from ELISA measurements and categorization according to ROC curves as described above. We also analyzed clinical characteristics of patients, and lifestyle-associated risk factors (daily alcohol consumption categorized in 0, 1–30 g, 31–60 g, and >60 g) and status (never, former, and current), tobacco smoking (total number of pack years smoked during lifetime), and smoking status (never, former, and current). Clinical characteristics of patients included age; sex; T, N, and M categories; HPV status (according to p16 immune histochemistry); and treatment modalities (curative vs. palliative setting; ICB with vs. without chemotherapy; pembrolizumab vs. nivolumab). Associations between categorical variables were examined by Pearson’s chi-square test. We calculated overall survival (OS) time from date of first cycle ICB to date of death (event) or end of follow-up (censored) and tumor-specific survival (TSS) time from date of first cycle ICB to date of cancer-related death (event) censoring other causes of death or end of follow-up.
We analyzed survival using the Kaplan–Meier method (43) applying log-rank tests (44) and hazard ratios (HR) using Cox proportional hazard models (45) utilizing the conditional logistic regression forward method, and bootstrapping (46) (SPSS version 27, IBM Corporation, Armonk, New York). We considered two-sided p <0.05 as significant.
Results
Of the 45 patients registered in RCT utilizing anti-PD-1 ICB, 25 patients were randomized to receive per protocol doses according to the respective study protocol. The characteristics of patients are shown in Table 1.
The outcome of patients in the curative setting was superior as shown in Figure 1 (right panel, swimmer plots).
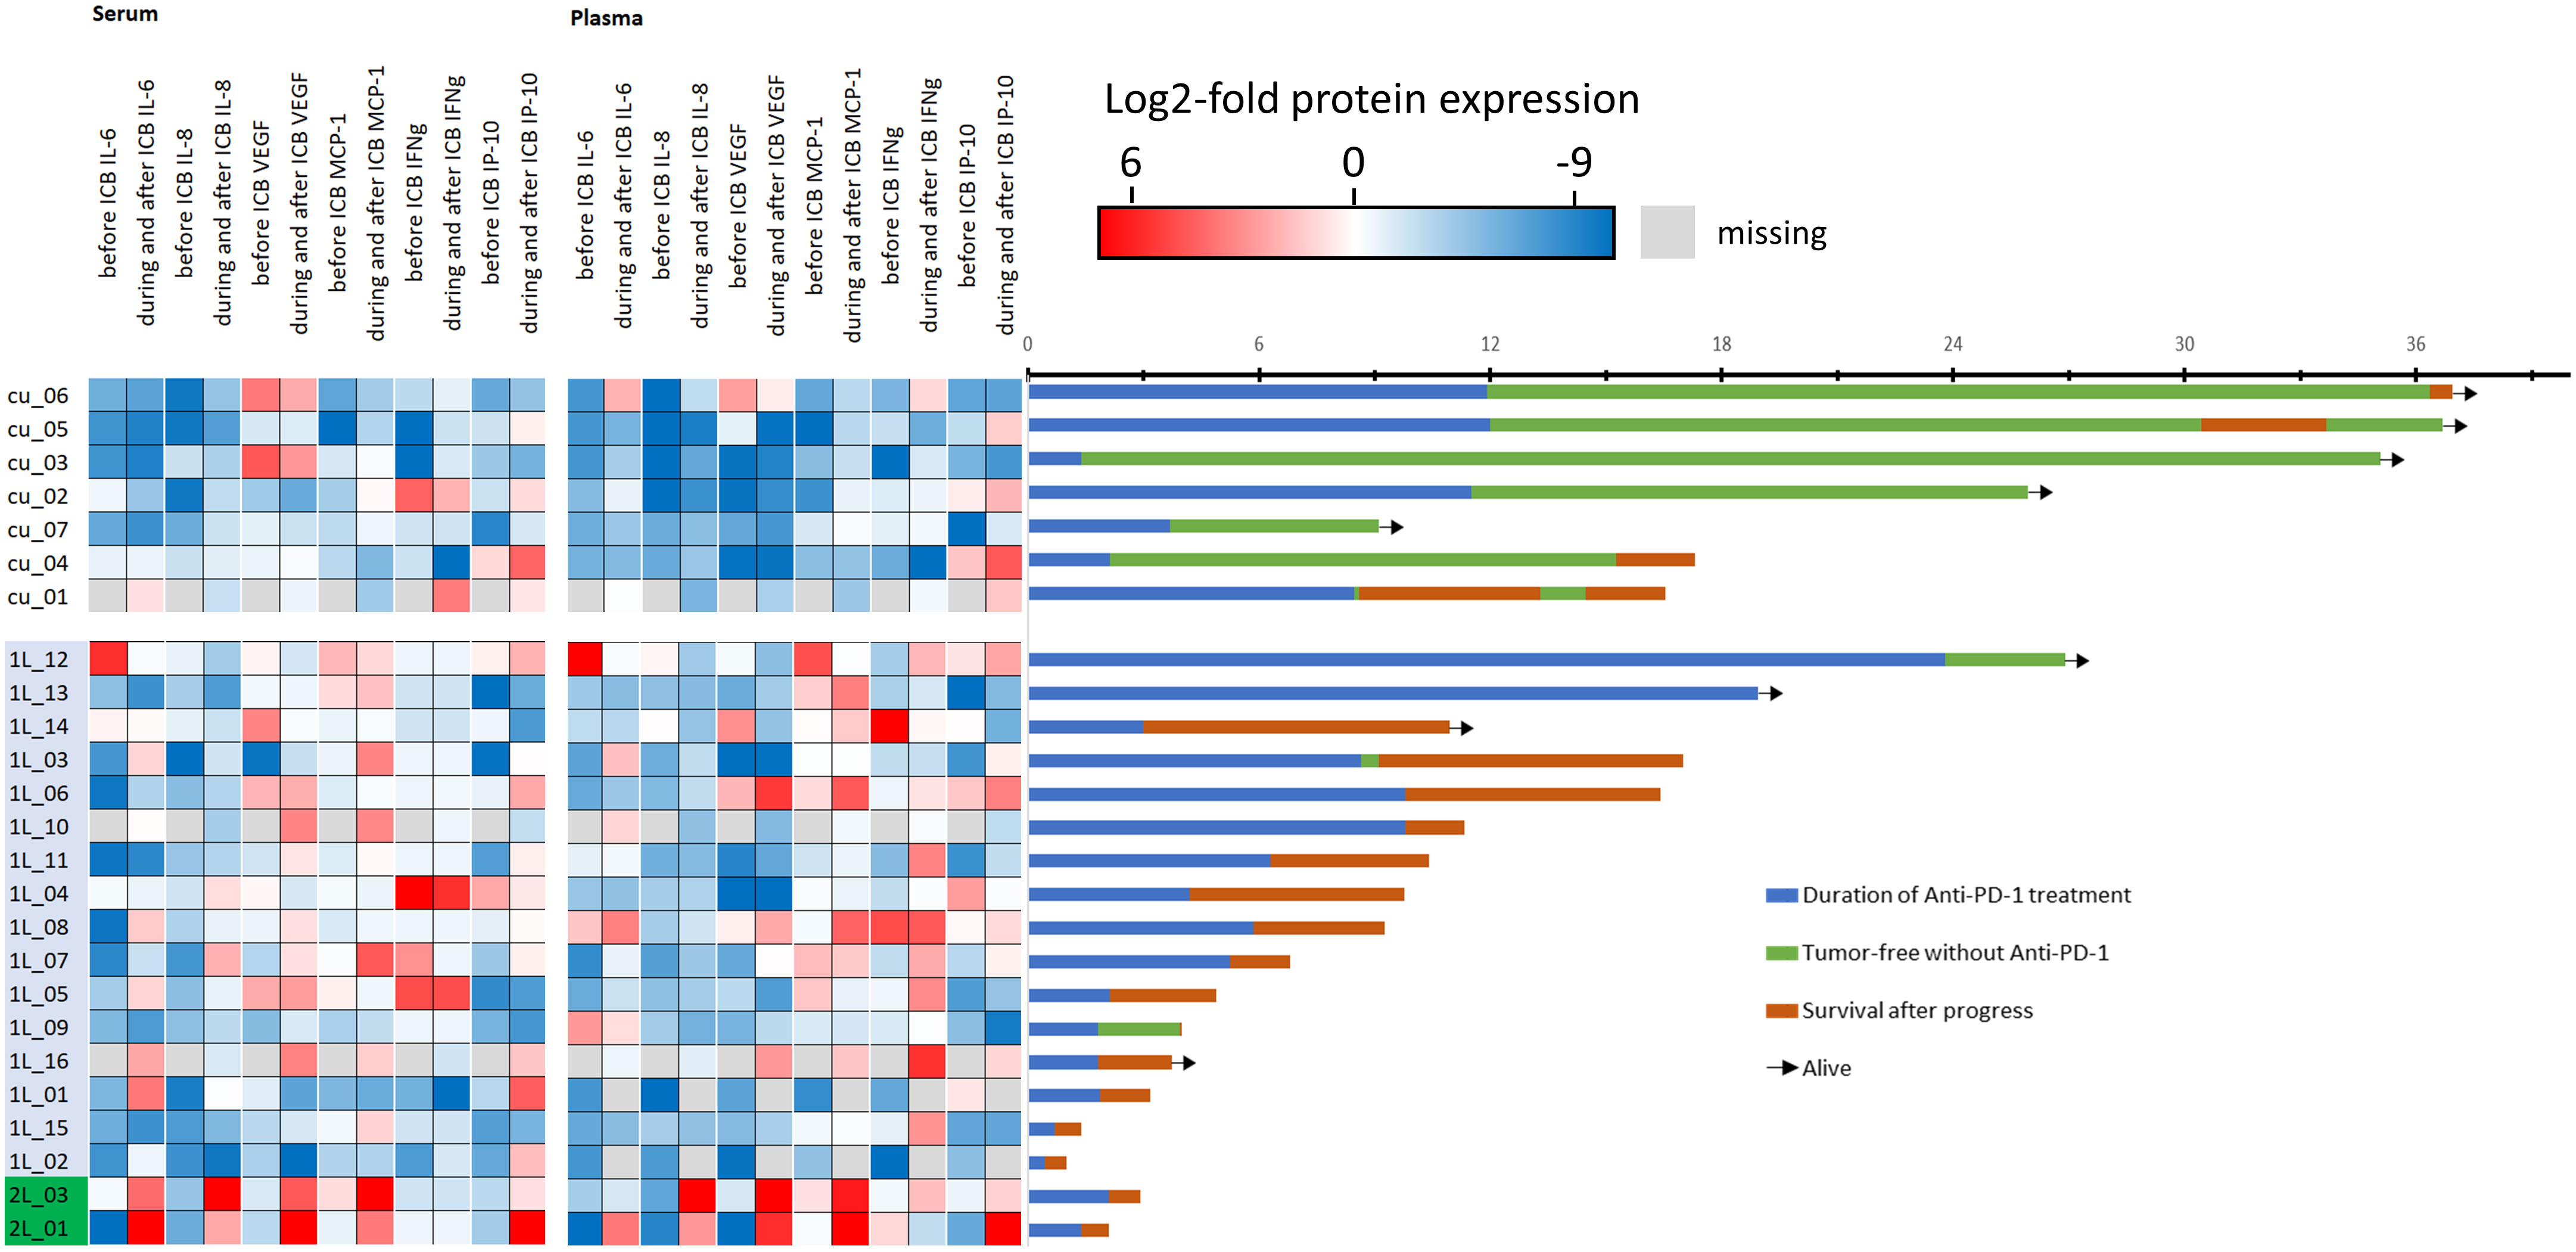
Figure 1 Heatmap showing each patient’s cytokine expression level after normalization to mean of all 50 values for the particular cytokine pre- (before) and post-ICB (during/after start of ICB). Blue denotes low, red denotes high level of the particular cytokine (please note log2 scaling) and swimmer plots showing the individual course of 25 patients. The first seven patients (cu_01 to cu_07) are treated in the curative setting, whereas 1L denotes 16 patients in the first-line and 2L denotes two patients treated in the second line setting. The timeline of the swimmer plots is from the start of immune-checkpoint blockade (ICB) utilizing anti-PD-1 antibodies with the day of first cycle, the duration of treatment until progressing disease (PD), side effects including immune-related adverse events, or end per protocol, followed by either disease-free survival or survival after PD until end of follow-up. Arrows indicate patients alive.
However, some R/M HNSCC patients also had good outcome and were alive at end of follow-up. A total of 54 pre- and 101 post-ICB serum and 54 pre- and 94 post-ICB plasma samples were available for measurement. The mean concentration of all cytokines with the respective confidence interval is shown in Table 2.
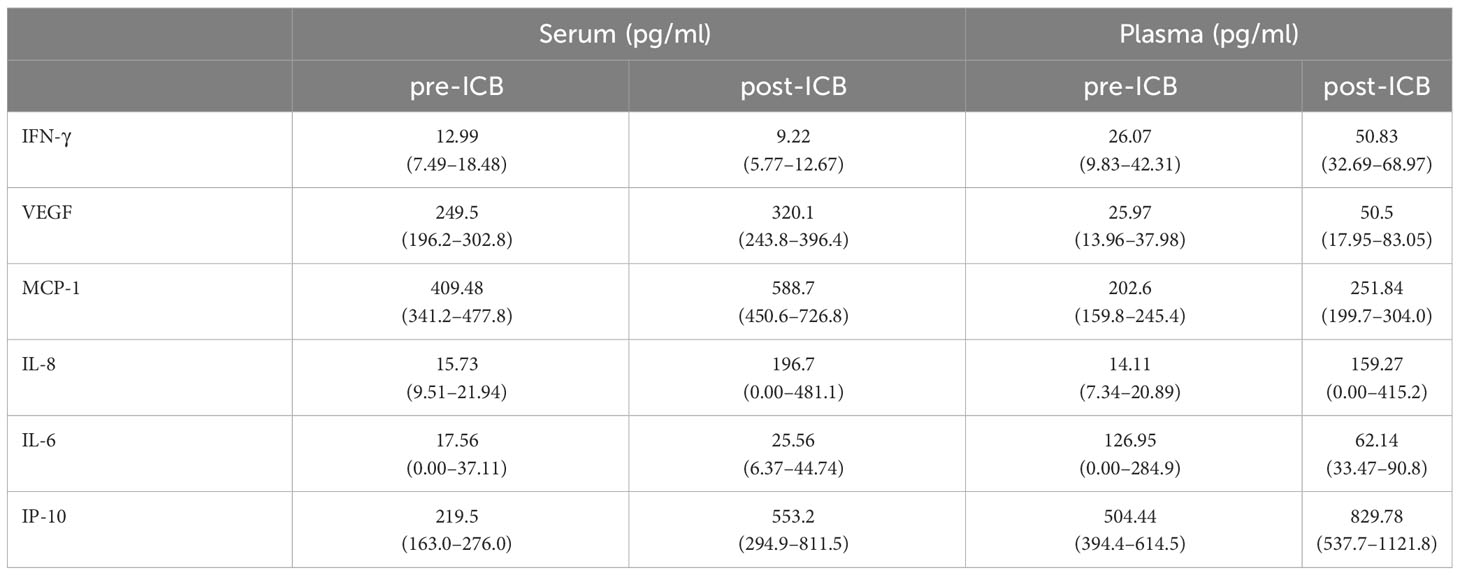
Table 2 Mean and (in brackets) 95% CI of concentrations of cytokines indicated in serum and plasma of 25 HNSCC patients before (pre-ICB) and after start of immune-checkpoint inhibitor therapy (post-ICB).
As shown in Table 2, the concentration in serum and plasma differed significantly in post-ICB IFN-γ, pre- and post-ICB VEGF, pre- and post-ICB MCP-1, and post-ICB IL-6 and pre-ICB IP-10. The pre- and post-ICB serum concentration differed significantly for MCP-1, and the pre- and post-ICB plasma concentration differed significantly for IP-10. The corresponding p-values for patients–individual comparisons according to the t-test for paired samples are shown in Table 3.

Table 3 p-values from two-sided paired t-tests comparing concentrations in EDTA-anticoagulated blood and serum of HNSCC patients before (pre-ICB) and after start of immune-checkpoint inhibitor therapy (post-ICB) for cytokines indicated.
As we noticed different ICB-related changes, in particular cytokine levels (Figure 1, left panel), we used ROC analyses to define optimum cutoff values for the particular cytokine and sample type according to OS. The results are shown in Table 4.
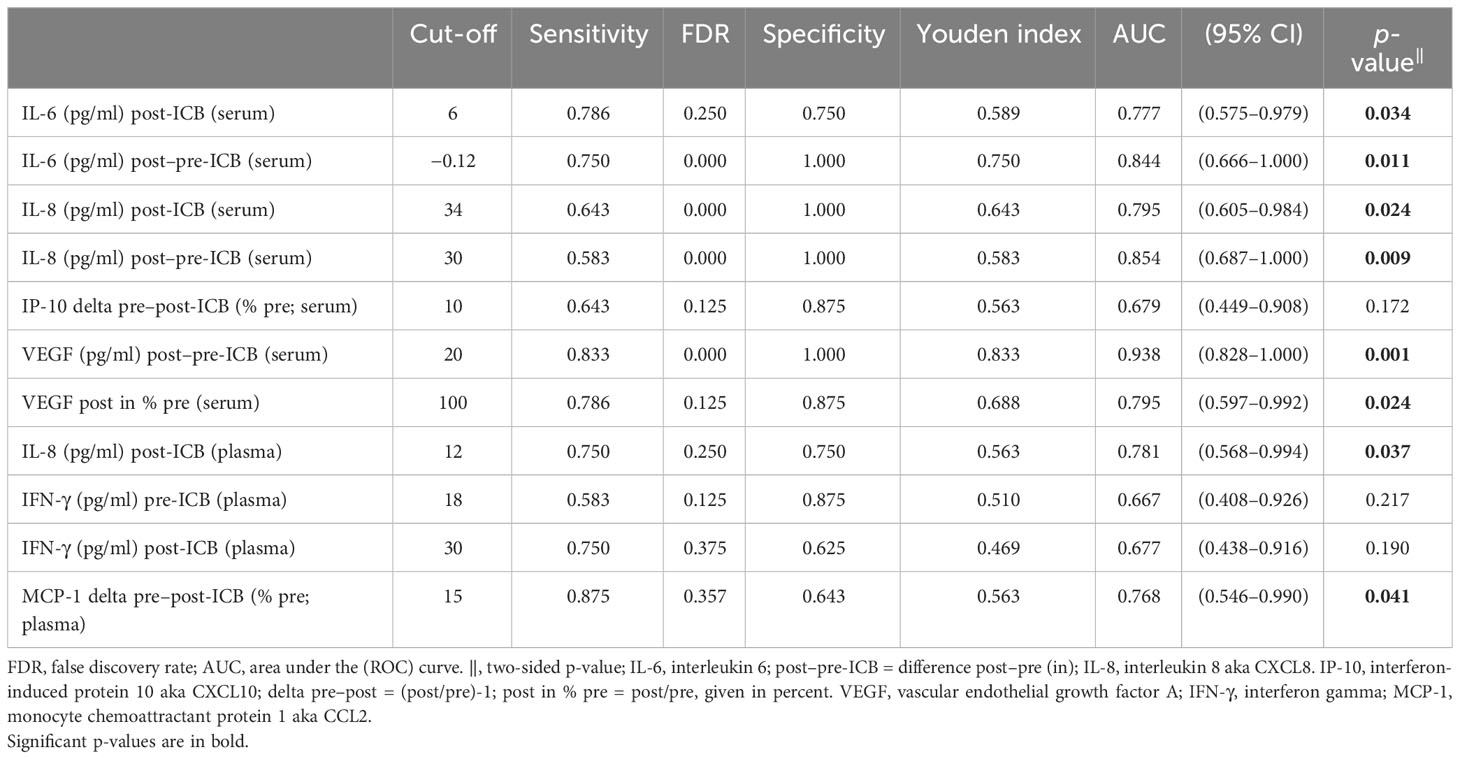
Table 4 Results of receiver operating characteristic (ROC) analyses of various measures of cytokines in serum or plasma of HNSCC undergoing PD-1 ICB and overall survival.
Using the cutoffs for binary split of the cohort, we used Kaplan–Meier cumulative survival plots to identify significant differences in OS (Figure 2).
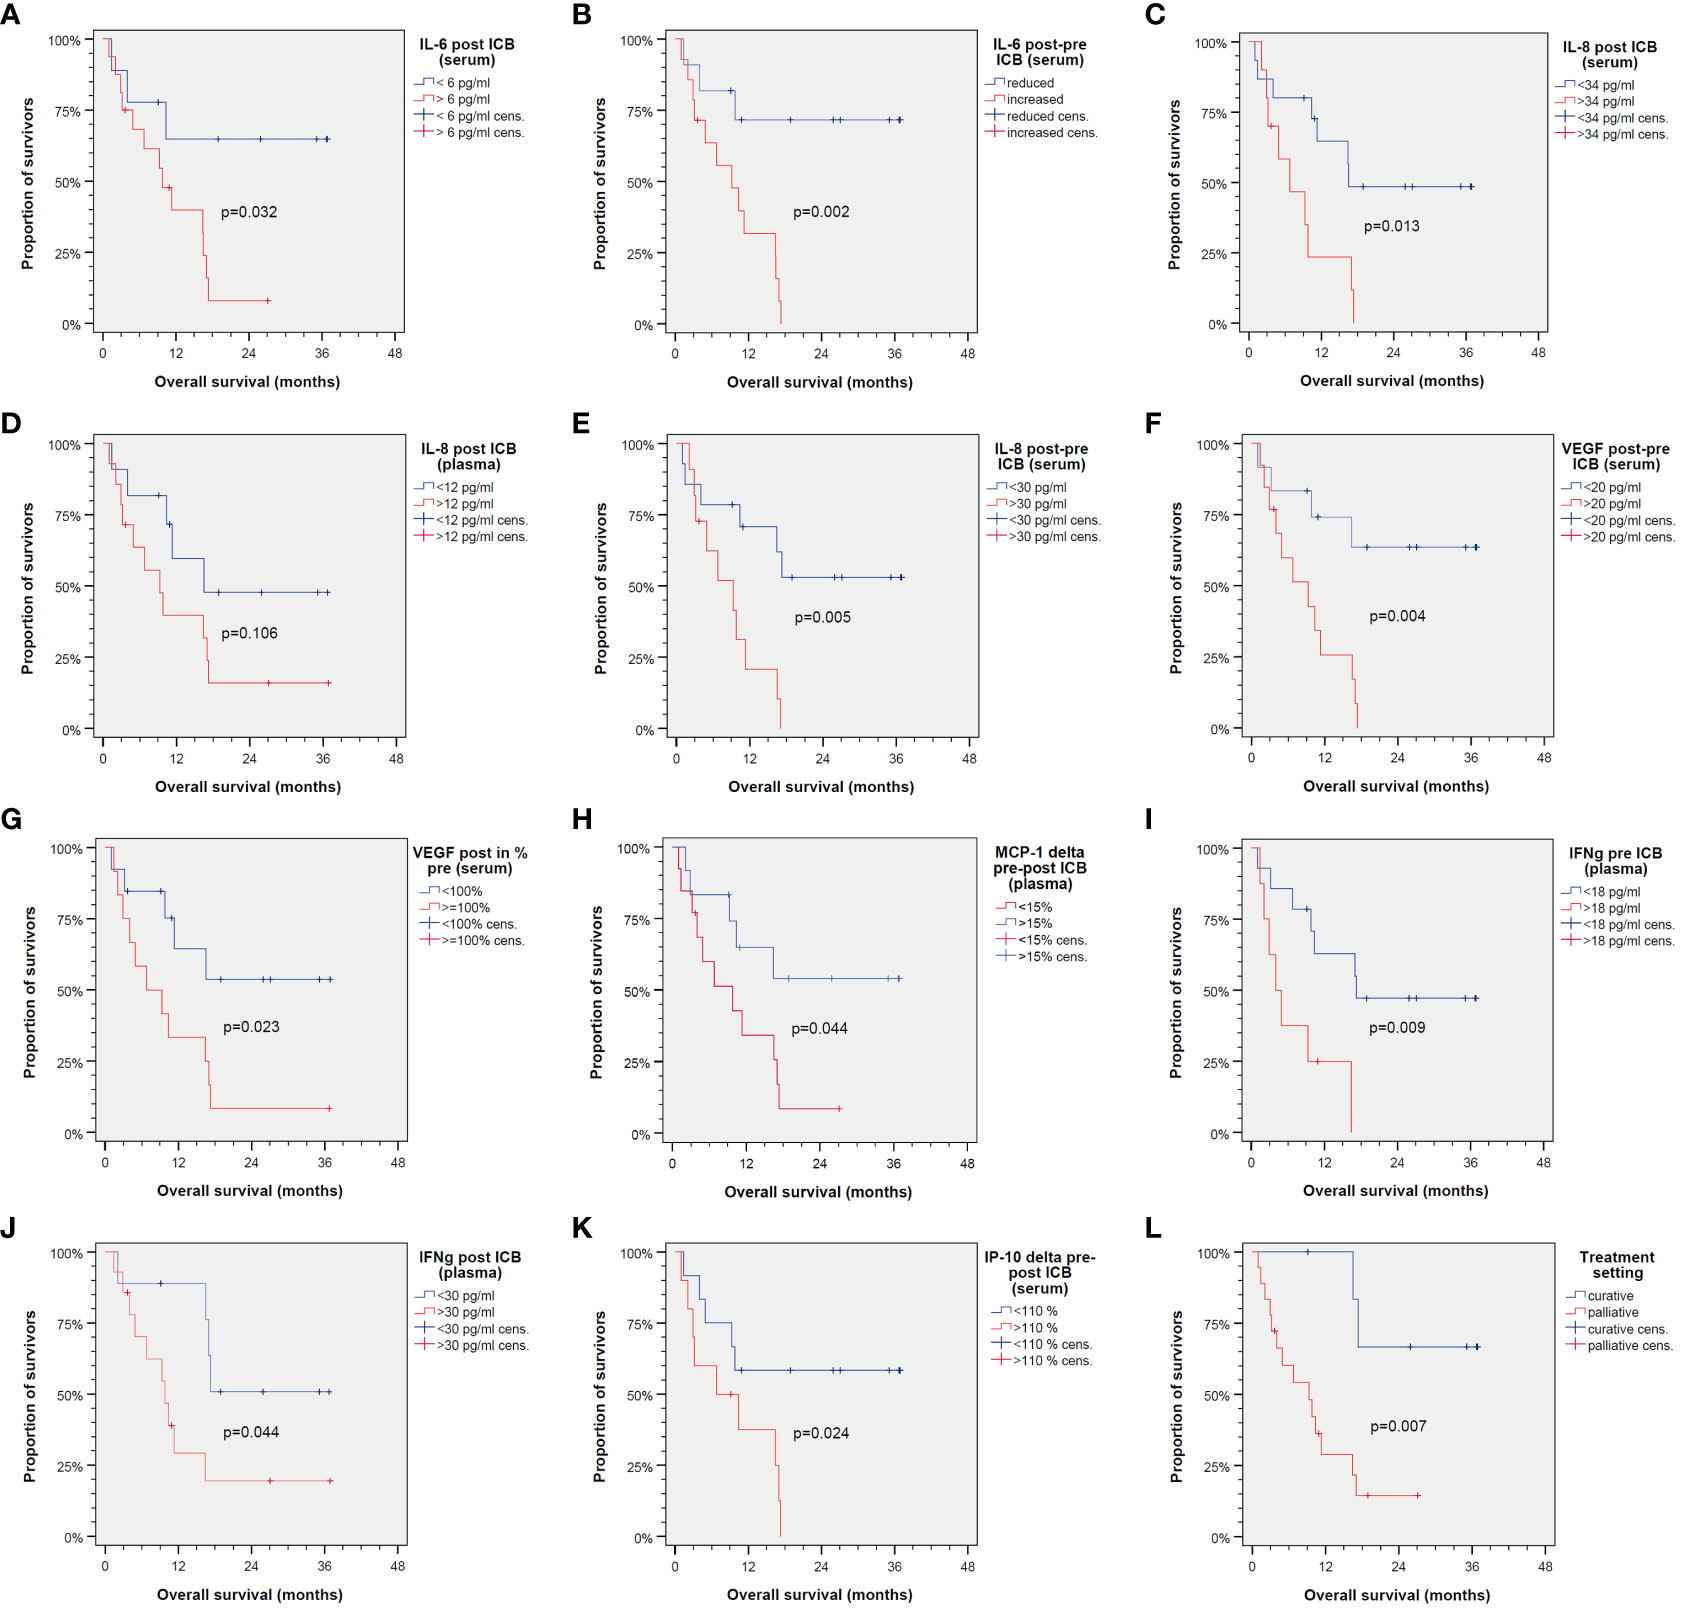
Figure 2 Kaplan–Meier cumulative survival plots for overall survival of 25 patients treated with immune-checkpoint blockade (ICB) utilizing anti-PD-1 antibodies. Binary split of the cohort according to optimum cutoff values for cytokine expression patterns shown in Table 2 with the only exception of IL-8 in plasma post-ICB (D) showing significant different overall survival between groups (A–C, E–K) as is the same comparing ICB in the curative vs. palliative setting (L). p-values shown are from log-rank tests (two-sided).
However, due to significant correlation of particular cytokines and overlap of cytokine expression patterns among patients (Figure 3), some OS curves suggest similar impact of particular cytokines on outcome after ICB.
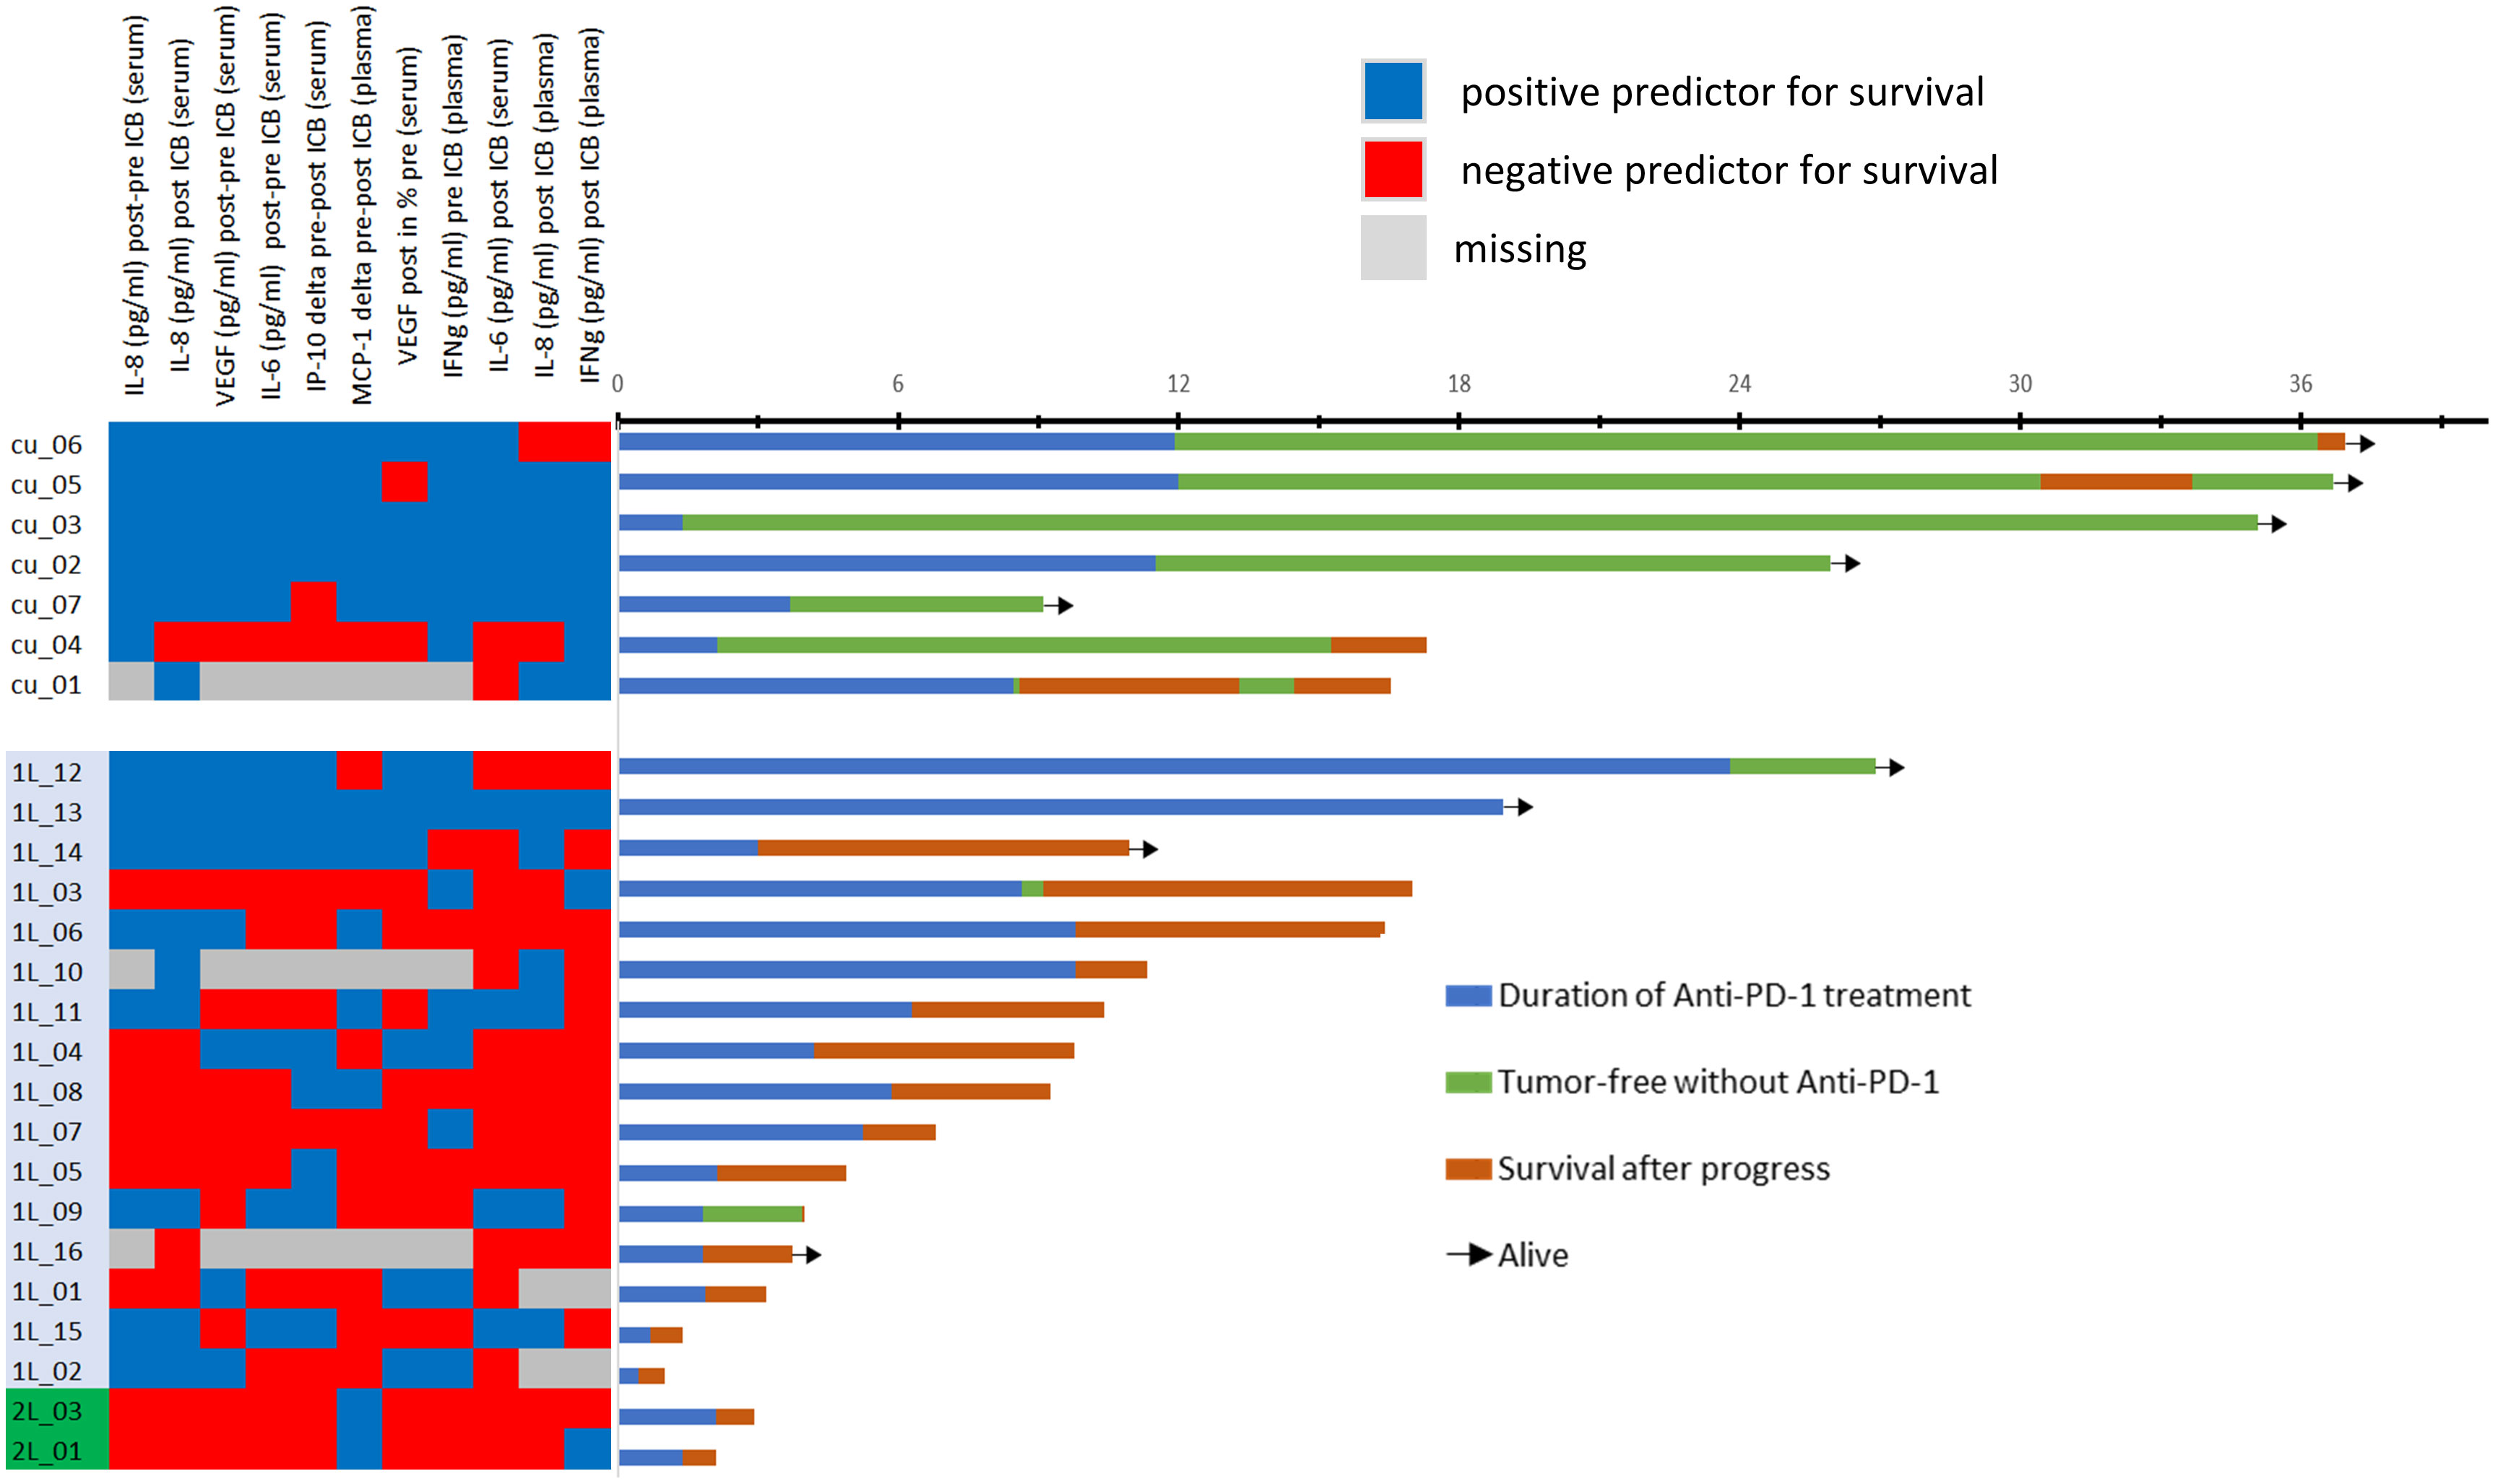
Figure 3 Heatmap showing the categorization of each patient’s cytokine expression linked to rather favorable (blue) or poor outcome (red) according to optimum cutoff values shown in Table 2 (left) and swimmer plots showing the individual course of 25 patients. Explanation of swimmer plots same as in Figure 1.
Figure 3 shows a heatmap for all cytokines measured in the particular sample type linked to deviating outcome according to significant different OS. Interestingly, some cytokines show close correlation, and cytokine expression levels accompanied by either improved (blue) or impaired OS (red) cluster together. To identify the most important predictors of OS among cytokines, we used Cox proportional hazard regression modeling applying the stepwise forward method and identified five cytokines and growth factors being independent predictors of OS (Table 5).
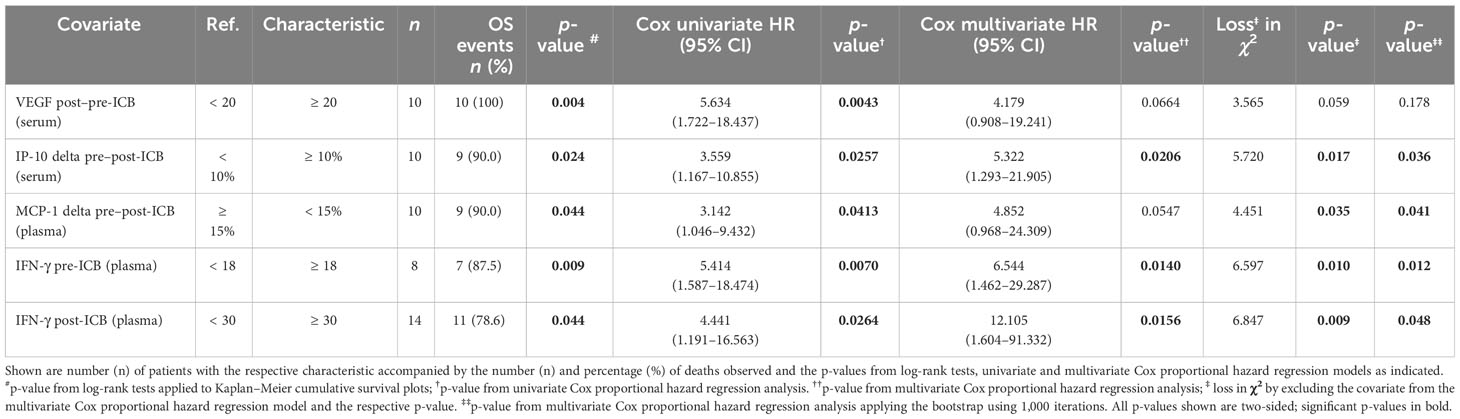
Table 5 Independent predictors of overall survival (OS) of HNSCC undergoing PD-1 ICB identified in the multivariate Cox proportional hazard regression model automatically build applying the step-wise forward likelihood ratio method.
We also included clinical parameters in the model, and in particular those with p < 0.2 in univariate analyses (> 30 pack years; > 30 g/day alcohol consumption). However, no clinical parameter was found to be an independent predictor for OS when added to the multivariate Cox proportional hazard model with the five cytokines VEGF (post–pre-ICB; serum), IP-10 (delta pre–post-ICB; serum), MCP-1 (delta pre–post-ICB; plasma), IFN-γ (pre-ICB; plasma), and IFN-γ (post-ICB; plasma). Using the natural logarithm of the hazard ratio according to the cutoff values for binary split of these five cytokines (Tables 4, 5) and calculating the sum of the cytokine expression pattern (CEP)-associated hazard, we were able to categorize each of the patient’s probability for dying into the three groups with either low (CEPlow), intermediate (CEPint), or high risk (CEPhigh). Overall survival differed significantly between these risk groups. The respective outcome is shown in Figure 4.
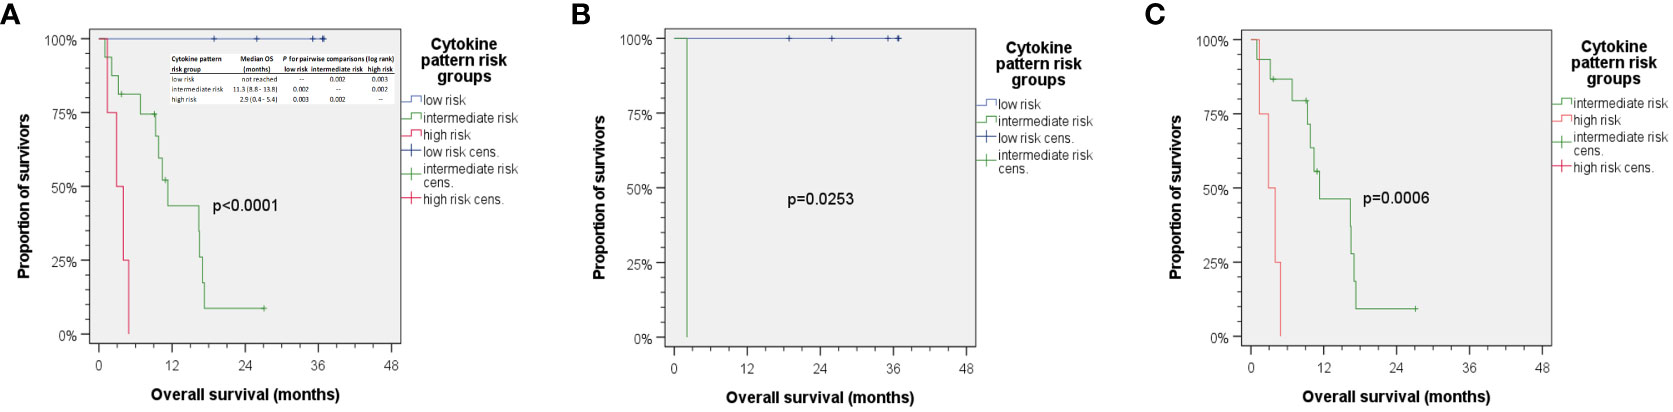
Figure 4 Kaplan–Meier cumulative survival plots for overall survival of 25 HNSCC treated with ICB. (A) Aggregating the five independent predictors for OS via summarizing the natural logarithm of their hazard ratio into a cytokine expression pattern (CEP) score allows for calculating individual risk for cancer-related death, so patients can be categorized as being CEPlow, CEPint, or CEPhigh accordingly correlating with rather low, intermediate, or high risk of death. The insert in panel (A) shows median overall survival in risk groups with p-values from pairwise comparison of CEP groups indicated. (B) HNSCC patients with <30 pack years and 1–30 g/day predominantly were CEPlow with missing CEPhigh, while those in (C) had higher alcohol exposure and >30 pack years and were either CEPint or CEPhigh with missing CEPlow. p-values shown are from two-sided log-rank tests.
While we did not observe any correlation between either mono-ICB or ICB +platinum or ICB in curative or palliative setting when added to the Cox model of five CEP defining cytokine measures, a strong correlation between lifestyle-associated (and therefore modifiable risk factors) tobacco smoking history and daily alcohol consumption was observed. Stratification of the cohort according to lifestyle-related risk factors tobacco smoking and daily alcohol consumption with (B) rather low and (C) rather high exposure to lifestyle-related risk factors demonstrates the correlation of cytokine patterns with lifestyle-related risk groups (Figure 4; compare B, <30 pack years and 1–30 g/day, and C, >30 pack years and higher alcohol exposure). Favorable outcome was observed in patients with low to moderate alcohol consumption and below 30 pack years, as they had low risk for death according to cytokine patterns. These patients responded to ICB in a favorable way, and none of them died. The risk profile according to smoking and drinking correlated significantly with the cytokine pattern risk group (r = 0.745) and hence explained 55.5% variance regarding this classification. In line with these findings, it might be of particular interest that multivariate Cox regression without inclusion of Pi among the measured cytokines only extracted alcohol consumption and smoking as independent predictors of OS in this small cohort, and neither mono-ICB or ICB plus platinum nor applying ICB in curative or palliative setting emerged as significant independent predictors of OS.
Discussion
Adaptive immune resistance is the summary of all mechanisms that a tumor cell uses to adapt to the changes in the TIME and eventually overcome immune attack (47). Acquired mutations and loss of transcriptional control due to hypo-methylation of gene-promotor regions as a result of the selective pressure caused by cell proliferation result in many pathways including cytokine signaling pathways involving the synthesis of cytokines, which create a favorable TIME for escaping immune-mediated destruction (48).
We identified four cytokines as being the only independent predictors of OS among our patients. These four cytokines are VEGF (difference between pre- and post-ICB serum), IP-10 (change between pre- and post-ICB serum), MCP-1 (change between pre- and post-ICB plasma), and IFN-γ (quantity in pre- or post-ICB plasma).
The interferons are divided into type I and type II according to receptor specificity and sequence homology, with IFN-γ being the sole type II interferon. IFN-γ is the immune interferon and produced by a variety of cells, including CD4+ and CD8+ lymphocytes, NK cells, and B cells. Tumor-infiltrating lymphocytes (TILS) are the main source of IFN-γ in the TIME. IFN-γ exerts many anti-tumoral functions after binding to the IFN-γ receptor. The downstream target genes of IFN-γ, besides modulating innate and adaptive immune responses, are related to the regulation of cell cycle, apoptosis, and inflammation (49). IFN-γ has been shown to decrease tumor cell growth by enhancing expression of cell cycle inhibitor proteins p27Kip, p16, or p21 in various cancer types (50, 51). Another important function of IFN-γ is the regulation of cell-surface class I and II MHC expression (49). In tumor cells, IFN-γ upregulates the expression of MHC class I molecules; their increased expression is related to enhanced antigenicity of the cell due to increased presentation of peptides including those derived from tumor-associated antigens (52). Besides acting on the tumor cell itself, IFN-γ can also act on the tumor stroma. IFN-γ signaling on endothelial cells leads to blood vessel regression in the tumor and, therefore, an arrest of blood flow (53). In addition, IFN-γ signaling causes tumor infiltration macrophages (TAMs) to differentiate to M1 macrophages, which suppress VEGF secretion and thereby inhibit angiogenesis (54).
Despite the central antitumoral role of IFN-γ during initiation of an immune response, it can also exert pro-tumoral functions (55). Exposure to elevated IFN-γ levels and a prolonged exposure, in particular, exert selective immune pressure on the tumor cell, which leads to a loss of genes involved in antigen presentation, such as MHC class I (56). Moreover, IFN-γ is able to induce gene-expression patterns linked to multigenic resistance (57). Myeloid-derived suppressor cells (MDSCs) are myeloid-origin cells, which are induced by tumor- and host-secreted factors and are present in most cancer patients. MDSC can suppress T-cell activation and therefore downregulate immune surveillance and antitumor immunity. The development and function of most MDSC requires IFN-γ (58). IFN-γ produced by CD8+ T cells can trigger the expression of induced nitric oxide synthase (iNOS) in certain MDSC, which contributes to the immunosuppressive activity of these MSDC (59). Prior studies in HNSCC also indicate that the IFN-γ-induced nitric oxide synthase supports tumor progression and lymphatic spread in HNSCC (60). Previous studies show elevated levels of IFN-γ (3.86 ± 10.07 pg/ml) in serum of HNSCC patients compared to healthy individuals (61). Median pre- and post-treatment IFN-γ serum levels (33.5 pg/ml pre-treatment versus 28.8 pg/ml post-treatment) were non-significant for newly presenting HNSCC patients (62). IFN-γ levels in plasma have been rarely assessed in HNSCC patients. Our results show that higher pre- and post-therapeutic levels of IFN-γ (>16 pg/ml pre-ICB and >30pg/ml post-ICB in plasma) are negative predictors for response to anti-PD-1 checkpoint inhibitor therapy and negative predictors for overall survival. IFN-γ induces PD-L1 expression (2). The selective induction of PD-L1 by the tumor cell is the first clearly defined and therapeutically validated mechanism of adaptive immune resistance (47). During the upregulation of PD-L1 by IFN-γ, the tumor utilizes IFN-γ as part of a negative feedback loop that inhibits anti-tumoral immune responses (63, 64). Persistent IFN-γ signaling also allows the tumor to acquire signal transducer and activator of transcription 1 (STAT1)-related epigenomic changes and augments expression of interferon-stimulated genes and ligands for multiple T-cell inhibitory receptors, which can be seen as a mechanism of adaptive resistance to checkpoint inhibitor therapy. Biomarkers for interferon-driven resistance are reported as being associated with clinical progression after anti-PD-1 therapy (57). This is consistent with our findings. Another mechanism contributing to the development of adaptive resistance to anti-PD-1 immunotherapy is the activation of the tumor-intrinsic NOD-, LRR- and pyrin domain-containing protein-3 (NLRP3) inflammasome–heat shock protein 70 (HSP70) signaling axis. The NLRP3–HSP70 axis recruits granulocytic polymorph-nuclear myeloid-derived suppressor cells (PMN-MDSCs; see above and (56, 58, 59)) into the tumor microenvironment, which are major regulators of tumor immune suppression and support disease hyperprogression in response to anti-PD-1 immunotherapy. This signaling axis is triggered by CD8+ T-cell cytotoxicity and is enhanced by IFN-γ (65). It has been sown that the IFN-γ-related mRNA profile predicts the clinical response to PD-1 blockade (66, 67).
Monocyte chemoattractant protein-1 (MCP-1/CCL2) is a member of the C–C chemokine family and a potent chemotactic factor. It is primarily produced by monocytes and macrophages and regulates the migration and infiltration of monocytes, T cells, and natural killer cells (68). MCP-1 is produced by many cancer cells and acts on the very same by signaling through C–C chemokine receptor type 2 (CCR-2, CD192) on CCR-2-expressing cancer cells. This encourages tumor growth and invasiveness. Furthermore, MCP-1 triggers angiogenesis and tumor development by either recruiting monocytes into the TIME, which differentiate into tumor-associated macrophages (TAMs) or acting directly on endothelial cells to produce endothelial growth factors (48). Several studies found MCP-1 to be a negative prognostic factor in HNSCC, as high levels of MCP-1 in the TIME lead to a poor prognosis and impaired outcome (69, 70), but there is not much data on serum and/or plasma levels of MCP-1 in HNSCC patients available in the literature. One previous study found no significant difference in mean pre-therapeutic MCP-1 serum levels in HNSCC patients compared to healthy controls (45.27 ± 16.43 pg/ml versus 60.09 ± 21.83 pg/ml) (71). On the other hand, high serum levels of MCP-1 correlated with favorable outcome in breast (>250 pg/ml) and pancreatic cancer (>91 pg/ml) patients (72, 73). This is consistent with our results, as we also found a correlation of higher MCP-1 levels, albeit in plasma, and improved OS. This opposite effect of MCP-1 has been investigated by our group before (74). MCP-1-associated increased recruitment of monocytes into the TIME eventually leads to their differentiation into TAMs. These TAMs can either be M1 and have tumoricidal capacity or M2 and promote tumor progression by inducing vascularization and tumor growth (75, 76). Indeed, it was shown that monocytes (the macrophage precursor cells) entering the tumor can differentiate into these two categories, M1 classical activated macrophages, for example under the stimulation of IFN-γ, and M2 alternative activated macrophages. Type M1 macrophages secrete pro-inflammatory cytokines and present tumor-specific antigens through expression of the MHC classes I and II. M1 macrophages therefore promote antitumor immunity, whereas M2 macrophages exert tumor-promoting activities (77).
Interleukin 8 (IL-8, CXCL8) is a pro-inflammatory cytokine that was first named neutrophil-activating factor (NAF) due to its ability to stimulate neutrophil exocytosis and oxidative burst (78). Different cell types including monocytes, macrophages, fibroblasts, endothelial cells, and epithelial cells secrete IL-8. Various cytokines (e.g., IL-6 and TNF-α) and environmental stresses such as hypoxia, reactive oxygen species, and bacterial particles (79) stimulate its expression. Downstream signaling of IL-8 is mediated through extracellular binding to either of two G-protein-coupled receptors, C-X-C chemokine receptor type 1 (CXCR1), and type 2 (CXCR2), which are expressed on monocytes, granulocytes, and endothelial cells (80). The activation of CXCR1/2 results in calcium mobilization from the endoplasmic reticulum and the activation of protein kinase C (PKC), which is critical for neutrophil chemotaxis (81). Activation of one of the two receptors also induces granule release in neutrophils, and CXCR1 induces superoxide anion production, which is essential for the IL-8-mediated oxidative burst (82).
Interleukin-8 has been found to promote tumor progression by altering the TIME in favor of the tumor promoting angiogenesis (83). One mechanism used by cancer cells to acquire motility and invasiveness is the epithelial-to-mesenchymal transition (EMT), which involves loss of epithelial cell-to-cell contacts and increased expression of mesenchymal proteins that mediate motility (e.g., fibronectin) (84). IL-8 has been found to promote this transition, resulting in increased tumor cell migration and development of metastases (85). Increased levels of IL-8 have been reported in various cancer types and are associated with late-stage disease and reduced overall survival (86–88). IL-8 signaling through CXCR2 recruits MDSCs to the tumor side, which, as stated above, can cause resistance to anti-PD1 therapy by inhibiting T-cell infiltration and activation (89). In melanoma and NSCLC patients treated with PD-1 inhibitor therapy, serum levels of IL-8 decreased at the time of best response and serum levels rose in non-responders at the time of disease progression (90). This is consistent with our results, as we found that higher serum and plasma levels after immune checkpoint blockade (ICB) correlated with impaired overall survival.
IL-8 also induces chemoresistance in tumor cells by upregulating the ATP-binding cassette subfamily B member 1 (ABCB1), which leads to the production of multidrug resistance protein 1 (MDR1), a protein linked with drug resistance (91, 92). This mechanism was found to mediate chemoresistance to cisplatin in gastric cancer as high pre-therapeutic serums levels of IL-8 (446.71 ± 111.07 pg/ml) predicted poor response to platinum-based chemotherapy (93). In HNSCC, IL-8 serum levels are elevated (123.47 ± 282.66 pg/ml) compared to healthy controls and are correlated with loco-regional metastases (61). This is consistent with our findings, as higher post-ICB serum and plasma levels correlated with impaired OS.
IP-10 (CXCL10) is an IFN-γ-induced protein belonging to the CXC chemokine family, which is able to reduce tumor growth, regulate angiogenesis, and increase the recruitment of cytolytic lymphocytes into tumor lesions (94). The chemokines IL-8 and IP-10 (CXCL10) have been identified as biomarkers that improved the prediction of lung cancer incidence in combination with lung cancer risk models (95). Mean pre-therapeutic IP-10 serum levels in HNSCC patients were found to be significantly elevated compared to healthy controls (2,502.8 ± 1,098.5 pg/ml versus 1,488.3 ± 510.4 pg/ml) (71). In our previous work, we already established an IP-10 score that was based on ex-vivo response of HNSCC to pembrolizumab predicted treatment outcomes in HNSCC patients (28).
IL-6 is a well-known pleiotropic cytokine involved in pro-inflammatory immune responses, autoimmune diseases, senescence, and carcinogenesis. Signaling via its receptor IL-6R-α linked to gp130 activates phosphorylation of the signal transducer STAT3, and increased STAT3 signaling through elevated IL-6 was associated with reduced overall survival in p16-negative HNSCC (96). The activation of the STAT3 pathway was also found to promote PD-1/PD-L1 expression and therefore might play an important role in the antitumor immune response of HNSCC (97). HNSCC patients show significantly higher mean IL-6 serum levels compared to healthy controls (19.5 pg/ml versus 6.0 pg/ml (29); 14.1 pg/ml versus 9.1 pg/ml (71)). Higher IL-6 levels are correlated with higher tumor stage and disease-positive lymph nodes in HNSCC patients (29).
A significant decrease in serum IL-6 and IL-8 levels between pre- and post-treatment samples was observed in newly presenting HNSCC patients after initial treatment (62), which suggests that decreasing levels of IL-6 and IL-8 may function as good prognostic factors under pembrolizumab treatment as well. Increased levels of IL-8 and IFN-γ were correlated with loco-regional metastases in patients with laryngo-pharyngeal HPV-positive cancers (61).
Mean VEGF serum levels are significantly higher in HNSCC patients than in healthy individuals (144.5 pg/ml versus 32.7 pg/ml) (98). Lower pre-therapeutic VEGF plasma levels (<26 pg/ml) were found to be a positive prognostic biomarker for prolonged progression-free survival in HNSCC patients (27). The interplay of cancer cells and immune cells in the TIME of HNSCC consequently appears to be mirrored by cytokines and growth factors including VEGF (27) that could be measured in serum and plasma representing valuable liquid biopsies. Our observation that not each and every biomarker can be reliably measured in different blood sample types, serum, or plasma and used to gain information about the particular HNSCC and the prognosis of the patient or to predict response to treatment is not new (27). Despite being drawn at the same point of time, serum and plasma undergo changes related to blood clotting or its prevention through anticoagulants, and this obviously is reflected by the superiority of either serum or plasma for developing biomarkers to predict outcome. This also applies to outcome after ICB. Despite the close correlation of a number of cytokines measured in serum and plasma, we found five covariates derived from cytokine measurements being independent predictors for OS. Three of them require calculation of differences between pre- and post-ICB initiation samples, while IFN-γ concentrations in plasma pre- and post-ICB alone are sufficient independent predictors in the model. The three CEP-risk groups had different risk for dying, as the groups had median (95% confidence interval) OS of 2.9 (0.4–5.4) and 11.3 (8.8–13.8) months in CEPhigh and CEPint groups and no death within mean follow-up of 29.2 (22.1–36.2) months. Of particular interest, however, is the close link between the cytokine pattern risk group and lifestyle-associated risk factors smoking and alcohol consumption (r = 0.745), which explained 55.5% variance regarding outcome after ICB.
Besides some strengths according to standardized blood draw and handling of serum and plasma and SOPs for cytokine measurements, our study and the transferability of findings have numerous limitations. The most important limitation is the small number of patients and the heterogeneity of treatment, which probably have confounded the outcome of patients studied. However, our sensitivity analyses and multivariable analyses applying Cox regression and internal validation by bootstrapping revealed no substantial impact on CEP if ICB was applied either alone or combined with cisplatin-based chemotherapy or used as adjuvant treatment after surgery of LA-HNSCC or first-line therapy of R/M HNSCC. However, the close correlation of lifestyle-associated risk factors and CEP might also be seen as a limitation of our study, and it remains unclear if CEP observed in more homogenous HNSCC patient groups or using the same cutoffs for their definition will be possible. Consequently, we are planning to validate the CEP-risk model in a RCT.
Conclusions
Whereas individual pre- or post-ICB cytokine concentrations in serum or plasma alone failed to predict the group of patients achieving long-lasting benefit from ICB according to prolonged OS, CEP-risk groups may support their identification. The close link between cytokine expression patterns and modifiable lifestyle-associated risk factors tobacco and alcohol exposure point to their impact on immune surveillance in both the development of HNSCC and response to immune checkpoint blockade.
Data availability statement
The raw data supporting the conclusions of this article will be made available by the authors, without undue reservation.
Ethics statement
The studies involving humans were approved by The Institutional Human Ethics Committee of the University Leipzig (vote NICEI-CIH 341-15-ff). The studies were conducted in accordance with the local legislation and institutional requirements. The participants provided their written informed consent to participate in this study.
Author contributions
Conceptualization: GW. Methodology: GW. Validation: LR, JW, MB, SW, TW, and GW. Formal analysis: LR, TW, and GW. Investigation: LR, IK, VZ, JW, and GW. Resources: AD, VZ, SW, and GW. Data curation: LR, TW, and GW. Writing—original draft preparation: LR and GW. Writing—review and editing: all authors. Visualization: LR and GW. Supervision: SW and GW. Project administration: GW. Funding acquisition: GW and AD. All authors contributed to the article and approved the submitted version.
Acknowledgments
We thank all patients and their families who participated in the investigation. We especially thank all contributing physicians for providing clinical data and the entire technical staff, all nurses, and physicians in the involved departments. We acknowledge support from Leipzig University for Open Access Publishing.
Conflict of interest
The authors declare that the research was conducted in the absence of any commercial or financial relationships that could be construed as a potential conflict of interest.
Publisher’s note
All claims expressed in this article are solely those of the authors and do not necessarily represent those of their affiliated organizations, or those of the publisher, the editors and the reviewers. Any product that may be evaluated in this article, or claim that may be made by its manufacturer, is not guaranteed or endorsed by the publisher.
Supplementary material
The Supplementary Material for this article can be found online at: https://www.frontiersin.org/articles/10.3389/fimmu.2023.1237623/full#supplementary-material
Supplementary Figure 1 | (online only). Graphical representation of mean cytokine concentrations measured in serum or EDTA-anticoagulated plasma according to . Error bars indicate 95% confidence intervals. Please note different scaling for individual cytokines named above each plot.
References
1. Dong H, Zhu G, Tamada K, Chen L. B7-H1, a third member of the B7 family, co-stimulates T-cell proliferation and interleukin-10 secretion. Nat Med (1999) 5(12):1365–9. doi: 10.1038/70932
2. Dong H, Strome SE, Salomao DR, Tamura H, Hirano F, Flies DB, et al. Tumor-associated B7-H1 promotes T-cell apoptosis: a potential mechanism of immune evasion. Nat Med (2002) 8(8):793–800. doi: 10.1038/nm730
3. Freeman GJ, Long AJ, Iwai Y, Bourque K, Chernova T, Nishimura H, et al. Engagement of the PD-1 immunoinhibitory receptor by a novel B7 family member leads to negative regulation of lymphocyte activation. J Exp Med (2000) 192(7):1027–34. doi: 10.1084/jem.192.7.1027
4. Vaddepally RK, Kharel P, Pandey R, Garje R, Chandra AB. Review of indications of FDA-approved immune checkpoint inhibitors per NCCN guidelines with the level of evidence. Cancers (2020) 12(3):738. doi: 10.3390/cancers12030738
5. Seiwert TY, Burtness B, Mehra R, Weiss J, Berger R, Eder JP, et al. Safety and clinical activity of pembrolizumab for treatment of recurrent or metastatic squamous cell carcinoma of the head and neck (KEYNOTE-012): an open-label, multicentre, phase 1b trial. Lancet Oncol (2016) 17(7):956–65. doi: 10.1016/S1470-2045(16)30066-3
6. Chow LQ, Haddad R, Gupta S, Mahipal A, Mehra R, Tahara M, et al. Antitumor activity of pembrolizumab in biomarker-unselected patients with recurrent and/or metastatic head and neck squamous cell carcinoma: results from the phase ib KEYNOTE-012 expansion cohort. J Clin Oncol (2016) 34(32):3838–45. doi: 10.1200/JCO.2016.68.1478
7. Burtness B, Harrington KJ, Greil R, Soulières D, Tahara M, de Castro G, et al. Pembrolizumab alone or with chemotherapy versus cetuximab with chemotherapy for recurrent or metastatic squamous cell carcinoma of the head and neck (KEYNOTE-048): a randomised, open-label, phase 3 study. Lancet (London England) (2019) 394(10212):1915–28. doi: 10.1016/S0140-6736(19)32591-7
8. Mehra R, Seiwert TY, Gupta S, Weiss J, Gluck I, Eder JP, et al. Efficacy and safety of pembrolizumab in recurrent/metastatic head and neck squamous cell carcinoma: pooled analyses after long-term follow-up in KEYNOTE-012. Br J Cancer (2018) 119(2):153–9. doi: 10.1038/s41416-018-0131-9
9. Ferris Robert L, Blumenschein G Jr., Fayette J, Guigay J, Dimitrios CA, Licitra L, et al. Nivolumab for recurrent squamous-cell carcinoma of the head and neck. Br Dental J (2016) 221(10):632. doi: 10.1038/sj.bdj.2016.860
10. Topalian SL, Hodi FS, Brahmer JR, Gettinger SN, Smith DC, McDermott DF, et al. Safety, activity, and immune correlates of anti-PD-1 antibody in cancer. New Engl J Med (2012) 366(26):2443–54. doi: 10.1056/NEJMoa1200690
11. Yi M, Jiao D, Xu H, Liu Q, Zhao W, Han X, et al. Biomarkers for predicting efficacy of PD-1/PD-L1 inhibitors. Mol Cancer (2018) 17(1):129. doi: 10.1186/s12943-018-0864-3
12. Topalian SL, Taube JM, Anders RA, Pardoll DM. Mechanism-driven biomarkers to guide immune checkpoint blockade in cancer therapy. Nat Rev Cancer (2016) 16(5):275–87. doi: 10.1038/nrc.2016.36
13. Chen S-W, Li S-H, Shi D-B, Jiang W-M, Song M, Yang A-K, et al. Expression of PD-1/PD-L1 in head and neck squamous cell carcinoma and its clinical significance. Int J Biol Markers (2019) 34(4):398–405. doi: 10.1177/1724600819884722
14. Emancipator K, Huang L, Aurora-Garg D, Bal T, Cohen EE, Harrington K, et al. Comparing programmed death ligand 1 scores for predicting pembrolizumab efficacy in head and neck cancer. Modern Pathol (2021) 34(3):532–41. doi: 10.1038/s41379-020-00710-9
15. Chen DS, Irving BA, Hodi FS. Molecular pathways: next-generation immunotherapy–inhibiting programmed death-ligand 1 and programmed death-1. Clin Cancer Res (2012) 18(24):6580–7. doi: 10.1158/1078-0432.CCR-12-1362
16. Caldwell C, Johnson CE, Balaji VN, Balaji GA, Hammer RD, Kannan R. Identification and validation of a PD-L1 binding peptide for determination of PDL1 expression in tumors. Sci Rep (2017) 7(1):13682. doi: 10.1038/s41598-017-10946-2
17. Kim HR, Ha S-J, Hong MH, Heo SJ, Koh YW, Choi EC, et al. PD-L1 expression on immune cells, but not on tumor cells, is a favorable prognostic factor for head and neck cancer patients. Sci Rep (2016) 6:36956. doi: 10.1038/srep36956
18. Kulangara K, Zhang N, Corigliano E, Guerrero L, Waldroup S, Jaiswal D, et al. Clinical utility of the combined positive score for programmed death ligand-1 expression and the approval of pembrolizumab for treatment of gastric cancer. Arch Pathol Lab Med (2019) 143(3):330–7. doi: 10.5858/arpa.2018-0043-OA
19. Dinarello CA. Historical insights into cytokines. Eur J Immunol (2007) 37 Suppl:1, S34–45. doi: 10.1002/eji.200737772
20. Lefkowitz DL, Lefkowitz SS. Macrophage-neutrophil interaction: a paradigm for chronic inflammation revisited. Immunol Cell Biol (2001) 79(5):502–6. doi: 10.1046/j.1440-1711.2001.01020.x
21. Schenk T, Irth H, Marko-Varga G, Edholm LE, Tjaden UR, van der Greef J. Potential of on-line micro-LC immunochemical detection in the bioanalysis of cytokines. J Pharm Biomed Anal (2001) 26(5-6):975–85. doi: 10.1016/S0731-7085(01)00464-2
22. Stenken JA, Poschenrieder AJ. Bioanalytical chemistry of cytokines–a review. Analytica Chim Acta (2015) 853:95–115. doi: 10.1016/j.aca.2014.10.009
23. Raufman J-P. Long: The diagnostic and prognostic role of cytokines in colon cancer. GICTT (2011) 1:27–39. doi: 10.2147/GICTT.S18423
24. Chikkaveeraiah BV, Bhirde AA, Morgan NY, Eden HS, Chen X. Electrochemical immunosensors for detection of cancer protein biomarkers. ACS Nano (2012) 6(8):6546–61. doi: 10.1021/nn3023969
25. Rusling JF, Kumar CV, Gutkind JS, Patel V. Measurement of biomarker proteins for point-of-care early detection and monitoring of cancer. Analyst (2010) 135(10):2496–511. doi: 10.1039/c0an00204f
26. Argiris A, Lee SC, Feinstein T, Thomas S, Branstetter BF, Seethala R, et al. Serum biomarkers as potential predictors of antitumor activity of cetuximab-containing therapy for locally advanced head and neck cancer. Oral Oncol (2011) 47(10):961–6. doi: 10.1016/j.oraloncology.2011.07.034
27. Siemert J, Wald T, Kolb M, Pettinella I, Böhm U, Pirlich M, et al. Pre-therapeutic VEGF level in plasma is a prognostic bio-marker in head and neck squamous cell carcinoma (HNSCC). Cancers (2021) 13(15):3781. doi: 10.3390/cancers13153781
28. Berszin M, Michaelides I, Siemert J, Röhl L, Wellhausen J, Wald T, et al. Cytokine profiles of head and neck squamous cell carcinoma undergoing dual immunotherapy with cetuximab and pembrolizumab identify interferon gamma-induced protein 10 as novel biomarker. Front Oncol (2022) 12:795277. doi: 10.3389/fonc.2022.795277
29. Riedel F, Zaiss I, Herzog D, Götte K, Naim R, Hörmann K. Serum levels of interleukin-6 in patients with primary head and neck squamous cell carcinoma. Anticancer Res (2005) 25(4):2761–5.
30. Bienvenu J, Monneret G, Fabien N, Revillard JP. The clinical usefulness of the measurement of cytokines. Clin Chem Lab Med (2000) 38(4):267–85. doi: 10.1515/CCLM.2000.040
31. Ralli M, Grasso M, Gilardi A, Ceccanti M, Messina MP, Tirassa P, et al. The role of cytokines in head and neck squamous cell carcinoma: A review. La Clin Terapeutica (2020) 171(3):e268–74. doi: 10.7417/CT.2020.2225
32. Nisar S, Yousuf P, Masoodi T, Wani NA, Hashem S, Singh M, et al. Chemokine-cytokine networks in the head and neck tumor microenvironment. Int J Mol Sci (2021) 22(9):4584. doi: 10.3390/ijms22094584
33. Druzgal CH, Chen Z, Yeh NT, Thomas GR, Ondrey FG, Duffey DC, et al. A pilot study of longitudinal serum cytokine and angiogenesis factor levels as markers of therapeutic response and survival in patients with head and neck squamous cell carcinoma. Head Neck (2005) 27(9):771–84. doi: 10.1002/hed.20246
34. Hathaway B, Landsittel DP, Gooding W, Whiteside TL, Grandis JR, Siegfried JM, et al. Multiplexed analysis of serum cytokines as biomarkers in squamous cell carcinoma of the head and neck patients. Laryngoscope (2005) 115(3):522–7. doi: 10.1097/01.mlg.0000157850.16649.b8
35. Keegan A, Ricciuti B, Garden P, Cohen L, Nishihara R, Adeni A, et al. Plasma IL-6 changes correlate to PD-1 inhibitor responses in NSCLC. J Immunother Cancer (2020) 8(2):e000678. doi: 10.1136/jitc-2020-000678
36. Jayaraj R, Kumarasamy C. Comment on 'Prognostic biomarkers for oral tongue squamous cell carcinoma: a systematic review and meta-analysis'. Br J Cancer (2018) 118(5):e11. doi: 10.1038/bjc.2017.482
37. Alfaro C, Sanmamed MF, Rodríguez-Ruiz ME, Teijeira Á, Oñate C, González Á, et al. Interleukin-8 in cancer pathogenesis, treatment and follow-up. Cancer Treat Rev (2017) 60:24–31. doi: 10.1016/j.ctrv.2017.08.004
38. Ning Y, Manegold PC, Hong YK, Zhang W, Pohl A, Lurje G, et al. Interleukin-8 is associated with proliferation, migration, angiogenesis and chemosensitivity in vitro and in vivo in colon cancer cell line models. Int J Cancer (2011) 128(9):2038–49. doi: 10.1002/ijc.25562
39. Zhu YM, Webster SJ, Flower D, Woll PJ. Interleukin-8/CXCL8 is a growth factor for human lung cancer cells. Br J Cancer (2004) 91(11):1970–6. doi: 10.1038/sj.bjc.6602227
40. Linkov F, Lisovich A, Yurkovetsky Z, Marrangoni A, Velikokhatnaya L, Nolen B, et al. Early detection of head and neck cancer: development of a novel screening tool using multiplexed immunobead-based biomarker profiling. Cancer Epidemiol Biomarkers Prev (2007) 16(1):102–7. doi: 10.1158/1055-9965.EPI-06-0602
41. Chan L-P, Wang L-F, Chiang F-Y, Lee K-W, Kuo P-L, Liang C-H. IL-8 promotes HNSCC progression on CXCR1/2-meidated NOD1/RIP2 signaling pathway. Oncotarget (2016) 7(38):61820–31. doi: 10.18632/oncotarget.11445
42. Gokhale AS, Haddad RI, Cavacini LA, Wirth L, Weeks L, Hallar M, et al. Serum concentrations of interleukin-8, vascular endothelial growth factor, and epidermal growth factor receptor in patients with squamous cell cancer of the head and neck. Oral Oncol (2005) 41(1):70–6. doi: 10.1016/j.oraloncology.2004.06.005
43. Kaplan EL, Meier P. Nonparametric estimation from incomplete observations. J Am Stat Assoc (1958) 53(282):457. doi: 10.1080/01621459.1958.10501452
44. Mantel N. Evaluation of survival data and two new rank order statistics arising in its consideration. Cancer Chemother Rep (1966) 50(3):163–70.
45. Cox DR. Regression models and life- tables. J R Stat Society: Ser B (Methodological) (1972) 34(2):187–220. doi: 10.1111/j.2517-6161.1972.tb00899.x
46. Collins GS, Reitsma JB, Altman DG, Moons KGM. Transparent Reporting of a multivariable prediction model for Individual Prognosis or Diagnosis (TRIPOD): the TRIPOD statement. Ann Internal Med (2015) 162(1):55–63. doi: 10.7326/M14-0697
47. Kim TK, Vandsemb EN, Herbst RS, Chen L. Adaptive immune resistance at the tumour site: mechanisms and therapeutic opportunities. Nat Rev Drug Discovery (2022) 21(7):529–40. doi: 10.1038/s41573-022-00493-5
48. Wang L, Lan J, Tang J, Luo N. MCP-1 targeting: Shutting off an engine for tumor development. Oncol Lett (2022) 23(1):26. doi: 10.3892/ol.2021.13144
49. Schroder K, Hertzog PJ, Ravasi T, Hume DA. Interferon-gamma: an overview of signals, mechanisms and functions. J Leukocyte Biol (2004) 75(2):163–89. doi: 10.1189/jlb.0603252
50. Harvat BL, Seth P, Jetten AM. The role of p27Kip1 in gamma interferon-mediated growth arrest of mammary epithelial cells and related defects in mammary carcinoma cells. Oncogene (1997) 14(17):2111–22. doi: 10.1038/sj.onc.1201055
51. Ni L, Lu J. Interferon gamma in cancer immunotherapy. Cancer Med (2018) 7(9):4509–16. doi: 10.1002/cam4.1700
52. Martini M, Testi MG, Pasetto M, Picchio MC, Innamorati G, Mazzocco M, et al. IFN-gamma-mediated upmodulation of MHC class I expression activates tumor-specific immune response in a mouse model of prostate cancer. Vaccine (2010) 28(20):3548–57. doi: 10.1016/j.vaccine.2010.03.007
53. Kammertoens T, Friese C, Arina A, Idel C, Briesemeister D, Rothe M, et al. Tumour ischaemia by interferon-γ resembles physiological blood vessel regression. Nature (2017) 545(7652):98–102. doi: 10.1038/nature22311
54. Jeong SK, Yang K, Park YS, Choi YJ, Oh SJ, Lee CW, et al. Interferon gamma induced by resveratrol analog, HS-1793, reverses the properties of tumor associated macrophages. Int Immunopharmacol (2014) 22(2):303–10. doi: 10.1016/j.intimp.2014.07.004
55. Zaidi MR. The interferon-gamma paradox in cancer. J Interferon Cytokine Res (2019) 39(1):30–8. doi: 10.1089/jir.2018.0087
56. Algarra I, García-Lora A, Cabrera T, Ruiz-Cabello F, Garrido F. The selection of tumor variants with altered expression of classical and nonclassical MHC class I molecules: implications for tumor immune escape. Cancer Immunol Immunother CII (2004) 53(10):904–10. doi: 10.1007/s00262-004-0517-9
57. Benci JL, Xu B, Qiu Y, Wu TJ, Dada H, Twyman-Saint Victor C, et al. Tumor interferon signaling regulates a multigenic resistance program to immune checkpoint blockade. Cell (2016) 167(6):1540–1554.e12. doi: 10.1016/j.cell.2016.11.022
58. Ostrand-Rosenberg S, Sinha P. Myeloid-derived suppressor cells: linking inflammation and cancer. J Immunol (Baltimore Md. 1950) (2009) 182(8):4499–506. doi: 10.4049/jimmunol.0802740
59. Shime H, Maruyama A, Yoshida S, Takeda Y, Matsumoto M, Seya T. Toll-like receptor 2 ligand and interferon-γ suppress anti-tumor T cell responses by enhancing the immunosuppressive activity of monocytic myeloid-derived suppressor cells. OncoImmunology (2018) 7(1):e1373231. doi: 10.1080/2162402X.2017.1373231
60. Mozet C, Marin DG, Bertolini J, Tannapfel A, Wichmann G, Dietz A. Nitric oxide synthase (NOS2/3) expression in head and neck squamous cell carcinomas in correlation with clinical patterns. Onkologie (2009) 32(11):655–60. doi: 10.1159/000242233
61. Bleotu C, Chifiriuc MC, Grigore R, Grancea C, Popescu CR, Anton G, et al. Investigation of Th1/Th2 cytokine profiles in patients with laryngo-pharyngeal, HPV-positive cancers. Eur Arch Oto-rhino-laryngol (2013) 270(2):711–8. doi: 10.1007/s00405-012-2067-7
62. Green VL, Michno A, Greenman J, Stafford ND. Effect of treatment on systemic cytokines in head and neck squamous cell carcinoma patients. Results Immunol (2011) 2:1–6. doi: 10.1016/j.rinim.2011.12.001
63. Spranger S, Spaapen RM, Zha Y, Williams J, Meng Y, Ha TT, et al. Up-regulation of PD-L1, IDO, and T(regs) in the melanoma tumor microenvironment is driven by CD8(+) T cells. Sci Trans Med (2013) 5(200):200ra116. doi: 10.1126/scitranslmed.3006504
64. Taube JM, Anders RA, Young GD, Xu H, Sharma R, McMiller TL, et al. Colocalization of inflammatory response with B7-h1 expression in human melanocytic lesions supports an adaptive resistance mechanism of immune escape. Sci Trans Med (2012) 4(127):127ra37. doi: 10.1126/scitranslmed.3003689
65. Theivanthiran B, Yarla N, Haykal T, Nguyen Y-V, Cao L, Ferreira M, et al. Tumor-intrinsic NLRP3-HSP70-TLR4 axis drives premetastatic niche development and hyperprogression during anti-PD-1 immunotherapy. Sci Trans Med (2022) 14(672):eabq7019. doi: 10.1126/scitranslmed.abq7019
66. Ayers M, Lunceford J, Nebozhyn M, Murphy E, Loboda A, Kaufman DR, et al. IFN-γ-related mRNA profile predicts clinical response to PD-1 blockade. J Clin Invest (2017) 127(8):2930–40. doi: 10.1172/JCI91190
67. Higgs BW, Morehouse CA, Streicher K, Brohawn PZ, Pilataxi F, Gupta A, et al. Interferon gamma messenger RNA signature in tumor biopsies predicts outcomes in patients with non–small cell lung carcinoma or urothelial cancer treated with durvalumab. Clin Cancer Res (2018) 24(16):3857–66. doi: 10.1158/1078-0432.CCR-17-3451
68. Deshmane SL, Kremlev S, Amini S, Sawaya BE. Monocyte chemoattractant protein-1 (MCP-1): an overview. J Interferon Cytokine Res Off J Int Soc Interferon Cytokine Res (2009) 29(6):313–26. doi: 10.1089/jir.2008.0027
69. Gao L, Wang F-Q, Li H-M, Yang J-G, Ren J-G, He K-F, et al. CCL2/EGF positive feedback loop between cancer cells and macrophages promotes cell migration and invasion in head and neck squamous cell carcinoma. Oncotarget (2016) 7(52):87037–51. doi: 10.18632/oncotarget.13523
70. Ji W-T, Chen H-R, Lin C-H, Lee J-W, Lee C-C. Monocyte chemotactic protein 1 (MCP-1) modulates pro-survival signaling to promote progression of head and neck squamous cell carcinoma. PloS One (2014) 9(2):e88952. doi: 10.1371/journal.pone.0088952
71. Bussu F, Graziani C, Gallus R, Cittadini A, Galli J, de Corso E, et al. IFN-γ and other serum cytokines in head and neck squamous cell carcinomas. Acta Otorhinolaryngol Italica Organo Ufficiale Della Societa Italiana Di Otorinolaringol E Chirurgia Cervico-facciale (2018) 38(2):94–102. doi: 10.14639/0392-100X-1530
72. Monti P, Leone BE, Marchesi F, Balzano G, Zerbi A, Scaltrini F, et al. The CC chemokine MCP-1/CCL2 in pancreatic cancer progression: regulation of expression and potential mechanisms of antimalignant activity. Cancer Res (2003) 63(21):7451–61.
73. Dehqanzada ZA, Storrer CE, Hueman MT, Foley RJ, Harris KA, Jama YH, et al. Correlations between serum monocyte chemotactic protein-1 levels, clinical prognostic factors, and HER-2/neu vaccine-related immunity in breast cancer patients. Clin Cancer Res An Off J Am Assoc Cancer Res (2006) 12(2):478–86. doi: 10.1158/1078-0432.CCR-05-1425
74. Wichmann G, Körner C, Boehm A, Mozet C, Dietz A. Stimulation by monocyte chemoattractant protein-1 modulates the ex-vivo colony formation by head and neck squamous cell carcinoma cells. Anticancer Res (2015) 35(7):3917–24.
75. Brigati C, Noonan DM, Albini A, Benelli R. Tumors and inflammatory infiltrates: friends or foes? Clin Exp Metastasis (2002) 19(3):247–58. doi: 10.1023/A:1015587423262
76. Mantovani A, Schioppa T, Porta C, Allavena P, Sica A. Role of tumor-associated macrophages in tumor progression and invasion. Cancer Metastasis Rev (2006) 25(3):315–22. doi: 10.1007/s10555-006-9001-7
77. Feng Y, Ye Z, Song F, He Y, Liu J. The role of TAMs in tumor microenvironment and new research progress. Stem Cells Int (2022) 2022:5775696. doi: 10.1155/2022/5775696
78. Peveri P, Walz A, Dewald B, Baggiolini M. A novel neutrophil-activating factor produced by human mononuclear phagocytes. J Exp Med (1988) 167(5):1547–59. doi: 10.1084/jem.167.5.1547
79. Ha H, Debnath B, Neamati N. Role of the CXCL8-CXCR1/2 axis in cancer and inflammatory diseases. Theranostics (2017) 7(6):1543–88. doi: 10.7150/thno.15625
80. Waugh DJJ, Wilson C. The interleukin-8 pathway in cancer. Clin Cancer Res An Off J Am Assoc Cancer Res (2008) 14(21):6735–41. doi: 10.1158/1078-0432.CCR-07-4843
81. Wu D, LaRosa GJ, Simon MI. G protein-coupled signal transduction pathways for interleukin-8. Sci (New York N.Y.) (1993) 261(5117):101–3. doi: 10.1126/science.8316840
82. Jones SA, Wolf M, Qin S, Mackay CR, Baggiolini M. Different functions for the interleukin 8 receptors (IL-8R) of human neutrophil leukocytes: NADPH oxidase and phospholipase D are activated through IL-8R1 but not IL-8R2. Proc Natl Acad Sci United States America (1996) 93(13):6682–6. doi: 10.1073/pnas.93.13.6682
83. Fousek K, Horn LA, Palena C. Interleukin-8: A chemokine at the intersection of cancer plasticity, angiogenesis, and immune suppression. Pharmacol Ther (2021) 219:107692. doi: 10.1016/j.pharmthera.2020.107692
84. Brabletz T, Kalluri R, Nieto MA, Weinberg RA. EMT in cancer. Nat Rev Cancer (2018) 18(2):128–34. doi: 10.1038/nrc.2017.118
85. Xiao P, Long X, Zhang L, Ye Y, Guo J, Liu P, et al. Neurotensin/IL-8 pathway orchestrates local inflammatory response and tumor invasion by inducing M2 polarization of Tumor-Associated macrophages and epithelial-mesenchymal transition of hepatocellular carcinoma cells. OncoImmunology (2018) 7(7):e1440166. doi: 10.1080/2162402X.2018.1440166
86. Tong H, Ke J-Q, Jiang F-Z, Wang X-J, Wang F-Y, Li Y-R, et al. Tumor-associated macrophage-derived CXCL8 could induce ERα suppression. HOXB13 Endometrial Cancer Cancer Lett (2016) 376(1):127–36. doi: 10.1016/j.canlet.2016.03.036
87. Veltri RW, Miller MC, Zhao G, Ng A, Marley GM, Wright GL, et al. Interleukin-8 serum levels in patients with benign prostatic hyperplasia and prostate cancer. Urology (1999) 53(1):139–47. doi: 10.1016/S0090-4295(98)00455-5
88. Zhang G, Gomes-Giacoia E, Dai Y, Lawton A, Miyake M, Furuya H, et al. Validation and clinicopathologic associations of a urine-based bladder cancer biomarker signature. Diagn Pathol (2014) 9:200. doi: 10.1186/s13000-014-0200-1
89. Steele CW, Karim SA, Leach JD, Bailey P, Upstill-Goddard R, Rishi L, et al. CXCR2 inhibition profoundly suppresses metastases and augments immunotherapy in pancreatic ductal adenocarcinoma. Cancer Cell (2016) 29(6):832–45. doi: 10.1016/j.ccell.2016.04.014
90. Sanmamed MF, Perez-Gracia JL, Schalper KA, Fusco JP, Gonzalez A, Rodriguez-Ruiz ME, et al. Changes in serum interleukin-8 (IL-8) levels reflect and predict response to anti-PD-1 treatment in melanoma and non-small-cell lung cancer patients. Ann Oncol Off J Eur Soc Med Oncol (2017) 28(8):1988–95. doi: 10.1093/annonc/mdx190
91. Du J, He Y, Li P, Wu W, Chen Y, Ruan H. IL-8 regulates the doxorubicin resistance of colorectal cancer cells. Modulation Multidrug Resistance (MDR1) Cancer Chemother Pharmacol (2018) 81(6):1111–9. doi: 10.1007/s00280-018-3584-x
92. Cheng Y, Ma X-L, Wei Y-Q, Wei X-W. Potential roles and targeted therapy of the CXCLs/CXCR2 axis in cancer and inflammatory diseases. Biochim Biophys Acta Rev Cancer (2019) 1871(2):289–312. doi: 10.1016/j.bbcan.2019.01.005
93. Zhai J, Shen J, Xie G, Wu J, He M, Gao L, et al. Cancer-associated fibroblasts-derived IL-8 mediates resistance to cisplatin in human gastric cancer. Cancer Lett (2019) 454:37–43. doi: 10.1016/j.canlet.2019.04.002
94. Yang X, Chu Y, Wang Y, Zhang R, Xiong S. Targeted in vivo expression of IFN-gamma-inducible protein 10 induces specific antitumor activity. J Leukocyte Biol (2006) 80(6):1434–44. doi: 10.1189/jlb.0306212
95. Bhardwaj M, Schöttker B, Holleczek B, Benner A, Schrotz-King P, Brenner H. Potential of inflammatory protein signatures for enhanced selection of people for lung cancer screening. Cancers (2022) 14(9):2146. doi: 10.3390/cancers14092146
96. Lesinski GB, Nannapaneni S, Griffith CC, Patel M, Chen W, Chen Z, et al. Interleukin-6/STAT3 signaling is prominent and associated with reduced overall survival in p16 negative oropharyngeal squamous cell carcinoma. Head Neck Pathol (2019) 13(3):304–12. doi: 10.1007/s12105-018-0962-y
97. Bu LL, Yu GT, Wu L, Mao L, Deng WW, Liu JF, et al. STAT3 induces immunosuppression by upregulating PD-1/PD-L1 in HNSCC. J Dental Res (2017) 96(9):1027–34. doi: 10.1177/0022034517712435
Keywords: immune checkpoint inhibitor-blockade (ICB), programmed-death 1 (PD-1), head and neck squamous cell carcinoma (HNSCC), liquid biopsy, cytokine expression pattern (CEP), interferon gamma (IFN-γ), outcome research, overall survival
Citation: Röhl L, Wellhausen J, Berszin M, Krücken I, Zebralla V, Pirlich M, Wiegand S, Dietz A, Wald T and Wichmann G (2023) Immune checkpoint blockade induced shifts in cytokine expression patterns in peripheral blood of head and neck cancer patients are linked to outcome. Front. Immunol. 14:1237623. doi: 10.3389/fimmu.2023.1237623
Received: 09 June 2023; Accepted: 12 September 2023;
Published: 02 October 2023.
Edited by:
Lekh N Dahal, University of Liverpool, United KingdomReviewed by:
Rebecca Kesselring, University of Freiburg Medical Center, GermanyKhiyam Hussain, University of Oxford, United Kingdom
Copyright © 2023 Röhl, Wellhausen, Berszin, Krücken, Zebralla, Pirlich, Wiegand, Dietz, Wald and Wichmann. This is an open-access article distributed under the terms of the Creative Commons Attribution License (CC BY). The use, distribution or reproduction in other forums is permitted, provided the original author(s) and the copyright owner(s) are credited and that the original publication in this journal is cited, in accordance with accepted academic practice. No use, distribution or reproduction is permitted which does not comply with these terms.
*Correspondence: Gunnar Wichmann, R3VubmFyLldpY2htYW5uQG1lZGl6aW4udW5pLWxlaXB6aWcuZGU=
†These authors have equally contributed to this work and share senior authorship