 Carolina Vollmer1,2†Aleida Dias2,3†Marisa Sales2,3Priscila M. Sacramento2Júlio Cesar Silva2Hugo A. A. Oyamada2,3Ulisses C. Linhares4Sudhir Gupta5
 Taissa M. Kasahara2
 Cleonice A. M. Bento1,2,3*
- 1Post-graduate Program in Cellular and Molecular Biology, Federal University of the State of Rio de Janeiro, Rio de Janeiro, Brazil
- 2Department of Microbiology and Parasitology, Federal University of the State of Rio de Janeiro, Rio de Janeiro, Brazil
- 3Post-graduate Program in Microbiology, University of the State of Rio de Janeiro, Rio de Janeiro, Brazil
- 4Department of Morphological Sciences, Federal University of the State of Rio de Janeiro, Rio de Janeiro, Brazil
- 5Department of Medicine, University of California, Irvine, Irvine, CA, United States
Introduction: Obesity can complicate IgE-mediated allergic diseases. In the present study, we aimed to investigate the ability of obesity-related concentrations of leptin to modulate the in vitro effector and regulatory Fel d1-specific CD4+ T-cell subsets in patients allergic to cat, considered the third most common cause of respiratory allergy in humans.
Methods: For this study, plasma and peripheral blood mononuclear cells (PBMC) from 30 cat-allergic patients with mild, moderate and severe respiratory symptoms were obtained. The PBMC cultures were stimulated with Fel d1 antigen (10 µg/mL) in the presence or absence of obesity-related leptin dose (50 ηg/mL). After 6 days, the levels of cytokines and IgE in the supernatants were evaluated by multiplex and ELISA, respectively. The frequency of different non-follicular (CXCR5-) and follicular (CXCR5+) Fel d1-specific CD4+ T cell subsets was determined by flow cytometry. The plasma levels of leptin and IgE anti-cat titers were evaluated by ELISA and ImmunoCAP, respectively.
Results and conclusions: Fel d1 induced both IgE production and release of cytokines related to Th2, Th9 and Th17 cell phenotypes. Feld1 was more efficient in increasing the frequency of TFHIL-21- cells positive for IL-4, IL-5 and IL-13 than TFHIL-21+ cell subsets. Leptin favored the expansion Th2-like and Th9-like cells and TFHIL-21- cells positive for IL-4, IL-5 and IL-13, but reduced the proportion of conventional (Treg/Tr-1) and follicular (TFR) regulatory CD4+ T-cell subsets expressing or not CD39 marker. Finally, many of the imbalances between Fel d1-specific CD4+ T-cells were also correlated with plasma leptin and anti-Fel d1 IgE titers. In summary, hyperleptinemia should negatively impact on the severity of cat allergies by favoring the expansion of pathogenic Fel d1-specific CD4+ T-cell phenotypes and damaging the functional status of regulatory CD4+ T-cell subsets.
1 Introduction
Cat allergies are the most common mammalian‐origin allergy in humans, affecting approximately 1 in 5 adults worldwide (1, 2). The most common clinical presentations in these patients are rhinitis, asthma, and/or conjunctivitis. When persistent, the clinical symptoms may impair quality of life (3, 4). Furthermore, severely allergic patients may present an anaphylactic reaction, requiring emergency medical care. Although eight allergens derived from cats have been described, designated Fel d1 to d8, only Fel d1 has clinical significance, accounting for up to 96% of allergic sensitization to cats in humans (5, 6). Primarily produced by salivary and sebaceous glands (5). Fel d1 can easily become and remain airborne in dander and dust particles for extended periods (5, 6).
The hallmark of cat sensitization and symptom severity is the production of high‐affinity Fel d1-specific IgE (6, 7). Although Th2 cytokines, IL-4 and IL-13, can increase IgE production, the synthesis of this antibody is critically dependent on B cell collaboration with follicular helper T (TFH) cells (8). TFH cells are specialized CD4+ T cells that provide help to B cells activation into germinal center (GC) of lymphoid follicles. In the GC, TFH cells are characterized by high expression of CXCR5, programmed cell death protein (PD-1), B cell lymphoma 6 (Bcl-6), and IL-21 production (9). The main function of CXCR5 is to guide TFH cells migration towards lymphoid follicles in response to its ligand, the CXCL13, abundantly produced by GC-derived B cells (9). On the other hand, IL-21 from TFH cells not only mediate the selection of high-affinity and isotype switched B cells, but also promote differentiation of these lymphocytes into plasma cells and memory B cells (9). Although TFH cells in peripheral blood are Bcl-6 negative and express low PD-1 levels, they are able to induce antibody production from peripheral B cells (9). Based on cytokines, human circulating TFH cells have been classified as TFH1 (IL-21+IFN-γ+), TFH2 (IL-21+IL-4+), TFH17 (IL-21+IL-17+) and, more recently, TFH13 (IL-21lowL-4hiIL-5hiIL-13hi) (8).
Many studies have demonstrated the involvement of TFH2 cells in the pathogenesis of allergic IgE-mediated airway diseases (10–16). In patients suffering from allergic rhinitis and asthma, elevated frequency of circulating TFH2 has been associated with plasma IgE titers and clinical exacerbation (10–14). Moreover, the expansion of TFH2 cells inside the airways of allergic patients appear to promote IgE production by local activated B cells, which may play an important role in mast cells and eosinophil activation (15, 16).
Interestingly, more recent studies have demonstrated that, while TFH2 cells induce low-affinity IgE production, the synthesis of high-affinity IgE to allergens critically depends on TFH13 cells (8, 17). The binding of high-affinity IgE/allergen to FcεRI on mast cells and basophils immediately triggers histamine release, quickly causing a cluster of typical cat allergic symptoms (18). Further, in addition to mast cells, eosinophils activated by the same Fel d1/IgE complexes contribute to allergy pathogenesis by producing lager amounts of leukotrienes (LTC4, LTD4, and LTE4) and platelet-activating factor (PAF), pro-inflammatory lipids that induce local vasodilatation, edema, neurogenic stimulation, smooth muscle contraction and hypersecretion of mucus (19). Moreover, IL-9-secreting CD4+ T (Th9) cells have also been implicated in atopic allergy (20). IL-9 prolongs the survival of mast cells, potentiates IgE production and amplifies the ability of IL-5 and IL-13 to increase eosinophil survival and mucus production (20).
As well as inducing the Th2/TFH2/TFH13 axis, the severity of IgE-mediated allergies has been associated with functional impairment of non-follicular [Treg (CXR5-FoxP3+IL-10+) and Tr-1 (CXCR5-FoxP3-IL-10+)] and follicular [TFR (CXCR5+ FoxP3+IL-10+)] regulatory CD4+ T cells (21, 22). While TFR cells control IgE production by B cells in GCs, Treg and Tr-1 cells are essential to reducing inflammatory cytokine release by local mast cells, eosinophils and Th2 cells (21, 22). Therefore, any adverse event that favors Th2/TFH cell expansion and damages regulatory CD4+ T cell phenotypes should affect the severity of atopic diseases, such as obesity.
Obesity has been related to severity of allergy symptoms and to higher levels of total and allergen-specific IgE in atopic individuals (23, 24). In cat allergic patients, obesity was associated with total and allergen-specific IgE levels (25). This adverse relationship must be, at least partially, associated with high leptin production, an adipokine known to modulate the functional status of T cells (26).
Leptin is a 16 kDa peptide encoded by the OB gene. At physiological concentrations, leptin plays an adjuvant role in the immune response against different pathogens (27). However, hyperleptinemia, as observed in obese individuals, has been correlated with the severity of allergic reactions (28). Ciprandi et al. (29) demonstrated a direct relationship between IgE titers and eosinophil counts with leptin levels in patients with allergic rhinitis. With regard to CD4+ T cell phenotypes, studies published by our group performed in patients with allergic asthma (AA) have found a positive correlation between plasma leptin levels and circulating Th2- and Th17-like cells able to produce high levels of IL-5, IL-6 and IL-17 in response to mitogen (30, 31). In addition, the frequency of these pro-inflammatory CD4+ T cell subsets were directly associated with lung function impairment (31). Still according to our previous study, in CD4+ T cell cultures from lean AA patients, obesity-related leptin concentration enhanced Th2- and Th17-related cytokine production and impaired Treg function in response to polyclonal activators (31). However, studies regarding the effects of leptin on the composition of different allergen-specific CD4+ T-cells have not been conducted to date. Therefore, the main objective of the present study was to investigate the ability of obesity-related leptin doses to modulate the in vitro different effector and regulatory Fel d1-specific CD4+ T cells from patients with persistent cat allergies.
2 Materials and methods
2.1 Subjects
Thirty patients with allergic rhinitis (AR) and/or asthma (AA) to cat dander were recruited from March 2020 to September 2021 from the Federal University of the State of Rio de Janeiro Hospital/UNIRIO (Rio de Janeiro, Brazil). All patients had a skin-prick test and IgE positive for cat dander extract (Table 1). Since AA is a disorder characterized by inflammation of the airways and recurrent episode of breathing difficulties triggered by allergens, among our patients, persistent AA was diagnosed by a history of recurrent wheezing, dyspnea and chest tightness, and confirmed by methacholine bronchial hyperresponsiveness, when FEV1 was ≥ 70%, or bronchial reversibility after salbutamol inhalation (when FEV1 was <70%). According to daily frequency, severity of clinical exacerbation, lung function damage and need to hospital admission, AA is classified as mild, moderate or severe (21). Also, interference in daily activities is also taken into account (21). With regard to AR, symptom severity was determined by using the total nasal symptom score (TNSS), which is calculated as the sum of scores for each of nasal congestion, sneezing, nasal itching, and rhinorrhea at each time point, using a four point scale (0–3), where 0 indicates no symptoms, 1 for mild symptoms, 2 for awareness of symptoms (but tolerable), and score 3 for severe symptoms that are hard to tolerate and interfere with daily activity (32) (Table 1). We excluded patients taking oral or intravenous steroids, theophylline, long-acting β2-agonists, leukotriene antagonists or antihistamines 1 month prior to the study. As control group, twenty healthy subjects (HS), matched for age and sex and with no history of allergic diseases, were also recruited into the study. According to the body mass index (BMI), subjects were stratified as lean (BMI from 18.5 to 24.9), overweight (BMI from 25 to 29.9) and class I obesity (BMI from 30 to 35). Regardless of experimental group, smoking individuals and those with history of upper or lower airway infectious disease 2 months prior to recruitment were also excluded of the study. The Ethics Committee for Research on Human Subjects at the Federal University of the State of Rio de Janeiro (CAAE 44951215.6.0000.5258), approved the study, and blood was collected only after written informed consent was obtained from each individual.
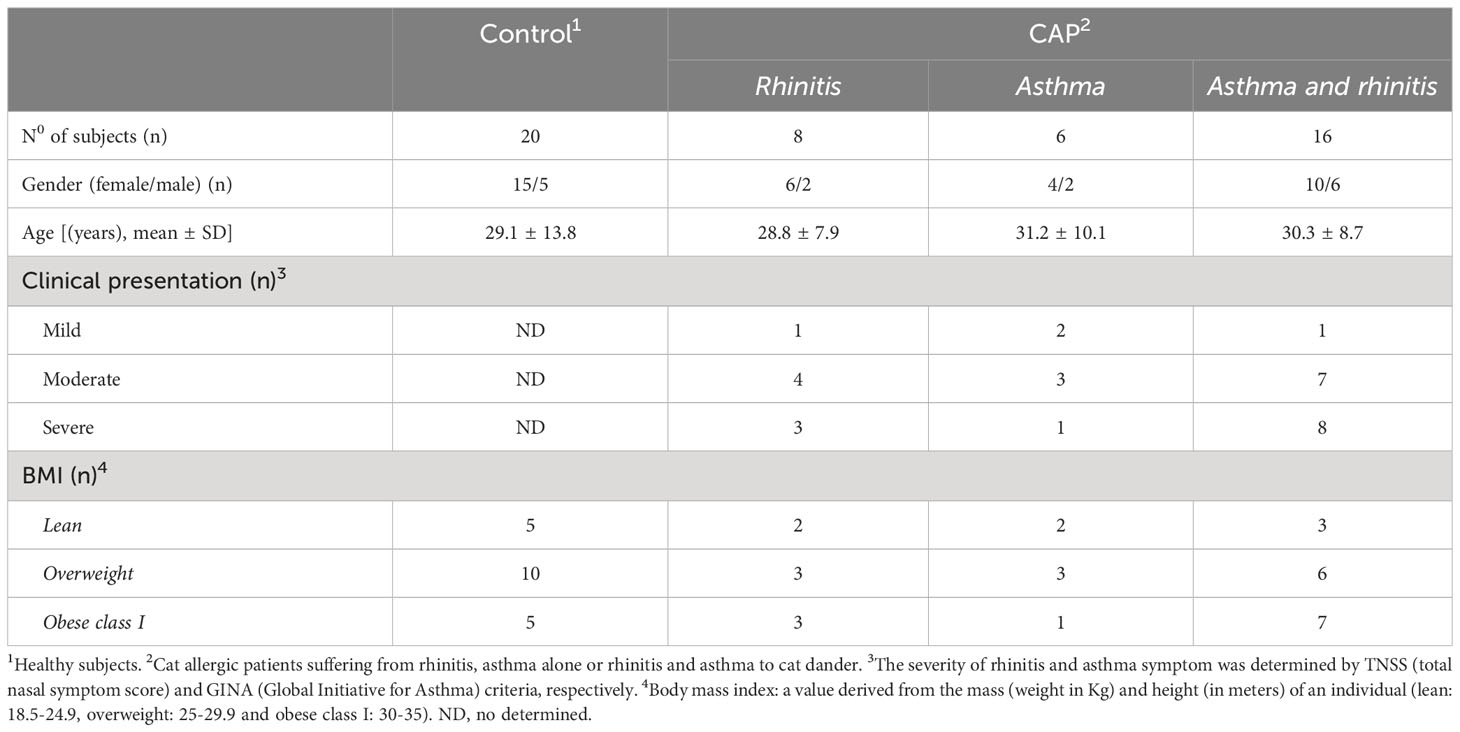
Table 1 The characteristics of subjects.
2.2 Cell cultures
Peripheral blood was collected in heparin-containing tubes (BD Vacutainer, Franklin Lakes, NY) and peripheral blood mononuclear cells (PBMC) were obtained by centrifugation on the Ficoll–Hypaque density gradient. Fresh viable PBMCs (1 × 10⁶/mL) were cultured in 24-well flat-bottomed microplates with 2 mL of RPMI medium (ThermoFisher Scientific Inc.) supplemented with 2 μM of L-glutamine (GIBCO, Carlsbad, CA, USA), 10% fetal calf serum, 20 U/mL of penicillin, 20 μg/mL of streptomycin and 20 mM of HEPES buffer. As positive control, PBMC cultures were stimulated with phytohaemaglutinine (PHA, 1 µg/mL) (Sigma-Aldrich Co) for 3 days in a humidified 5% CO2 incubator. In order to evaluate the antigen-specific response, the cells were stimulated with Fel d1 (10 µg/mL) (MyBioSource, San Diego, CA, USA) for 6 days. This concentration of Fel d1 was chosen from a previous study that evaluated T cell response to this antigen (6). In these cultures, the role of leptin (Sigma-Aldrich Co) was determined after the addition of 50 ng/mL of this adipokine. This leptin concentration was determined after a dose-response curve (10, 50 and 100 ng/mL) of cytokine-secreting CD4+ T cells from healthy subjects (HS) and cat-allergic patients (CAP) in PBMC cultures activated with PHA (1 µg/mL) (Sigma-Aldrich Co) (Figure S1). Notably, this leptin concentration is related to the levels of this adipokine in obese subjects (33). After 6 days of culturing, the supernatants were collected, frozen at -20°C for further analysis of cytokine production (Luminex) and IgE levels (ELISA). The PBMC was also used to identify different CD4+ T cell phenotypes using flow cytometry.
2.3 Flow cytometry analysis
Different CD4+ T cell subsets in response to Fel d1 were identified by staining the PBMCs with mouse anti-human monoclonal antibodies (mAbs) for CD3-APC-H7 (SK7 clone), CD4-BV605 (T4 clone), CXCR5-PerCP.eF710 (mu5ubee clone), PD-1-APC (MIH4 clone), CD39-FITC (TU66 clone), FoxP3-PECy5.5 (PGH101 clone), IL-4-PECy7 (8D48 clone), IL-5-eFluor450 (TRFK5 clone), IL-9-BV4211 (MH9A3 clone), IL-10-BV722 (JES3-9D7 clone), IL-13-APC (JES10-5A2 clone), IL-17-AF488 (eBio64DEC17 clone) and IL-21-PE (3A3-N2.1 clone). These mAbs and all isotype control antibodies were purchased from Thermo Fischer (San Diego, CA, USA). Briefly, PBMCs were incubated with various combinations of mAbs for surface markers (CD3, CD4, CXCR5, PD-1, and CD39) for 30 min at room temperature in the dark, according to manufacturer’s instructions. The cells were washed with PBS + 2%FBS, then submitted to permeabilization by incubating the PBMCs with Cytofix/Cytoperm solution (BD Pharmigen, San Diego, CA) at 4°C for 20 min. After washing, the mAbs for intracellular staining (FoxP3, IL-4, IL-5, IL-9, IL-10, IL-13, IL-17, and IL-21) were added in different combinations and incubated for 30 min at 4°C. The stained cells were acquired on Attune NxT flow cytometers (Thermo Fisher Corporation) and analyzed using FlowJo (Tree Star, Inc). Isotype control antibodies and single-stained samples were used to periodically check the settings and gates on the flow cytometer. After acquisition of 200,000 to 300,000 events, lymphocytes were gated based on forward and side scatter properties after the exclusion of dead cells, by using propidium iodide, and doublets.
2.4 Luminex, ImmunoCAP and ELISA assays
The titers of plasma IgE anti-cat was determined by florescence enzyme immunoassay with capsulated cellular polymer solid-phase (ImmunoCAP) coupled with cat dander (REF 14.451201, Therm Fischer Sicentific Inc.) with the detection limit ranging from 0.1 to 100 Ku/L. The cut-off value for IgE positivity was considered 0.35 Ku/L. Circulating leptin levels were measured using a commercial ELISA kit following manufacturer’s instructions (Enzo Life Sciences, Farmingdale, NY). Plates were read at 450 nm in ELISA reader (Dynex Technologies, USA). Lyophilized leptin ranging from 31.3-2000 pg/mL was used to construct the standard curve. The levels of different cytokines and IgE in the supernatants from cell cultures were determined using the “Th1/Th2/Th9/Th17 Cytokine 18-plex human Panel” kit (InvitroGen, San Diego, CA, USA) and human IgE ELISA kit (88-50610-22) (Invitrogen, Thermo Fisher Scientific Co), respectively.
2.5 Statistical analyses
All statistical analyses were conducted using the Prism 8.0 program (GraphPad Software). Comparisons between immune assays in non-stimulated (none) or activated PBMC cultures with Fel d1 and Fel d1/leptin were performed with one-way ANOVA, followed by Tukey test for data with Gaussian distribution, and by Kruskal-Wallis, followed by Dunn’s test for data without Gaussian distribution. The nonparametric Mann-Whitney U test and Student’s t test were applied to determine whether the two groups were statistically different for nonparametric and parametric variables, respectively. Pearson’s and Spearman’s correlation were applied for variables with or without normal distribution, respectively. Significance for all experiments was defined as p<0.05.
3 Results
3.1 Leptin modulates cytokine and IgE production by Fel d1-stimulated PBMCs from cat-allergic patients
Table 1 shows that most cat allergic patients were overweight/obese women who presented moderate or severe symptoms of rhinitis (AR) and asthma (AA). As no statistical difference among patients with different clinical symptoms (AR x AA x AR/AA) was observed with regard to immunological assays, they were all included together as a single patient group (CAP- cat allergic patients). For the control group, some experiments were additionally performed in 20 age- and gender-matched healthy subjects (HS). Higher levels of IL-4, IL-5, IL-6, IL-13 and IL-17 were observed in CAP-derived PBMC cultures containing plolyclonlly-activated T cells, as compared with HS (Figure S2). In those cell cultures, leptin elevated the release of IL-6, IFN-γ and IL-17 in HS group and the secretion of IL-5, IL-6, IL-13 and IL-17 in CAP group. In contrast, this adipokine reduced the levels of IL-10 secreted by mitogen-activated T cells from both experimental groups (Figure S2). Concerning the cytokine profile in response to Fel d1, this major cat antigen induced not only the production of IL-4, IL-5, IL-13, IL-9, IL-6, IL-17, IL-21 and IL-10 (Figure 1A), but also the secretion of IgE (Figure 1B). The addition of leptin increased the release of IL-5, IL-13, IL-6, IL-17, IL-21 (Figure 1A) and IgE (Figure 1B), but reduced IL-10 production (Figure 1A). Of note, neither medium nor leptin alone were not able to induce detectable cytokine (data not shown). Concerning the control group, Fel d1 only significantly elevated the production of IL-10, with no difference after leptin addition (Figure S3). In patients, in vitro IgE production directly correlated with both IL-4 and IL-5, released by Fel d1-stimulated cells (Table 2), and IL-4, IL-5 and IL-9, secreted by Fel d1/Lep-activated PBMC cultures (Table 2). In contrast, in Fel d1/Lep-stimulated cells, IL-10 secretion inversely correlated to IgE (Table 2).

Figure 1 Leptin modulates the cytokine profile and IgE production by PBMCs from cat-allergic patients in response to Fel 1d. PBMC cultures (1 x 10⁶/mL) from cat-allergic patients (n=30) were maintained for 6 days in the presence of culture medium alone (without) or with 10 μg/mL of Fel 1d, with or without 50 ng/mL of leptin (Lep). At the end of the culture time, the supernatants were harvested and the (A) cytokine (IL-4, IL-5, IL-13, IL-6, IL-17, IL-21, IFN-γ and IL-10) and (B) IgE levels were determined by Luminex and ELISA, respectively. Mean values were compared using one-way ANOVA and p values are shown in the graphs. All data are shown as mean ± SD of six independent experiments with 4 and 6 samples per experiment.
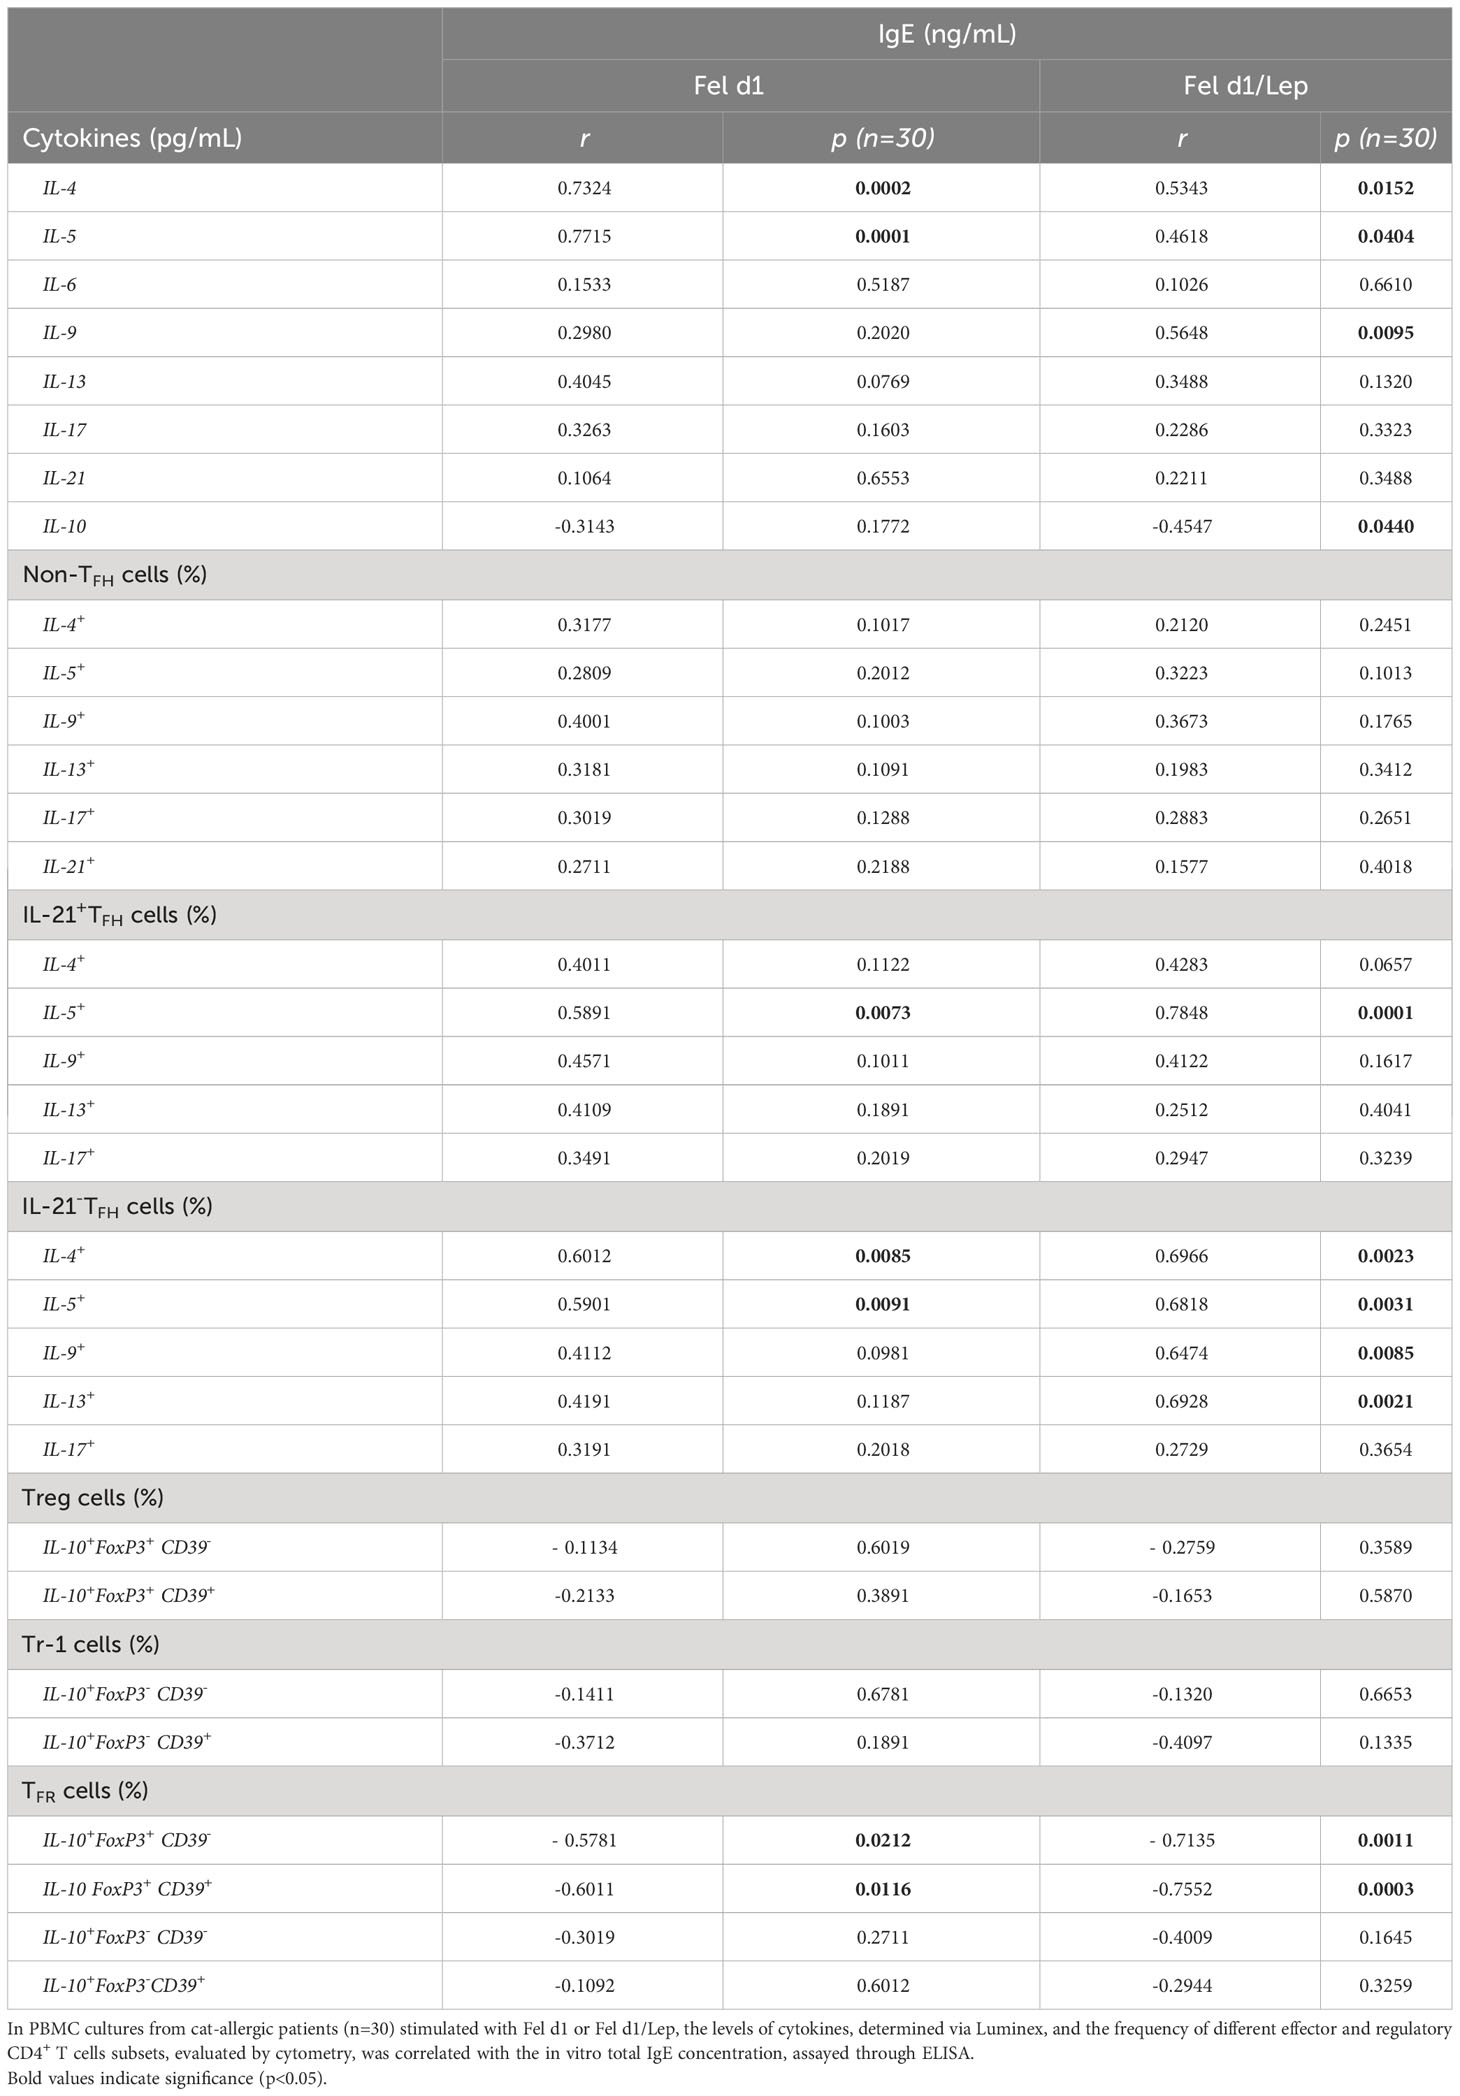
Table 2 Correlation between in vitro total IgE production and cytokine profile in Fel d1-stimulated PBMC cultures from cat-allergic patients.
3.2 Leptin alters the frequency of effector and regulatory Ag-specific CD4+ T cell subsets in CAP
From identification of CXCR5 and PD-1 markers on CD4+ T cells, and using the gating strategy shown in Figure 2A, no difference in the percentage of non-TFH cells (CXCR5-) (Figure 2B), whole TFH (Figure 2B) and TFH PD-1+ (Figure 2C) cells was observed in the cell cultures stimulated with Fel d1, with or without leptin. In contrast, taking into account the representative dot-plots shown in Figure 2D, Fel d1 elevated the proportion of Th2-like cells [IL-4+ (Figure 2E), IL-5+ (Figure 2F) and IL-13+ (Figure 2H)] and Th9 (IL-9+) cells (Figure 2G), with no change in the percentage of Th17-like cells (IL-17+ and IL-21+) (Figures 2I, J). Leptin elevated the frequency of Fel d1-specific Th2-like cells [IL-5+ (Figure 2F) and IL-13+ (Figure 2H)] and Th17-like cells [IL-17+ (Figure 2I)]. With regards to the classical TFH cells (CXCR5+IL-21+), and following the gating strategy shown in Figure 2K, Fel d1 upregulated the proportion of TFHIL-21+IL-17+ (Figure 2P). Notably, Fel d1 more efficiently upregulated the frequency of TFHIL-21- cells positive for IL-4 (Figure 2L), IL-5 (Figure 2M), IL-9 (Figure 2N), and IL-13 in comparison with TFHIL-21+cells (Figure 2O). Leptin not only enhanced the proportion of TFHIL-21+ IL-5+ (Figure 2M) and TFHIL-21+ IL-9+ (Figure 2N), but also that of TFHIL-21- cells positive for IL-4 (Figure 2L), IL-5 (Figure 2M), and IL-13 (Figure 2O). The ability of leptin to upregulate non-TFH and TFH cell phenotypes was observed in cell cultures from lean, overweight and obese patients (data not shown).
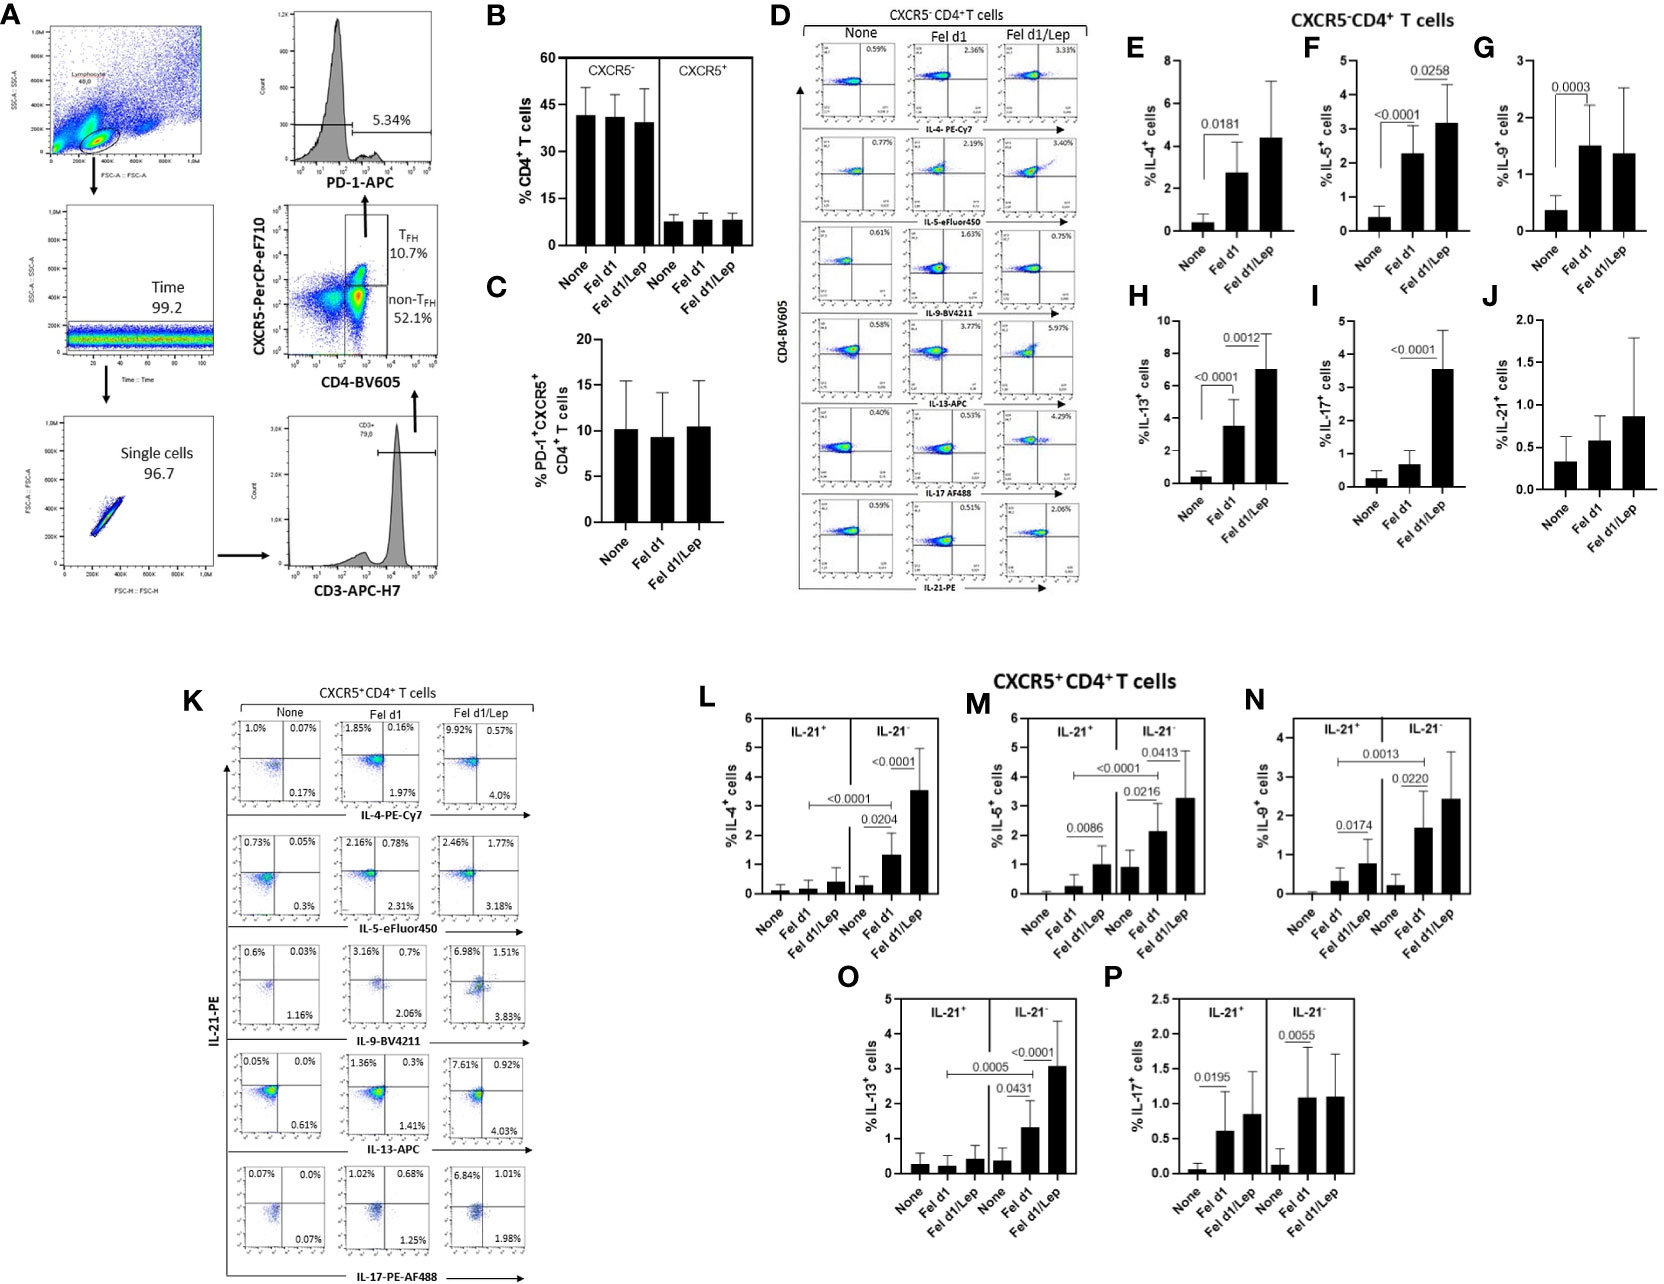
Figure 2 Leptin effect on the frequency of different Fel d1-specific TFH and non-TFH cell subsets in cat-allergic patients. PBMCs (1 x 10⁶/mL) from cat-allergic patients (n=30) were cultured for 6 days in the presence of culture medium alone (none) or with 10 µg/mL Fel 1d, with or without 50 ng/mL leptin (Lep). At the end of the culture time, and adopting the gating strategy shown in graph (A), the mean ± SD of conventional CD4+ T cells (non-TFH, CXCR5-) and total TFH cells (TFH, CXCR5+) (B), as well as the TFHPD-1+ cell subset (C) were analyzed by cytometry. In (D, K), representative dot-plots of cytokine-producing non-TFH and TFH cells were shown, respectively. In (E–J), the mean ± SD of percentage of (E) IL-4+, (F) IL-5+, (G) IL-9+, (H) IL-13+, (I) IL-17+ and (J) IL-21+ among non-TFH cells, while (L-P) showed the mean ± SD values for TFHIL-21+ and TFHIL-21- cells able to produce IL-4 (L), IL-5 (M), IL-9 (N), IL-13 (O), and IL-17 (P). Data are shown as mean ± SD of five independent experiments with 2 and 6 samples per experiment. Significance was calculated using one-way ANOVA and p values are shown in the graphs.
Concerning regulatory T cells, through the expression of FoxP3, IL-10 and CD39 on CD4+ T cells, we determined the impact of leptin on modulating the proportion of Fel d1-specific Treg/Tr-1 cells (Figures 3A–C) and TFR cells (Figures 3D–F). Taking into account the gating strategy shown in Figures 3A, D, Fel d1 increased the proportion of Treg (CXCR5-FoxP3+IL-10+) (Figure 3B) and TFR (CXCR5+FoxP3+IL-10+) (Figure 3E), expressing or not CD39. This allergen also upregulated the frequency of Tr-1 (CXCR5-FoxP3-IL-10+CD39- and CXCR5-FoxP3-IL-10+CD39+) (Figure 3C) and follicular Tr-1-like cells (CXCR5+FoxP3-IL-10+CD39- and CXCR5+FoxP3-IL-10+CD39+) (Figure 3F). Regardless of cell subtype, leptin significantly reduced the proportion of IL-10-secreting CD4+ T cell subsets (Figure 3).
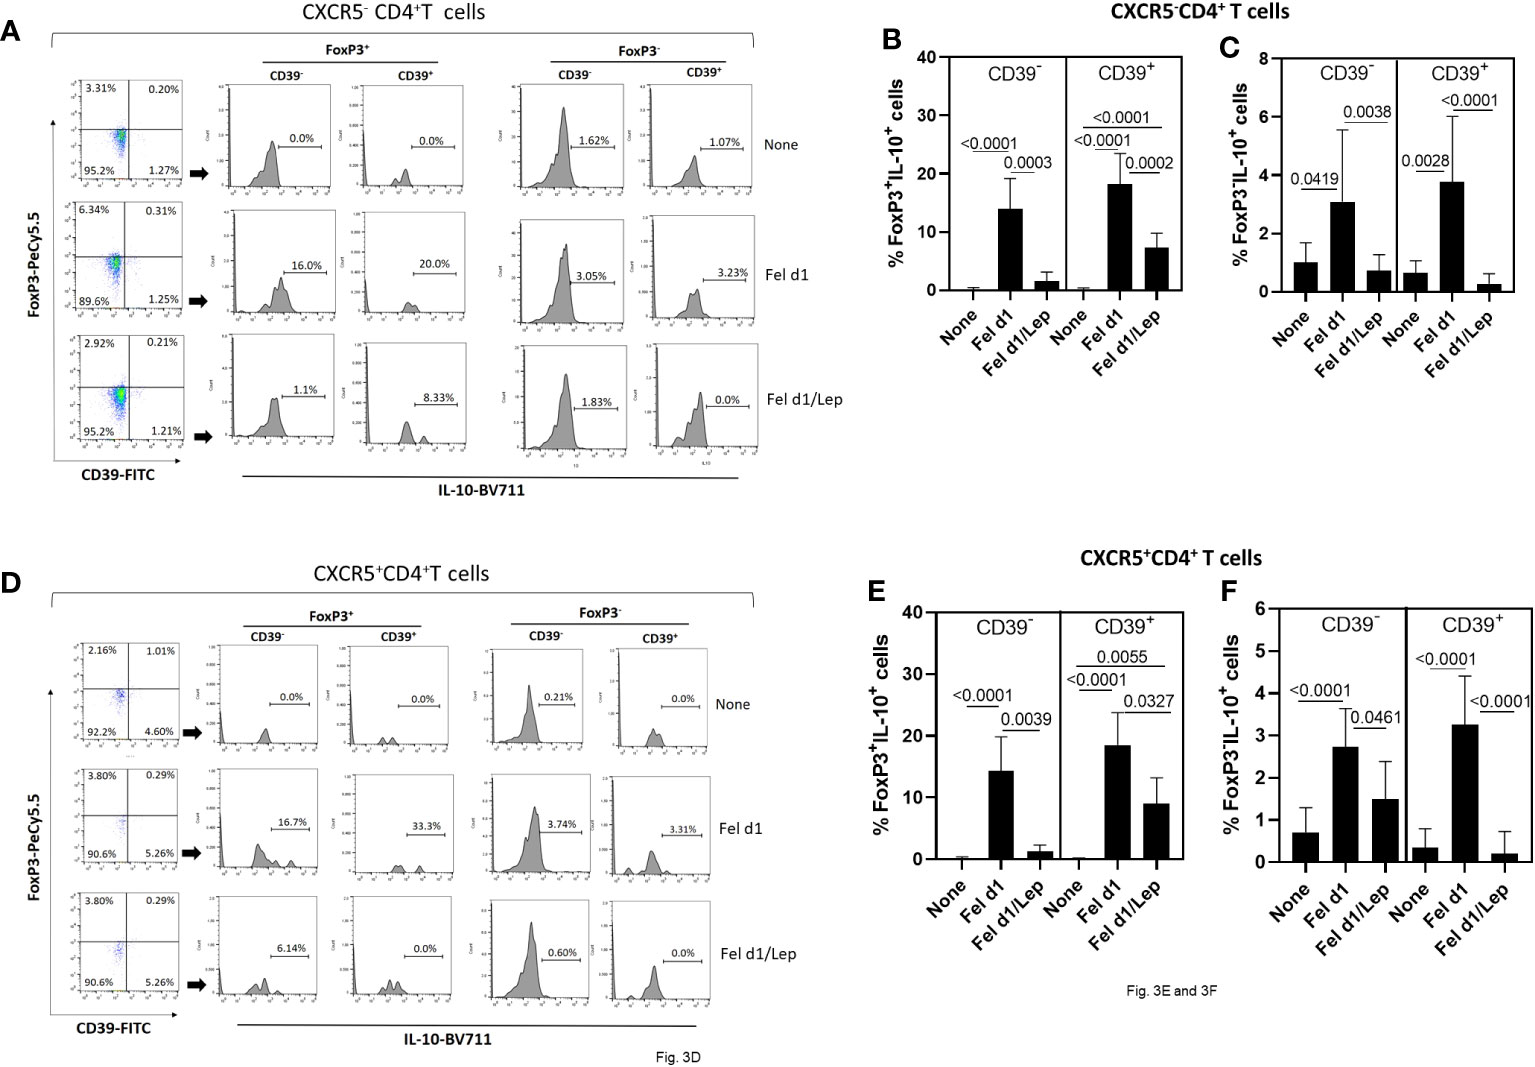
Figure 3 Leptin reduced the frequency of Fel d1-specific Tregs and TFR cell subsets in PBMC cultures from cat-allergic patients. Taking into account the expression of CXCR5, FoxP3, IL-10 and CD39, and following representative dot-plots and histograms shown in graphs (A, D), the frequency of (A) conventional (Tregs/Tr-1, CXCR5-) and (D) follicular (TFR/TFR-1, CXCR5+) regulatory CD4+ T cells was determined in PBMC cultures from cat-allergic patients (n=30) after stimulation for 6 days with Fel d1 and Fel d1/Lep. The mean values ( ± SD) of FoxP3+IL-10+CD39- and FoxP3+IL-10+CD39+ (B, E), and FoxP3-IL-10+CD39- and FoxP3-IL-10+CD39+ (C, F), on Fel D1-specific Treg and TFR cell subsets was determined. Data are shown as mean ± SD of five independent experiments with 2 and 6 samples per experiment. Significance was calculated using one-way ANOVA and p values are shown in the graphs.
In vitro IgE production directly correlated with the percentage of TFHIL-21+IL-5+ and TFHIL-21- positive for IL-4 and IL-5 in Fel d1- and Fel d1/Lep-stimulated cell cultures (Table 2). Similarly, higher IgE production was observed in Fel d1/Lep-activated cell cultures with a higher proportion of TFHIL-21-IL-9+ and IL-21-IL-13+ (Table 2). By contrast, IgE negatively correlated with the proportion of allergen-specific FoxP3+IL-10+ TFR cells that express, or not, CD39 marker, mainly after leptin addition (Table 2). No relationship was observed for the frequency of allergen-specific non-TFH and Treg cells and IgE levels after leptin addition (Table 2).
Finally, according to BMI, higher frequency of Th2-like cells (IL-5+ and IL-13+) (Figure 4A), TFHIL-21+ (IL-5+ and IL-17+) (Figure 4B) and TFHIL-21- cell subsets (IL-5+, IL-9+ and IL-13+) (Figure 4C), was observed in obese patients. Conversely, obesity negatively impacted the ability of Fel d1 to elevate Treg (Figure 4D) and TFR cells (Figure 4E), expressing or not CD39, as well as Tr-1 CD39+ cells (Figure 4D).
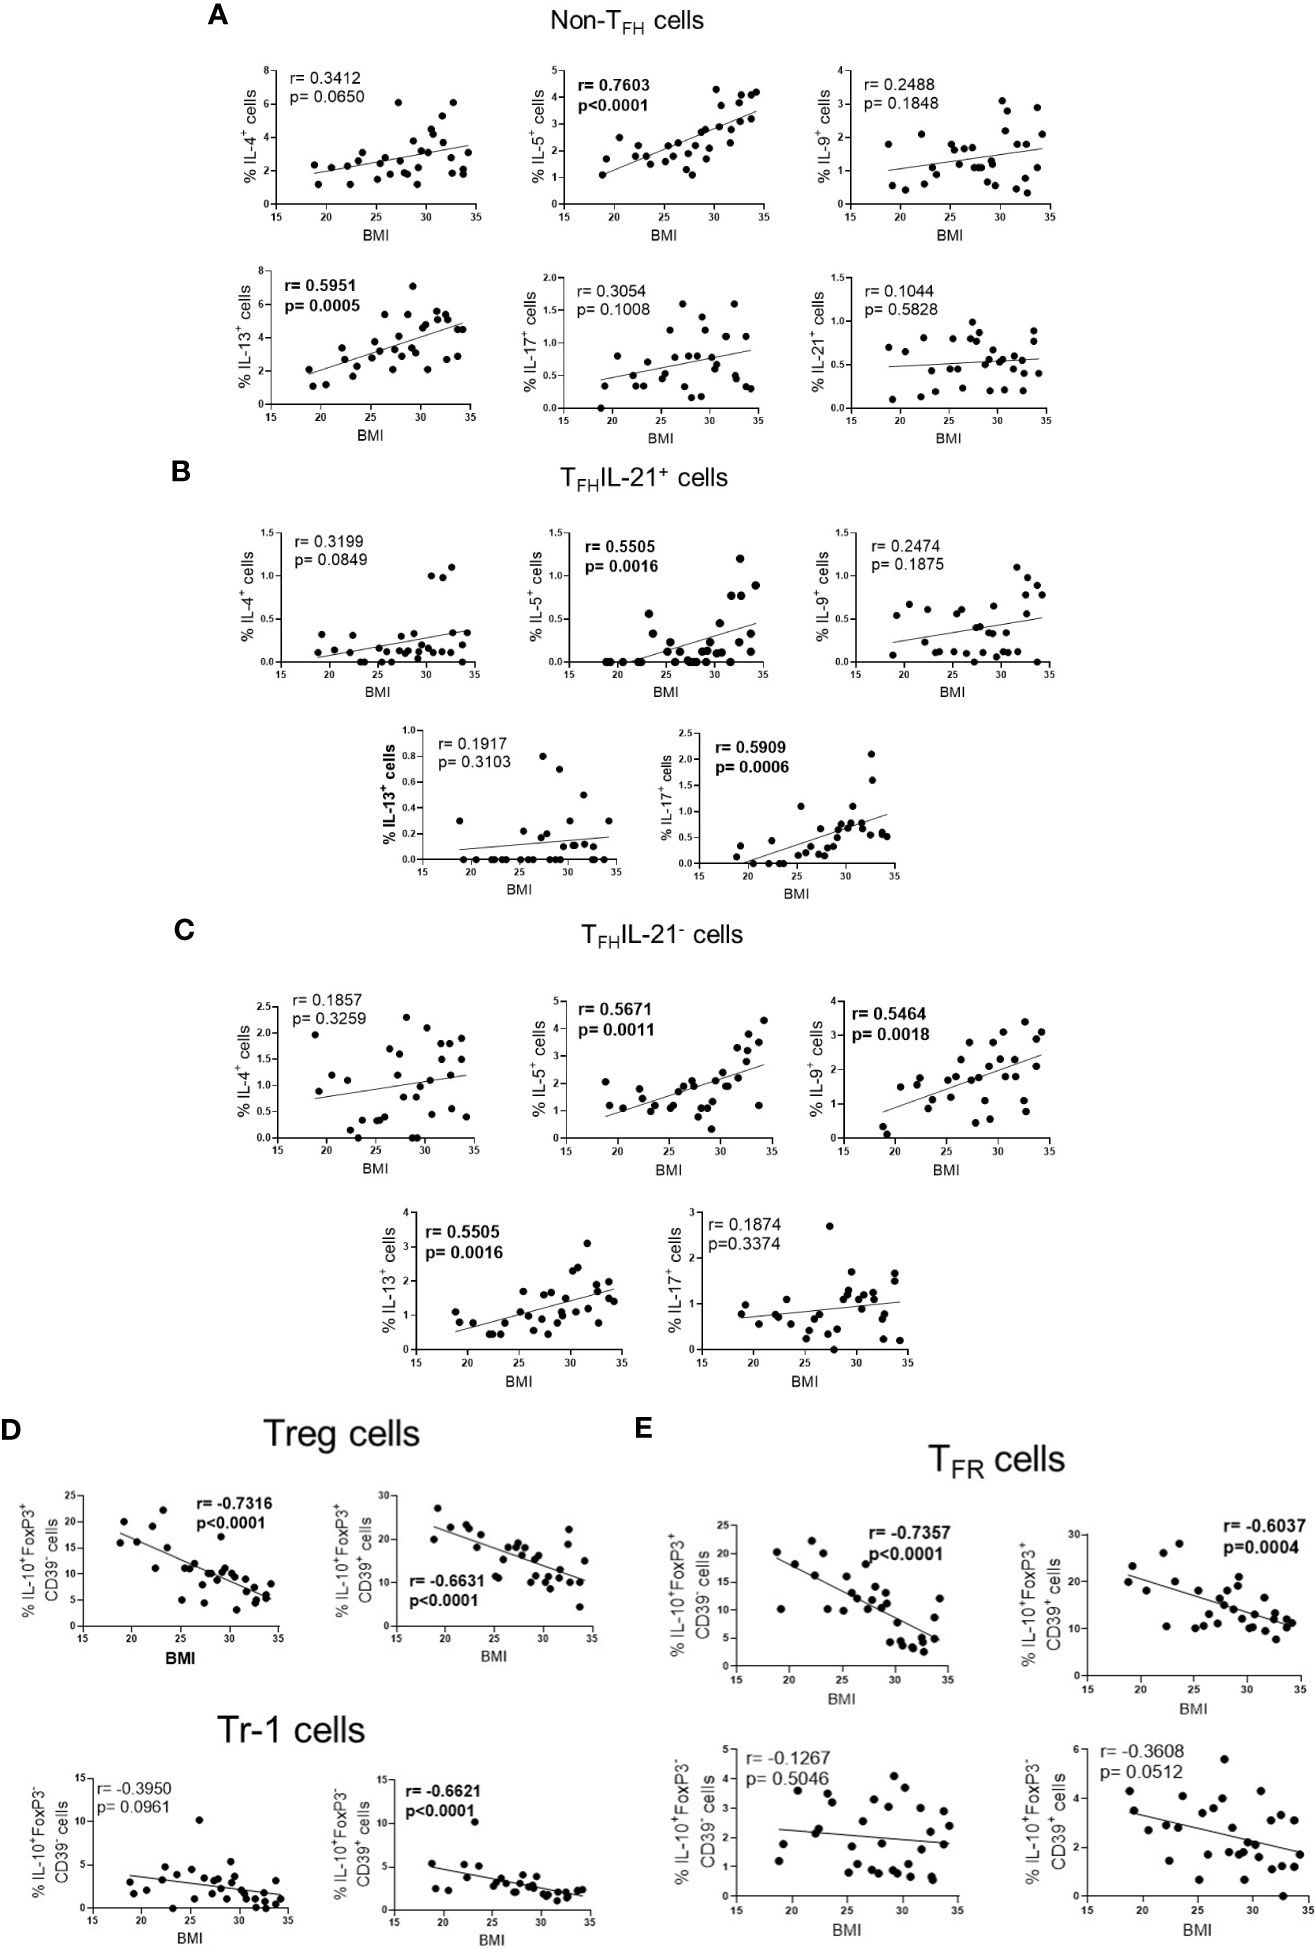
Figure 4 The frequency of effector and regulatory Fel d1-specific CD4+ T cell subsets according BMI. In cat-allergic patients (n=30), the frequency of cytokine-producing non-TFH cells (A), IL-21+ (B) and IL-21- TFH cells (C), as well as Treg/Tr-1 (D) and TFR (E) cells in response to Fel d1 was correlated with BMI by using Pearson’s correlation.
3.3 Correlation between plasma leptin levels, anti-cat IgE titers and the in vitro cytokine profile in CAP.
As demonstrated in Table 3, leptin levels positively correlated with IL-5, IL-6 and IL-17 secretion by Fel d1-stimulated cells, as well as the frequency of both non-TFH (IL-5+, IL-13+ and IL-17+) and TFHIL-21- cells positive for IL-5, IL-9 and IL-13. In contrast, a negative correlation was observed between circulating levels of this adipokine and the proportion of Treg and TFR cells, expressing or not CD39 marker. Moreover, the proportion of CD39+Tr-1 cells inversely correlated with leptin concentration (Table 3). Although no significant correlation was observed between plasma leptin and anti-cat IgE (r=0.4054, p=0.0845), titers of this antibody positively correlated with both IL-5 release and the percentage of TFHIL-21-IL-4+ and IL-21-IL-13+ cells in Fel d1-stimulated PBMC cultures (Table 4). On the other hand, higher levels of this antibody were observed in patients with lower Treg and TFR cell proportions, expressing CD39 or not, and Tr-1 CD39+ cells (Table 4).
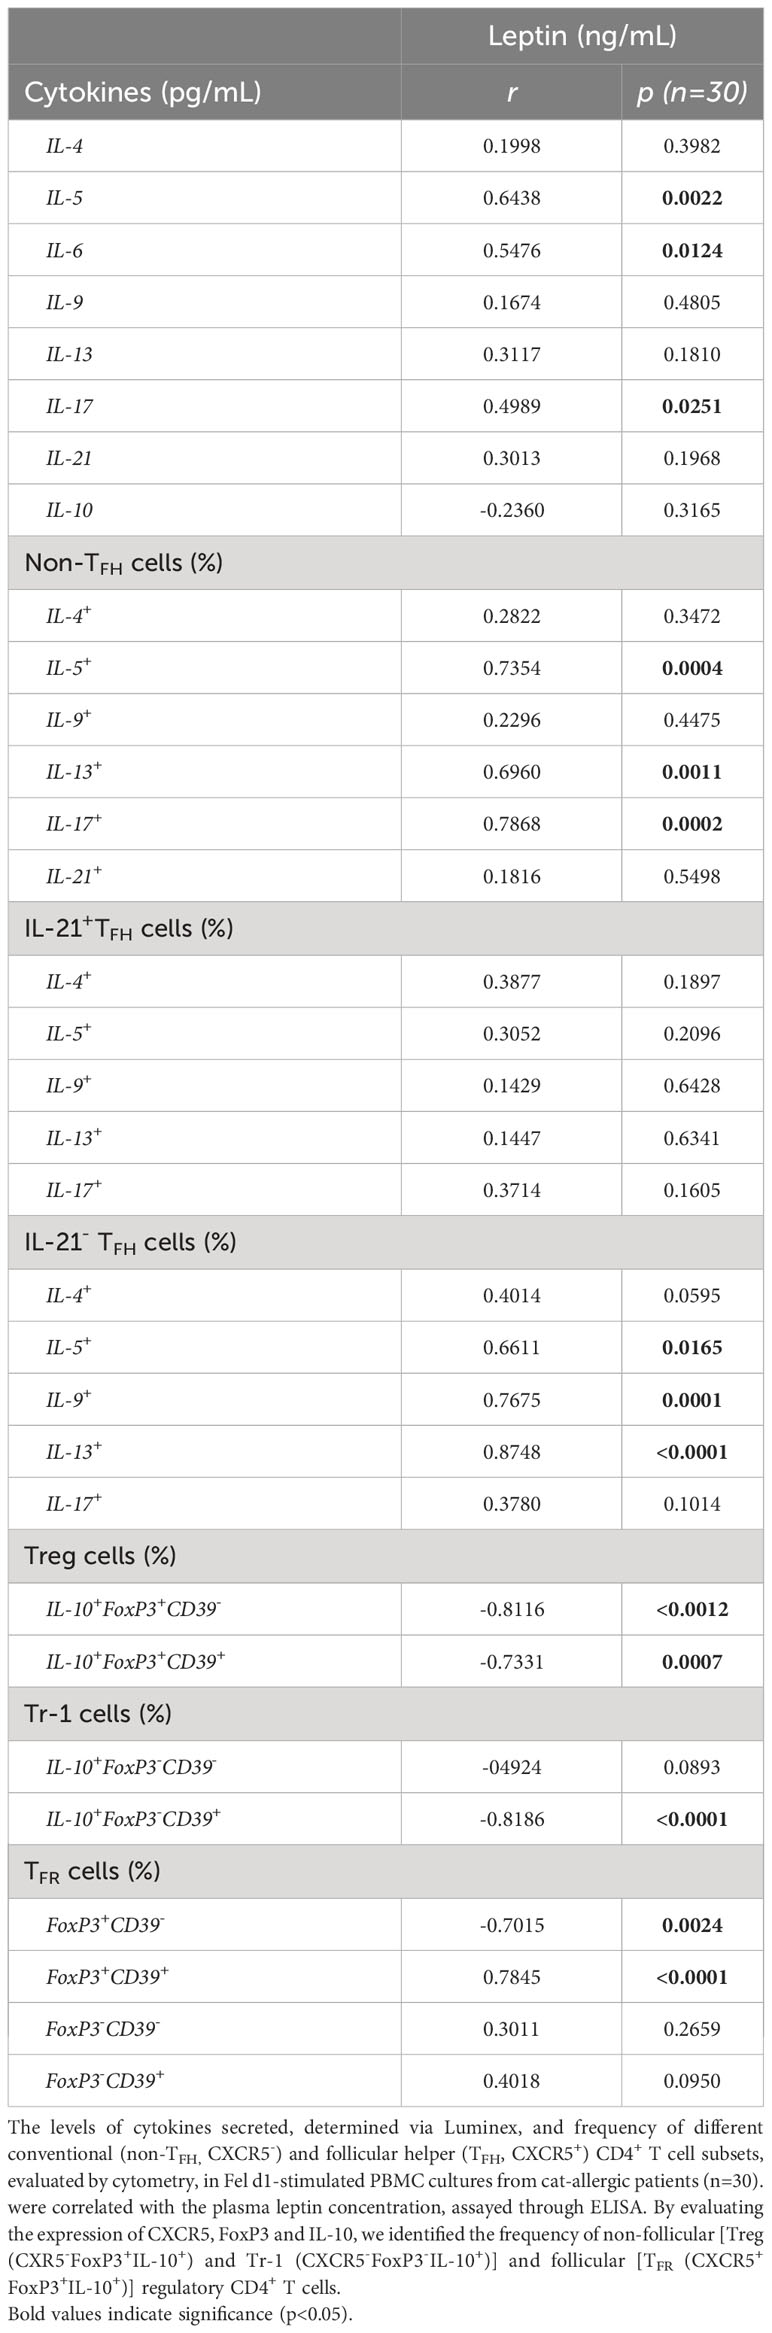
Table 3 Correlation between plasma leptin levels and cytokine profile of cells in Fel d1-stimlated PBMC cultures from cat-allergic patients.
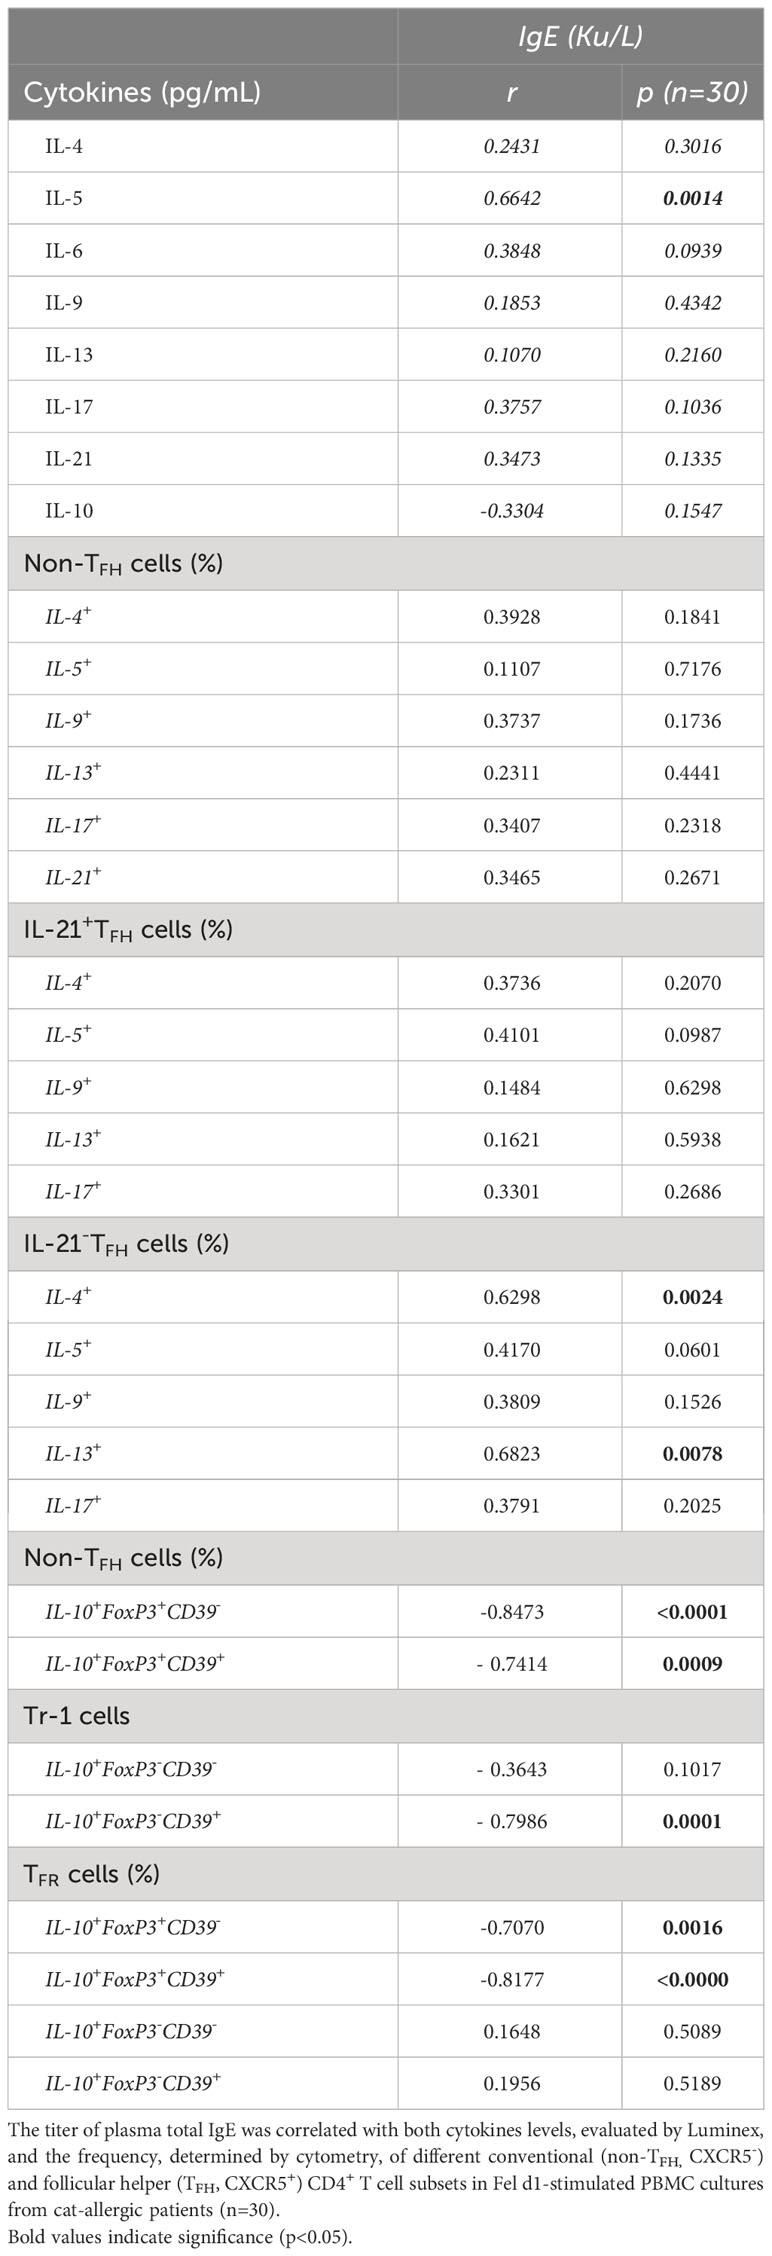
Table 4 Correlation between total IgE titers and cytokine profiles of Fel d1-stimlated PBMC cultures from cat-allergic patients.
4 Discussion
Obesity can complicate IgE atopic diseases (23, 34). Here, in cat allergic patients, this adverse relationship should involve, at least in part, increased leptin production that promotes an imbalance between different CD4+ T cell phenotypes specific to Fel d1, the major cat allergen.
In the present study, Fel d1 not only increased the production of cytokines related to Th2 and Th9 cells, but also the proportion of antigen-specific TFH cell subsets, mainly IL-21-IL-4+, IL-21-IL-5+ and IL-21-IL-13+. Despite the small sample size in this study, a higher percentage of Fel d1-specific Th2-like cells and TFH2/TFH13 cell phenotypes was observed among obese patients and directly correlated with plasma leptin levels. In vitro, this adipokine directly favored the expansion of Fel d1-specific Th2- and Th9-related phenotypes, as well as elevated the percentage of TFHIL-21+ (IL-5+ and IL-9+) and TFHIL-21- (IL-4+, IL-5+ and IL-13+) cell subsets. Additionally, leptin elevated IgE production. This finding agrees with a study that demonstrated a direct relationship between leptin levels and IgE production in atopic patients (25). Regarding cell phenotypes, IgE levels in PBMC cultures stimulated with Fel d1/Lep directly correlated with the frequency of TFHIL-21+IL-5+ and THFIL-21- negative for IL-4, IL-5, IL-13 and IL-9, but not Th2-like cells. Furthermore, plasma titers of anti-Fel d1 IgE positively correlated with TFHIL-21- positive for IL-5 and IL-13. This finding agrees with studies that demonstrate that TFH cells, but not Th2 cells, are critical for IgE production (8, 17). Among TFH cells, while the TFH2 cell subset induces the production of low-affinity IgE (8). the TFH13 cell subset is responsible for producing high-affinity IgE (17). TFH13 cells are characterized by high IL-4, IL-5 and IL-13 expression associated with very low IL-21 production (25). Yang et al. (35) demonstrated that IL-21 inhibits IgE class-switch recombination in human B cells. Although we did not evaluate either TFH cells that simultaneously express IL-4, IL-5 and IL-13, nor IgE affinity, we believe that the ability of leptin to increase the frequency of Fel d1-specific TFHIL- 21- able to produce Th2-related cytokines is one of the mechanisms that this adipokine uses to intensify cat allergy severity. Indeed, the formation of high affinity IgE : FcϵRI complexes on mast cells, by activating Lyn/Syk/LAT-1 axis, promotes intense and immediate histamine release and leukotriene synthesis (18, 35, 36), resulting in associated allergic symptoms, such as airway constriction, increased mucus production, and coughing.
Despite not directly inducing IgE production, Th2 cytokines participate in the pathogenesis of atopic allergic reactions. IL-4 and IL-13 amplify eosinophil and Th2 cell transmigration to the allergen exposure site (37). IL-5 is responsible for increasing eosinophil formation and survival (38). IL-13 increases B cell survival (18) and compromises respiratory function by increasing mucus production in the airways (39). Therefore, leptin ability to increase the frequency of Fel d1-specific Th2-like cells should impact the severity of allergic reactions to cats. Indeed, leptin, by potentiating Th2-mediated response, has been associated with atopic diseases (40). Moreover, here, leptin also favored expansion of Fel d1-specific Th9-like cells. IL-9, along with IL-5 and IL-13, prolong mast cell and eosinophil survival, and increase mucus production (20, 41). Interestingly, despite the lack of data about human TFH9 cells, in murine allergy models, these cells support memory IgE+ B cell generation (42, 43). Finally, the ability of leptin to upregulate Fel d1-induced IL-6 production may also contribute to IgE synthesis, since IL-6 favors B-cell proliferation, plasma cell survival, and antibody production (44–46).
Recently, the severity of mite-allergic asthma has been associated with Der f3-specific Th17 cells (47). Furthermore, IL-17 directly promoted IgE production by human B cells (48) and favors eosinophil accumulation in mucosa of atopic patients (49). In the present study, although Fel d1 has induced TFHIL-17+, and leptin amplified this cell subtype, no relationship was observed with either in vitro IgE production or plasma anti-Fel d1 IgE. However, it is possible that during disease exacerbation, this cell phenotype may contribute to cat allergy immunopathogenesis by promoting eosinophil infiltration into the airway of patients.
Regarding regulatory CD4+ T cells, the severity of allergic reactions has been associated with functional damage of allergen-specific Treg cells (CXCR5-FoxP3+IL-10+), Tr-1 (CXCR5-FoxP3-IL-10+) and, mainly in IgE-mediated disorders, TFR (CXCR5+FoxP3+IL-10+) (21, 22). In atopic patients, severity of the symptoms correlated with both dysfunctional TFR cells and elevated frequency of TFH2 cells highly capable of assisting IgE production by allergen-specific B cells (13, 32, 50, 51). Those atopic-derived TFR cells show impaired IL-10 production, a net anti-inflammatory cytokine (32, 50, 52). In addition to IL-10, several surface biomarkers can identify highly functional regulatory T cells, such as CD39 (53). In the present study, leptin reduced the frequency of Fel d1-specific Treg/Tr-1 and TFR cells, most of them expressing CD39. It is known that CD39, along with CD73, metabolizes the extracellular adenosine triphosphate (ATP)/adenosine diphosphate (ADP) into adenosine (ADO), a metabolite which inhibits pro-inflammatory T cell phenotypes (53). A study by Li et al. observed the role of CD39+Treg cells in controlling airway inflammation in the murine model of allergic asthma (54). Notably, the frequency of Treg and TFR cells, expressing CD39 or not, inversely correlated with both IgE production in Fel d1/Lep-stimulated cell cultures and plasma anti-Fel d1 IgE titers. In agreement with our findings, a study by Martin-Orozco et al. (55), demonstrated an inverse relationship between FoxP3 expression in the regulatory CD4+T cell compartment with serum IgE levels and eosinophilia. Therefore, in the present study, high dose of leptin should negatively impact the prognostic of allergic diseases due to the ability of this adipokine in reducing functional Treg/Tr-1 and TFR cells, CD4 T cell subset implicated in controlling Th2/Th9 and TFH2/TFH13 axis respectively (21, 22).
5 Conclusions
Although preliminary, our findings suggest that hyperleptinemia, by favoring expansion of pathogenic Fel d1-specific CD4+ T cells and impairing the functioning of regulatory CD4+ T cell subsets, would not only exacerbate disease severity, but also negatively impacts the success of allergen-specific immunotherapies against cat allergies (56, 57).
Data availability statement
The raw data supporting the conclusions of this article will be made available by the authors, without undue reservation.
Ethics statement
The studies involving humans were approved by Gaffrée e Guinle university hospital research committee and by the Ethics Committee for Research on Human Subjects at the Federal University of the State of Rio de Janeiro (CAAE 44951215.6.0000.5258). The studies were conducted in accordance with the local legislation and institutional requirements. Blood was collected only after written informed consent was obtained from each individual. The participants provided their written informed consent to participate in this study.
Author contributions
CV: Investigation, Methodology, Writing – original draft, Writing – review & editing. AD: Investigation, Methodology, Writing – review & editing. MS: Formal Analysis, Investigation, Methodology, Writing – review & editing. PS: Formal Analysis, Investigation, Methodology, Writing – review & editing. JS: Formal Analysis, Investigation, Writing – review & editing. HO: Investigation, Writing – review & editing. UL: Investigation, Writing – review & editing. SG: Conceptualization, Funding acquisition, Investigation, Writing – review & editing. TK: Conceptualization, Supervision, Writing – review & editing. CB: Conceptualization, Funding acquisition, Supervision, Writing – review & editing.
Funding
The author(s) declare that no financial support was received for the research, authorship, and/or publication of this article. This study was supported by the Fundação de Amparo à Pesquisa Carlos Chagas Filho (FAPERJ, grant number: E-26/202.940/2017).
Conflict of interest
The authors declare that the research was conducted in the absence of any commercial or financial relationships that could be construed as a potential conflict of interest.
Publisher’s note
All claims expressed in this article are solely those of the authors and do not necessarily represent those of their affiliated organizations, or those of the publisher, the editors and the reviewers. Any product that may be evaluated in this article, or claim that may be made by its manufacturer, is not guaranteed or endorsed by the publisher.
Supplementary material
The Supplementary Material for this article can be found online at: https://www.frontiersin.org/articles/10.3389/fimmu.2023.1290740/full#supplementary-material
Abbreviations
Allergic asthma (AA), allergic rhinitis (AR), B cell lymphoma 6 (Bcl-6). body mass index (BMI), germinal center (GC), healthy subjects (HS), Leptin (Lep), monoclonal antibodies (mAbs), non-follicular helper T (non-TFH), peripheral blood mononuclear cells (PBMC), programmed cell death protein-1 (PD-1), follicular helper T (TFH), follicular regulatory T cells (TFR).
References
1. Bousquet PJ, Chinn S, Janson C, Kogevinas P, Burney P, Jarvis D. Geographic variation in the prevalence of positive skin tests to environmental aeroallergens in the European Community Respiratory Health Survey. Allergy (2007) 62:301–9. doi: 10.1111/j.1398-9995.2006.01293.x
2. Zahradnik E, Raulf M. Respiratory allergens from furred mammals: environmental and occupational exposure. Vet Sci (2017) 4:38. doi: 10.3390/vetsci4030038
3. Leynaert C, Neukirch C, Liard R, Bousquet J, Neukirch F. Quality of life in allergic rhinitis and asthma. A population-based study of young adults. Am J Respir Crit Care Med (2000) 162:1391–6. doi: 10.1164/ajrccm.162.4.9912033
4. Canonica GW, Mullol J, Pradalier A, Didier A. Patient perceptions of allergic rhinitis and quality of life: findings from a survey conducted in europe and the United States. World Allergy Organ J (2008) 1:138–44. doi: 10.1097/WOX.0b013e3181865faf
5. Bonnet B, Messaoudi K, Jacomet F, Michaud E, Fauquert JL, Cailaud D, et al. An update on molecular cat allergens: Fel d 1 and what else? Chapter 1: Fel d 1, the major cat allergen. Allergy Asthma Clin Immunol (2018) 14:1–9. doi: 10.1186/s13223-018-0239-8
6. Reefer AJ, Carneiro RM, Custis NJ, Platts-Mills TA, Sung SS, Hammer J, et al. A role for IL-10-mediated HLA-DR7-restricted T cell-dependent events in development of the modified Th2 response to cat allergen. J Immunol (2004) 172:2763–72. doi: 10.4049/jimmunol.172.5.2763
7. Crack L,R, Chan HW, McPherson T, Ogg GS. Phenotypic analysis of perennial airborne allergen-specific CD4+ T cells in atopic and non-atopic individuals. Clin Exp Allergy (2011) 41:1555–67. doi: 10.1111/j.1365-2222.2011.03819.x
8. Gowthaman U, Chen JS, Eisenbarth SC. Regulation of IgE by T follicular helper cells. J Leukoc Biol (2020) 107:409–18. doi: 10.1002/JLB.3RI1219-425R
9. Schmitt N, Bentebibel SE, Ueno H. Phenotype and functions of memory Tfh cells in human blood. Trends Immunol (2014) 35:436–42. doi: 10.1016/j.it.2014.06.002
10. Zhang YN, Song J, Wang H, Wang H, Zeng M, Zhai GT, et al. Nasal IL-4(þ)CXCR5(þ)CD4(þ) T follicular helper cell counts correlate with local IgE production in eosinophilic nasal polyps. J Allergy Clin Immunol (2016) 137:462–73. doi: 10.1016/j.jaci.2015.07.025
11. Ballesteros-Tato A, Randall TD, Lund FE, Spolski R, Leonard WJ, León B. T follicular helper cell plasticity shapes pathogenic T helper 2 cell-mediated immunity to inhaled house dust mite. Immunity (2016) 44:259–73. doi: 10.1016/j.immuni.2015.11.017
12. Yao Y, Chen CL, Wang N, Wang ZC, Ma J, Zhu RF, et al. Correlation of allergen-specific T follicular helper cell counts with specific IgE levels and efficacy of allergen immunotherapy. J Allergy Clin Immunol (2018) 142:321–4. doi: 10.1016/j.jaci.2018.03.008
13. Gong F, Su Q, Jiang D, Chen J, Pan Y, Huang X. High frequency of circulating follicular helper T cells in patients with bronchial asthma. Clin Lab (2014) 60(6):963–968. doi: 10.7754/Clin.Lab.2013.130427
14. Gong F, Qian C, Zhu H, Zhu J, Pan Y, Dong Q, et al. Circulating follicular T-helper cell subset distribution in patients with asthma. Allergy Asthma Proc (2016) 37:154–61. doi: 10.2500/aap.2016.37.3982
15. Gong F, Zhu HY, Zhu J, Dong QJ, Huang X, Jiang DJ. Circulating CXCR5(þ)CD4(þ) T cells participate in the IgE accumulation in allergic asthma. Immunol Lett (2018) 197:9–14. doi: 10.1016/j.imlet.2018.03.001
16. Cao PP, Zhang YN, Liao B, Ma J, Wang BF, Wang H, et al. Increased local IgE production induced by common aeroallergens and phenotypic alteration of mast cells in Chinese eosinophilic, but not noneosinophilic, chronic rhinosinusitis with nasal polyps. Clin Exp Allergy (2014) 44:690–700. doi: 10.1111/cea.12304
17. Gowthaman U, Chen JS, Zhang B, Flynn WF, Lu Y, Song W, et al. Identification of a T follicular helper cell subset that drives anaphylactic IgE. Science (2019) 365:eaaw6433. doi: 10.1126/science.aaw6433
18. Mita H, Yasueda H, Akiyama K. Affinity of IgE antibody to antigen influences allergen-induced histamine release. Clin Exp Allergy (2000) 30:1583–9. doi: 10.1046/j.1365-2222.2000.00921.x
19. Nadif R, Zerimech F, Bouzigon E, Matran R. The role of eosinophils and basophils in allergic diseases considering genetic findings. Curr Opin Allergy Clin Immunol (2013) 13:507–13. doi: 10.1097/ACI.0b013e328364e9c0
20. Angkasekwinai. P. Th9 cells in allergic disease. Curr Allergy Asthma Rep (2019) 19:1–9. doi: 10.1007/s11882-019-0860-8
21. Martín-Orozco E, Norte-Muñoz M, Martínez-García J. Regulatory T cells in allergy and asthma. Front Pediatr (2017) 5:117. doi: 10.3389/fped.2017.00117
22. Clemente RL, Daccache J, Tohammed MT, Diallo A, Blazar BR, Kuchroo VK, et al. Follicular regulatory T cells control humoral and allergic immunity by restraining early B cell responses. Nat Immunol (2019) 20:1360–71. doi: 10.1038/s41590-019-0472-4
23. Chen Y, Rennie D, Cormier Y, Dosman J. Association between obesity and atopy in adults. Int Arch Allergy Immunol (2010) 153:372–7. doi: 10.1159/000316348
24. Schachter LM, Peat JK, Salome CM. Asthma and atopy in overweight children. Thorax (2003) 58:1031–5. doi: 10.1136/thorax.58.12.1031
25. Visness CM, London S,J, Daniels JL, Kaufman JS, Yeatts KB, Siega-Riz AM, et al. Zeldin; Association of obesity with IgE levels and allergy symptoms in children and adolescents: results from the National Health and Nutrition Examination Survey 2005-2006. J Allergy Clin Immunol (2009) 123:1163–9. doi: 10.1016/j.jaci.2008.12.1126
26. Kiernan K, Maclver NJ. The role of the adipokine leptin in immune cell function in health and disease. Front Immunol (2021) 11:622468. doi: 10.3389/fimmu.2020.622468
27. Naylor C, Petrl WA. Leptin regulation of immune responses. Trends Mol Med (2016) 22:88–98. doi: 10.1016/j.molmed.2015.12.001
28. Pérez-Pérez A, Sánchez-Jiménez F, Vilariño-García T. and sánchez-margalet., role of leptin in inflammation and vice versa. Int J Mol Sci (2020) 21:5887. doi: 10.3390/ijms21165887
29. Ciprandi G, Filaci G, Negrini S, De Amici M, Fenoglio D, Marseglia G. Serum leptin levels in patients with pollen-induced allergic rhinitis. Int Arch Allergy Immunol (2009) 148:211–8. doi: 10.1159/000161581
30. Dias ASO, Santos ICL, Delphim L, Fernandes G, Endlich LR, Cafasso MOSD, et al. Serum leptin levels correlate negatively with the capacity of vitamin D to modulate the in vitro cytokines production by CD4+ T cells in asthmatic patients. Clin Immunol (2019) 205:93–105. doi: 10.1016/j.clim.2019.06.001
31. Vollmer CM, Dias ASO, Lopes LM, Kasahara TM, Delphim L, Silva JCC, et al. Leptin favors Th17/Treg cell subsets imbalance associated with allergic asthma severity. Clin Transl Allergy (2022) 12(6):e12153. doi: 10.1002/clt2.12153
32. Yao Y, Wang ZC, Wang N, Zhou PC, Chen CL, Song J, et al. Allergen immunotherapy improves defective follicular regulatory T cells in patients with allergic rhinitis. J Allergy Clin Immunol (2019) 144(1):118–28. doi: 10.1016/j.jaci.2019.02.008
33. Shamji MH, Layhadi JA, Sharif H, Penagos M, Durham SR. Immunological responses and biomarkers for allergen-specific immunotherapy against inhaled allergens. J Allergy Clin Immunol Pract (2021) 9:1769–78. doi: 10.1016/j.jaip.2021.03.029
34. Global Initiative for Asthma - Global Initiative for Asthma - GINA. Global Initiative for Asthma - GINA (2019). Available at: https://ginasthma.org/.
35. Ellis AK, Soliman M, Steacy L, Boulay MÉ, Boulet LP, Keith PK, et al. The Allergic Rhinitis - Clinical Investigator Collaborative (AR-CIC): nasal allergen challenge protocol optimization for studying AR pathophysiology and evaluating novel therapies. Allergy Asthma Clin Immunol (2015) 11:1–10. doi: 10.1186/s13223-015-0082-0
36. Adeyemil E, Abdulle A. A comparison of plasma leptin levels in obese and lean individuals in the United Arab Emirates. Nutr Res (2000) 20:157–66. doi: 10.1016/S0271-5317(99)00149-9
37. Carballo I, Alonso-Sampedro M, Gonzalez-Conde E, Sanchez-Castro J, Vidal C, Gude F, et al. Factors influencing total serum igE in adults: the role of obesity and related metabolic disorders. Int Arch Allergy Immunol (2021) 182:220–8. doi: 10.1159/000510789
38. Yang Z, Wu CM, Targ S, Allen CDC. IL-21 is a broad negative regulator of IgE class switch recombination in mouse and human B cells. J Exp Med (2020) 217:e20190472. doi: 10.1084/jem.20190472
39. Mattes J, Foster PS. Regulation of eosinophil migration and Th2 cell function by IL-5 and eotaxin. Curr Drug Targets Inflammation Allergy (2003) 2:169–74. doi: 10.2174/1568010033484214
40. Coden ME, Walker MT, Jeong BM, Connelly A,R, Nagasaka R, Berdnikovs S. Metabolic reprogramming and stromal support are prerequisite for generation and survival of long-lived eosinophil. Cells (2021) 10:815. doi: 10.3390/cells10040815
41. DeFrance T, Carayon P, Billian G, Guillemot JC, Minty A, Caput D, et al. Interleukin 13 is a B cell stimulating factor. J Exp Med (1994) 179:135–43. doi: 10.1084/jem.179.1.135
42. Doran E, Cai F, Holweg CTJ, Wong K, Brumm J, Arron JR. Interleukin-13 in asthma and other eosinophilic disorders. Front Med (Lausanne) (2017) 4. doi: 10.3389/fmed.2017.00139
43. Zheng H, Zhang X, Castillo EF, Luo Y, Liu M, Yang XO. Leptin enhances TH2 and ILC2 responses in allergic airway disease. J Biol Chem (2016) 291:22043–52. doi: 10.1074/jbc.M116.743187
44. Kaplan MH, Hufford MM, Olson MR. The development and in vivo function of T helper 9 cells. Nat Rev Immunol (2015) 15:295–307. doi: 10.1038/nri3824
45. Jin J, Zhong Y, Long J, Wu T, Jiang Q, Wang H, et al. Ginsenoside Rg1 relieves experimental colitis by regulating balanced differentiation of Tfh/Treg cells. Int Immunopharmacol (2021) 100:108133. doi: 10.1016/j.intimp.2021.108133
46. Jia L, Wang Y, Li J, Li S, Zhang Y, Shen J, et al. Detection of IL-9 producing T cells in the PBMCs of allergic asthmatic patients. BMC Immunol (2017) 18:1–9. doi: 10.1186/s12865-017-0220-1
47. Tosato G, Seamon K,B, Goldman ND, Sehgal PB, May LT, Washington GC, et al. Monocyte-derived human B-cell growth factor identified as interferon-beta 2 (BSF-2, IL-6). Science (1998) 239:502–4. doi: 10.1126/science.2829354
48. Minges Wols HA, Underhill G,H, Kansas GS, Witte PL. The role of bone marrow-derived stromal cells in the maintenance of plasma cell longevity. J Immunol (2002) 169:4213–21. doi: 10.4049/jimmunol.169.8.4213
49. Kopf M, Baumann H, Freer G, Freudenberg M, Lamers M, Kishimoto T, et al. Impaired immune and acute-phase responses in interleukin-6-deficient mice. Nature (1994) 68:339–42. doi: 10.1038/368339a0
50. Yao Y, Wang ZC, Wang N, Zhou PC, Chen CL, Song J, et al. CD23 expression on switched memory B cells bridges T-B cell interaction in allergic rhinitis. Allergy (2020) 75(10):2599–612. doi: 10.1111/all.14288
51. Gong F, Zhu HY, Zhu J, et al. Circulating CXCR5+ CD4+ T cells participate in the IgE accumulation in allergic asthma. Immunol Lett (2018) 197:9–14. doi: 10.1016/j.imlet.2018.03.001
52. Sharif H, Singh I, Kouser L, et al. Immunologic mechanisms of a short-course of Lolium perenne peptide immunotherapy: a randomized, double-blind, placebo-controlled trial. J Allergy Clin Immunol (2019) 144(3):738–49. doi: 10.1016/j.jaci.2019.02.023
53. Milovanovic M, Drozdenko G, Weise C, Babina M, Worm M. Interleukin-17A promotes IgE production in human B cells. J Invest Dermatol (2010) 130:2621–8. doi: 10.1038/jid.2010.175
54. Saitoh T, Kusunoki T, Yao T, Kawano K, Kojima Y, Miyahara K, et al. Role of interleukin-17A in the eosinophil accumulation and mucosal remodeling in chronic rhinosinusitis with nasal polyps associated with asthma. Int Arch Allergy Immunol (2010) 151:8–16. doi: 10.1159/000232566
55. Gu J, Ni X, Pan X, Lu H, Lu Y, Zhao J, et al. Human CD39hi regulatory T cells present stronger stability and function under inflammatory conditions. Cell Mol Immunol (2017) 14:521–8. doi: 10.1038/cmi.2016.30
56. Haskó G, Linden J, Cronstein B, Pacher P. Adenosine receptors: therapeutic aspects for inflammatory and immune diseases. Nat Rev Drug Discovery (2008) 7:759–70. doi: 10.1038/nrd2638
Keywords: leptin, Fel d1, Th2/Th9, Tfh cells, Treg/Tr-1 cells, Tfr cells
Citation: Vollmer C, Dias A, Sales M, Sacramento PM, Silva JC, Oyamada HAA, Linhares UC, Gupta S, Kasahara TM and Bento CAM (2023) Leptin favors imbalance of antigen-specific CD4+ T-cells associated with severity of cat allergy. Front. Immunol. 14:1290740. doi: 10.3389/fimmu.2023.1290740
Received: 08 September 2023; Accepted: 09 October 2023;
Published: 26 October 2023.
Edited by:
Giang Tran, University of New South Wales, AustraliaReviewed by:
Takemichi Fukasawa, The University of Tokyo Graduate School of Medicine, JapanDong-Ho Nahm, Ajou University, Republic of Korea
Copyright © 2023 Vollmer, Dias, Sales, Sacramento, Silva, Oyamada, Linhares, Gupta, Kasahara and Bento. This is an open-access article distributed under the terms of the Creative Commons Attribution License (CC BY). The use, distribution or reproduction in other forums is permitted, provided the original author(s) and the copyright owner(s) are credited and that the original publication in this journal is cited, in accordance with accepted academic practice. No use, distribution or reproduction is permitted which does not comply with these terms.
*Correspondence: Cleonice A. M. Bento, Y2JlbnRvQHVuaXJpby5jb20=
†These authors have contributed equally to this work