 Peng Xu
 Zuo Tao
 Cheng Zhang
- Department of General Surgery, General Hospital of Northern Theater Command, Shenyang, Liaoning, China
Background: Sepsis, causing serious organ and tissue damage and even death, has not been fully elucidated. Therefore, understanding the key mechanisms underlying sepsis-associated immune responses would lead to more potential therapeutic strategies.
Methods: Single-cell RNA data of 4 sepsis patients and 2 healthy controls in the GSE167363 data set were studied. The pseudotemporal trajectory analyzed neutrophil clusters under sepsis. Using the hdWGCNA method, key gene modules of neutrophils were explored. Multiple machine learning methods were used to screen and validate hub genes for neutrophils. SCENIC was then used to explore transcription factors regulating hub genes. Finally, quantitative reverse transcription-polymerase chain reaction was to validate mRNA expression of hub genes in peripheral blood neutrophils of two mice sepsis models.
Results: We discovered two novel neutrophil subtypes with a significant increase under sepsis. These two neutrophil subtypes were enriched in the late state during neutrophils differentiation. The hdWGCNA analysis of neutrophils unveiled that 3 distinct modules (Turquoise, brown, and blue modules) were closely correlated with two neutrophil subtypes. 8 machine learning methods revealed 8 hub genes with high accuracy and robustness (ALPL, ACTB, CD177, GAPDH, SLC25A37, S100A8, S100A9, and STXBP2). The SCENIC analysis revealed that APLP, CD177, GAPDH, S100A9, and STXBP2 were significant associated with various transcriptional factors. Finally, ALPL, CD177, S100A8, S100A9, and STXBP2 significantly up regulated in peripheral blood neutrophils of CLP and LPS-induced sepsis mice models.
Conclusions: Our research discovered new clusters of neutrophils in sepsis. These five hub genes provide novel biomarkers targeting neutrophils for the treatment of sepsis.
1 Introduction
Sepsis is the result of a dysregulated host response to infection and can cause serious organ damage and even death. Mortality rates of sepsis rapidly exceed 30–35% without prompt and effective intervention (1). Over the past few decades, anti-inflammatory treatments have not been successful, and the immunosuppression often seen in patients with sepsis makes them more susceptible to nosocomial infections and organ dysfunctions (2). The causative factor for concomitant immunosuppression is lymphocyte exhaustion and reprogramming of innate immunity (3). Therefore, understanding the key mechanisms underlying sepsis-associated immune responses would lead to more potential therapeutic strategies (4).
Genome expression profiling studies have previously relied on whole blood to characterize diagnostic or prognostic genes, however, rarer cell types or cell type-specific signatures in sepsis were rarely detected (5). With the development of single-cell-RNA (sc-RNA) transcriptome, the immunosuppression condition was gradually discovered. It has been shown that myeloid cells are increased in number but lacking in function in sepsis (6). Guilin Li et al. reveals that the molecules CAP-1 and IL16 on monocytes may serve as potential diagnostic markers for sepsis based on sc-RNA analysis (7). Single-cell RNA sequencing (scRNA-seq) analysis revealed a new role of circulating MAIT17 in promoting sepsis severity and suggests the PI3K-LDHA signaling as a driving force in MAIT17 responses (8). By comparing the immune cell landscapes in sepsis with those in other conditions, researchers aim to identify common and disease-specific immune cell states and pathways, which could provide a more comprehensive understanding of the immune response and inform the development of novel therapeutic approaches.
Machine learning (ML) showed great promise in assessing high-dimensional data and identifying genes with biological significance (9). In sepsis, ML methods were widely used in identification of subclasses and development of prediction models (10, 11). Given sepsis is made up of multiple types of cells, such as neutrophils, macrophages, T cells and B cells, combination of single-cell sequencing and machine learning methods is proved to be a groundbreaking approach to study the genetic attributes of sepsis at the individual cell level (12).
In this study, we integrated single-cell RNA sequencing to identify specific neutrophils cell clusters and signature gene sets in sepsis. hdWGCNA (High Dimensional Weighted Correlation Network Analysis) method and multiple machine learning methods (Lasso, k-Nearest Neighbors, Linear Discriminant Analysis, Logistic Regression, Naive Bayes, Random Forest, Recursive Partitioning, and Support Vector Machine) were used to transcriptome analysis and hub genes identification. Finally, two mice models of sepsis were establishment and validated expressions of hub genes. Our findings provide an overall perspective on the heterogeneity of neutrophils in sepsis and will inform the development of personalized treatment and management strategies.
2 Methods
2.1 Patients and datasets
All datasets were obtained from the GEO dataset (https://www.ncbi.nlm.nih.gov/geo/). The scRNA-seq dataset GSE167363 included 2 healthy subsets and 4 sepsis subsets. The transcriptomic data were downloaded from GEO datasets GSE57065 and GSE95233. The training dataset GSE57065 included 25 healthy subsets and 28 sepsis subsets. The validation dataset GSE95233 included 22 healthy subsets and 51 sepsis subsets. GSE57065 and GSE95233 were also used for meta-analysis. Information of GSE167363, GSE57065, and GSE95233 were showed in Supplementary Table S1.
2.2 Single cell analysis
The R “Seurat” package (version 4.3.0.1) was used to process the scRNA-seq data. The expression profile was read in by Seurat package and screened out (nFeature_RNA>200 & nFeature_RNA<5000 & percent.mt < 20). 1Unsupervised clustering was conducted using Principal Component Analysis (PCA) and Uniform Manifold Approximation and Projection (UMAP) analysis after data normalization with the LogNormalize method, allowing us to see cell populations on a two-dimensional map. The Human Primary Cell Atlas was used as the source of reference material for the SingleR package’s cell annotation function. To identify each cluster’s marker gene, we used the “FindAllMarkers” tool and threshold values of fold change (FC).
2.3 High dimensional weighted correlation network analysis
High dimensional data, such as single cell RNA-seq, can be used to perform weighted gene co-expression network analysis (WGCNA) using hdWGCNA. hdWGCNA detects strong modules of linked genes and gives the biological context for these modules. It may be used to build co-expression networks in a cell type-specific manner. In this study, we investigated the hub genes of neutrophils under sepsis using hdWGCNA. And lastly, a subpopulation of hepatocytes undergoing regeneration was screened for distinctive genes. The “hdWGCNA” package version utilized in this research is 0.1.1.9010.
2.4 Trajectory analysis for cell subsets
The trajectory analysis was performed via the R “Monocle” package (version 2.18.0). The cell data set was constructed using an integrated gene expression matrix, exported from the Seurat object into Monocle. SetOrderingFilter was used to sequence cells based on the variable genes defined by dispersionTable. Finally, we then reduced the dimensionality of the trajectory using the Darter method and estimated the arrangement of cells using the orderCells function. The differentiation time of cell subsets was then identified clustering characteristics and gene markers.
2.5 Cellular communication analysis
R “CellChat” package (version 1.0.0) was used to analyze cellular communications. In sepsis, we investigated the differences and connections between immune cells during the current regeneration process, as well as the interactions of regeneration-related subsets with other cell types via cell communication analysis. Finally, we selected 4000 immune cells for processes.
2.6 Function analysis
High-throughput molecular research results are often translated into biological applications by analyzing gene function. We analyzed gene function using the R “clusterProfile” package (version 3.17) and visualized hub genes containing Disease Ontology (DO), Gene Ontology (GO) and Kyoto Encyclopedia of Genes and Genomes (KEGG). The significance level was set at P<0.05.
2.7 Identification of hub genes via machine learning algorithms
Multiple machine learning algorithms were applied to this study to identify feature genes. The first step was to perform Least Absolute Shrinkage and Selection Operator (Lasso) to screen candidates by iteratively reweighting least squares. Feature variables were selected based on minimum criteria after running the algorithm for 1000 cycles. Next, seven machine learning algorithms (k-Nearest Neighbors, Linear Discriminant Analysis, Logistic Regression, Naive Bayes, Random Forest, Recursive Partitioning, and Support Vector Machine) were applied. Finally, the receiver operating characteristic (ROC) curve was used to assess the classification performance of the hub genes in both training and validation cohorts. The pROC software was used to create ROC curves and the area under the curve was calculated.
2.8 Analysis of transcriptional factor regulatory network
Single-cell regulatory network interference and clustering (SCENIC, version 1.2.4) was created specifically for single cell data. Following the introduction of the gene co-expression network derived from transcription factor (TF) motifs by SCENIC, high-reliability gene regulatory networks (GRNs) predominately composed of TFs were found. We further highlighted the transcription factors of hub genes.
2.9 Immune infiltration analysis
CIBERSORT was used to determine immune cell proportions (13). Correlation analysis was then conducted to analyze the relationship between immune cells and eight hub genes (ACTB, ALPL, CD177, GAPDH, S100A8, S100A9, SLC25A37, and STXBP2).
2.10 GSEA analysis and ssGSEA analysis
Gene Set Enrichment Analysis (GSEA) (https://www.broadlnstitute.org/gsea/) and single sample Gene Set Enrichment Analysis (ssGSEA) were to explore the biological functions and gene expressions according to all gene sets in the Hallmark database.
2.11 Gene set variation analysis
The Gene Set Variation Analysis (GSVA) is an unsupervised, non-parametric method. Based on the R “GSVA” package (version 1.42.0) transformation of gene expression data, we analyzed the data as a feature derived from the expression matrix of each single gene. Rank statistics were used to calculate the gene sets for each feature, and expression matrices were converted into Enrichment Score (ES) matrixes. The GSVA enrichment score for each sample could be obtained, facilitating statistical analysis of the data.
2.12 Establishment of the sepsis mouse model
Cecal Ligation and Puncture (CLP) mice sepsis models: After inhaling isoflurane, eight-week C57 mice were anesthetized, and a stump was punctured with a 22-gauge needle once to expel stool. Afterward, the cecum was repositioned intraabdominally, and the abdomen closed. For fluid resuscitation, 0.2 ml of saline was administered intraperitoneally. Sham-operated mice did not undergo puncture or ligation. Mice were returned to cages and sacrificed 4 hours after the operation. The mice were intraperitoneally injected with phosphate-buffered saline (PBS) or Lipopolysaccharide (LPS) (20 mg/kg) to establish LPS-induced sepsis model.
2.13 Isolation of neutrophils
Mice of sepsis model were euthanized by cervical dislocation after injecting sodium pentobarbital intraperitoneally. Peripheral blood neutrophils were isolated from mice using the neutrophil isolation kit (130-097-658, Miltenyi).
2.14 Quantitative RealTime PCR
Following the manufacturer’s instructions, TRIzol reagent (12183-555, Invitrogen) was used to extract RNA from neutrophils. Reverse transcription was carried out using Takara’s Prime-Script Rase. After the premix Ex-Taq (Takara), the gene expression level was determined by qRT-PCR and normalized to the beta-actin (β-Actin). The expression level was calculated using the 2-ΔΔCt technique. Table 1 contains a list of the primer pairs utilized in the experiments. The study was approved by the Ethics Committee of General Hospital of Northern Theater.
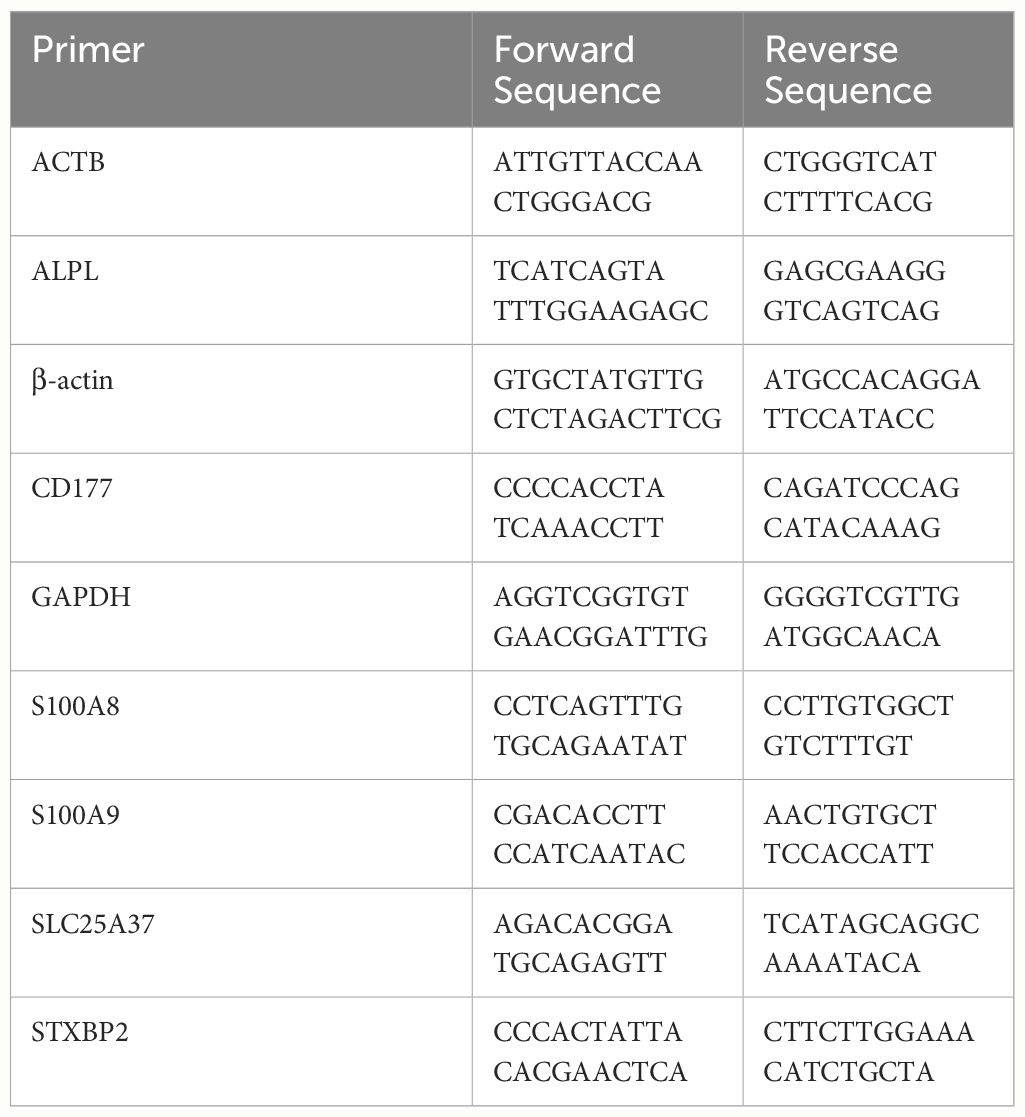
Table 1 The primer sequence for PCR analysis.
2.15 Statistical analysis
To perform the statistical analysis, R software (version 4.2.3, available at https://www.r-project.org) and GraphPad Prism 8.0 software were used. The two-tailed Student t-test determined the statistical significance. Co-expression was adjusted using Pearson’s correlation. P<0.05 was deemed statistically significant.
3 Results
3.1 Flowchart of the study
The flowchart of this study was showed in Figure 1.
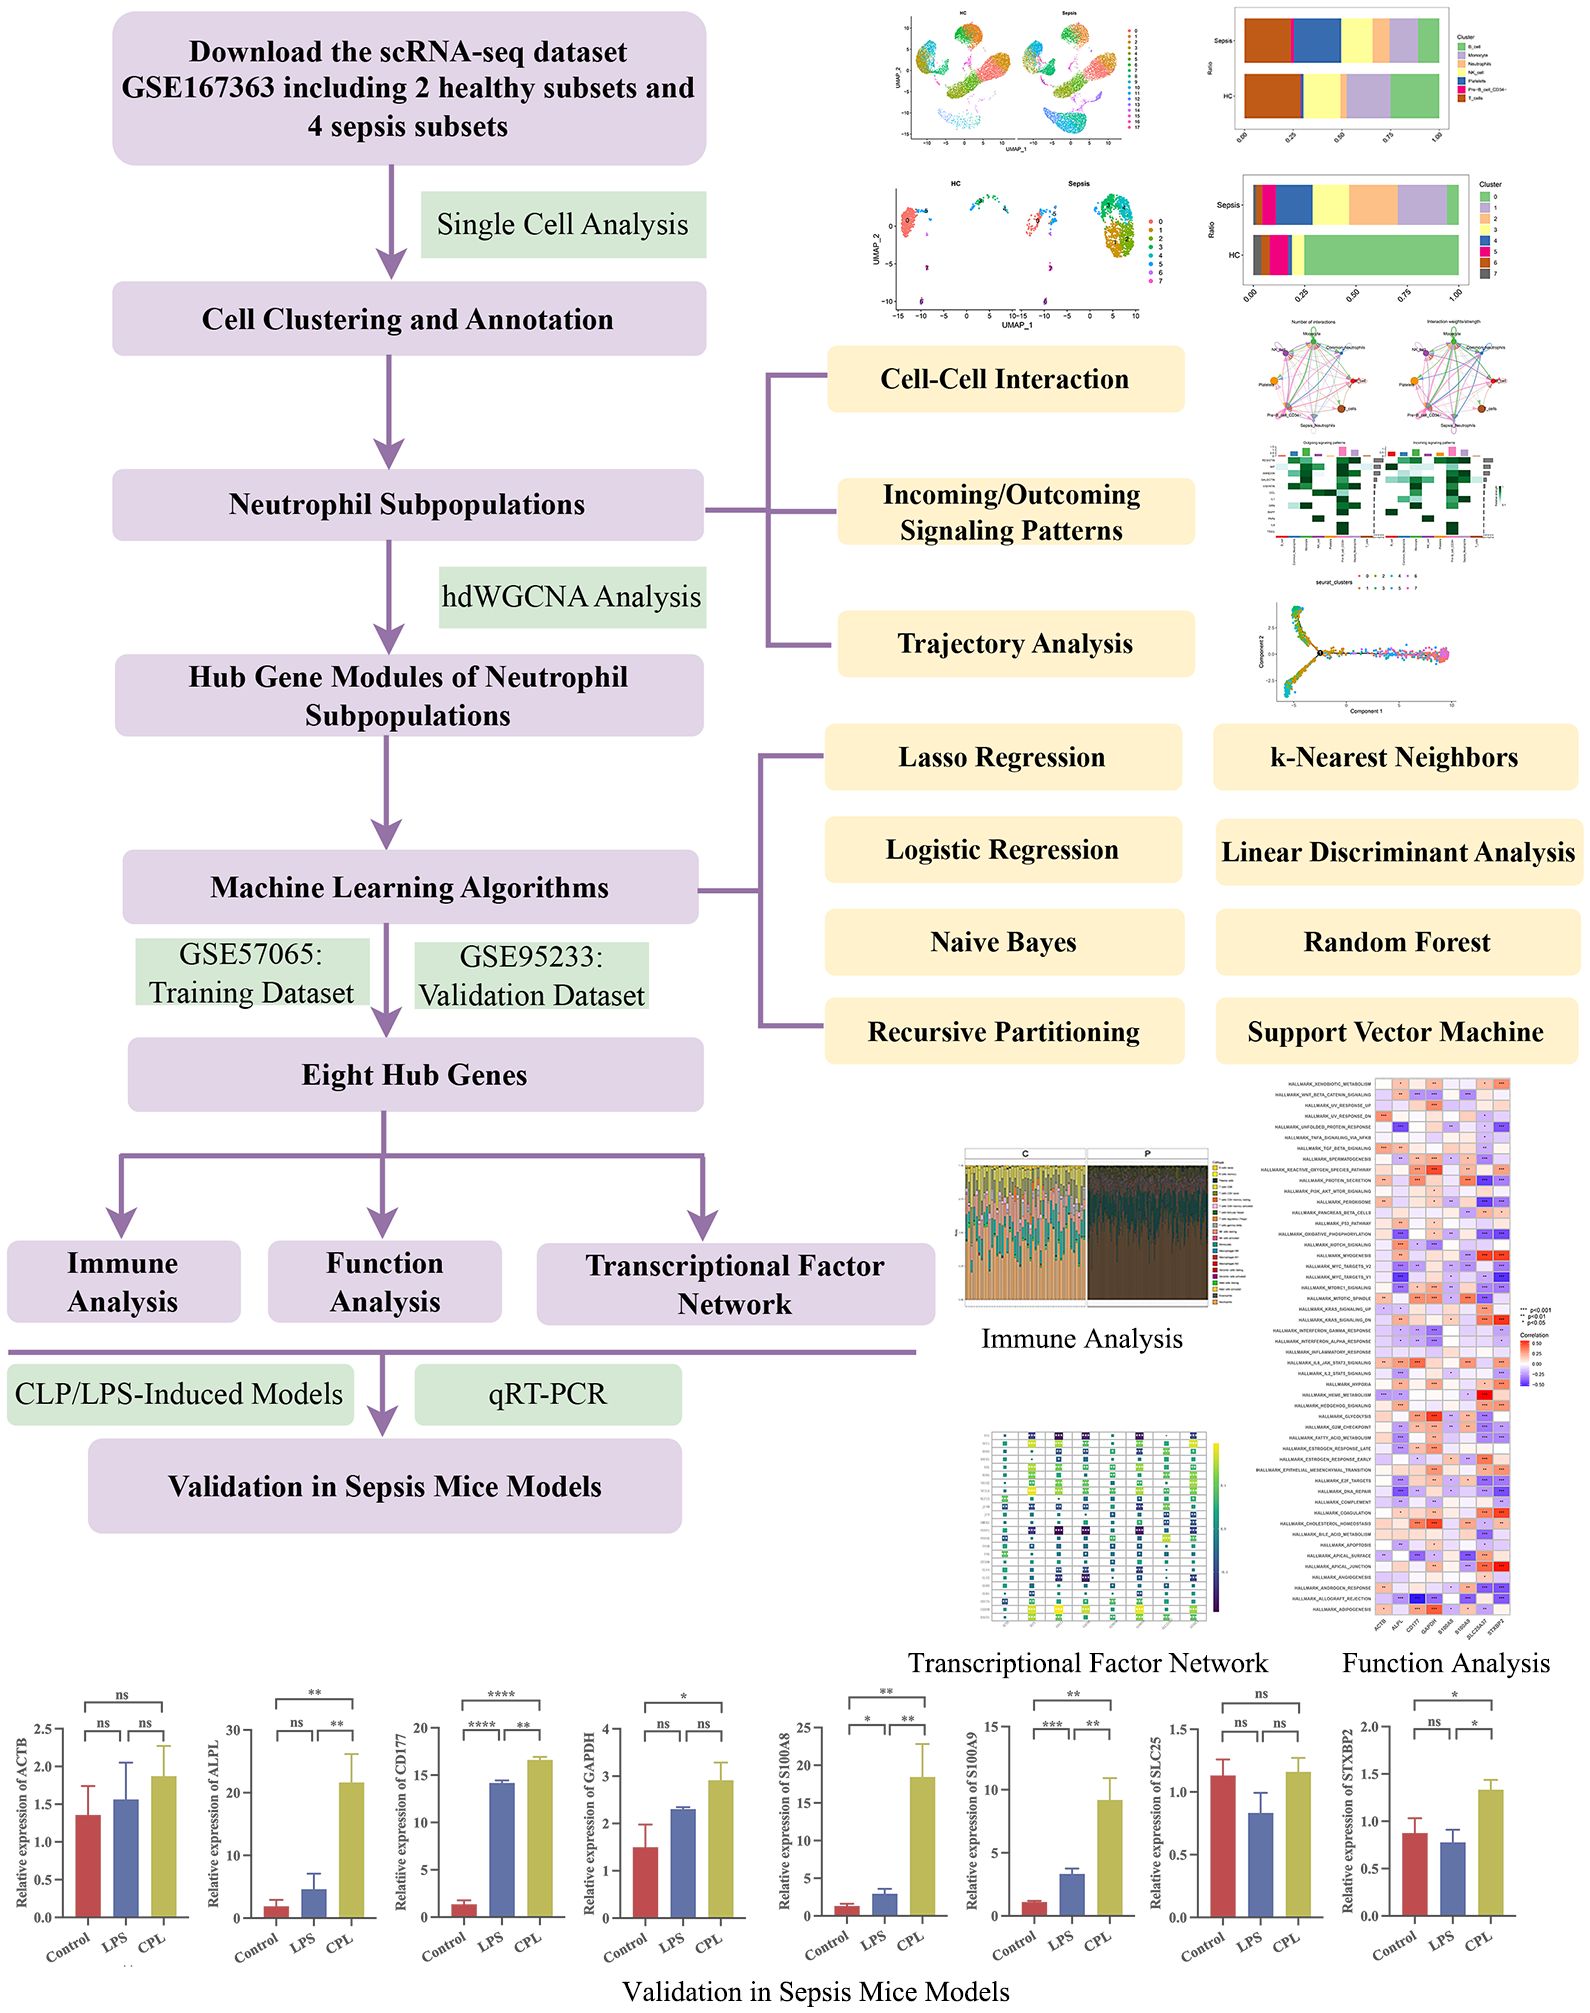
Figure 1 The flowchart of this study. *, P<0.05; **, P<0.01; ***, P<0.001; ****, P<0.0001; ns, P>0.05.
3.2 Single-cell analysis reveals specific proportions of neutrophils
To obtain high-quality cell samples from sepsis tissues, we preprocessed scRNA-seq data using stringent quality control metrics. We obtained 32,396 high-quality cell samples (Supplementary Figure S1A). The Pearson correlation coefficient of 0.82 showed a strong positive correlation between the number of genes detected and sequencing depth (Supplementary Figure S1C). The “Harmony” method and the “PCA” method was then used to reduce dimension and eliminate redundant samples (Supplementary Figures S1B, D, E). Unsupervised transcriptome analysis was performed using UMAP diagrams (Figures 2A, B). Cell abundance in healthy control and sepsis samples was showed (Supplementary Figures S2A, B). Seven separate clusters (B cells, Monocytes, T cells, Neutrophils, NK cells, Platelets, and CD34- Pre-B cell) were showed on the UMAP diagram (Figure 2C). The ratio and proportion of those seven cell clusters in healthy control and sepsis samples were visualized (Figures 2D–F). In sepsis, Neutrophils, Platelets, and CD34-Pre-B cells tended to be increased, while other cell clusters (B cells, Monocytes, T cells, and NK cells) were on a decreasing trend. As neutrophils play a vital role in sepsis, our study then aimed to explore sepsis-related neutrophils. To explore the changes of neutrophils in sepsis, we first reduce dimension by the “PCA” method (Figure 2G). The ElbowPlot identified the optimal number of pcs as 11 (Figure 2H). UMAP diagram also showed abundances of neutrophils between sepsis and healthy controls (Figure 2I). Eight clusters of neutrophils were then identified. The ratio of eight separate clusters were also showed (Figure 2J). Cell numbers of each neutrophil cluster was showed in Table 2. Cluster 1&2 was not found in healthy controls, however, cluster 1&2 significantly increased in sepsis. Cluster 3&4 also increased in sepsis and cluster 0 significantly decreased in sepsis. The result indicated cluster 1&2 of neutrophils may be the potential responder cells against infection. It was found that Sepsis_Neutrophils-Monocyte and Sepsis_Neutrophils-Common_Neutrophils had higher interactions (Figure 2K). Moreover, interactions of Sepsis_Neutrophils-Monocyte and Sepsis_Neutrophils-Common_Neutrophils may rely on RETN-CAP1 signal transduction pathway (Figure 2L). However, Sepsis_Neutrophils showed no signifcant correlation with CCL signaling pathway, which plays an important role in immune response (Figure 2M). Furthermore, incoming, and outgoing signaling patterns analysis demonstrated that Sepsis_Neutrophils correlated with Resistin, Annexin, Visfatin, and IL1 (Figure 2N). Moreover, Sepsis_Neutrophils and Common_Neutrophils showed a significant difference on both incoming interaction strength and outgoing interaction strength (Figure 2O).
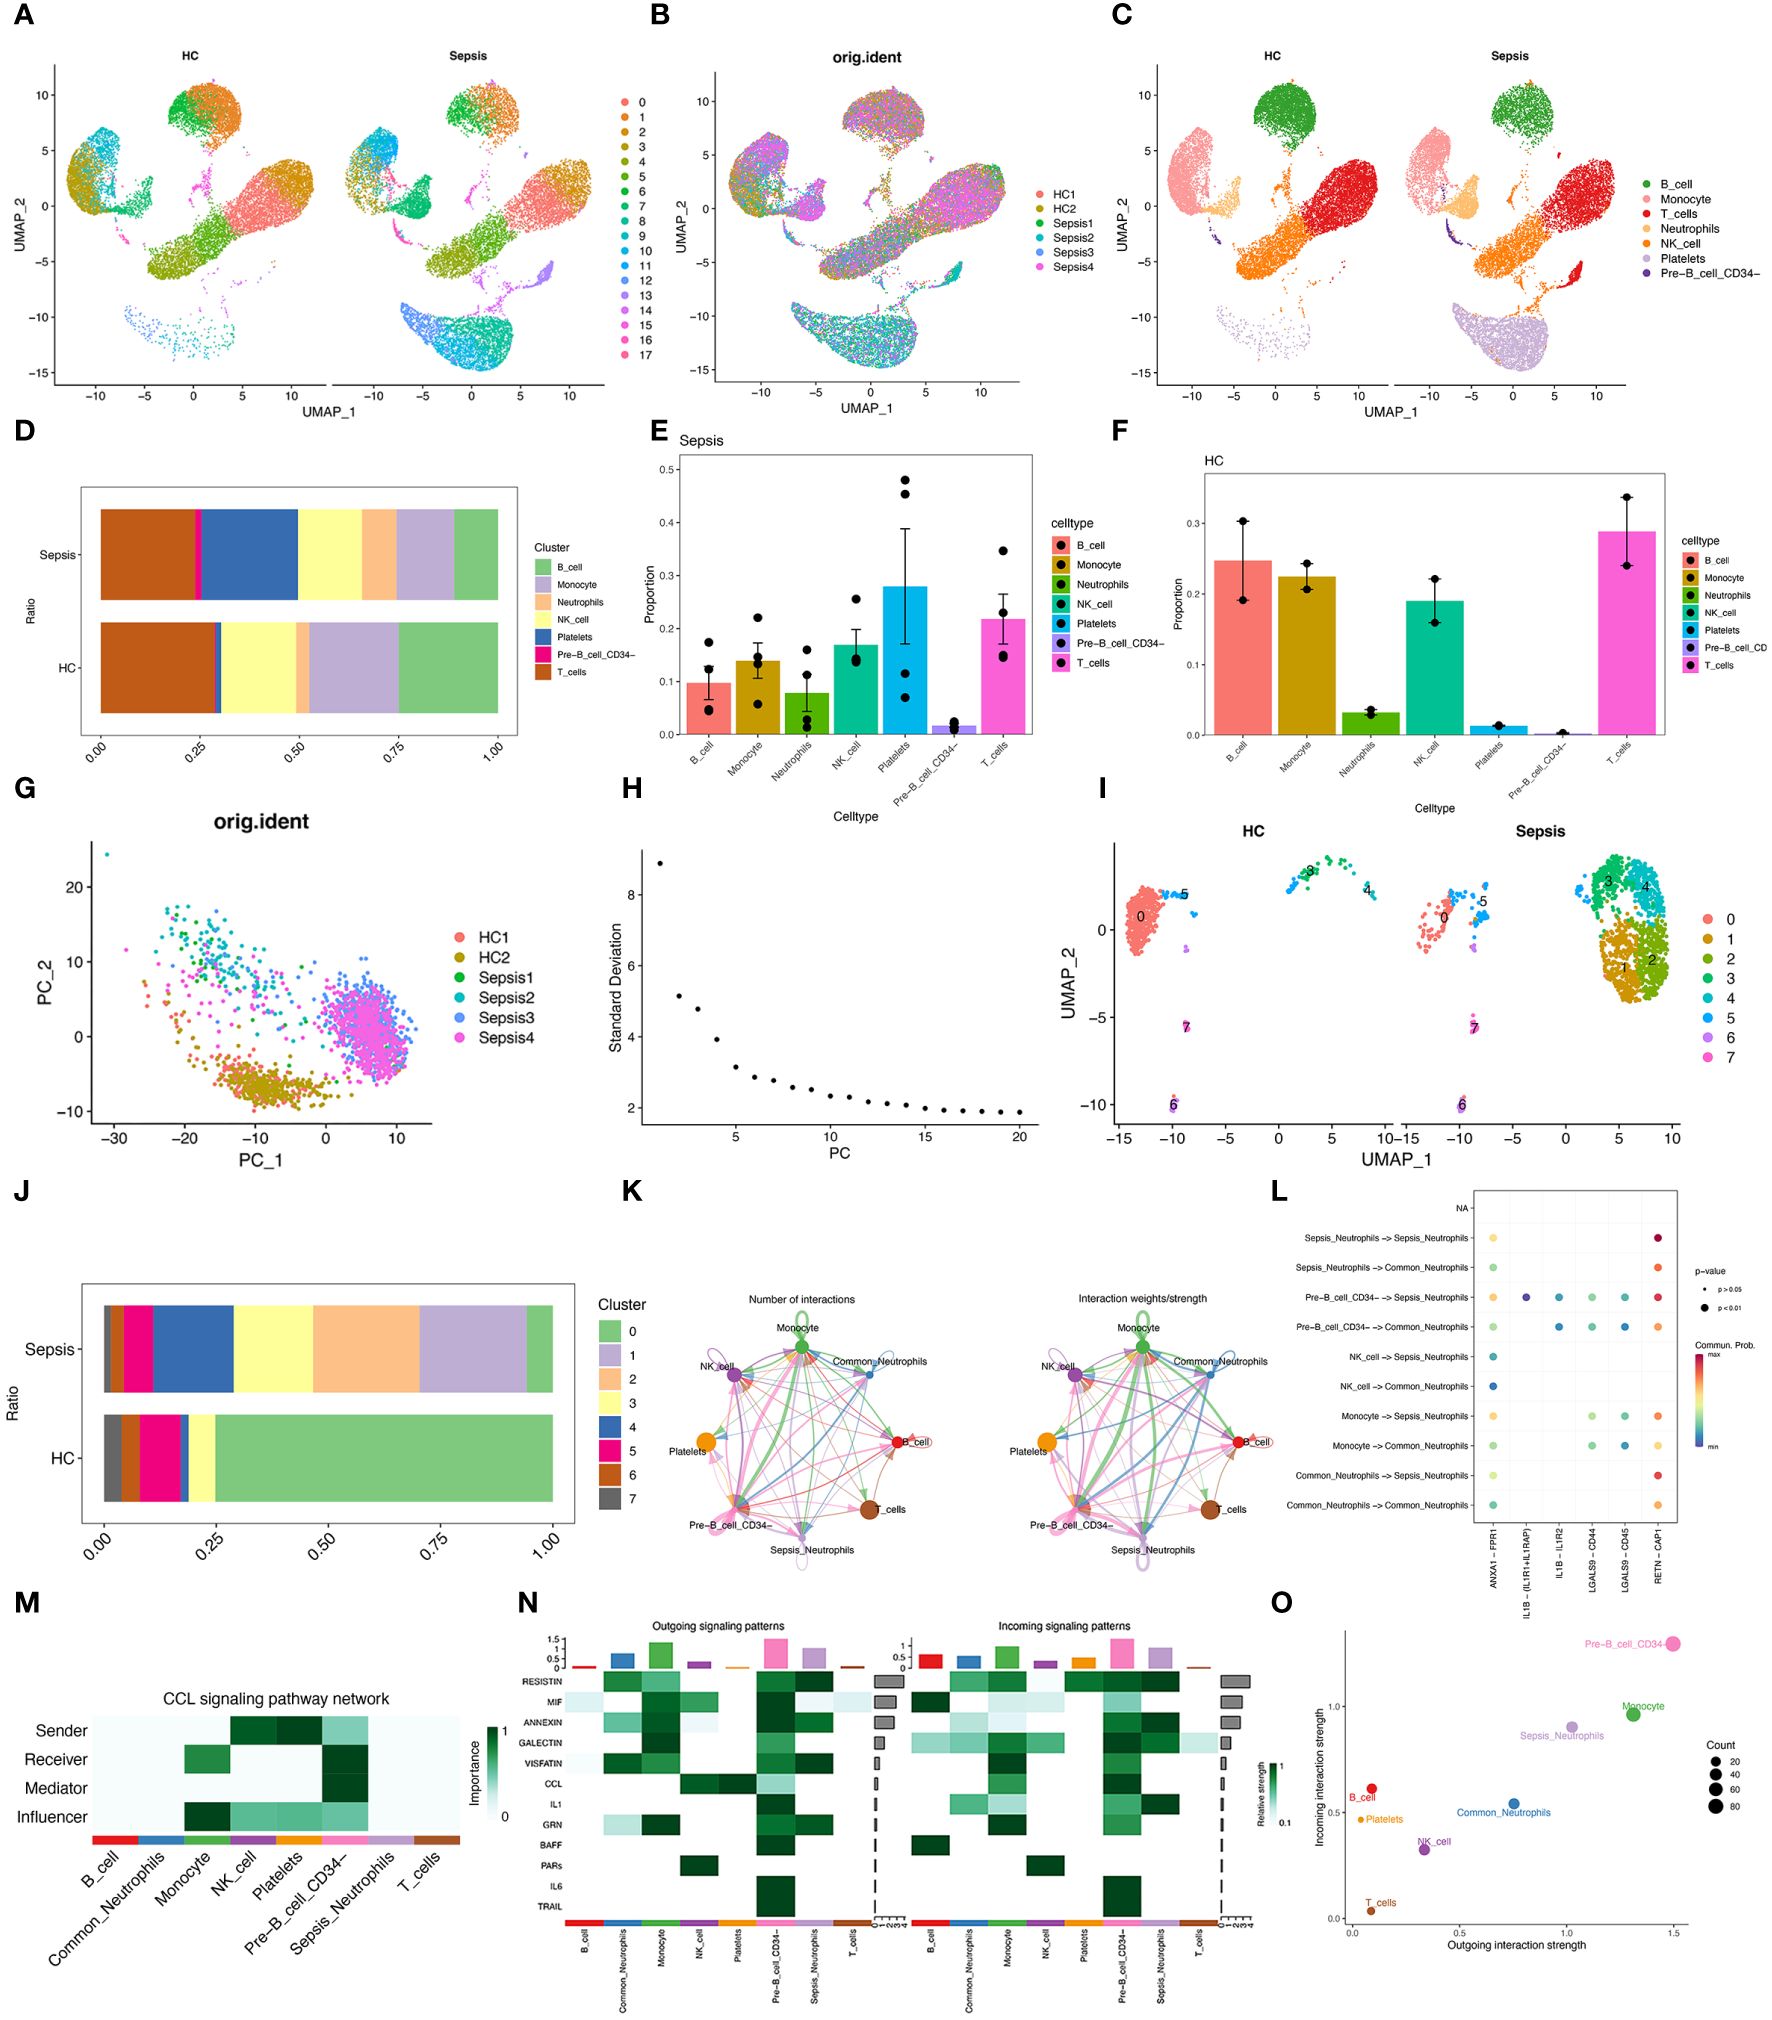
Figure 2 Single-cell analysis reveals specific proportions of neutrophils. (A) UMAP plots of immune cells in blood of healthy control and sepsis patients. (B) UMAP plots of two healthy control samples and four sepsis samples. (C) UMAP plots for single cell samples with different colors representing B cells, Monocyte, T cell, Neutrophils, NK cells, Platelets, and Pre-B CD34- cells respectively. (D) Ration of B cells, Monocyte, T cell, Neutrophils, NK cells, Platelets, and Pre-B CD34- cells in healthy control and sepsis patients. (E, F) Proportion of B cells, Monocyte, T cell, Neutrophils, NK cells, Platelets, and Pre-B CD34- cells in healthy control and sepsis patients. (G) A PCA map of the distribution of cells in each sample, and each color represents the cells in each sample. (H) Elbowplot for identifying the optimal PCs. (I) UMAP plots of each neutrophil cluster in healthy control and sepsis patients. (J) Ration of each neutrophil cluster in healthy control and sepsis patients. (K) Number of interactions and interaction weights/strength between cell groups. (L) Bubble plots displayed the involved CCL-related signaling pathways documented in the “CellChat” R package in cell–cell communications. (M) The role of eight cell types in the CCL signaling pathway network. (N) Signaling role analysis on the aggregated cell–cell communication network from all signaling pathways between eight cell types. (O) The scatter plot of the inferred roles of eight cell type considering their ingoing and outgoing interaction strength.
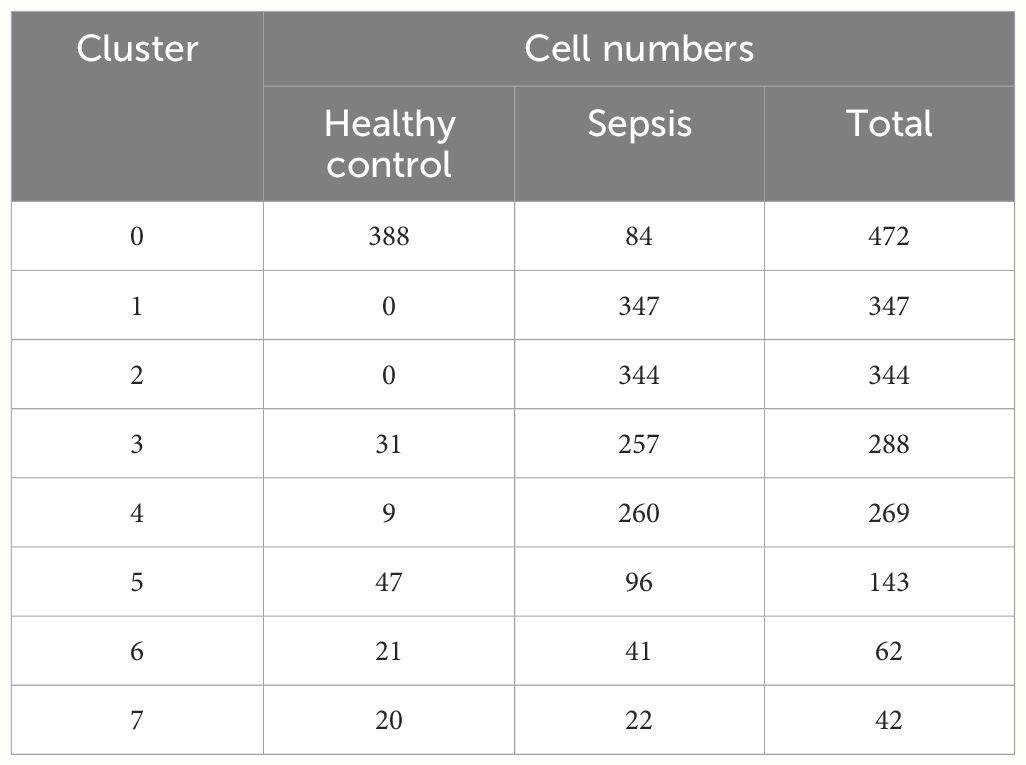
Table 2 Cell numbers of each neutrophil cluster in healthy control and sepsis samples.
3.3 Pseudotime analysis and hdWGCNA analysis of sepsis-related neutrophils
After standardization of data, the trajectory analysis projects all neutrophils cells onto three states (Figures 3A, B). The result showed that eight neutrophils’ clusters appeared in the pseudo-timeline, and the cluster 1&2 were most abundant in the state 2&3 (Figures 3C, D). The hub genes in cluster 1&2 were showed. Interestingly, all 50 hub genes all showed an elevated expression in the late stage of neutrophil-development (Figure 3E). This result was in consist of the trajectory analysis. Furthermore, hdWGCNA analysis was used for exploring gene modules related to cluster 1&2 of neutrophils. The soft threshold was adjusted to 5 for scale-free network construction (Figure 3F). Then the adjacency matrix and the TOM was built. Finally, 3 modules (Turquoise, brown, and blue modules) were identified based on average hierarchical clustering and dynamic tree clipping (Figure 3G). K-means methods identified hub genes in each module (Figure 3H). RPS18, RPS23, RPL32, RPL22, RPL11, EEF1A1, RPL23A, RPS8, RPL13, and RPL18A in the turquoise module. PTPRC, C16orf27, TLE3, ROCK1, H2AFY, HIF1A, KLF6, ZEB2, CTNNB1, and MALAT1 in brown module. GADD45B, IFITM2, LCN2, CYSTIM1, S100A12, CST7, ALPL, MMP9, CD63, and CD177 in blue module. The correlation analysis showed that the blue module was positively correlated with the brown module and negatively correlated with the turquoise module (Figure 3I). Moreover, among three modules, the blue module expressed highest in cluster 1&2 of neutrophils (Figure 3J). As cluster 1&2 of neutrophils may be the potential responder cells against infection, the genes in the blue module may have potential value for research. DO, GO, and KEGG enrichment analysis were performed on the genes in cluster 1&2 neutrophils (Figures 3K–M). The results showed that most of genes were enriched in the neutrophil degranulation, neutrophil activation, and neutrophil mediated immunity. IL-17 signaling pathway may be the potential mechanism in the neutrophil-related function. The pathway-network and pathway-gene interaction analyses were then showed.
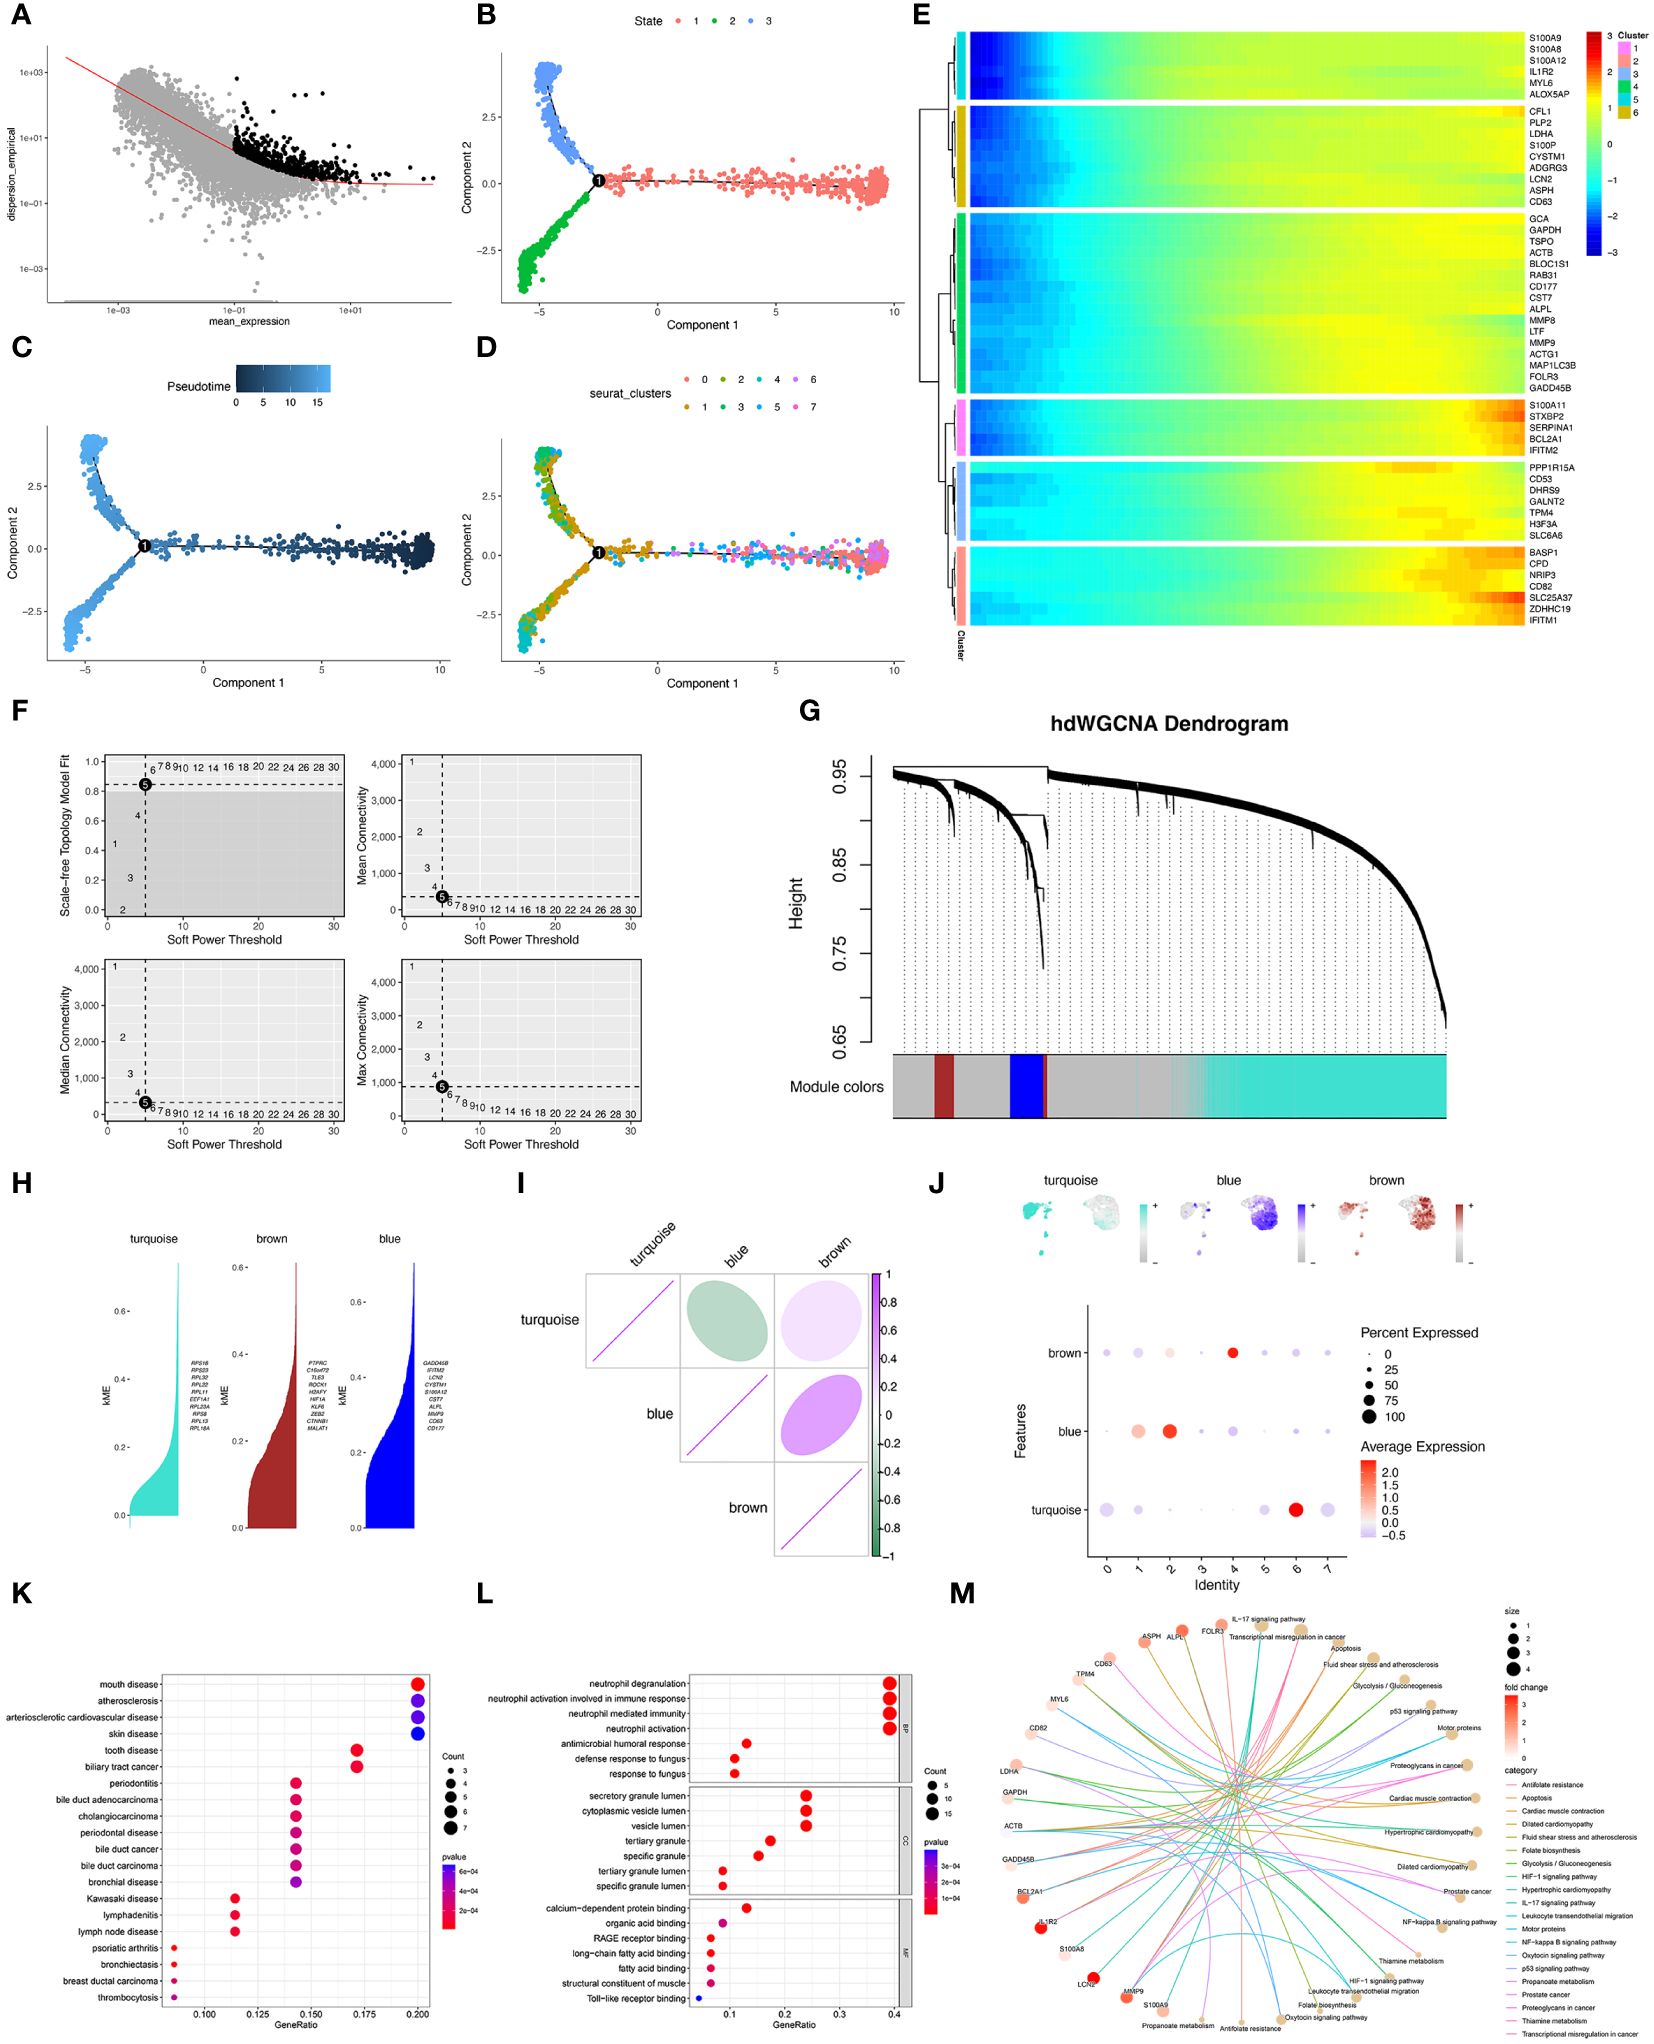
Figure 3 Pseudotime analysis and hdWGCNA analysis of sepsis-related neutrophils. (A–D) Pseudotime analysis for Neutrophils. (E) Six clusters of neutrophils by moncyte analysis and hub genes in each cluster were visualized. (F) Top left panel depicted the soft power threshold for choosing a scale-free topology model fit greater than or equal to 0.9. The other three panels showed the mean, median, and max connectivity of the topological network respectively when different minimum soft thresholds are chosen, reflecting the connectivity of the network. The average connectivity of the topological network is most stable at the lowest soft threshold equals. (G) Three modules were identified as shown in the hdWGCNA dendrogram. (H) Hub genes in each module were identified and ranked by k-means. (I) Correlation of three gene modules (turquoise, brown, and blue). (J) Feather plots depicted the corresponding module scores in neutrophils and the bubble plot displayed the scores obtained by three modules in neutrophils subtypes. (K) Dot plot of the DO functional enrich analysis of cluster 1&2 neutrophils. (L) Dot plot of the GO functional enrich analysis of cluster 1&2 neutrophils. (M) Cnet plot of the KEGG functional enrich analysis of cluster 1&2 neutrophils.
3.4 Hub genes selection based on machine learning algorithms
GSE57065 was regarded as training dataset and GSE95233 was validation dataset. Firstly, these two datasets were normalized before analysis (Supplementary Figures S3A–D). Secondly, datasets GSE57065 and GSE95233 were merged and normalized (Supplementary Figures S3E, F). Thirdly, meta-analysis was used to eliminate the batch effect (Supplementary Figures S3G, H). The differences in expression of 50 hub genes were showed (Figures 4A–C). Moreover, correlations between every two genes were also identified (Figure 4D). Hub genes of cluster 1&2 Sepsis_Neutrophils were subjected to LASSO regression and 8 features were selected (ALPL, ACTB, CD177, GAPDH, SLC25A37, S100A8, S100A9, and STXBP2) (Figures 4E, F). The coefficient of each feature was listed as Table 3. Besides, seven machine learning algorithms (k-Nearest Neighbors, Linear Discriminant Analysis, Logistic Regression, Naive Bayes, Random Forest, Recursive Partitioning, and Support Vector Machine) were utilized and mean AUCs of seven algorithms were compared (Figure 4G). Only the Recursive Partitioning showed a lower AUC compared with other six algorithms (Figure 4H). Moreover, the AUC in the validation dataset was 0.988 and the model had a strong generalization ability (Supplementary Figure S4). We demonstrated the expression of eight hub genes in the training dataset GSE57065. All eight hub genes showed statical higher expressions in neutrophils under sepsis (Figure 4I). ROC curves showed that five hub genes (except ACTB, S100A8, and SLC5A37) all showed higher AUCs (Figure 4J). In validation dataset GSE95233, six hub genes except ACTB and SLC5A37 expressed higher significantly in neutrophils under sepsis (Supplementary Figure S5A). ROC curves showed that six hub genes except ACTB and SLC5A37 all showed higher AUCs (Supplementary Figure S5B).
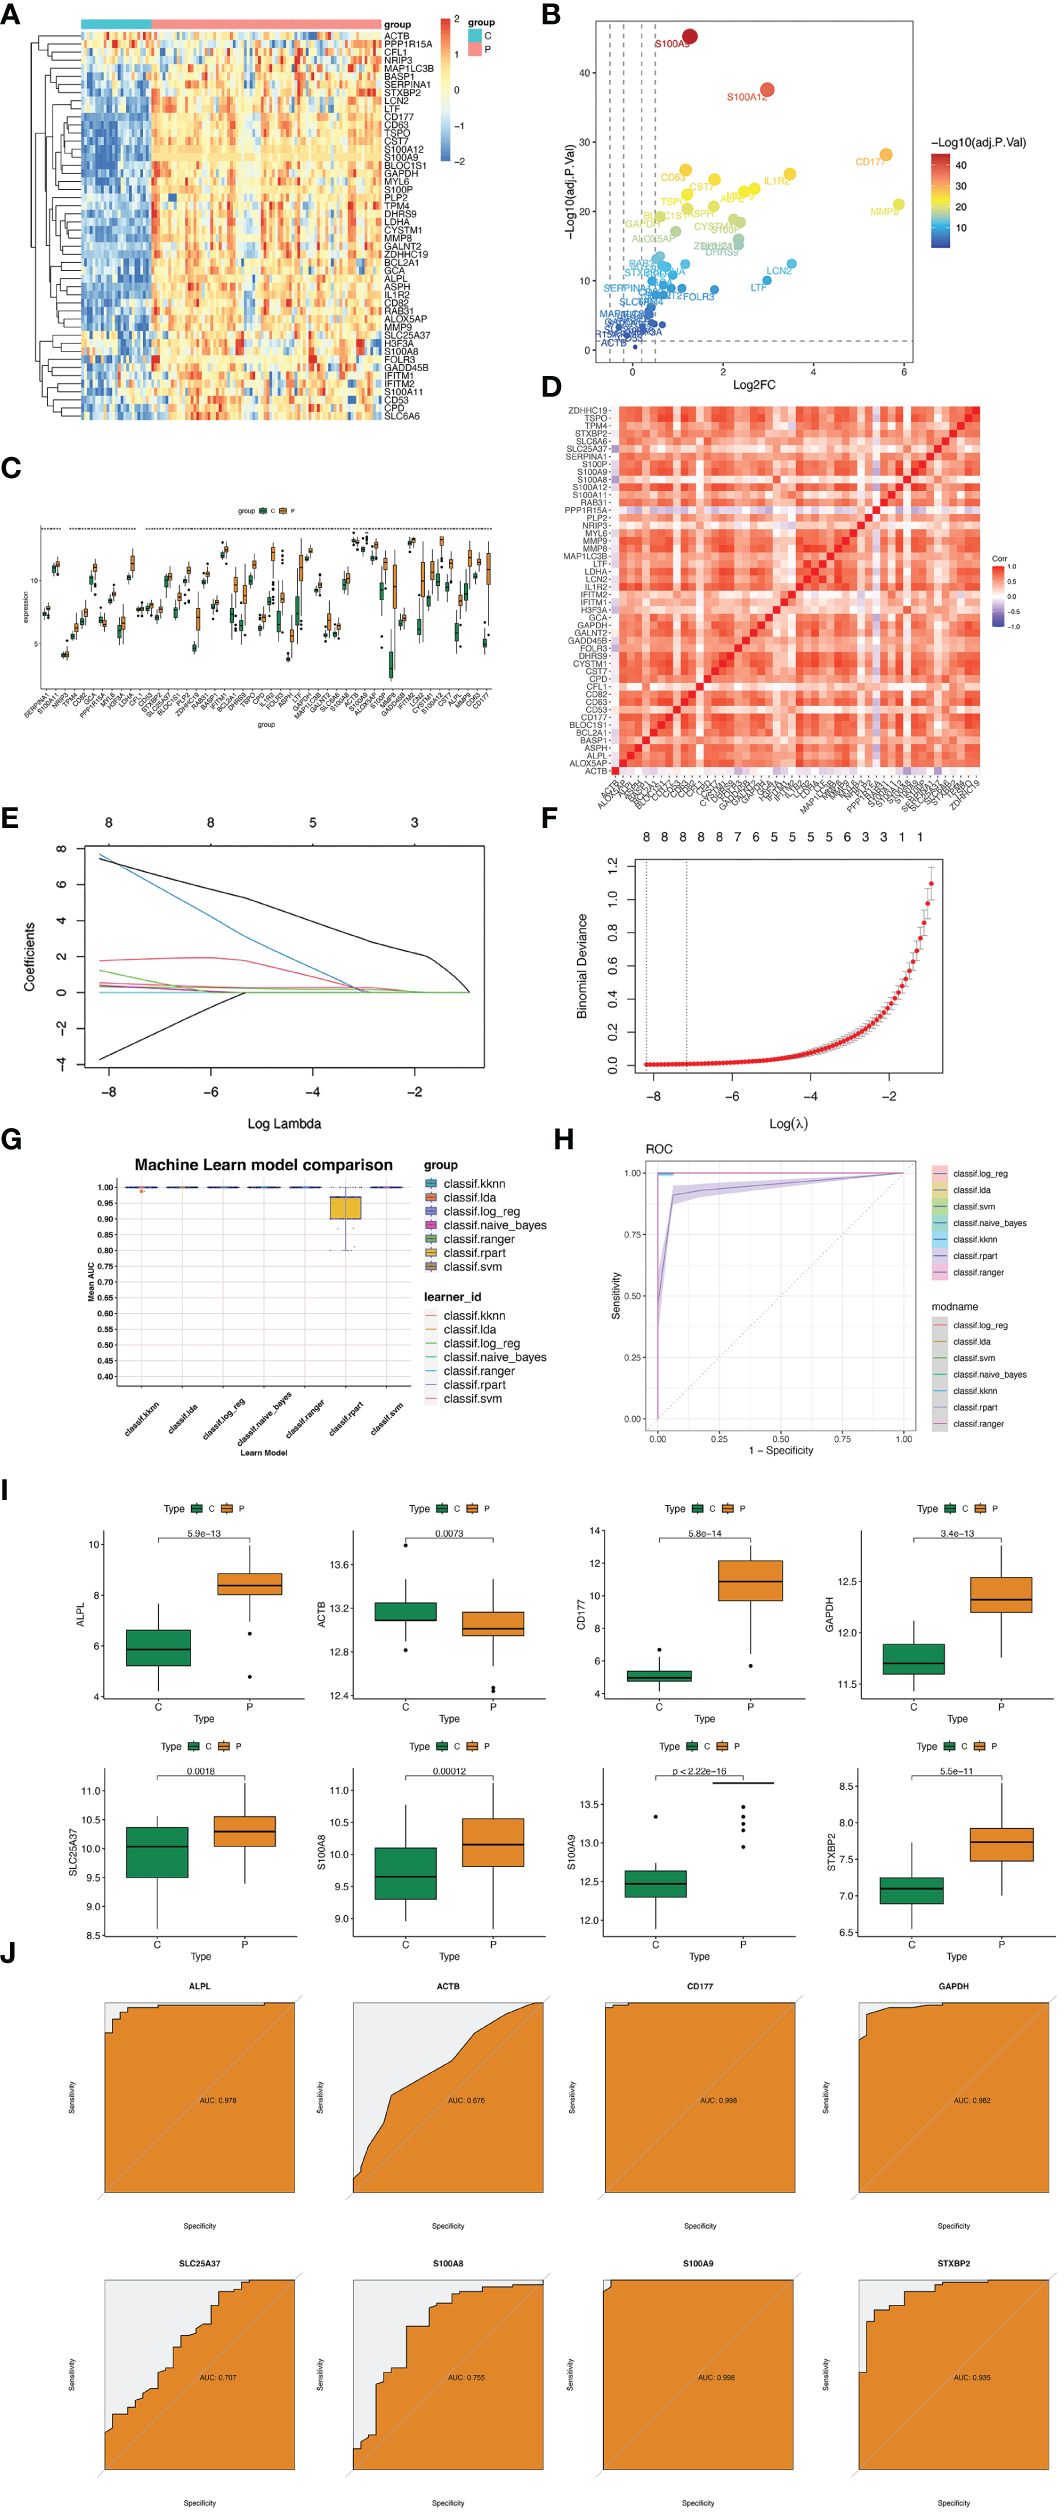
Figure 4 Hub genes selection based on machine learning algorithms. (A) Heatmap displaying the distribution of 50 DEGs. (B) Volcano plot showing expression of DEGs (|logFC|>1 and adjusted P value<0.05) in cluster 1&2 neutrophils. (C) Box plots displaying the expression of the expression of the top 50 genes. (D) Heatmap for correlations between 50 DEGs. (E) Coefficient profile plots showing the shrinkage of gene number. (F) Penalty plot for the LASSO model. (G) The AUC of seven machine learning althogrims. (H) Mean AUC of fivefold cross-validation for 9 replications of each model. (I) Expression difference of ALPL, ACTB, CD177, GAPDH, SLC25A37, S100A8, S100A9, and STXBP2 in GSE57056 between sepsis group and control group. (J) In GSE57056, ROC curve of predicted risk scores of ALPL, ACTB, CD177, GAPDH, SLC25A37, S100A8, S100A9, and STXBP2 in sepsis diagnosis. *, P<0.05.
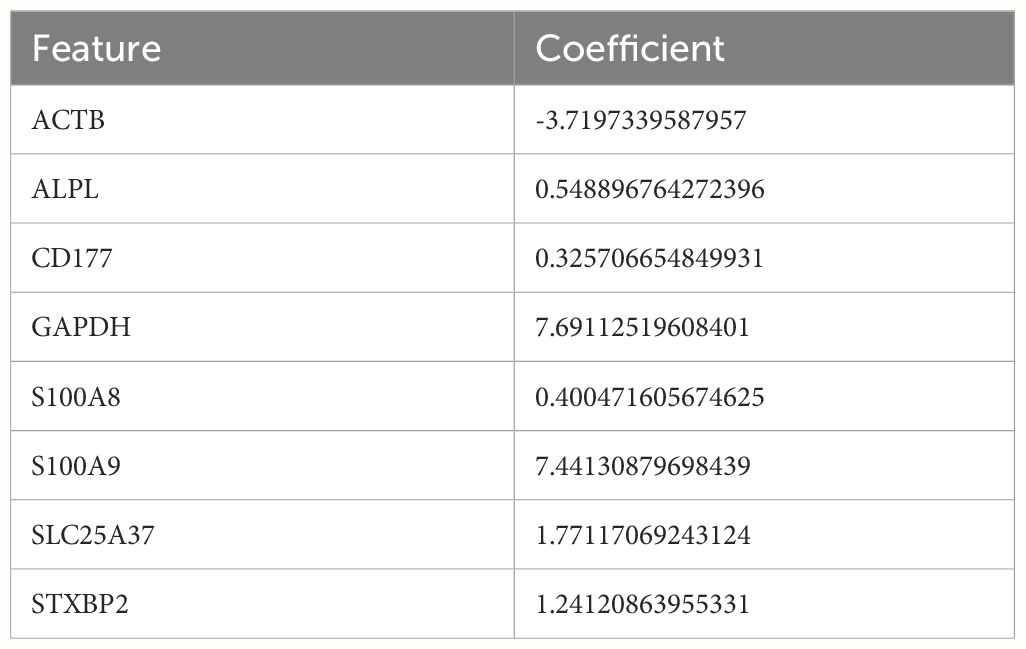
Table 3 The coefficient of each feature.
3.5 Immune analysis of hub genes
Significant differences were observed in B cell naïve, B cells memory, Plasma cells, T cells CD8+, T cells CD4+ naïve, T cells CD4+ memory resting, T cells follicular helper, T cells gamma delta, NK cells resting, Macrophages M0, Macrophages M1, Macrophages M2, Dendritic cells resting, Dendritic cells activated, Mast cells resting, Mast cells activated, Eosinophils, and Neutrophils (Figures 5A, B). Moreover, the correlation between hub genes and immune cells were identified and visualized (Figure 5C). Hub genes were positively associated with Macrophage M0 cells. Hub genes negatively correlated with T cells CD4+ memory resting, T cells CD8+, T cells gamma delta, and T cells CD4+ memory activated. To explore the correlation between each hub gene and immune cells, correlation between 20 types of immune cells and eight hub genes were showed (Supplementary Figures S6–S13). Among eight hub genes, only S100A9 and STXBP2 showed no significant correlation with neutrophils. While correlations with other immune cells were also showed.
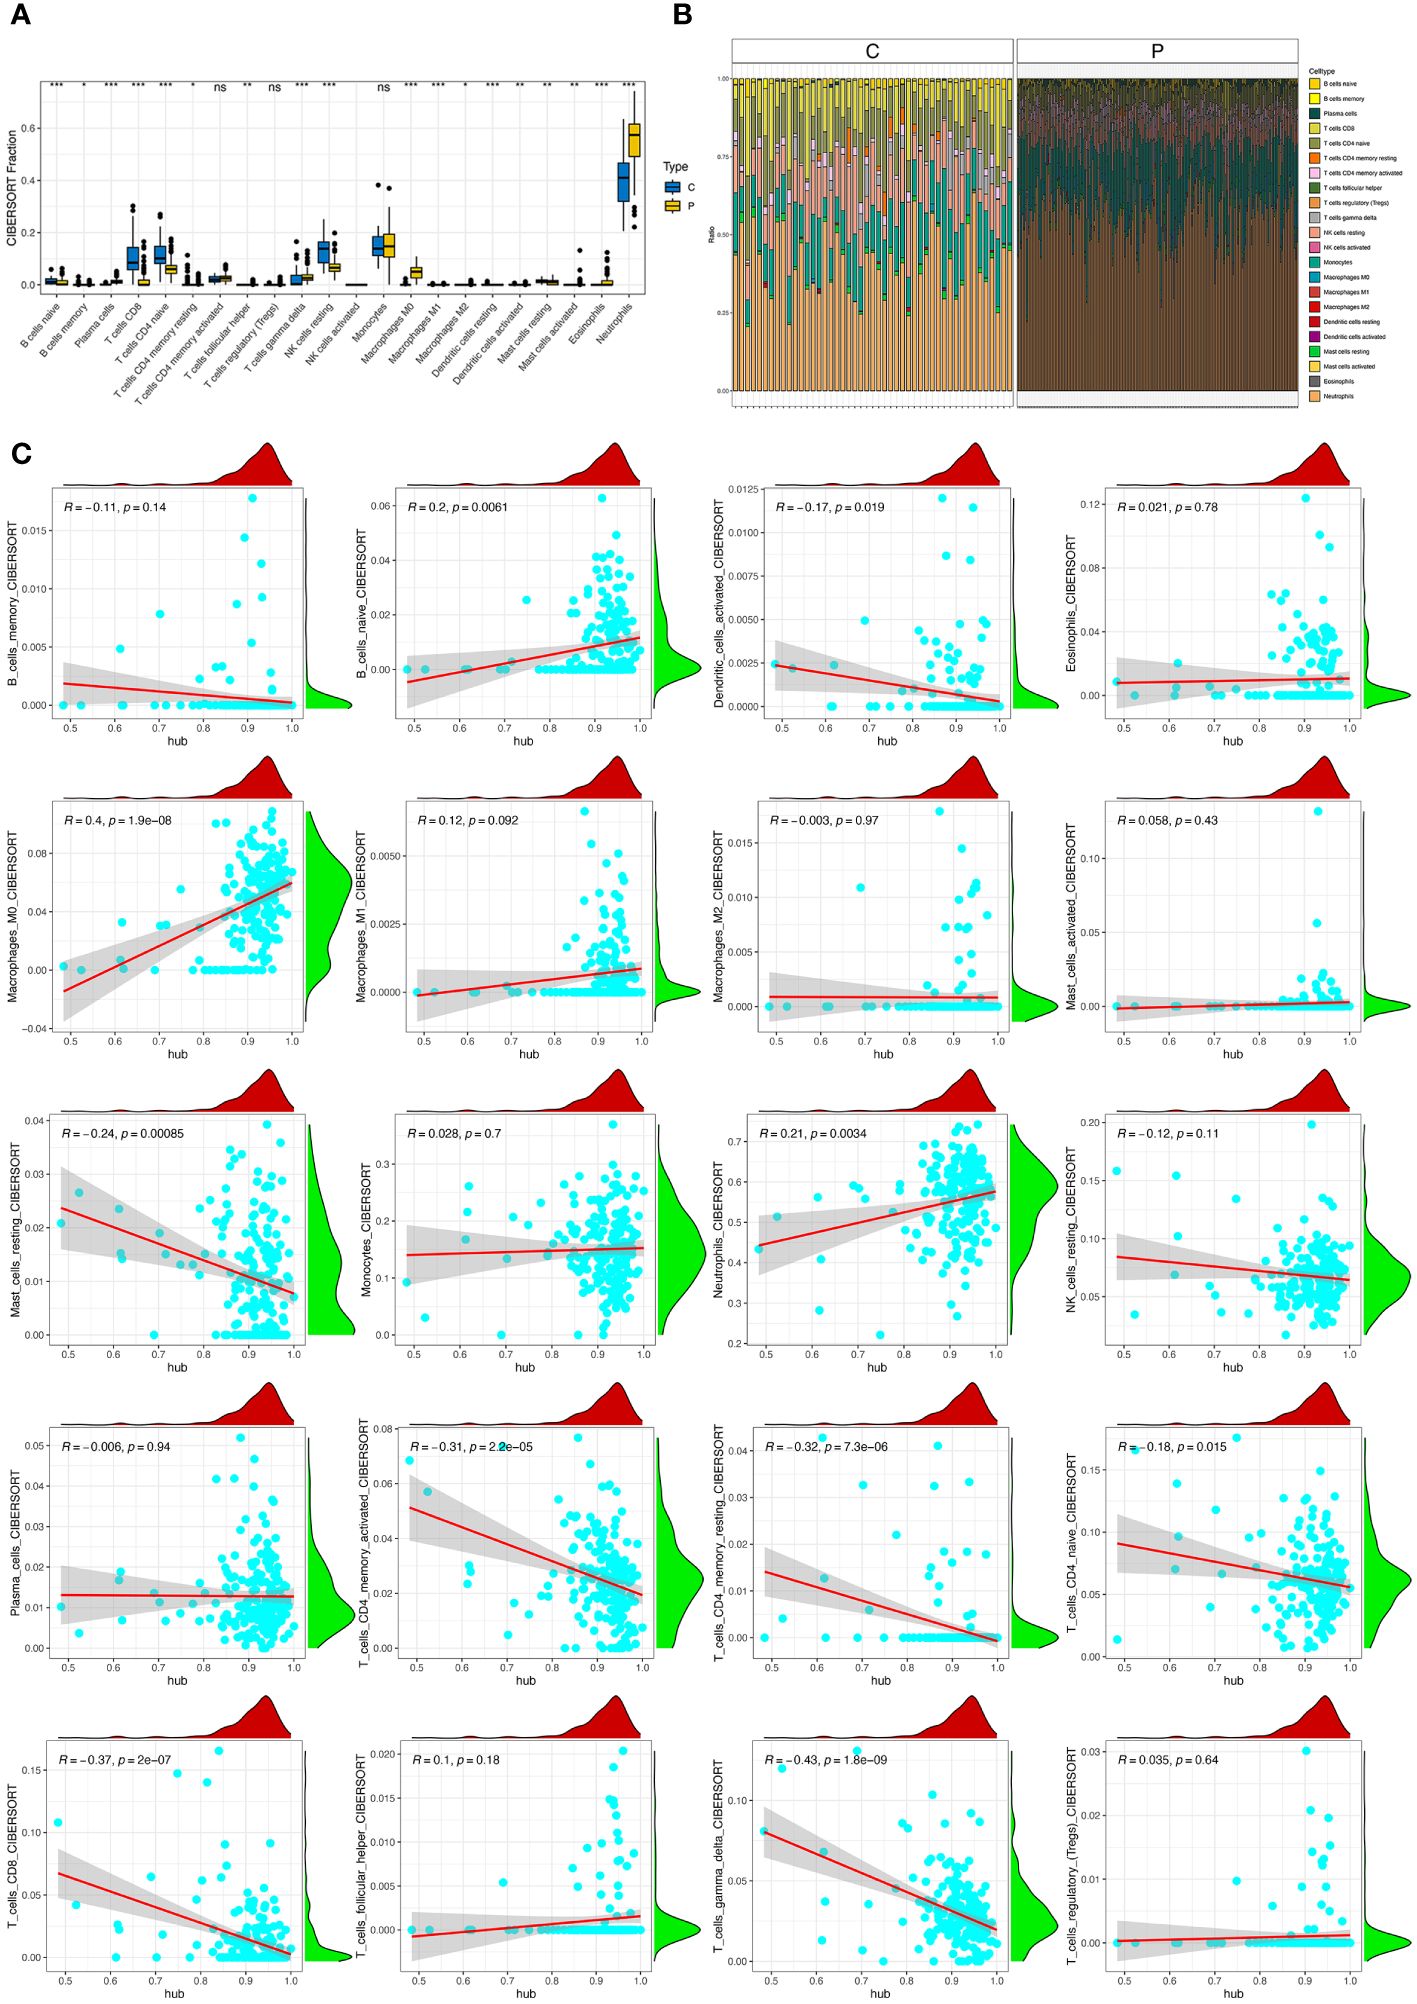
Figure 5 Immune infiltration in sepsis. (A) Panel representative boxplot shows the differences of infiltrated immune cells between sepsis samples (P type) and control samples (C type). (B) The relative proportions of 22 immune cell types between sepsis samples (P type) and control samples (C type). (C) Correlations between hub genes and immune cells. *, P<0.05; **, P<0.01; ***, P<0.001; ns, P>0.05.
3.6 Function analysis of hub genes
ssGSEA and GSEA showed the potential biological pathway of eight hub genes in sepsis (Figures 6A, B). GSVA analysis showed that expression and correlation between eight hub genes and relative pathways in sepsis (Figures 6C, D). GSVA analysis showed that eight hub genes of neutrophils in sepsis were mainly enriched in Glycosaminoglycan_Degradation, Insulin_Signaling_Pathway, Prostate_Cancer, and Melanoma. Moreover, GSEA analysis reveals that related pathways of hub genes. Potential pathways that associated with up-regulation of eight hub genes(ALPL, ACTB, CD177, GAPDH, SLC25A37, S100A8, S100A9, and STXBP2)were showed in Supplementary Figure S14A. Results showed higher expression of eight hub genes mostly associated with starch and sucrose metabolism. Additionally, pathways of ribosome and graft-verus-host disease that associated with down-regulation of eight hub genes (ALPL, ACTB, CD177, GAPDH, SLC25A37, S100A8, S100A9, and STXBP2) were showed in Supplementary Figure S14B.
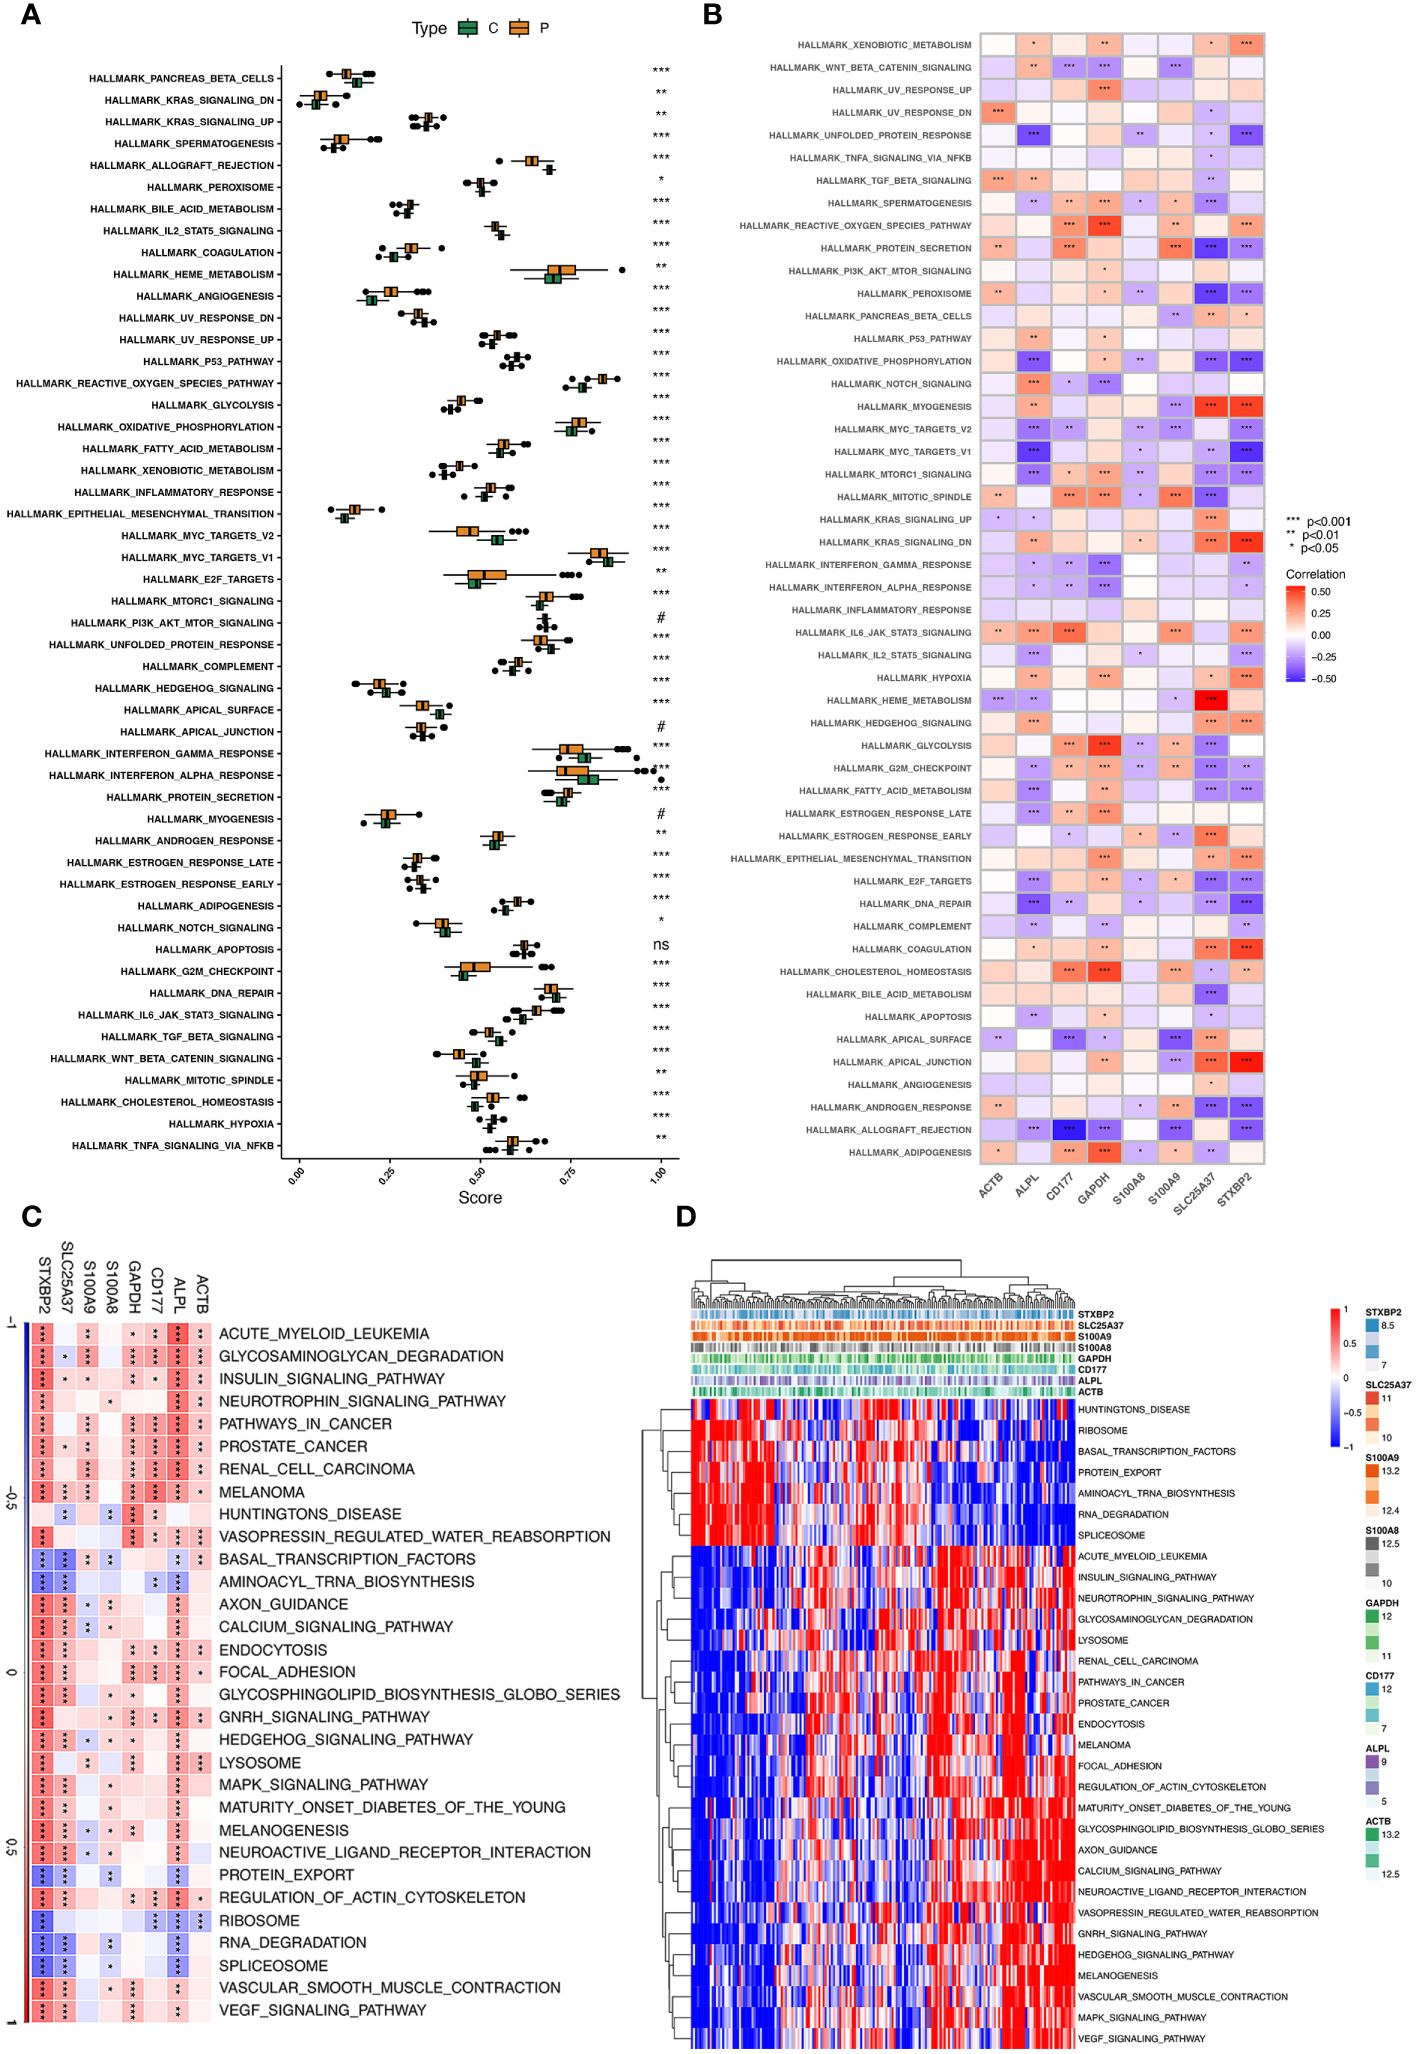
Figure 6 ssGSEA and GSVA of eight hub genes. (A) The specific distribution of the 50 hallmark gene sets in sepsis samples (P type) and control samples (C type). (B) Correlation analysis of the 50 hallmark gene sets with eight hub genes. (C, D) Heatmap showing the enriched pathways of eight hub genes in neutrophil clusters using GSVA.
3.7 Transcriptional factor network and hub genes
SCENIC was to identify TFs with gene expression activity among subclusters of neutrophils. We applied the SCENIC analysis pipeline to the neutrophils and resolved distinct regulons associated with each cluster in neutrophils. Regulons were robust in activity and specific for each cell type (Figures 7A, B). For example, FOS_extended_(36g) and FOS_(28g)were lower active in the sepsis-specific neutrophils. Moreover, SPI1_extended_(38g), SPI1_(37g), and HMGB1_(11g) were highly active in the sepsis-specific neutrophils (Figure 7C). Heatmap of 25 TFs between sepsis and healthy control were showed (Figure 7D). The top ten TFs with the most difference between sepsis and healthy control, including SPI1, HMGB1, JUN, NFIL3, RUNX1, CEBPD, FOS, REL, JUND, and FOSB (Figure 7E). The correlation analysis of the inferred TFs and 8 hub genes was performed. APLP, CD177, GAPDH, S100A9, and STXBP2 were significant associated with various TFs (Figure 7F).
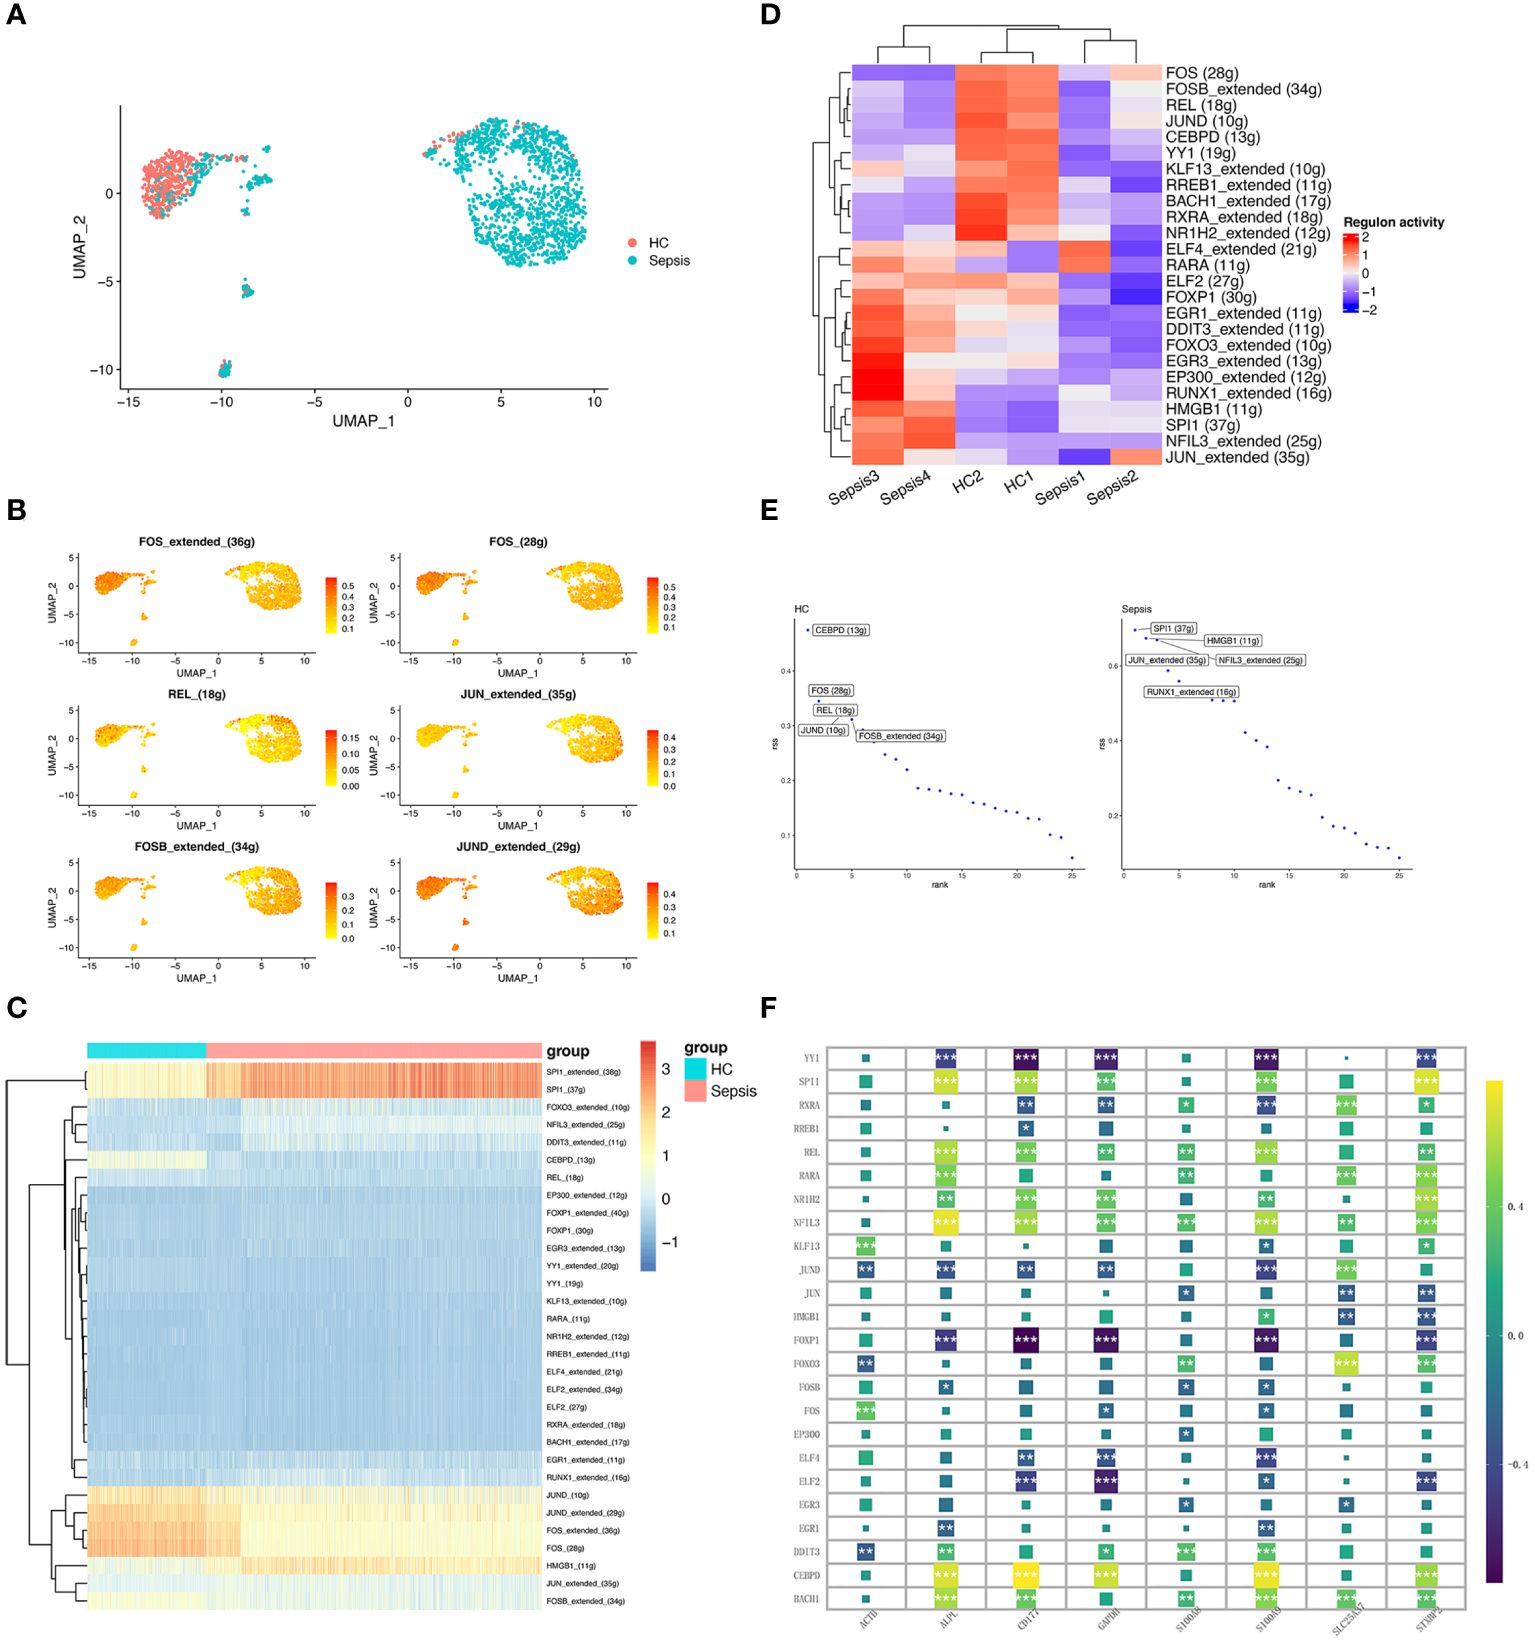
Figure 7 Transcriptional regulatory network of neutrophils. (A) UMAP plot depicts the distribution of neutrophils in the sepsis and healthy control groups. (B) Activity distribution of FOS, REL, JUN, FOSB, and JUND. (C) Heatmap shows the differences of TFs in neutrophils between the sepsis and healthy control groups. (D) Heatmap of the top 25 regulators with the highest area under curve (AUC) scores showing the activity of TFs in neutrophils clusters using SCENIC. (E) Top activities of TFs between different groups. RSS indicates Regulon Specificity Score. (F) Correlation between eight hub genes (ALPL, ACTB, CD177, GAPDH, SLC25A37, S100A8, S100A9, and STXBP2) expression and the level of 24 inferred TFs. *, P<0.05; **, P<0.01; ***, P<0.001.
3.8 Validation of hub genes in sepsis mice model
Moreover, gene correlations were identified and visualized (Figure 8A). CD177 and S100A9 showed a highest correlation with significance. To evaluate the expression of eight hub genes in neutrophils under sepsis. We established two sepsis model: CLP model and LPS-induced model. qRT-PCR detected the relative expression of all eight genes in monocytes. Results showed that ALPL, CD177, S100A8, S100A9, and STXBP2 significantly up regulated in sepsis (Figure 8B). In conclusion, ALPL, CD177, S100A8, S100A9, and STXBP2 may be play a vital role in neutrophils function response to sepsis.

Figure 8 Correlations and the relative expressions of eight hub genes were validated by qRT-PCR. (A) Correlation between eight hub genes (ALPL, ACTB, CD177, GAPDH, SLC25A37, S100A8, S100A9, and STXBP2) expression. (B) The expressions of ALPL, ACTB, CD177, GAPDH, SLC25A37, S100A8, S100A9, and STXBP2 (ns, P>0.05; *P<0.05; **P<0.01; ***P<0.001; ****P<0.0001).
4 Discussion
In this study, we first discovered new clusters of neutrophils between sepsis and healthy control samples based on the datasets GSE167363. A previous study showed the cells in GSE167363 were isolated within 24 h through density gradient centrifugation, which indicates the reliability of bioinformatics analysis (14). We identified 8 clusters of neutrophils based on sc-RNA analysis, while proportions of cluster 1&2 were with the most difference. Then, we applyied hdWGCNA, a thorough method for examining co-expression networks in highly dimensional transcriptomics data, to identify hub gene modules in new clusters 1&2 of neutrophils (15). Hub genes of new clusters of neutrophils were identified and the lasso regression screened eight hub genes (ACTB, ALPL, CD177, GAPDH, S100A8, S100A9, SLC25A37, and STXBP2). Seven machine learning algorithms (k-Nearest Neighbors, Linear Discriminant Analysis, Logistic Regression, Naive Bayes, Random Forest, Recursive Partitioning, and Support Vector Machine) were used to demonstrate the diagnostic performance. Then we investigated expression, the biological function, and the immune cell landscape of eight hub genes in sepsis. Finally, we validated the role of eight hub genes in both CLP- and LPS-induced sepsis in mice.
ML has shown great promise in enhancing the prediction, diagnosis, and management of sepsis. Min Huang et al. conducted the Support Vector Machine classifier and identified mortality biomarkers of sepsis (16). Moreover, another study applied a new machine learning method in predicting 20 differentially expressed genes for sepsis outcomes (17). In our study, we first applied single-cell RNA analysis to identify specific neutrophil clusters. Then, hdWGCNA and multiple machine learning methods were applied to identify hub genes. The hdWGCNA is an advanced computational framework designed to analyze and interpret high-dimensional transcriptomics data, such as single-cell RNA-seq or spatial transcriptomics (18). hdWGCNA was used in multiple cancer (including pancreatic cancer, breast cancer, and gastric cancer) (19–21). So far, hdWGCNA combining single-cell RNA sequencing has not been reported in sepsis. Moreover, we applied multiple ML algorithms to validate the clinical role of hub genes. This reflects the technique novelty of our study.
Neutrophils is an effector cell in the innate immune system that helps to fight infection as a first line of defense (22). Studies showed that sepsis-related neutrophils were dysfunctional and contributed to the multi-organ failure (22). Among multiple organs, the lung is the first and most frequently injured organ to fail (23). Moreover, the acute respiratory distress syndrome (ARDS), which resulted from the acute lung injury (ALI), was the main factors of sepsis patients’ deaths (23).
Neutrophils play both important protective and harmful functions in sepsis, according to data from animal models, some of which include particular subsets (24). Evidence has shown that different neutrophil subtypes or states, such as their release levels of cytokines, myeloperoxidase, reactive oxygen species (ROS), and neutrophil extracellular traps (NETs) in distinct clinical circumstances, are functionally diverse in critical immune phenotypes (25). Previous studies showed PD-L1 is upregulated on neutrophils during sepsis and neutrophils may suppress acquired immunity via the PD-L1/PD-1 immune checkpoint (26). The clinical observation of a “left shift” in the total blood count to more immature neutrophils in cases of severe illness in humans is well known (24). Hong et al. identify four neutrophil subtypes in sepsis based on sc-RNA sequencing and characterized by different expressing genes (27). In our study, we also identified sepsis-specific neutrophil clusters based on single-cell RNA analysis. Moreover, our work emphasized on revealing the genes that is specific to sepsis in those subpopulations of neutrophils based on “hdWGCNA” and multiple ML methods. However, our study showed that specific clusters of neutrophils appeared at the late stage of sepsis, which was in accord with the previous study (26). And these specific clusters may be the potential subsets of neutrophils in response to sepsis. Moreover, identifying specific clusters of neutrophils and related hub genes is vital for treating sepsis. RuiCi Lin. Et.al. found that Tram-/- neutrophils enable effective reprogramming into a resolving state that is beneficial for treating experimental sepsis via reprogramming monocytes, neighboring neutrophils, T cells and endothelial cells (28). In our study, we identified two specific neutrophil subtypes and related eight hub genes (ACTB, ALPL, CD177, GAPDH, S100A8, S100A9, SLC25A37, and STXBP2). Indeed, only ALPL, CD177, S100A8, S100A9, and STXBP2 showed elevated expression in vivo sepsis model. Therefore, ALPL, CD177, S100A8, S100A9, and STXBP2 may be potential targets in treating sepsis.
Dysfunction of ALPL was known as the main cause of hypophosphatasia (HPP) (29). However, studies of ALPL in sepsis and neutrophils was still limited. In a prospective cross-sectional study containing 427 Emergency Department patients, ALPL showed as a biomarker of infectious and its AUC value was 0.83 (30). In neutrophils, ALPL encodes neutrophil alkaline phosphatase (NAP), a membrane-bound glycosylated protein that functions to catalyze dephosphorylation and transphosphorylation events (31). In sepsis, neutrophil NAP number substantially rises during bacterial infections when the cells are stimulated by inflammatory signals, and NAP-overexpressed neutrophils exhibit accelerated chemotaxis, which promotes their movement towards inflammatory areas, ROS production, and apoptosis (32).
CD177, a GPI-anchored protein, interacted with the proteinase-3 receptor (PR3) and CD177-PR3 complex regulates neutrophil migration in circulation (33). Previous study showed CD177 was up regulated in neutrophils under sepsis and neutrophil expressed CD177 anchored less with platelets, associated with less NETosis and worse outcome (34). Interestingly, expression of CD177 was negatively with expression of CD10 in neutrophils, which is a marker of immature myeloid cells (35). This was consisted with our study, which is those specific neutrophils with CD177 expression appeared at the late stage of sepsis. Ingred GR et al. identified a new cluster of neutrophils with high expression of CD177 and suppression of CD10 in response to infections (36). Moreover, this new cluster of neutrophils were found absence in healthy individuals and newly released from the bone marrow (36).
S100 family members S100A8 and S100A9 are cytoplasmic EF-hand Ca2+-binding proteins (37). A previous study verified that expressions of S100A8/A9 are elevated in blood cells of sepsis patients and S100A8/A9 showed high accuracy in sepsis diagnosis (38). S100A8/A9 also interacted with platelets under inflammation and regulated neutrophil recruitment (39). S100A8/A9 bind to TLR-4 and induce platelet pyroptosis, which are highly effective in causing NETosis (40). In addition, NETs release S100A8/A9, which further promotes platelet pyroptosis (40). They combine to generate a heterodimer that is strongly expressed in active neutrophils (37). Moreover, S100A8/A9 was mostly enriched in damage-associated molecular patterns (DAMPs) (41). Similarly, Sprenkeler EGG et al. showed that S100A8/A9 promote adhesion and elevate CD11b expression of neutrophils, which verify this DAMPs amplifies neutrophil activation (42). S100A9 also promotes neutrophils differentiated into pro-inflammatory N1 sub-population, as well as the chemotactic and enzymatic activity of N1 sub-population (43).
STXBP2, is crucial for the formation of the SNARE complex in platelets (44). In sepsis, STXBP2 in platelets regulated activation of platelets, NETosis, and sepsis thrombosis. However, the role of STXBP2 in neutrophils was still unclear. Our study showed that over-expressed of STXBP2 in neutrophils may be potential character in sepsis. Therefore, the specific function of STXBP2 needs to be further investigated.
5 Conclusions
In our study, we discovered specific clusters of neutrophils in sepsis based on single-cell RNA sequencing. We also identified five hub genes (ALPL, CD177, S100A8, S100A9, and STXBP2) in those special neutrophil clusters via the hdWGCNA method, machine learning algorithms, and transcriptomic analysis, as well as experimental verification. Our next step was to explore effects of five hub genes in neutrophils under sepsis. Five potential targets were identified for translational study in sepsis based on our novel mechanism.
Data availability statement
The original contributions presented in the study are included in the article/Supplementary Material. Further inquiries can be directed to the corresponding author.
Ethics statement
The animal studies were approved by Ethics Committee of General Hospital of Northern Theater Command. The studies were conducted in accordance with the local legislation and institutional requirements. Written informed consent was obtained from the owners for the participation of their animals in this study.
Author contributions
PX: Writing – original draft. ZT: Writing – original draft. CZ: Writing – review & editing.
Funding
The author(s) declare that no financial support was received for the research, authorship, and/or publication of this article.
Conflict of interest
The authors declare that the research was conducted in the absence of any commercial or financial relationships that could be construed as a potential conflict of interest.
Publisher’s note
All claims expressed in this article are solely those of the authors and do not necessarily represent those of their affiliated organizations, or those of the publisher, the editors and the reviewers. Any product that may be evaluated in this article, or claim that may be made by its manufacturer, is not guaranteed or endorsed by the publisher.
Supplementary material
The Supplementary Material for this article can be found online at: https://www.frontiersin.org/articles/10.3389/fimmu.2024.1377817/full#supplementary-material.
Supplementary Figure 1 | Quality control of scRNA-seq data before analysis. (A, B) Quality control conditions. (C) Correlation between the number of genes detected and the sequencing depth. (D) The “PCA” method was used to reduce dimension. (E) The “harmony” method was used to eliminate redundant samples.
Supplementary Figure 2 | Cell abundance of scRNA-seq samples. (A, B) Differential cell abundance from whole-blood scRNA-seq with sampled neighborhoods colored by statistical significance (spatial FDR < 0.05) in patient samples in 2 healthy subsets and 4 sepsis subsets.
Supplementary Figure 3 | Data preprocessing. (A) Gene expression level statistics of GSE57056 before removed batch effect. (B) Gene expression level statistics of GSE57056 after removed batch effect. (C) Gene expression level statistics of GSE95233 before removed batch effect. (D) Gene expression level statistics of GSE95233 after removed batch effect. (E) Gene expression level statistics of meta datasets (merging GSE57056 and GSE95233) before removed batch effect. (F) Gene expression level statistics of meta datasets (merging GSE57056 and GSE95233) after removed batch effect. (G-H) PCA of merging data (GSE95233 and GSE57065).
Supplementary Figure 4 | ROC curve of the diagnostic model in the independent external validation set.
Supplementary Figure 5 | Identification of expression difference and ROC in the validation dataset GSE95233. (A) Expression difference of ALPL, ACTB, CD177, GAPDH, SLC25A37, S100A8, S100A9, and STXBP2 in GSE95233 between sepsis group and control group. (B) In GSE95233, receiver operating characteristic (ROC) curve of predicted risk scores of ALPL, ACTB, CD177, GAPDH, SLC25A37, S100A8, S100A9, and STXBP2 in sepsis diagnosis.
Supplementary Figure 6 | The correlation between ALPL expression and immune model. (A) Correlation Coefficient between ALPL and 22 immune cell types. (B) Correlation between ALPL and immune cell types with significance.
Supplementary Figure 7 | The correlation between ACTB expression and immune model. (A) Correlation Coefficient between ACTB and 22 immune cell types. (B) Correlation between ACTB and immune cell types with significance.
Supplementary Figure 8 | The correlation between CD177 expression and immune model. (A) Correlation Coefficient between CD177 and 22 immune cell types. (B) Correlation between CD177 and immune cell types with significance.
Supplementary Figure 9 | The correlation between GAPDH expression and immune model. (A) Correlation Coefficient between GAPDH and 22 immune cell types. (B) Correlation between GAPDH and immune cell types with significance.
Supplementary Figure 10 | The correlation between S100A8 expression and immune model. (A) Correlation Coefficient between S100A8 and 22 immune cell types. (B) Correlation between S100A8 and immune cell types with significance.
Supplementary Figure 11 | The correlation between S100A9 expression and immune model. (A) Correlation Coefficient between S100A9 and 22 immune cell types. (B) Correlation between S100A9 and immune cell types with significance.
Supplementary Figure 12 | The correlation between SLC25A17 expression and immune model. (A) Correlation Coefficient between SLC25A17 and 22 immune cell types. (B) Correlation between SLC25A17 and immune cell types with significance.
Supplementary Figure 13 | The correlation between STXBP2 expression and immune model. (A) Correlation Coefficient between STXBP2 and 22 immune cell types. (B) Correlation between STXBP2 and immune cell types with significance.
Supplementary Figure 14 | GSEA identifies signaling pathways in the optimal hub genes. (A) The main signaling pathways that are significantly enriched under the up regulation of ALPL, ACTB, CD177, GAPDH, SLC25A37, S100A8, S100A9, and STXBP2. (B) The main signaling pathways that are significantly enriched under the downregulation of ALPL, ACTB, CD177, GAPDH, SLC25A37, S100A8, S100A9, and STXBP2.
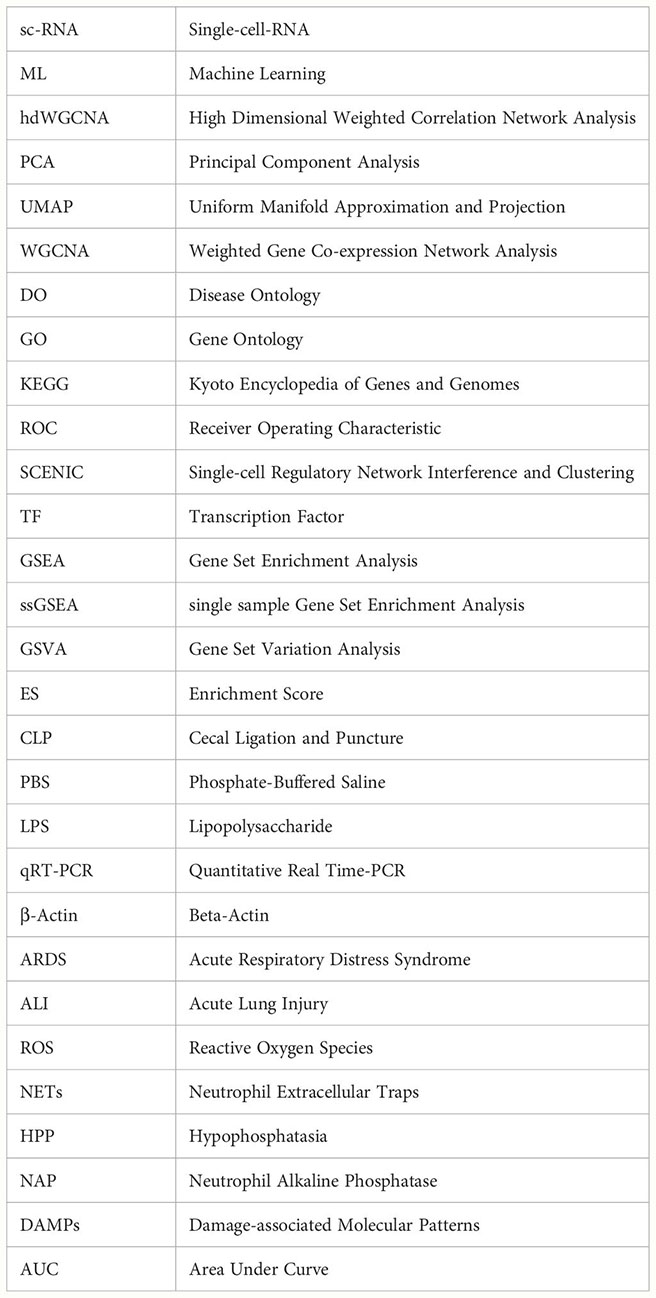
Glossary
References
1. Vincent JL. Current sepsis therapeutics. EBioMedicine. (2022) 86:104318. doi: 10.1016/j.ebiom.2022.104318
2. Zhang W, Fang X, Gao C, Song C, He Y, Zhou T, et al. MDSCs in sepsis-induced immunosuppression and its potential therapeutic targets. Cytokine Growth Factor Rev. (2023) 69:90–103. doi: 10.1016/j.cytogfr.2022.07.007
3. Schrijver IT, Théroude C, Roger T. Myeloid-derived suppressor cells in sepsis. Front Immunol. (2019) 10:327. doi: 10.3389/fimmu.2019.00327
4. Liu T, Wen Z, Shao L, Cui Y, Tang X, Miao H, et al. ATF4 knockdown in macrophage impairs glycolysis and mediates immune tolerance by targeting HK2 and HIF-1α ubiquitination in sepsis. Clin Immunol. (2023) 109698. doi: 10.1016/j.clim.2023.109698
5. Reyes M, Filbin MR, Bhattacharyya RP, Billman K, Eisenhaure T, Hung DT, et al. An immune-cell signature of bacterial sepsis. Nat Med. (2020) 26:333–40. doi: 10.1038/s41591-020-0752-4
6. Wang T, Zhang X, Liu Z, Yao T, Zheng D, Gan J, et al. Single-cell RNA sequencing reveals the sustained immune cell dysfunction in the pathogenesis of sepsis secondary to bacterial pneumonia. Genomics. (2021) 113:1219–33. doi: 10.1016/j.ygeno.2021.01.026
7. Li G, Yang Z, Yang C, Xie Y, Gong S, Lv S, et al. Single-cell RNA sequencing reveals cell-cell communication and potential biomarker in sepsis and septic shock patients. Int Immunopharmacol. (2024) 132:111938. doi: 10.1016/j.intimp.2024.111938
8. Li X, Fu S, Cheng H, Ma M, Song Z, Li J, et al. Differentiation of type 17 MAIT cells in circulation contributes to the severity of sepsis. Am J Pathol. (2024) S0002-9440(24)00125-1. doi: 10.1016/j.ajpath.2024.03.010
9. Zhang WY, Chen ZH, An XX, Li H, Zhang HL, Wu SJ, et al. Analysis and validation of diagnostic biomarkers and immune cell infiltration characteristics in pediatric sepsis by integrating bioinformatics and machine learning. World J Pediatr. (2023) 19:1094–103. doi: 10.1007/s12519-023-00717-7
10. Zhou W, Zhang C, Zhuang Z, Zhang J, Zhong C. Identification of two robust subclasses of sepsis with both prognostic and therapeutic values based on machine learning analysis. Front Immunol. (2022) 13:1040286. doi: 10.3389/fimmu.2022.1040286
11. Janevic T, Tomalin LE, Glazer KB, Boychuk N, Kern-Goldberger A, Burdick M, et al. Development of a prediction model of postpartum hospital use using an equity-focused approach. Am J Obstet Gynecol. (2023) S0002-9378(23)00769-X. doi: 10.1016/j.ajog.2023.10.033
12. Zhang T, Lian G, Fang W, Tian L, Ma W, Zhang J, et al. Comprehensive single-cell analysis reveals novel anergic antigen-presenting cell subtypes in human sepsis. Front Immunol. (2023) 14:1257572. doi: 10.3389/fimmu.2023.1257572
13. Newman AM, Liu CL, Green MR, Gentles AJ, Feng W, Xu Y, et al. Robust enumeration of cell subsets from tissue expression profiles. Nat Methods. (2015) 12:453–7. doi: 10.1038/nmeth.3337
14. Qiu X, Li J, Bonenfant J, Jaroszewski L, Mittal A, Klein W, et al. Dynamic changes in human single-cell transcriptional signatures during fatal sepsis. J Leukoc Biol. (2021) 110:1253–68. doi: 10.1002/JLB.5MA0721-825R
15. Morabito S, Reese F, Rahimzadeh N, Miyoshi E, Swarup V. hdWGCNA identifies co-expression networks in high-dimensional transcriptomics data. Cell Rep Methods. (2023) 3:100498. doi: 10.1016/j.crmeth.2023.100498
16. Huang M, Atreya MR, Holder A, Kamaleswaran R. A machine learning model derived from analysis of time-course gene-expression datasets reveals temporally stable gene markers predictive of sepsis mortality. Shock. (2023) 60:671–7. doi: 10.1097/SHK.0000000000002226
17. Banerjee S, Mohammed A, Wong HR, Palaniyar N, Kamaleswaran R. Machine learning identifies complicated sepsis course and subsequent mortality based on 20 genes in peripheral blood immune cells at 24 H post-ICU admission. Front Immunol. (2021) 12:592303. doi: 10.3389/fimmu.2021.592303
18. Yang H, Li Z, Zhu S, Wang W, Zhang J, Zhao D, et al. Molecular mechanisms of pancreatic cancer liver metastasis: the role of PAK2. Front Immunol. (2024) 15:1347683. doi: 10.3389/fimmu.2024.1347683
19. Xu W, Zhang W, Zhao D, Wang Q, Zhang M, Li Q, et al. Unveiling the role of regulatory T cells in the tumor microenvironment of pancreatic cancer through single-cell transcriptomics and in vitro experiments. Front Immunol. (2023) 14:1242909. doi: 10.3389/fimmu.2023.1242909
20. Chen Y, Jin C, Cui J, Diao Y, Wang R, Xu R, et al. Single-cell sequencing and bulk RNA data reveal the tumor microenvironment infiltration characteristics of disulfidptosis related genes in breast cancer. J Cancer Res Clin Oncol. (2023) 149:12145–64. doi: 10.1007/s00432-023-05109-y
21. Xu W, Jiang T, Shen K, Zhao D, Zhang M, Zhu W, et al. GADD45B regulates the carcinogenesis process of chronic atrophic gastritis and the metabolic pathways of gastric cancer. Front Endocrinol (Lausanne). (2023) 14:1224832. doi: 10.3389/fendo.2023.1224832
22. Bruserud Ø, Mosevoll KA, Bruserud Ø, Reikvam H, Wendelbo Ø. The regulation of neutrophil migration in patients with sepsis: the complexity of the molecular mechanisms and their modulation in sepsis and the heterogeneity of sepsis patients. Cells. (2023) 12:1003. doi: 10.3390/cells12071003
23. Park I, Kim M, Choe K, Song E, Seo H, Hwang Y, et al. Neutrophils disturb pulmonary microcirculation in sepsis-induced acute lung injury. Eur Respir J. (2019) 53:1800786. doi: 10.1183/13993003.00786-2018
24. Kwok AJ, Allcock A, Ferreira RC, Cano-Gamez E, Smee M, Burnham KL, et al. Neutrophils and emergency granulopoiesis drive immune suppression and an extreme response endotype during sepsis. Nat Immunol. (2023) 24:767–79. doi: 10.1038/s41590-023-01490-5
25. Jin H, Aziz M, Murao A, Kobritz M, Shih AJ, Adelson RP, et al. Antigen-presenting aged neutrophils induce CD4+ T cells to exacerbate inflammation in sepsis. J Clin Invest. (2023) 133:e164585. doi: 10.1172/JCI164585
26. Qi X, Yu Y, Sun R, Huang J, Liu L, Yang Y, et al. Identification and characterization of neutrophil heterogeneity in sepsis. Crit Care. (2021) 25:50. doi: 10.1186/s13054-021-03481-0
27. Hong Y, Chen L, Sun J, Xing L, Yang Y, Jin X, et al. Single-cell transcriptome profiling reveals heterogeneous neutrophils with prognostic values in sepsis. iScience. (2022) 25:105301. doi: 10.1016/j.isci.2022.105301
28. Lin R, Wang J, Wu Y, Yi Z, Zhang Y, Li L. Resolving neutrophils due to TRAM deletion renders protection against experimental sepsis. Inflamm. Res. (2023) 72(8):1733–44. doi: 10.1007/s00011-023-01779-z
29. Jandl NM, Schmidt T, Rolvien T, Stürznickel J, Chrysostomou K, von Vopelius E, et al. Genotype-phenotype associations in 72 adults with suspected ALPL-associated hypophosphatasia. Calcif Tissue Int. (2021) 108:288–301. doi: 10.1007/s00223-020-00771-7
30. Meltzer AC, Wargowsky RS, Moran S, Jordan T, Toma I, Jepson T, et al. Diagnostic accuracy of novel mRNA blood biomarkers of infection to predict outcomes in emergency department patients with undifferentiated abdominal pain. Sci Rep. (2023) 13:2297. doi: 10.1038/s41598-023-29385-3
31. Pan Y, Choi JH, Shi H, Zhang L, Su S, Wang X. Discovery and validation of a novel neutrophil activation marker associated with obesity. Sci Rep. (2019) 9:3433. doi: 10.1038/s41598-019-39764-4
32. Li H, Zhao Y, Li W, Yang J, Wu H. Critical role of neutrophil alkaline phosphatase in the antimicrobial function of neutrophils. Life Sci. (2016) 157:152–7. doi: 10.1016/j.lfs.2016.06.005
33. Bai M, Grieshaber-Bouyer R, Wang J, Schmider AB, Wilson ZS, Zeng L, et al. CD177 modulates human neutrophil migration through activation-mediated integrin and chemoreceptor regulation. Blood. (2017) 130:2092–100. doi: 10.1182/blood-2017-03-768507
34. Mulet M, Osuna-Gómez R, Zamora C, Artesero I, Arús M, Vera-Artazcoz P, et al. Dysregulated neutrophil extracellular traps formation in sepsis. Immunology. (2023) 170(3):374–87. doi: 10.1111/imm.13676
35. Demaret J, Venet F, Plassais J, Cazalis MA, Vallin H, Friggeri A, et al. Identification of CD177 as the most dysregulated parameter in a microarray study of purified neutrophils from septic shock patients. Immunol Lett. (2016) 178:122–30. doi: 10.1016/j.imlet.2016.08.011
36. Goretti Riça I, Joughin BA, Teke ME, Emmons TR, Griffith AM, Cahill LA, et al. Neutrophil heterogeneity and emergence of a distinct population of CD11b/CD18-activated low-density neutrophils after trauma. J Trauma Acute Care Surg. (2023) 94:187–96. doi: 10.1097/TA.0000000000003823
37. Shi W, Wan TT, Li HH, Guo SB. Blockage of S100A8/A9 ameliorates septic nephropathy in mice. Front Pharmacol. (2023) 14:1172356. doi: 10.3389/fphar.2023.1172356
38. Choi H, Lee JY, Yoo H, Jeon K. Bioinformatics analysis of gene expression profiles for diagnosing sepsis and risk prediction in patients with sepsis. Int J Mol Sci. (2023) 24:9362. doi: 10.3390/ijms24119362
39. Revenstorff J, Ludwig N, Hilger A, Mersmann S, Lehmann M, Grenzheuser JC, et al. Role of S100A8/A9 in platelet-neutrophil complex formation during acute inflammation. Cells. (2022) 11:3944. doi: 10.3390/cells11233944
40. Su M, Chen C, Li S, Li M, Zeng Z, Zhang Y, et al. Gasdermin D-dependent platelet pyroptosis exacerbates NET formation and inflammation in severe sepsis. Nat Cardiovasc Res. (2022) 1:732–47. doi: 10.1038/s44161-022-00108-7
41. Liu JX, Yang C, Zhang WH, Su HY, Liu ZJ, Pan Q, et al. Disturbance of mitochondrial dynamics and mitophagy in sepsis-induced acute kidney injury. Life Sci. (2019) 235:116828. doi: 10.1016/j.lfs.2019.116828
42. Sprenkeler EGG, Zandstra J, van Kleef ND, Goetschalckx I, Verstegen B, Aarts CEM, et al. S100A8/A9 is a marker for the release of neutrophil extracellular traps and induces neutrophil activation. Cells. (2022) 11:236. doi: 10.3390/cells11020236
43. Mihaila AC, Ciortan L, Macarie RD, Vadana M, Cecoltan S, Preda MB, et al. Transcriptional profiling and functional analysis of N1/N2 neutrophils reveal an immunomodulatory effect of S100A9-blockade on the pro-inflammatory N1 subpopulation. Front Immunol. (2021) 12:708770. doi: 10.3389/fimmu.2021.708770
Keywords: sepsis, neutrophils, single cell, hdWGCNA, machine learning
Citation: Xu P, Tao Z and Zhang C (2024) Integrated multi-omics and artificial intelligence to explore new neutrophils clusters and potential biomarkers in sepsis with experimental validation. Front. Immunol. 15:1377817. doi: 10.3389/fimmu.2024.1377817
Received: 28 January 2024; Accepted: 14 May 2024;
Published: 29 May 2024.
Edited by:
Jose Luis Fachi, Washington University in St. Louis, United StatesReviewed by:
Rishikesan Kamaleswaran, Emory University, United StatesZhongheng Zhang, Sir Run Run Shaw Hospital, China
Copyright © 2024 Xu, Tao and Zhang. This is an open-access article distributed under the terms of the Creative Commons Attribution License (CC BY). The use, distribution or reproduction in other forums is permitted, provided the original author(s) and the copyright owner(s) are credited and that the original publication in this journal is cited, in accordance with accepted academic practice. No use, distribution or reproduction is permitted which does not comply with these terms.
*Correspondence: Cheng Zhang, emhhbmdjMTEwOUAxNjMuY29t
†These authors share first authorship