 Yingying Wan
 Dan Ma
 Qinghua Shang1*
 Hao Xu
- 1National Clinical Research Center for Chinese Medicine Cardiology, Xiyuan Hospital, China Academy of Chinese Medical Sciences, Beijing, China
- 2China Academy of Chinese Medical Sciences, Xiyuan Hospital Suzhou Hospital, Suzhou, China
Background: Hypertension is one of the major risk factors for cardiovascular disease. Dietary flavonoids have been reported to reduce inflammation, protect against oxidative stress, protect the vascular endothelium, and improve vascular health. However, the relationship between dietary flavonoid intake and the prevalence of hypertension remains controversial.
Methods: This study included 8010 adults from the 2007-2010 and 2017-2018 National Health and Nutrition Examination Surveys (NHANES). The relationship between dietary flavonoid intake and the prevalence of hypertension was explored by weighted logistic regression and weighted restricted cubic spline.
Results: We found an inverse relationship between total anthocyanin intake and the prevalence of hypertension in the fourth quartile compared with the first quartile [0.81(0.66,0.99), p = 0.04]. Moreover, the prevalence of hypertension tended to decrease with increasing total anthocyanin intake in participants over 60 years of age. In addition, we found a U-shaped relationship between the prevalence of hypertension and total flavan-3-ol intake. Total flavan-3-ol intake was inversely associated with hypertension prevalence in the third quartile compared with the first quartile [0.79 (0.63,0.99), p = 0.04]. Moreover, there was a significant negative association between the prevalence of hypertension and total flavan-3-ol intake when total flavan-3-ol intake was below 48.26 mg/day.
Conclusion: Our study found a negative association between the prevalence of hypertension and moderate total anthocyanins intake and total flavan-3-ols intake. Our study provides evidence from a population-based study for a negative association between dietary flavonoid intake and the prevalence of hypertension.
1 Introduction
Hypertension is a common chronic disease and hypertension is one of the major risk factors for cardiovascular disease (1, 2). Hypertension puts enormous pressure on healthcare and economic systems. From 1975 to 2015, the prevalence of hypertension worldwide increased from 594 million to 1.13 billion (3). 46% of US adults have hypertension in 2017 (4). Management of hypertension includes both pharmacologic and non-pharmacologic interventions. Non-pharmacologic interventions help to reduce the use of anti-hypertensive medications and slow the progression of pre-hypertension (5, 6).
Inflammation may be an important mechanism in the development of hypertension (7, 8). Inflammation is the body’s defense mechanism in the face of a pathogen attack. Excessive reactive oxygen/reactive nitrogen species produced during oxidative metabolism can activate an inflammatory response leading to the synthesis and secretion of pro-inflammatory cytokines (9). Oxidative stress and inflammation cause endothelial dysfunction and arterial damage, resulting in hypertension (10, 11). Studies have found that nutritional control can reduce inflammation (12).
Flavonoids are biologically active polyphenolic compounds of plant origin (13). Flavonoids can be categorized into six main subclasses based on their chemical structure, including anthocyanins, flavan-3-ols, flavanones, flavonoids, flavonols, and isoflavones (14). Flavonoid compounds have anti-oxidative stress, anti-inflammatory, anti-viral, cardioprotective, anti-diabetic, anti-cancer, and other effects (15, 16). Regular consumption of flavonoids is beneficial in reducing the risk of many chronic diseases such as cancer, cardiovascular diseases, and neurodegenerative diseases (17, 18). Flavonoid compounds were found to inhibit the NF-κB p65 and MAPK pathways and reduce inflammation (19, 20). Flavonoid compounds can improve endothelial function by activating vascular Akt and eNOS. Akt is involved in the proliferation of vascular endothelial cells, and NO is produced after activation of Enos (21). Increased NO bioavailability improves vasodilatation and circulation and protects the vascular endothelium by affecting protein kinases, ion channels, and phosphodiesterases and counteracting vascular inflammation and low-density lipoprotein oxidative stress (22). Intake of flavonoids can help improve vascular health and reduce the risk of developing hypertension and cardiovascular disease (23).
There is less evidence from previous population-based studies, with some cross-sectional studies finding an association between blood pressure reduction and anthocyanins and total flavan-3-ols (24, 25), but some studies have reported nonsignificant results (26–28).
Therefore, this study used all publicly available data from the USDA Food and Beverage Flavonoid Values Database Survey (referred to as the Flavonoid Database) for 2007-2010 and 2017-2018, as well as flavonoid intake data from NHANES, to explore the association between dietary flavonoid intake and the prevalence of hypertension in U.S. adults over the age of 20. It is hoped that our study will inform the relationship between dietary flavonoid intake and the prevalence of hypertension.
2 Materials and methods
2.1 Study population
Data for this study were collected from the NHANES. The NHANES database is a major epidemiologic survey program conducted by the National Center for Health Surveys (NCHS) of the U.S. Department of Health and Human Services (HHS) to assess the health and nutritional status of the U.S. population’s health and nutritional status. NHANES is released every 2 years and collects health and nutritional information about participants through sampling of representative samples, including physiologic measurements, health questionnaires, laboratory tests, and nutritional surveys. Specific information can be retrieved on the NHANES website (https://www.cdc.gov/nchs/nhanes/index.htm). The NCHS Ethics Review Board approved the NHANES study protocol, and each participant signed an informed consent form.
We collected 29,940 participants from the NHANES database for two consecutive NHANES cycles in 2007-2010 and 2017-2018. After excluding 6397 participants with missing data on hypertension, 5113 with missing flavonoid intake, 4572 aged less than 20 years, and 5848 with missing data on other variables, 8010 participants were finally included.
2.2 Assessment of flavonoid intakes
We collected data on dietary flavonoid intake from the Flavonoid Database. The Flavonoid Database provides the amounts (mg/100 g) of 29 flavonoids from 6 flavonoids in all foods/beverages in the USDA Food and Nutritional Database for Dietary Studies (FNDDS). Specific information can be obtained from the FNDDS website (https://www.ars.usda.gov/northeast-area/beltsville-md-bhnrc/beltsville-human-nutrition-research-center/food-surveys-research-group/docs/fndds-flavonoid-database/). The flavonoid values from The Flavonoid Database can be used for dietary data in the What We Eat in America (WWEIA) and the NHANES. In this study, dietary flavonoid intake data were collected from the Flavonoid Database for 2007-2010 and 2017-2018. We defined dietary flavonoid intake as the average of the two-day intake of each flavonoid.
2.3 Assessment of hypertension
Based on the questionnaire and physical examination results, participants were diagnosed with hypertension if they met one of the following 3 conditions (1): the average systolic blood pressure ≥130 mmHg or the average diastolic blood pressure ≥80 mmHg (2); the answer to the question “have you ever been told to take a prescription for hypertension” was “yes” (3); the answer to the question “have you ever been told that you had high blood pressure” was “yes”. All Blood pressure determinations (systolic and diastolic) were taken in the mobile examination center. Average blood pressure was calculated by the following protocol: The diastolic reading with zero was not used to calculate the diastolic average. If all diastolic readings were zero, then the average would be zero. If only one blood pressure reading was obtained, that reading is the average. If there was more than one blood pressure reading, the first reading was always excluded from the average.
2.4 Assessment of covariates
Our study included the following covariates: age, gender, race, education, smoking status, alcohol drinking, poverty-to-income ratio (PIR), BMI (body mass index is calculated as weight in kilograms divided by height in meters squared), daily energy intake, total metabolic equivalents of weekly physical activity (total MET of PA), and BMI (body mass index) is calculated as weight in kilograms divided by height in meters squared. Disease covariates include hyperlipidemia, congestive heart failure, stroke, heart attack, coronary heart disease, and diabetes.
Races include Non-Hispanic White, Non-Hispanic Black, Mexican American or Other. Education level includes less than 9th grade, less than 9th grade, 9-11th grade (includes 12th grade with no diploma), high school graduate/GED or equivalent, some college or AA degree, and college graduate or above. The family income-poverty ratio was classified as<1.5, 1.5-3.5, > 3.5. Smoking status was classified as never (smoked less than 100 cigarettes in life), former (smoked more than 100 cigarettes in life and smoke not at all now), now (smoked more than 100 cigarettes in life and smoke some days or every day). Alcohol drinking was classified as never (had <12 drinks in lifetime); former (had ≥12 drinks in 1 year and did not drink last year, or did not drink last year but drank ≥12 drinks in lifetime); Mild (defined as 2 drinks per day for men and 1 drinks per day for women); moderate (defined as 3 drinks per day for men and 2 drinks per day for women, or binge drinking 2-4 days per day); heavy (defined as ≥4 drinks per day for men and ≥3 drinks per day for women, or binge drinking ≥ 5 days per day).
Hyperlipidemia was identified when any of the subsequent criteria were met: triglycerides≧150 mg/dL; total cholesterol≧200 mg/dL; low-density lipoprotein≧130 mg/dL; high-density lipoprotein ≤ 40mg/dL (male); high-density lipoprotein ≤ 50mg/dL (female); or utilization of antihyperlipidemic agents. The diagnostic criteria for congestive heart failure: the answer to the question “Have you ever been told that you had congestive heart failure” was “yes”. The diagnostic criteria for heart attack: the answer to the question “Have you ever been told that you had a heart attack” was “yes”. The diagnostic criteria for stroke: the answer to the question “Have you ever been told that you had a stroke” was “yes”. The diagnostic criteria for coronary heart disease: the answer to the question “Have you ever been told that you had coronary heart disease” was “yes”. The diagnostic criteria for diabetes were: the doctor told you to have diabetes, HbA1c ≥ 6.5%; fasting glucose ≥ 7.0 mmol/L; random blood glucose ≥ 11.1 mmol/L; two-hour OGTT blood glucose ≥ 11.1 mmol/L; utilization of diabetes medication or insulin. DM: diabetes mellitus; IFG: Impaired Fasting Glycaemia (fasting glucose 6.1-7.0 mmol/L); IGT: Impaired Glucose Tolerance (two-hour OGTT blood glucose 7.8-11.1 mmol/L).
2.5 Statistical analysis
We used R software (version 4.1.3) for statistical analysis. We used the R software packages “NHANESR” and “survey” for data organization and statistical analysis. Continuous variables in the analysis of baseline information were expressed as weighted mean ± standard deviation and compared between groups using one-way ANOVA. Categorical variables were expressed as frequencies and percentages and were compared using chi-square tests. Four weighted logistic regression models were used to examine the relationship between flavonoid intake and prevalence of hypertension. The crude model was unadjusted. Model 1 was adjusted by age, race, sex, and BMI. Model 2 was adjusted by age, race, sex, BMI, daily energy intake, smoking status, alcohol drinking, and education. Model 3 was adjusted by age, race, sex, BMI, daily energy intake, smoking status, alcohol drinking, education, Total MET of PA, PIR, hyperlipidemia, heart attack, stroke, congestive heart failure, coronary heart disease, and diabetes. Weighted RCS from the “rms” package was used to assess potential nonlinear associations. Subgroup-weighted logistic regression was used to analyze the effect of flavonoid intake on the prevalence of hyperlipidemia. Weighted logistic regression was used to calculate odds ratios (OR) and corresponding 95% confidence intervals (CI). The critical value for statistical significance was p<0.05. P-values for interactions based on the log-likelihood ratio test were used to assess the heterogeneity of the relationship between subgroups.
3 Results
3.1 Characteristics of participants
This study included 8010 NHANES participants (Figure 1), representing 126.2 million noninstitutionalized residents of the United States. Of these 8010 participants, 2996 had hypertension with a mean age of 41.14 years and 5014 did not have hypertension with a mean age of 55.87 years (Table 1). Participants with hypertension were 54.22% male, higher than those without hypertension. In terms of race, participants with hypertension were more likely to be non-Hispanic white and non-Hispanic black. Participants who were college graduates or over were less likely to have hypertension. In terms of smoking status, participants who had ever smoked were more likely to have hypertension. Participants who had former consumed alcohol, mildly consumed alcohol, or never consumed alcohol were more likely to have hypertension. Participants with hypertension were not significantly different from healthy participants at PIR. Participants with hypertension had a mean BMI of 30.88 kg/m2, which was higher than those without hypertension. The mean daily energy intake of participants with hypertension was 2085.19 kcal, which was less than that of participants without hypertension. Participants with hypertension had less total MET of PA than participants without hypertension. Participants with hypertension were more likely to have a combination of congestive heart failure, hyperlipidemia, heart attack, coronary heart disease, and diabetes. Participants with hypertension had greater total Isoflavones intake, total flavan-3-ols intake, total flavonols intake, and total sum of all 29 flavonoid intake compared to participants without hypertension.
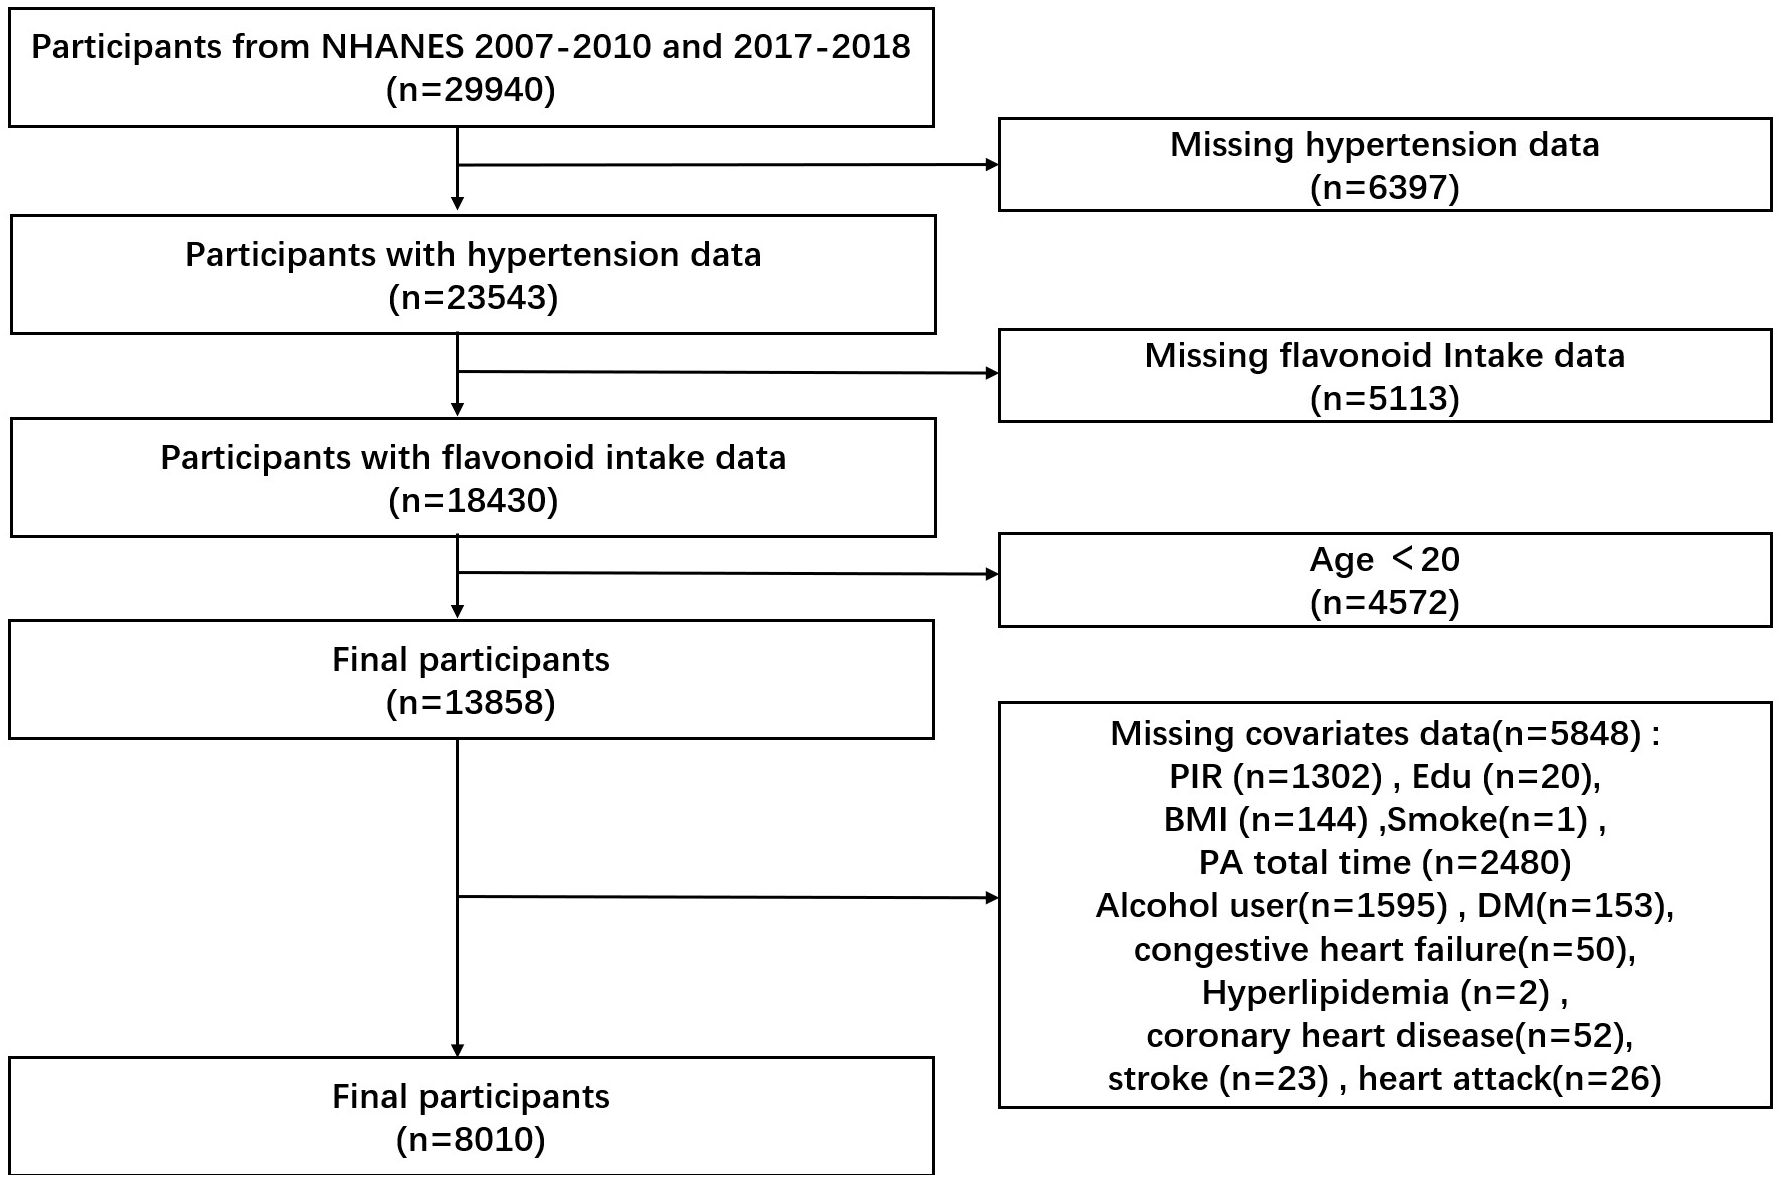
Figure 1 Flow chart of study participants.

Table 1 Characteristics of participants in the study.
3.2 Associations between flavonoid intake and prevalence of hypertension
To assess the potential association between flavonoid intake and risk of hypertension, analyses were performed using weighted logistic regression. The association was fully adjusted for age, race, sex, BMI, daily energy intake, smoking status, alcohol drinking, education, total MET of PA, PIR, hyperlipidemia, heart attack, stroke, congestive heart failure, coronary heart disease, and diabetes. Since more than 50% of the surveyed population reported no intake of isoflavones, we divided isoflavone consumption into two groups based on median intake. The remaining subcategories of flavonoids were categorized into quartiles based on their intake. After fully adjusting for weighted logistic regression (Table 2), we found that total anthocyanin intake was inversely associated with the prevalence of hypertension in the fourth quartile [0.81(0.66,0.99), p = 0.04] compared with the first quartile, however, the trend P value was not significant. Similarly, total Flavan-3-ols intake was inversely associated with the prevalence of hypertension in the third quartile [0.79(0.63,0.99), p = 0.04] compared with the first quartile, however, the trend P value was not significant. These results may indicate a nonlinear association between the prevalence of hypertension and the intake of total anthocyanins as well as total flavan-3-ols.
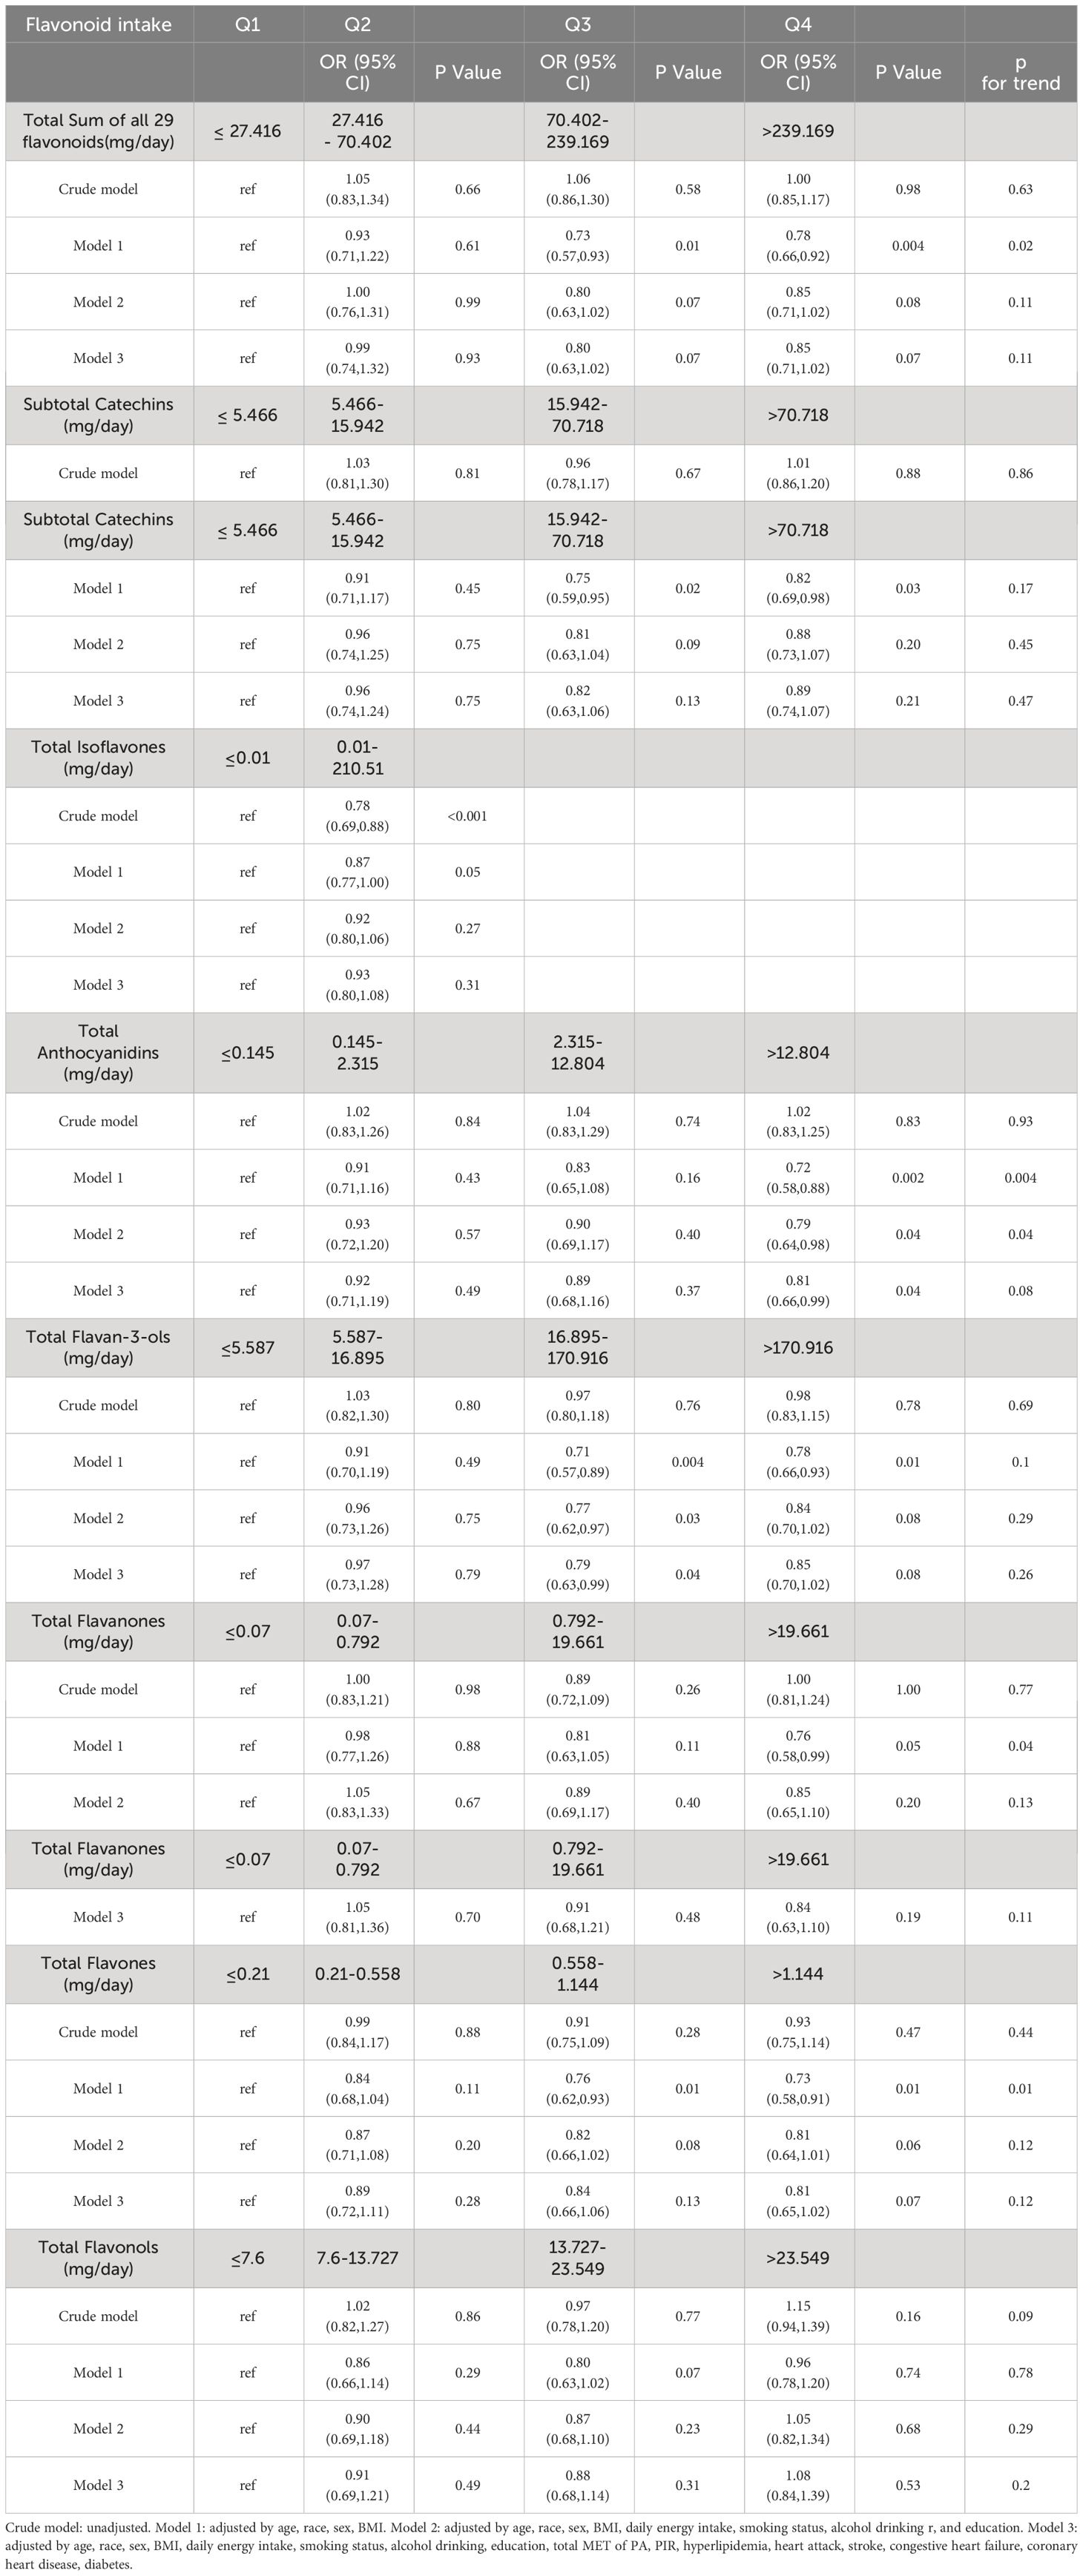
Table 2 Associations between flavonoid intake and hypertension.
To further explore whether there was a nonlinear association between the prevalence of hypertension and intake of total anthocyanins as well as total flavan-3-ols, we conducted analyses using restricted cubic spline bars (Figure 2). The results showed that the non-linear relationship between the prevalence of hypertension and intake of total anthocyanins was not significant (p=0.2583, Figure 2A). However, there was a significant non-linear relationship between the prevalence of hypertension and intake of total flavan-3-ols (p=0.0012, Figure 2B). The relationship between the prevalence of hypertension and intake of total flavan-3-ols showed a U-shaped pattern. We found a significant negative correlation between the prevalence of hypertension and intake of total flavan-3-ols when the intake of total flavan-3-ols was less than 48.26 mg/day.

Figure 2 The association of flavonoid intake with prevalence of hypertension by restricted cubic splines. The y-axis stands for the Log odds ratio of hyperlipidemia, and the X-axis stands for the log10 transformed intake of total anthocyanidins (A) and total flavan-3-ols (B). Models by restricted cubic splines were adjusted for age, race, sex, BMI, daily energy intake, smoking status, alcohol drinking, education, total MET of PA, PIR, hyperlipidemia, heart attack, stroke, congestive heart failure, coronary heart disease, and diabetes.
3.3 Subgroup analysis
To identify subgroup effects and explore interaction effects between flavonoid intake and the prevalence of hypertension, analyses were stratified according to age, sex, race, education, BMI, smoking status, alcohol drinking, PIR, daily energy intake, total MET of PA, hyperlipidemia, heart attack, stroke, congestive heart failure, coronary artery disease, and diabetes, and fully adjusted for each stratum by weighted logistic regression.
The analysis (Table 3) showed that age, sex, race, education, BMI, smoking status, PIR, daily energy intake, total MET of PA, history of hyperlipidemia, heart attack, stroke, congestive heart failure, coronary heart disease, and diabetes did not influence the association between total anthocyanin intake and prevalence of hypertension. However, the relationship between total anthocyanin intake and the prevalence of hypertension was influenced by Alcohol drinking (p for interaction = 0.02). For participants who were heavy drinkers, the fourth quartile of total anthocyanins intake was negatively associated with the prevalence of hypertension compared with the first quartile [0.62(0.40,0.97) p = 0.04], and the trend P value was significant. For participants who were moderate drinkers, the third quartile of total anthocyanin intake was negatively associated with the prevalence of hypertension compared with the first quartile [0.57(0.36,0.89), p = 0.02]. However, the trend p-value was non-significant. We also found a decreasing trend in the prevalence of hypertension with increasing total anthocyanin intake in heavy-drinking participants, unlike the trend in participants with other levels of alcohol consumption. This trend was different from the trend for participants with other levels of alcohol consumption (Figure 3). In addition, we found that for participants of all ages, the fourth quartile of total anthocyanins intake was negatively associated with the prevalence of hypertension compared with the first quartile [p = 0.002, p = 0.04, and p < 0.001, respectively], and the trend p-values were all significant. For participants older than 60 years, the second, third, and fourth quartiles of total anthocyanins intake were negatively associated with the prevalence of hypertension compared with the first quartile [p = 0.04, p = 0.03, and p < 0.001, respectively].
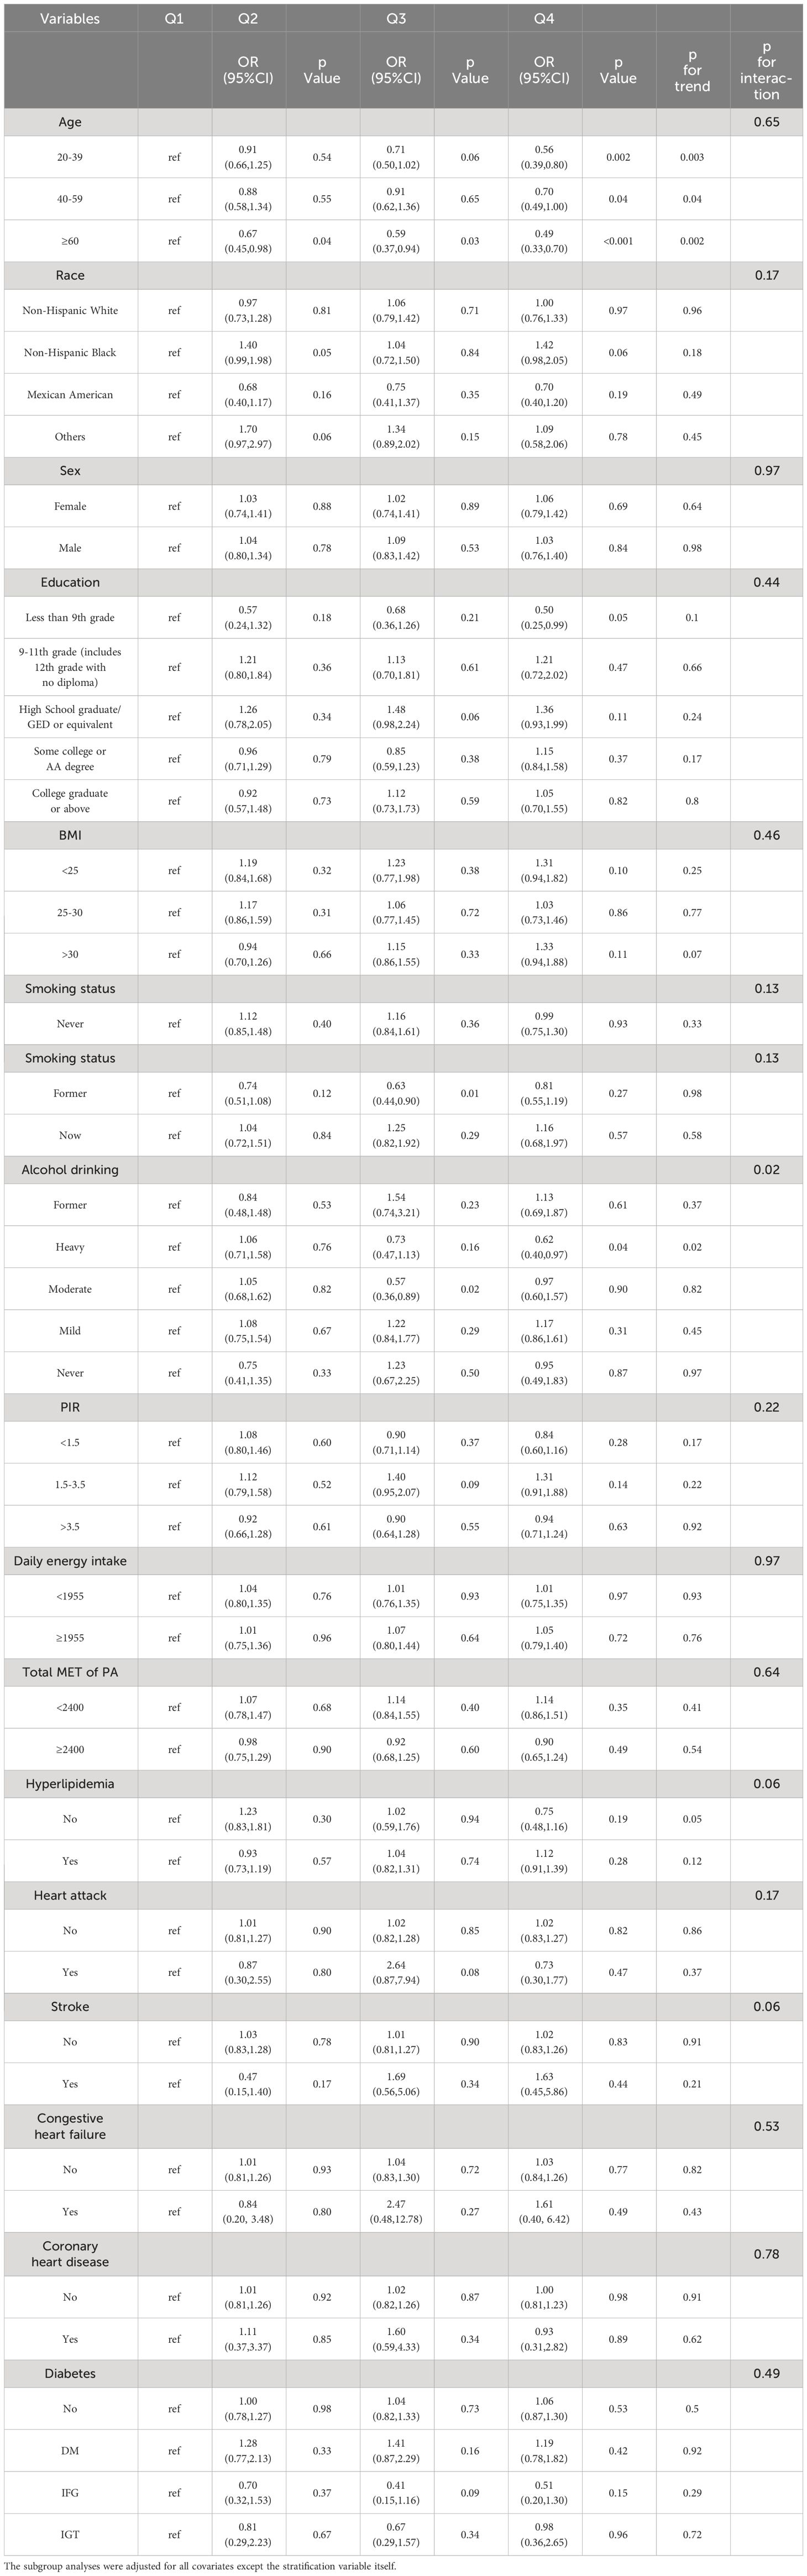
Table 3 Subgroup analysis between hypertension and total anthocyanidins.
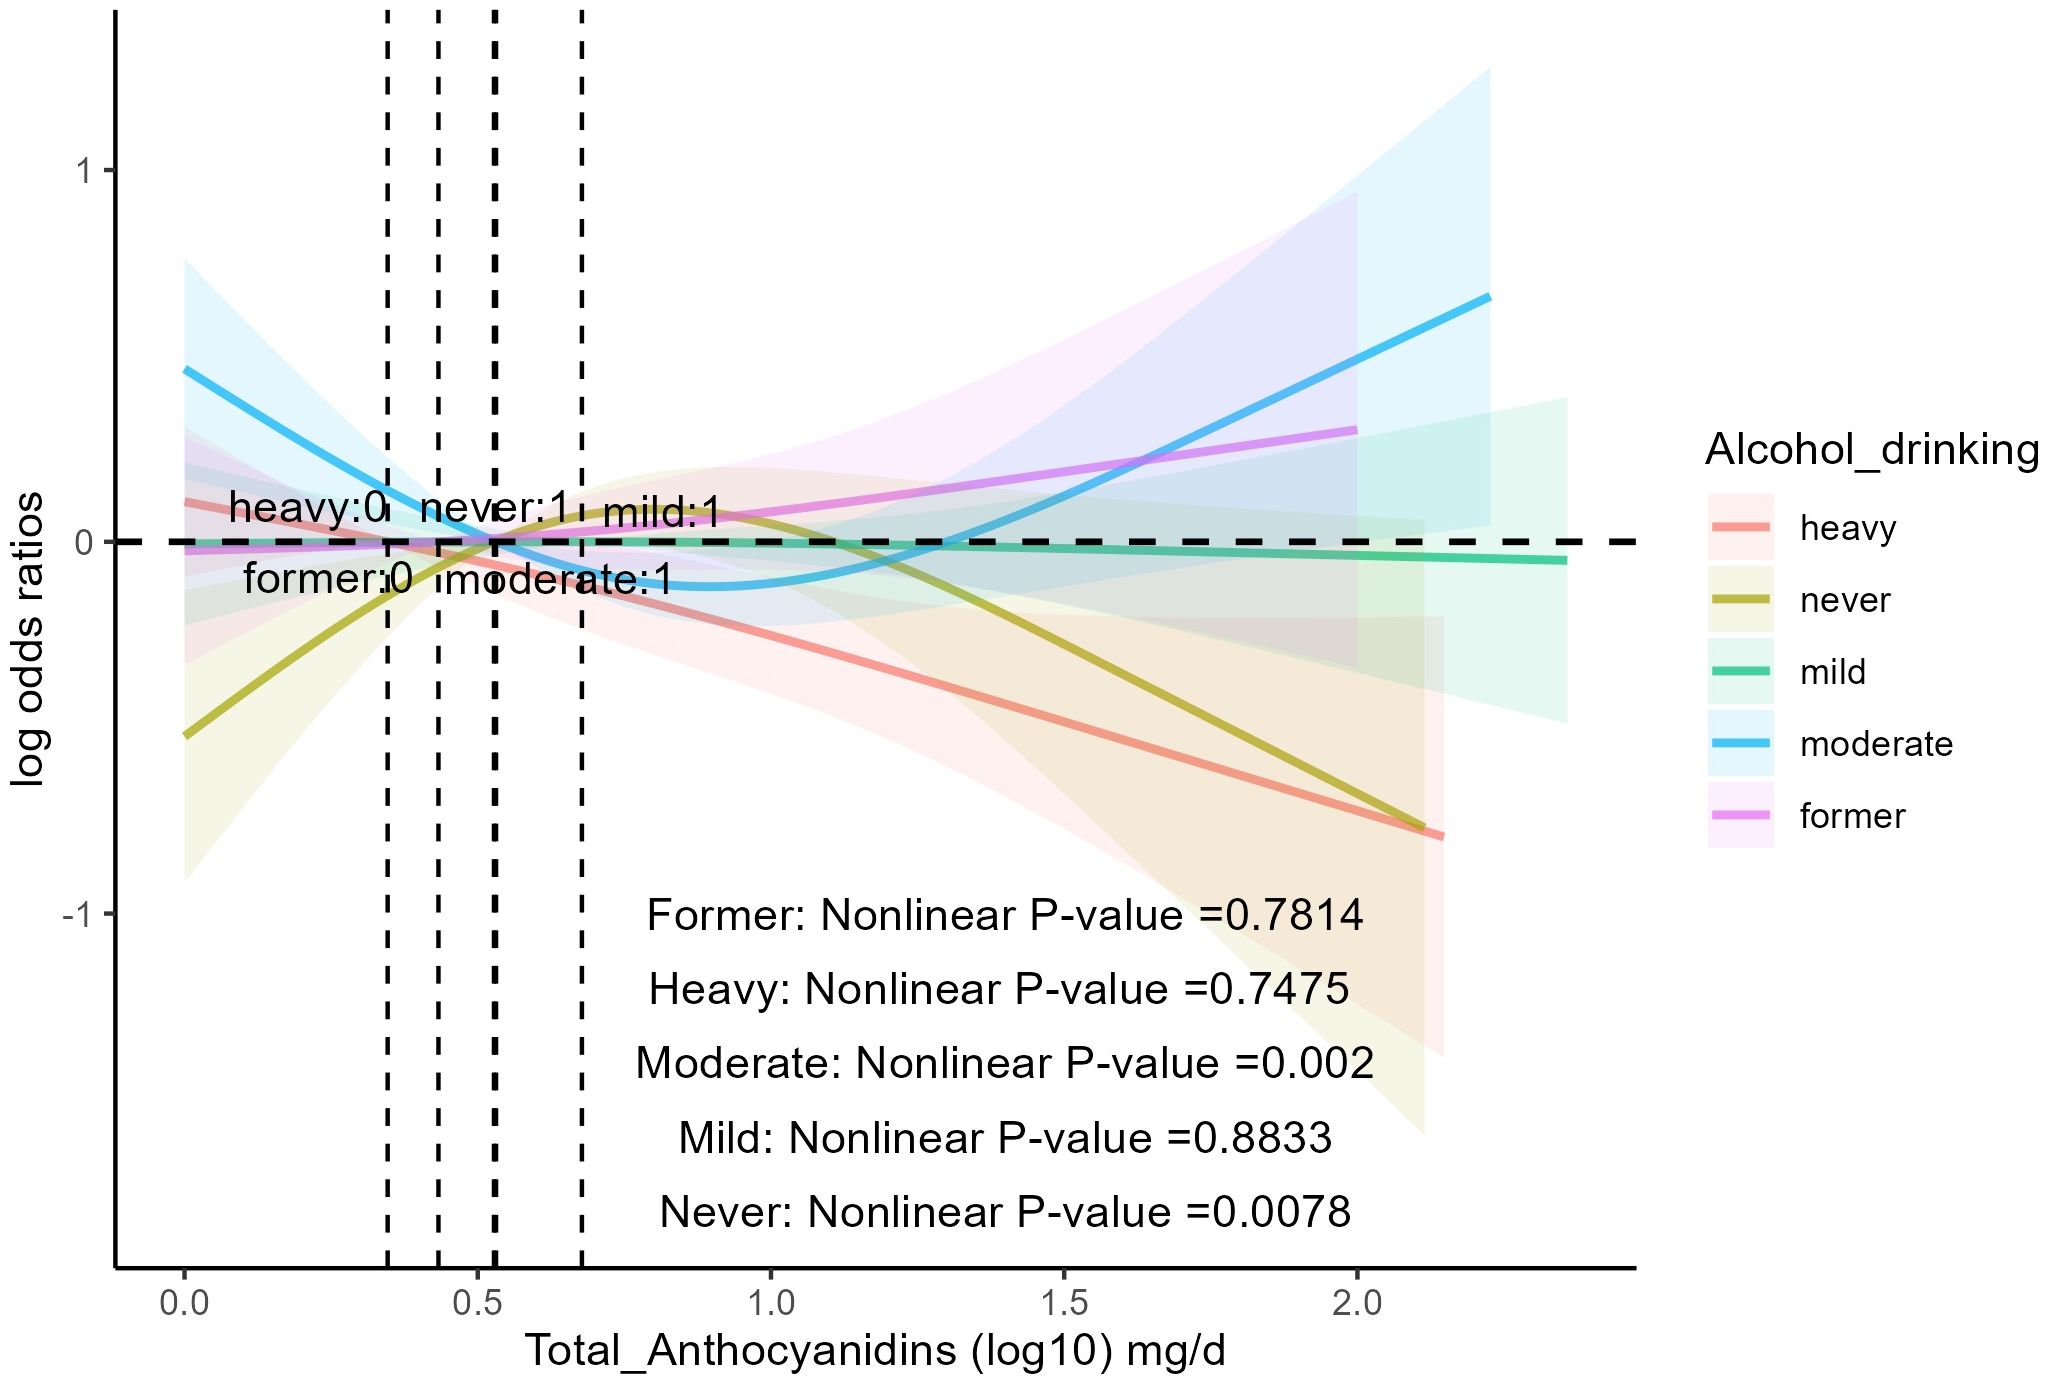
Figure 3 The association of flavonoid intake with the prevalence of hypertension on alcohol drinking by restricted cubic splines. The y-axis stands for the Log odds ratio of hypertension, and the X-axis stands for the log10 transformed intake of total anthocyanidins. Models by restricted cubic splines were adjusted for age, race, sex, BMI, daily energy intake, smoking status, education, total MET of PA, PIR, hyperlipidemia, heart attack, stroke, congestive heart failure, coronary heart disease, and diabetes.
It was found (Table 4) that age, race, education, BMI, smoking status, alcohol drinking, PIR, daily energy intake, total MET of PA, history of hyperlipidemia, heart attack, stroke, congestive heart failure, coronary heart disease, and diabetes mellitus did not influence the association between total anthocyanin intake and prevalence of hypertension. However, the relationship between total flavan-3-ols intake and the prevalence of hypertension was influenced by gender (p for interaction = 0.03). As total flavan-3-ols intake increased, the prevalence of hypertension in male participants showed a decreasing trend. Unfortunately, the other three quartiles were not statistically significant compared to the first quartile, and the trend p-value was non-significant (Table 4, Figure 4). Additionally, we found that for participants aged 20-39 years, the third and fourth quartiles of total flavan-3-ols intake were negatively correlated with the prevalence of hypertension compared to the first quartile [p = 0.002, p = 0.003, respectively], and the trend p-value was significant.
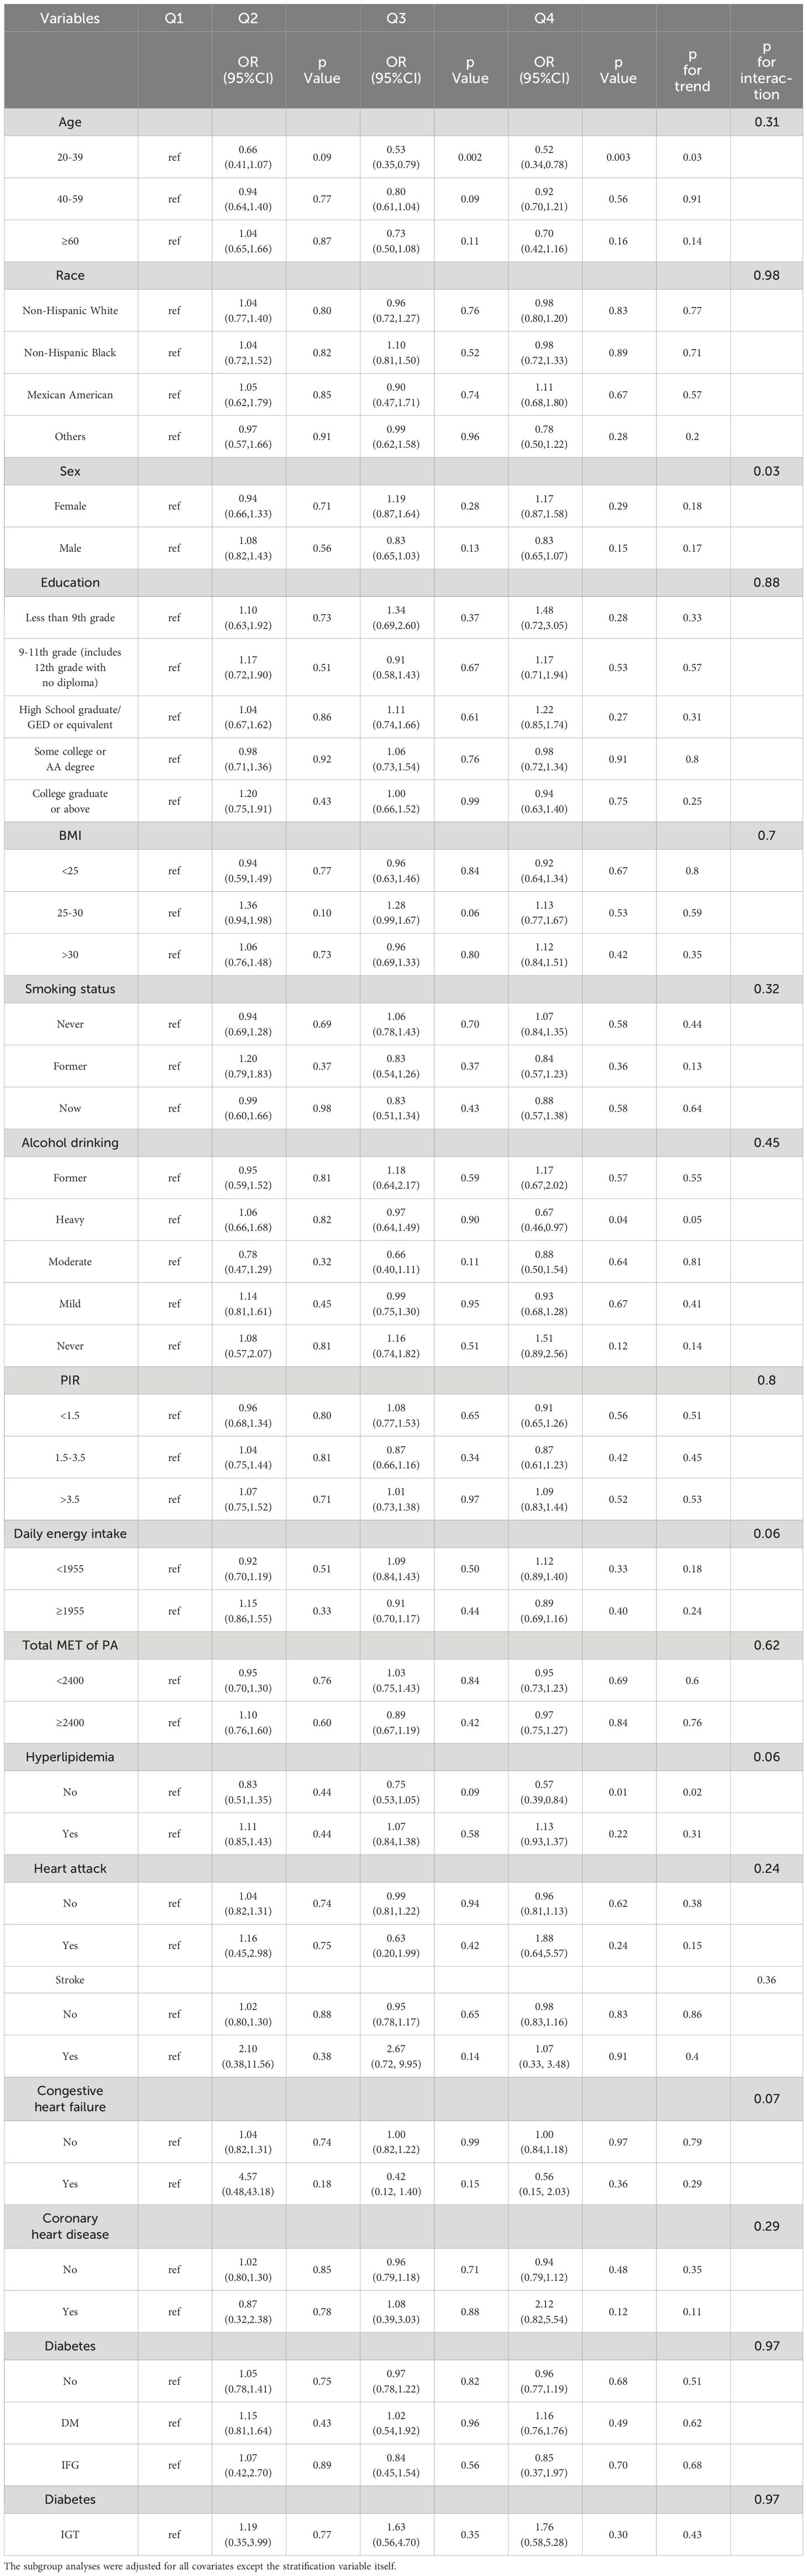
Table 4 Subgroup analysis between hypertension and total flavan 3-ols.
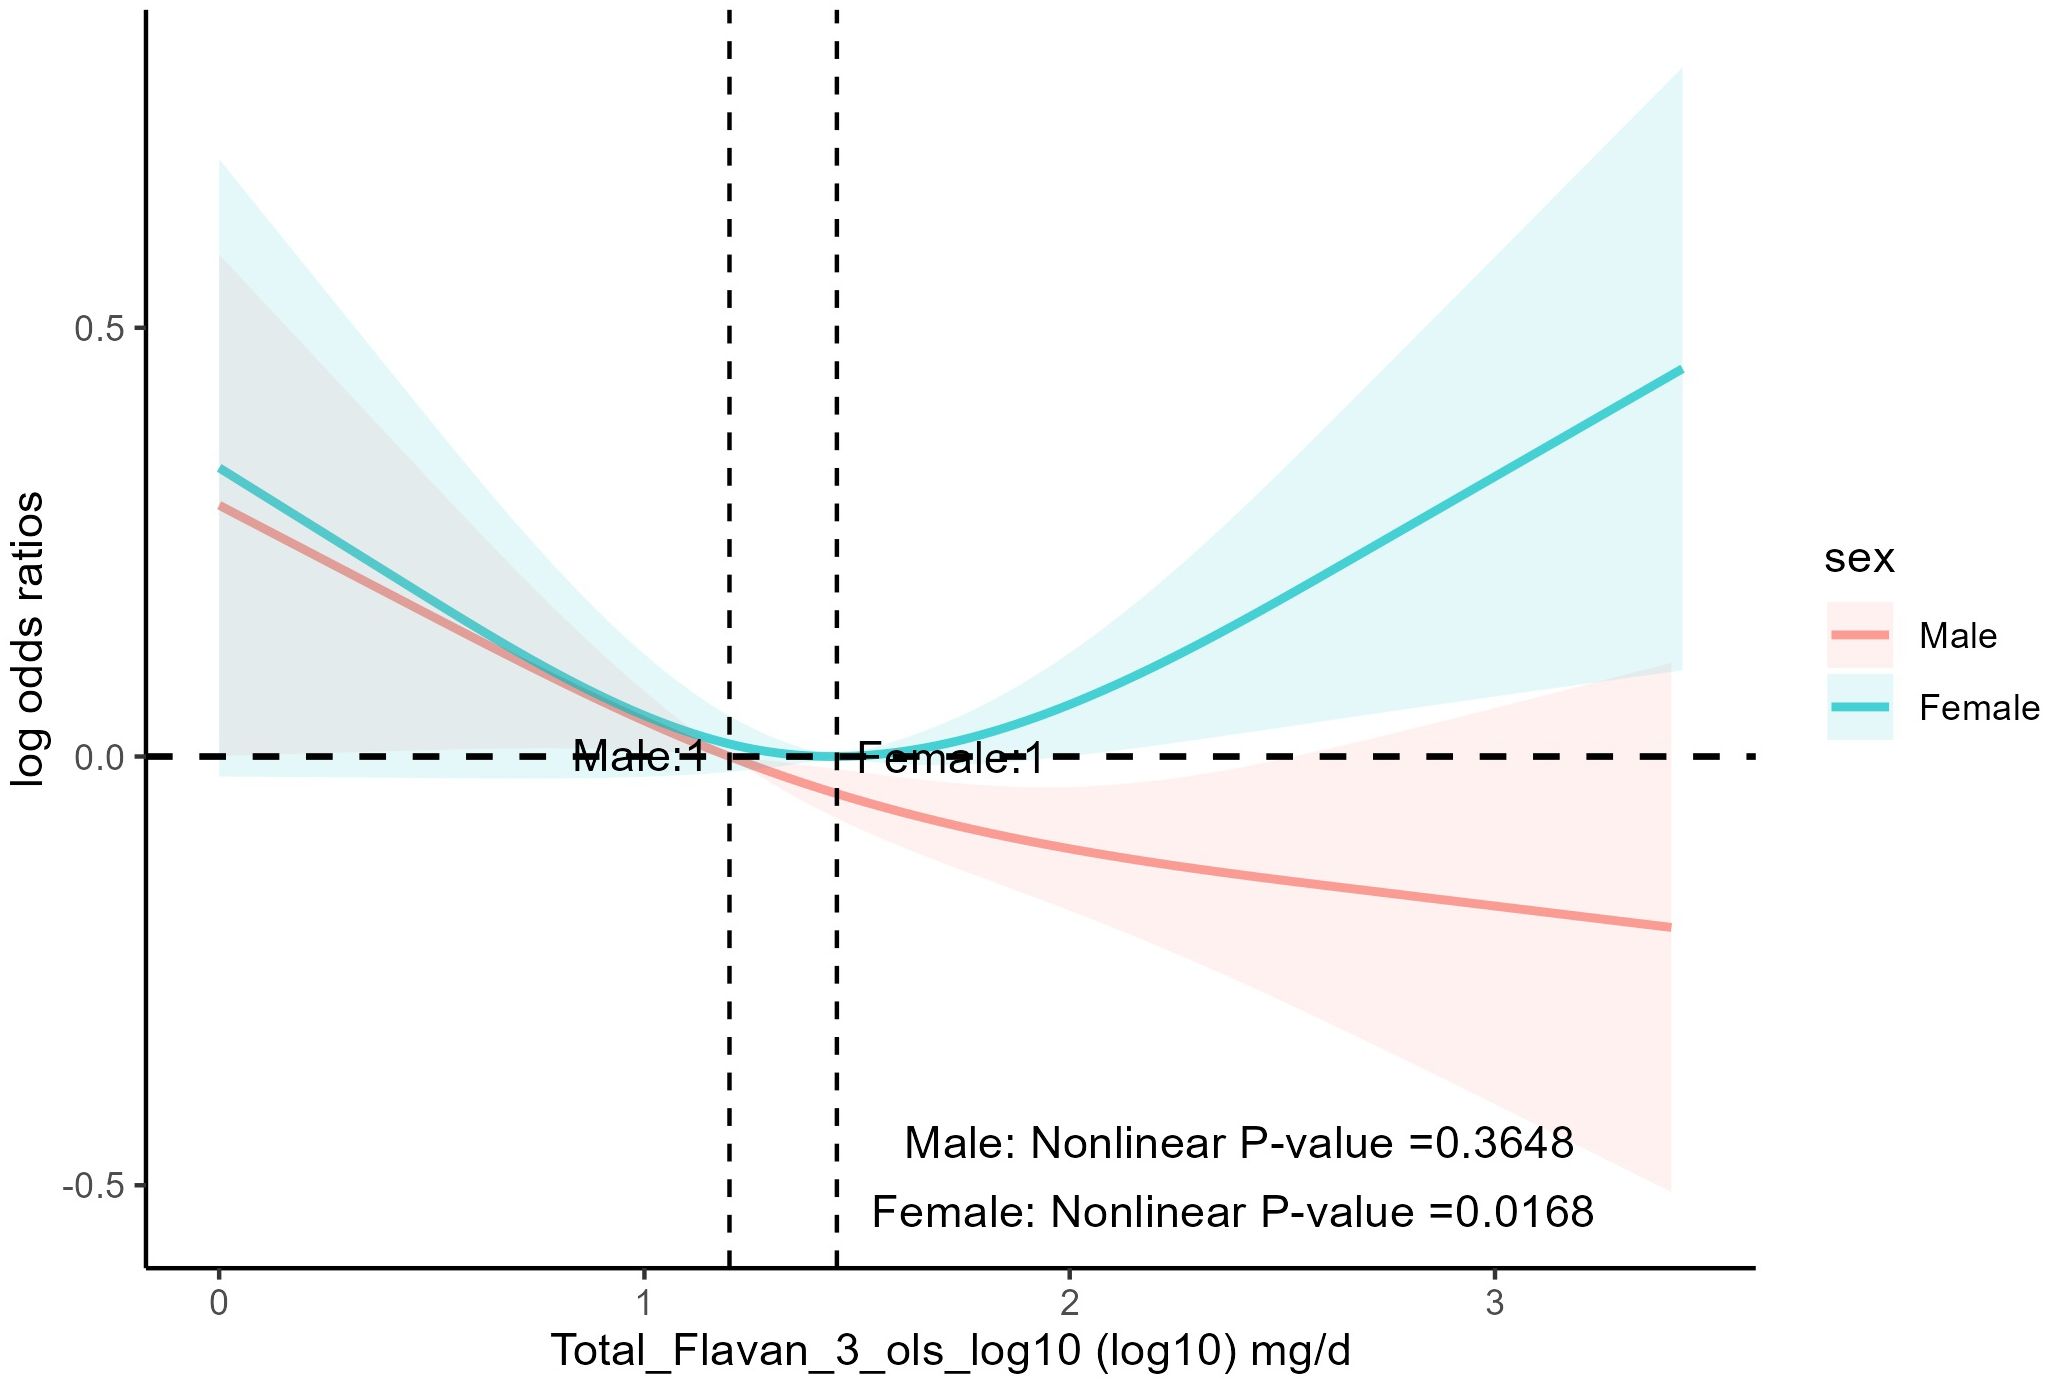
Figure 4 The association of flavonoid intake with prevalence of hypertension on sex by restricted cubic splines. The y-axis stands for the Log odds ratio of hypertension, and the X-axis stands for the log10 transformed intake of total flavan-3-ols. Models by restricted cubic splines were adjusted for age, race, BMI, daily energy intake, smoking status, alcohol drinking, education, total MET of PA, PIR, hyperlipidemia, heart attack, stroke, congestive heart failure, coronary heart disease, and diabetes.
4 Discussion
Hypertension is one of the common chronic diseases (29). Genetics, lifestyle, and environment have a significant impact on the development of hypertension (30). Among these, diet has a significant effect on blood pressure (31), and diets high in salt, saturated fat, trans fat, and added sugar increase the risk of developing hypertension (32). Healthy eating patterns such as the DASH diet and the Mediterranean diet benefit hypertension regulation and reduce cardiovascular risk (33). The DASH diet includes fruits, vegetables, low-fat dairy products, whole grains, poultry, fish, and nuts; and contains smaller amounts of red meat, sweets, and sugar-containing beverages than the typical diet in the United States (34, 35). The DASH diet reduces the incidence of cardiovascular diseases such as coronary heart disease, stroke, and diabetes (34). A meta-analysis showed that the DASH diet reduced systolic blood pressure by 4.2 mmHg and diastolic blood pressure by 2.5 mmHg (36). The Mediterranean diet consists of fish, monounsaturated fats from olive oil, fruits, vegetables, whole grains, legumes/nuts, and moderate alcohol consumption (37). The Mediterranean diet has been found to reduce cardiovascular mortality, cardiovascular outcomes, and the incidence of risk factors such as obesity, hypertension, metabolic syndrome, and dyslipidemia (38). And the Mediterranean-style diet improves systolic blood pressure and arterial stiffness in older adults (39).
Inflammation plays an important role in the development of hypertension (40). The study found that healthy dietary patterns such as the Mediterranean diet and the DASH diet were associated with lower plasma concentrations of pro-inflammatory markers (41). This may suggest that nutritional manipulation can reduce inflammation. Fruits and vegetables are rich in dietary fiber, vitamins, minerals, flavonoids, and other compounds (42). Our study found a negative association between the risk of hypertension and moderate total anthocyanins intake and total flavan-3-ols intake. The mechanism may be through the scavenging of oxygen free radicals, anti-oxidative stress, and inhibition of inflammatory factor activation, thus inhibiting the inflammatory response and exerting a protective effect on blood vessels and lowering blood pressure (43).
Anthocyanins are flavonoid plant compounds widely distributed in fruits, seeds, vegetables, and flowers (44). Foods such as tart cherries, red raspberries, black soybeans, blueberries, sweet cherries, strawberries, and queen garnet plums are rich in anthocyanins (45). Anthocyanins have anti-inflammatory and antioxidant effects (46). Anthocyanins can induce endothelial nitric oxide synthase expression through the Src-ERK1/2-Sp1 signaling pathway in vascular endothelial cells, increase nitric oxide production (47), and reduce ROS produced by endothelial cell activation (48), thereby improving endothelial dysfunction and regulating blood pressure (49). In addition, anthocyanins significantly inhibited the activation of NLRP3 inflammatory vesicles in the paraventricular nucleus of salt-induced hypertensive rats, reduced local inflammation and oxidative stress, and contributed to the reduction of peripheral sympathetic neural activity and lowered blood pressure (50).
Some clinical studies have found anthocyanins in flowers or fruits to have anti-blood pressure effects. A randomized controlled study found no significant difference between a standardized extract of Hibiscus sabdariffa (standardized to 9.6 mg anthocyanins/dose) and captopril in terms of antihypertensive effects and tolerability in patients with mild to moderate hypertension (51). A study found that anthocyanin-rich plum juice reduced ambulatory blood pressure in both young and elderly people (52). A randomized controlled study found that blueberry anthocyanins improved vascular and cognitive function and reduced 24-hour ambulatory systolic blood pressure in healthy older adults (53). Similarly, our study found that quartiles of total anthocyanin intake were negatively associated with the prevalence of hypertension in adults aged 20 years and older. For those aged 60 years or older, the second to fourth quartiles of total anthocyanin intake was negatively associated with the prevalence of hypertension, and the prevalence of hypertension tended to decrease with increasing total anthocyanin intake in participants aged 60 years or older. It has been found that peroxynitrite increases significantly with age. Peroxynitrite is a highly reactive oxidant that scavenges NO, which controls and regulates vascular tone, and with age, vasodilatory dysfunction triggers hypertension (54). Anthocyanins are the most abundant antioxidants in the diet, with antioxidant effects, reducing reactive oxygen species produced by endothelial cell activation and regulating increased nitric oxide production, thus improving endothelial dysfunction and regulating blood pressure (47–49). This may be why anthocyanin intake reduces the prevalence of hypertension in older participants.
It is recognized that high alcohol consumption increases the prevalence of hypertension (55). A Mendelian study found genetic evidence of a causal relationship between alcohol consumption and cardiovascular diseases such as hypertension, coronary heart disease, and myocardial infarction, a relationship with a consistently increasing risk that rises exponentially with increasing intake (56). A Meta-analysis found a positive linear association between alcohol consumption and diastolic blood pressure (57). Our study found that moderate anthocyanin intake reduced the prevalence of hypertension in participants who were heavy and moderate drinkers. It has been found that excessive intake of alcohol leads to oxidative stress in the body, which causes endothelial dysfunction leading to hypertension (58). Anthocyanins can scavenge free radicals and have an anti-oxidative stress effect (59). This may be the reason why moderate anthocyanin intake reduces the prevalence of hypertension for both heavy and moderate drinking participants.
Flavan-3-ols are widely distributed in fruits, vegetables, and plant products such as tea, cocoa, grapes, cranberries, and apples (60, 61). There is growing interest in the beneficial cardiovascular effects of flavan-3-ols (62). It has been found that NF-κB can mediate a variety of inflammatory responses, and activation of the NF-κB signaling pathway induces an increase in the expression of TNF-α and IL-6, which leads to hypertension and contributes to the development of cardiac remodeling (63). Flavan-3-ol, on the other hand, can scavenge free radicals, which helps to reduce the concentration of cellular oxidants and regulate the cellular redox state, and binds to proteins involved in the NF-κB pathway to inhibit the activation of NF-κB, thus improving inflammatory symptoms and exerting protective effects (64). Basic experimental studies have shown that flavan-3-ols reduce systolic blood pressure in spontaneously hypertensive rats (65). The EPIC-Norfolk-based population study found that flavan-3-ol intake was associated with significant reductions in systolic and diastolic blood pressure (66). A study based on the Korean National Health and Nutrition Examination Survey found that flavan-3-ols intake was negatively associated with the risk of hypertension in non-obese men (67). Multiple meta-analyses demonstrated the beneficial effects of flavan-3-ols on cardiometabolic outcomes, with flavan-3-ols significantly improving blood pressure (68–70). Our study found that moderate lavan-3-ols intake was negatively associated with the prevalence of hypertension. Our findings are in agreement with some of the aforementioned studies. In addition, our study found that there was a significant nonlinear relationship (U-shaped) between the prevalence of hypertension and total flavan-3-ols intake. When the intake of total flavan-3-ols was less than 48.26 mg/day, there was a significant negative correlation between the prevalence of hypertension and the intake of total flavan-3-ols.
Our study has several strengths. Our study demonstrated consistent results for curve fitting and segmented linear regression, indicating stable and reliable results. Our subgroup analyses revealed that we found a significant negative association between dietary anthocyanin intake and the prevalence of hypertension in participants aged 60 years or older. However, there are several limitations to our study. This is a cross-sectional study and causal inferences cannot be made, and we look forward to future prospective studies with large samples and different genders. Dietary flavonoid intake was calculated based on 24-hour dietary recall, which may have the effect of recall bias.
5 Conclusions
In conclusion, our study found a negative association between the risk of hypertension and moderate total anthocyanins intake and total flavan-3-ols intake. For those over 60 years of age and heavy drinkers, the prevalence of hypertension decreased with increasing total anthocyanin intake. Our study provides evidence for a population-based study of a negative association between dietary flavonoid intake and the prevalence of hypertension, providing valuable information for tailoring nutritional interventions in the management of hypertension.
Data availability statement
Publicly available datasets were analyzed in this study. This data can be found here: All NHANES data for this study are publicly available and can be found here: https://wwwn.cdc.gov/nchs/nhanes.
Ethics statement
The studies involving humans were approved by The NCHS Ethics Review Board approved the NHANES study protocol, and each participant signed an informed consent form. The studies were conducted in accordance with the local legislation and institutional requirements. Written informed consent for participation was not required from the participants or the participants’ legal guardians/next of kin in accordance with the national legislation and institutional requirements.
Author contributions
YW: Conceptualization, Data curation, Formal analysis, Methodology, Writing – original draft. DM: Visualization, Writing – original draft. QS: Conceptualization, Funding acquisition, Writing – review & editing. HX: Conceptualization, Funding acquisition, Supervision, Writing – review & editing.
Funding
The author(s) declare financial support was received for the research, authorship, and/or publication of this article. This study was supported by National Natural Science Foundation of China (No. 82230125), National natural science foundation of China (No. 82104677), Scientific and Technological Innovation Project of China Academy of Chinese Medical Sciences (CI2021B004), and the Fundamental Research Funds for the Central public welfare research institutes (ZZ15-YQ-009).
Conflict of interest
The authors declare that the research was conducted in the absence of any commercial or financial relationships that could be construed as a potential conflict of interest.
Publisher’s note
All claims expressed in this article are solely those of the authors and do not necessarily represent those of their affiliated organizations, or those of the publisher, the editors and the reviewers. Any product that may be evaluated in this article, or claim that may be made by its manufacturer, is not guaranteed or endorsed by the publisher.
References
1. Yano Y, Kim HC, Lee H, Azahar N, Ahmed S, Kitaoka K, et al. Isolated diastolic hypertension and risk of cardiovascular disease: controversies in hypertension - pro side of the argument. Hypertension. (2022) 79:1563–70. doi: 10.1161/hypertensionaha.122.18459
2. Yusuf S, Hawken S, Ounpuu S, Dans T, Avezum A, Lanas F, et al. Effect of potentially modifiable risk factors associated with myocardial infarction in 52 countries (the INTERHEART study): case-control study. Lancet. (2004) 364:937–52. doi: 10.1016/s0140-6736(04)17018-9
3. Lauder L, Mahfoud F, Azizi M, Bhatt DL, Ewen S, Kario K, et al. Hypertension management in patients with cardiovascular comorbidities. Eur Heart J. (2023) 44:2066–77. doi: 10.1093/eurheartj/ehac395
4. Whelton PK, Carey RM, Aronow WS, Casey DE Jr, Collins KJ, Dennison Himmelfarb C, et al. 2017 ACC/AHA/AAPA/ABC/ACPM/AGS/APhA/ASH/ASPC/NMA/PCNA guideline for the prevention, detection, evaluation, and management of high blood pressure in adults: A report of the american college of cardiology/american heart association task force on clinical practice guidelines. Hypertension. (2018) 71:e13–e115. doi: 10.1161/hyp.0000000000000065
5. Mahmood S, Shah KU, Khan TM, Nawaz S, Rashid H, Baqar SWA, et al. Non-pharmacological management of hypertension: in the light of current research. Ir J Med Sci. (2019) 188:437–52. doi: 10.1007/s11845-018-1889-8
6. Verma N, Rastogi S, Chia YC, Siddique S, Turana Y, Cheng HM, et al. Non-pharmacological management of hypertension. J Clin Hypertens (Greenwich). (2021) 23:1275–83. doi: 10.1111/jch.14236
7. Wu KL, Chan SH, Chan JY. Neuroinflammation and oxidative stress in rostral ventrolateral medulla contribute to neurogenic hypertension induced by systemic inflammation. J Neuroinflamm. (2012) 9:212. doi: 10.1186/1742-2094-9-212
8. Xiao L, Harrison DG. Inflammation in hypertension. Can J Cardiol. (2020) 36:635–47. doi: 10.1016/j.cjca.2020.01.013
9. Kim YS, Young MR, Bobe G, Colburn NH, Milner JA. Bioactive food components, inflammatory targets, and cancer prevention. Cancer Prev Res (Phila). (2009) 2:200–8. doi: 10.1158/1940-6207.Capr-08-0141
10. Guzik TJ, Touyz RM. Oxidative stress, inflammation, and vascular aging in hypertension. Hypertension. (2017) 70:660–7. doi: 10.1161/hypertensionaha.117.07802
11. Muñoz M, López-Oliva ME, Rodríguez C, Martínez MP, Sáenz-Medina J, Sánchez A, et al. Differential contribution of Nox1, Nox2 and Nox4 to kidney vascular oxidative stress and endothelial dysfunction in obesity. Redox Biol. (2020) 28:101330. doi: 10.1016/j.redox.2019.101330
12. Iddir M, Brito A, Dingeo G, Fernandez Del Campo SS, Samouda H, La Frano MR, et al. Strengthening the Immune System and Reducing Inflammation and Oxidative Stress through Diet and Nutrition: Considerations during the COVID-19 Crisis. Nutrients. (2020) 12:1562–600. doi: 10.3390/nu12061562
13. Fan X, Fan Z, Yang Z, Huang T, Tong Y, Yang D, et al. Flavonoids-natural gifts to promote health and longevity. Int J Mol Sci. (2022) 23:2176–92. doi: 10.3390/ijms23042176
14. Durazzo A, Lucarini M, Souto EB, Cicala C, Caiazzo E, Izzo AA, et al. Polyphenols: A concise overview on the chemistry, occurrence, and human health. Phytother Res. (2019) 33:2221–43. doi: 10.1002/ptr.6419
15. Serafini M, Peluso I, Raguzzini A. Flavonoids as anti-inflammatory agents. Proc Nutr Soc. (2010) 69:273–8. doi: 10.1017/S002966511000162X
16. Calis Z, Mogulkoc R, Baltaci AK. The roles of flavonols/flavonoids in neurodegeneration and neuroinflammation. Mini Rev Med Chem. (2020) 20:1475–88. doi: 10.2174/1389557519666190617150051
17. Kozłowska A, Szostak-Wegierek D. Flavonoids–food sources and health benefits. Rocz Panstw Zakl Hig. (2014) 65:79–85.
18. Parmenter BH, Croft KD, Hodgson JM, Dalgaard F, Bondonno CP, Lewis JR, et al. An overview and update on the epidemiology of flavonoid intake and cardiovascular disease risk. Food Funct. (2020) 11:6777–806. doi: 10.1039/D0FO01118E
19. Afaq F, Saleem M, Krueger CG, Reed JD, Mukhtar H. Anthocyanin- and hydrolyzable tannin-rich pomegranate fruit extract modulates MAPK and NF-kappaB pathways and inhibits skin tumorigenesis in CD-1 mice. Int J Cancer. (2005) 113:423–33. doi: 10.1002/ijc.20587
20. Ren Q, Guo F, Tao S, Huang R, Ma L, Fu P. Flavonoid fisetin alleviates kidney inflammation and apoptosis via inhibiting Src-mediated NF-κB p65 and MAPK signaling pathways in septic AKI mice. BioMed Pharmacother. (2020) 122:109772. doi: 10.1016/j.biopha.2019.109772
21. Zhou C, Kuang Y, Li Q, Duan Y, Liu X, Yue J, et al. Endothelial S1pr2 regulates post-ischemic angiogenesis via AKT/eNOS signaling pathway. Theranostics. (2022) 12:5172–88. doi: 10.7150/thno.71585
22. Hügel HM, Jackson N, May B, Zhang AL, Xue CC. Polyphenol protection and treatment of hypertension. Phytomedicine. (2016) 23:220–31. doi: 10.1016/j.phymed.2015.12.012
23. Haynes AP, Desta S, Ahmad T, Neikirk K, Hinton A, Bloodworth N, et al. The antioxidative effects of flavones in hypertensive disease. Biomedicines. (2023) 11:2877–91. doi: 10.3390/biomedicines11112877
24. Cassidy A, O’Reilly ÉJ, Kay C, Sampson L, Franz M, Forman JP, et al. Habitual intake of flavonoid subclasses and incident hypertension in adults. Am J Clin Nutr. (2011) 93:338–47. doi: 10.3945/ajcn.110.006783
25. Godos J, Vitale M, Micek A, Ray S, Martini D, Del Rio D, et al. Dietary polyphenol intake, blood pressure, and hypertension: A systematic review and meta-analysis of observational studies. Antioxidants (Basel). (2019) 8:152–72. doi: 10.3390/antiox8060152
26. Zhu Y, Bo Y, Wang X, Lu W, Wang X, Han Z, et al. The effect of anthocyanins on blood pressure: A PRISMA-compliant meta-analysis of randomized clinical trials. Med (Baltimore). (2016) 95:e3380. doi: 10.1097/md.0000000000003380
27. Ellwood L, Torun G, Bahar Z, Fernandez R. Effects of flavonoid-rich fruits on hypertension in adults: a systematic review. JBI Database System Rev Implement Rep. (2019) 17:2075–105. doi: 10.11124/jbisrir-d-19-00050
28. Zhu Y, Sun J, Lu W, Wang X, Wang X, Han Z, et al. Effects of blueberry supplementation on blood pressure: a systematic review and meta-analysis of randomized clinical trials. J Hum Hypertens. (2017) 31:165–71. doi: 10.1038/jhh.2016.70
29. Bauer UE, Briss PA, Goodman RA, Bowman BA. Prevention of chronic disease in the 21st century: elimination of the leading preventable causes of premature death and disability in the USA. Lancet. (2014) 384:45–52. doi: 10.1016/s0140-6736(14)60648-6
30. GBD 2017 Diet Collaborators. Health effects of dietary risks in 195 countries, 1990-2017: a systematic analysis for the Global Burden of Disease Study 2017. Lancet. (2019) 393:1958–72. doi: 10.1016/s0140-6736(19)30041-8
31. Ozemek C, Laddu DR, Arena R, Lavie CJ. The role of diet for prevention and management of hypertension. Curr Opin Cardiol. (2018) 33:388–93. doi: 10.1097/hco.0000000000000532
32. Zhao D, Qi Y, Zheng Z, Wang Y, Zhang XY, Li HJ, et al. Dietary factors associated with hypertension. Nat Rev Cardiol. (2011) 8:456–65. doi: 10.1038/nrcardio.2011.75
33. Frisoli TM, Schmieder RE, Grodzicki T, Messerli FH. Beyond salt: lifestyle modifications and blood pressure. Eur Heart J. (2011) 32:3081–7. doi: 10.1093/eurheartj/ehr379
34. Chiavaroli L, Viguiliouk E, Nishi SK, Blanco Mejia S, Rahelić D, Kahleová H, et al. DASH dietary pattern and cardiometabolic outcomes: an umbrella review of systematic reviews and meta-analyses. Nutrients. (2019) 11:338–65. doi: 10.3390/nu11020338
35. Sacks FM, Svetkey LP, Vollmer WM, Appel LJ, Bray GA, Harsha D, et al. Effects on blood pressure of reduced dietary sodium and the Dietary Approaches to Stop Hypertension (DASH) diet. DASH-Sodium Collaborative Research Group. N Engl J Med. (2001) 344:3–10. doi: 10.1056/nejm200101043440101
36. Filippou CD, Tsioufis CP, Thomopoulos CG, Mihas CC, Dimitriadis KS, Sotiropoulou L, et al. Dietary approaches to stop hypertension (DASH) diet and blood pressure reduction in adults with and without hypertension: A systematic review and meta-analysis of randomized controlled trials. Adv Nutr. (2020) 11:1150–60. doi: 10.1093/advances/nmaa041
37. Widmer RJ, Flammer AJ, Lerman LO, Lerman A. The Mediterranean diet, its components, and cardiovascular disease. Am J Med. (2015) 128:229–38. doi: 10.1016/j.amjmed.2014.10.014
38. Guasch-Ferré M, Willett WC. The Mediterranean diet and health: a comprehensive overview. J Intern Med. (2021) 290:549–66. doi: 10.1111/joim.13333
39. Jennings A, Berendsen AM, de Groot L, Feskens EJM, Brzozowska A, Sicinska E, et al. Mediterranean-style diet improves systolic blood pressure and arterial stiffness in older adults. Hypertension. (2019) 73:578–86. doi: 10.1161/hypertensionaha.118.12259
40. Hengel FE, Benitah JP, Wenzel UO. Mosaic theory revised: inflammation and salt play central roles in arterial hypertension. Cell Mol Immunol. (2022) 19:561–76. doi: 10.1038/s41423-022-00851-8
41. Casas R, Castro-Barquero S, Estruch R, Sacanella E. Nutrition and cardiovascular health. Int J Mol Sci. (2018) 19:3988–4018. doi: 10.3390/ijms19123988
42. Liu RH. Health-promoting components of fruits and vegetables in the diet. Adv Nutr. (2013) 4:384s–92s. doi: 10.3945/an.112.003517
43. Al-Khayri JM, Sahana GR, Nagella P, Joseph BV, Alessa FM, Al-Mssallem MQ. Flavonoids as potential anti-inflammatory molecules: A review. Molecules. (2022) 27:2901–24. doi: 10.3390/molecules27092901
44. Jiang X, Li X, Zhu C, Sun J, Tian L, Chen W, et al. The target cells of anthocyanins in metabolic syndrome. Crit Rev Food Sci Nutr. (2019) 59:921–46. doi: 10.1080/10408398.2018.1491022
45. Ngamsamer C, Sirivarasai J, Sutjarit N. The benefits of anthocyanins against obesity-induced inflammation. Biomolecules. (2022) 12:852–64. doi: 10.3390/biom12060852
46. Naseri R, Farzaei F, Haratipour P, Nabavi SF, Habtemariam S, Farzaei MH, et al. Anthocyanins in the management of metabolic syndrome: A pharmacological and biopharmaceutical review. Front Pharmacol. (2018) 9:1310. doi: 10.3389/fphar.2018.01310
47. Xu JW, Ikeda K, Yamori Y. Upregulation of endothelial nitric oxide synthase by cyanidin-3-glucoside, a typical anthocyanin pigment. Hypertension. (2004) 44:217–22. doi: 10.1161/01.HYP.0000135868.38343.c6
48. Speer H, D’Cunha NM, Alexopoulos NI, McKune AJ, Naumovski N. Anthocyanins and human health-A focus on oxidative stress, inflammation and disease. Antioxidants (Basel). (2020) 9:366–78. doi: 10.3390/antiox9050366
49. Festa J, Da Boit M, Hussain A, Singh H. Potential benefits of berry anthocyanins on vascular function. Mol Nutr Food Res. (2021) 65:e2100170. doi: 10.1002/mnfr.202100170
50. Xu C, Zhu J, Gong G, Guo L, Zhang Y, Zhang Z, et al. Anthocyanin attenuates high salt-induced hypertension via inhibiting the hyperactivity of the sympathetic nervous system. Clin Exp Hypertens. (2023) 45:2233717. doi: 10.1080/10641963.2023.2233717
51. Herrera-Arellano A, Flores-Romero S, Chávez-Soto MA, Tortoriello J. Effectiveness and tolerability of a standardized extract from Hibiscus sabdariffa in patients with mild to moderate hypertension: a controlled and randomized clinical trial. Phytomedicine. (2004) 11:375–82. doi: 10.1016/j.phymed.2004.04.001
52. Igwe EO, Charlton KE, Roodenrys S, Kent K, Fanning K, Netzel ME. Anthocyanin-rich plum juice reduces ambulatory blood pressure but not acute cognitive function in younger and older adults: a pilot crossover dose-timing study. Nutr Res. (2017) 47:28–43. doi: 10.1016/j.nutres.2017.08.006
53. Wood E, Hein S, Mesnage R, Fernandes F, Abhayaratne N, Xu Y, et al. Wild blueberry (poly)phenols can improve vascular function and cognitive performance in healthy older individuals: a double-blind randomized controlled trial. Am J Clin Nutr. (2023) 117:1306–19. doi: 10.1016/j.ajcnut.2023.03.017
54. LeBlanc AJ, Kelm NQ. Thrombospondin-1, free radicals, and the coronary microcirculation: the aging conundrum. Antioxid Redox Signal. (2017) 27:785–801. doi: 10.1089/ars.2017.7292
55. MacMahon S. Alcohol consumption and hypertension. Hypertension. (1987) 9:111–21. doi: 10.1161/01.hyp.9.2.111
56. Biddinger KJ, Emdin CA, Haas ME, Wang M, Hindy G, Ellinor PT, et al. Association of habitual alcohol intake with risk of cardiovascular disease. JAMA Netw Open. (2022) 5:e223849. doi: 10.1001/jamanetworkopen.2022.3849
57. Di Federico S, Filippini T, Whelton PK, Cecchini M, Iamandii I, Boriani G, et al. Alcohol intake and blood pressure levels: A dose-response meta-analysis of nonexperimental cohort studies. Hypertension. (2023) 80:1961–9. doi: 10.1161/hypertensionaha.123.21224
58. Zhang Z, Zhao L, Zhou X, Meng X, Zhou X. Role of inflammation, immunity, and oxidative stress in hypertension: New insights and potential therapeutic targets. Front Immunol. (2022) 13:1098725. doi: 10.3389/fimmu.2022.1098725
59. Mattioli R, Francioso A, Mosca L, Silva P. Anthocyanins: A comprehensive review of their chemical properties and health effects on cardiovascular and neurodegenerative diseases. Molecules. (2020) 25:3809–50. doi: 10.3390/molecules25173809
60. Neilson AP, Ferruzzi MG. Influence of formulation and processing on absorption and metabolism of flavan-3-ols from tea and cocoa. Annu Rev Food Sci Technol. (2011) 2:125–51. doi: 10.1146/annurev-food-022510-133725
61. McKay DL, Blumberg JB. Cranberries (Vaccinium macrocarpon) and cardiovascular disease risk factors. Nutr Rev. (2007) 65:490–502. doi: 10.1301/nr.2007.nov.490-502
62. Raman G, Shams-White M, Avendano EE, Chen F, Novotny JA, Cassidy A. Dietary intakes of flavan-3-ols and cardiovascular health: a field synopsis using evidence mapping of randomized trials and prospective cohort studies. Syst Rev. (2018) 7:100. doi: 10.1186/s13643-018-0764-z
63. Wu X, Shen A, Bao L, Wu M, Lin X, Wang H, et al. Qingda granules attenuate hypertensive cardiac remodeling and inflammation in spontaneously hypertensive rats. BioMed Pharmacother. (2020) 129:110367. doi: 10.1016/j.biopha.2020.110367
64. Mena P, Domínguez-Perles R, Gironés-Vilaplana A, Baenas N, García-Viguera C, Villaño D. Flavan-3-ols, anthocyanins, and inflammation. IUBMB Life. (2014) 66:745–58. doi: 10.1002/iub.1332
65. Quiñones M, Margalef M, Arola-Arnal A, Muguerza B, Miguel M, Aleixandre A. The blood pressure effect and related plasma levels of flavan-3-ols in spontaneously hypertensive rats. Food Funct. (2015) 6:3479–89. doi: 10.1039/C5FO00547G
66. Ottaviani JI, Britten A, Lucarelli D, Luben R, Mulligan AA, Lentjes MA, et al. Biomarker-estimated flavan-3-ol intake is associated with lower blood pressure in cross-sectional analysis in EPIC Norfolk. Sci Rep. (2020) 10:17964. doi: 10.1038/s41598-020-74863-7
67. Yang YJ, Kim YJ, Yang YK, Kim JY, Kwon O. Dietary flavan-3-ols intake and metabolic syndrome risk in Korean adults. Nutr Res Pract. (2012) 6:68–77. doi: 10.4162/nrp.2012.6.1.68
68. Raman G, Avendano EE, Chen S, Wang J, Matson J, Gayer B, et al. Dietary intakes of flavan-3-ols and cardiometabolic health: systematic review and meta-analysis of randomized trials and prospective cohort studies. Am J Clin Nutr. (2019) 110:1067–78. doi: 10.1093/ajcn/nqz178
69. Hooper L, Kay C, Abdelhamid A, Kroon PA, Cohn JS, Rimm EB, et al. Effects of chocolate, cocoa, and flavan-3-ols on cardiovascular health: a systematic review and meta-analysis of randomized trials. Am J Clin Nutr. (2012) 95:740–51. doi: 10.3945/ajcn.111.023457
Keywords: flavonoid, anthocyanin, flavan-3-ol, hypertension, NHANES
Citation: Wan Y, Ma D, Shang Q and Xu H (2024) Association between dietary flavonoid intake and hypertension among U.S. adults. Front. Immunol. 15:1380493. doi: 10.3389/fimmu.2024.1380493
Received: 01 February 2024; Accepted: 22 March 2024;
Published: 03 April 2024.
Edited by:
Jin-Yu Sun, Nanjing Medical University, ChinaReviewed by:
Cristina Pop, University of Medicine and Pharmacy Iuliu Hatieganu, RomaniaMd Tajmul, National Institute of Diabetes and Digestive and Kidney Diseases (NIH), United States
Copyright © 2024 Wan, Ma, Shang and Xu. This is an open-access article distributed under the terms of the Creative Commons Attribution License (CC BY). The use, distribution or reproduction in other forums is permitted, provided the original author(s) and the copyright owner(s) are credited and that the original publication in this journal is cited, in accordance with accepted academic practice. No use, distribution or reproduction is permitted which does not comply with these terms.
*Correspondence: Qinghua Shang, cWluZ2h1YXNoYW5nQDEyNi5jb20=; Hao Xu, eHVoYW90Y21AaG90bWFpbC5jb20=