 Yun Liu1†
 Hanwen Tong
 Chao Wu
 Jun Wang
 Chenxiao Jiang
- 1Department of Emergency Medicine, Nanjing Drum Tower Hospital, The Affiliated Hospital of Nanjing University Medical School, Nanjing, China
- 2Department of Infectious Disease, Nanjing Drum Tower Hospital, The Affiliated Hospital of Nanjing University Medical School, Nanjing, China
- 3Department of Pharmacy, Nanjing Drum Tower Hospital, The Affiliated Hospital of Nanjing University Medical School, Nanjing, China
By Liu Y, Tong H, He F, Zhai Y, Wu C, Wang Jand Jiang C (2023). Front. Immunol. 14:1118039. doi: 10.3389/fimmu.2023.1118039
In the published article, there was an error in Figure 2 as published. The unit of IVIG dosage was displayed as “mg”. The corrected Figure 2 and its caption Comparison of (A) IVIG dosage and (B) IVIG duration between the survival group and the death group. **P <0.01. appear below.
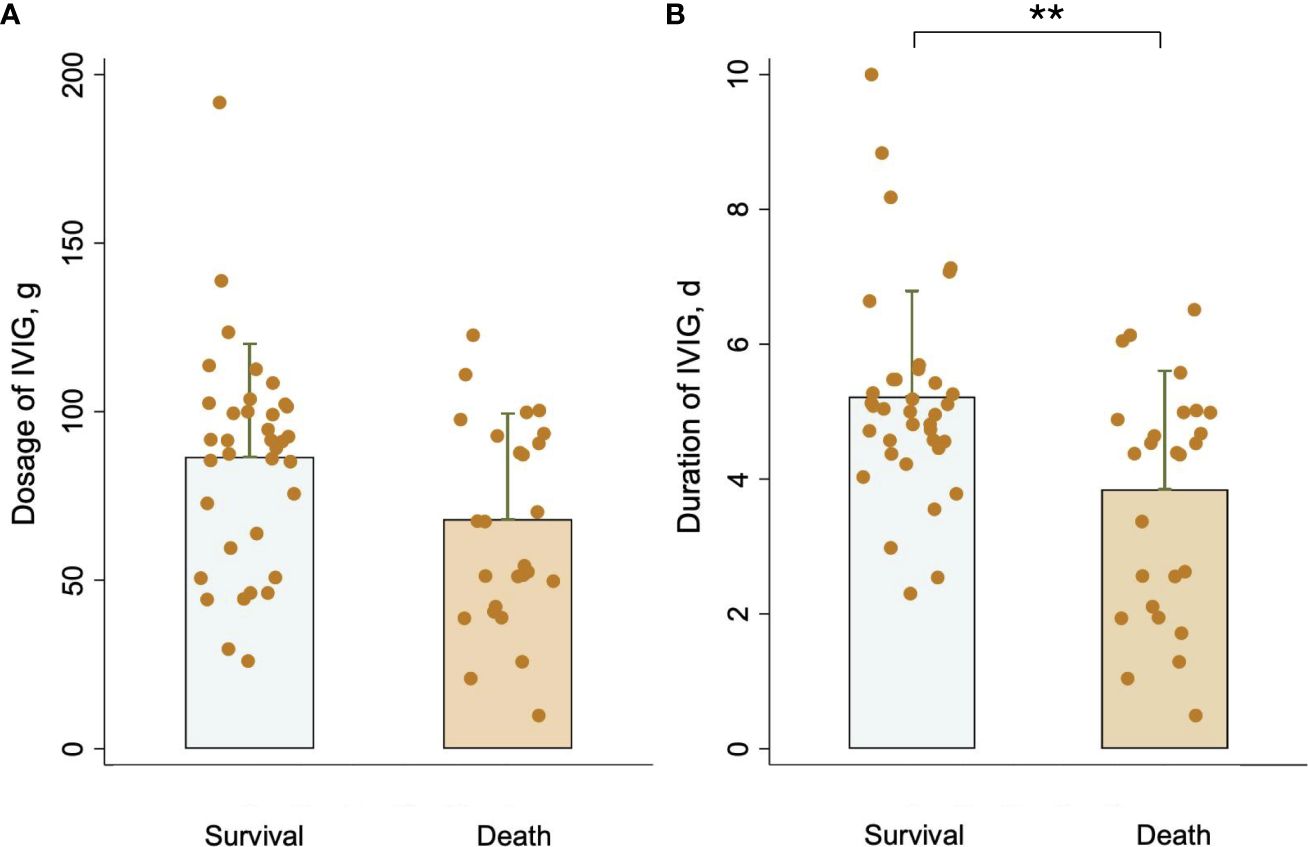
Figure 2 Comparison of (A) IVIG dosage and (B) IVIG duration between the survival group and the death group. **P <0.01.
In the published article, there was an error in Figure 4 as published. The unit of IVIG dosage was displayed as “mg”. The corrected Figure 4 and its caption Kaplan–Meier curves estimating 28-day mortality in SFTS patients based on (A) IVIG dosage and (B) IVIG duration. appear below.
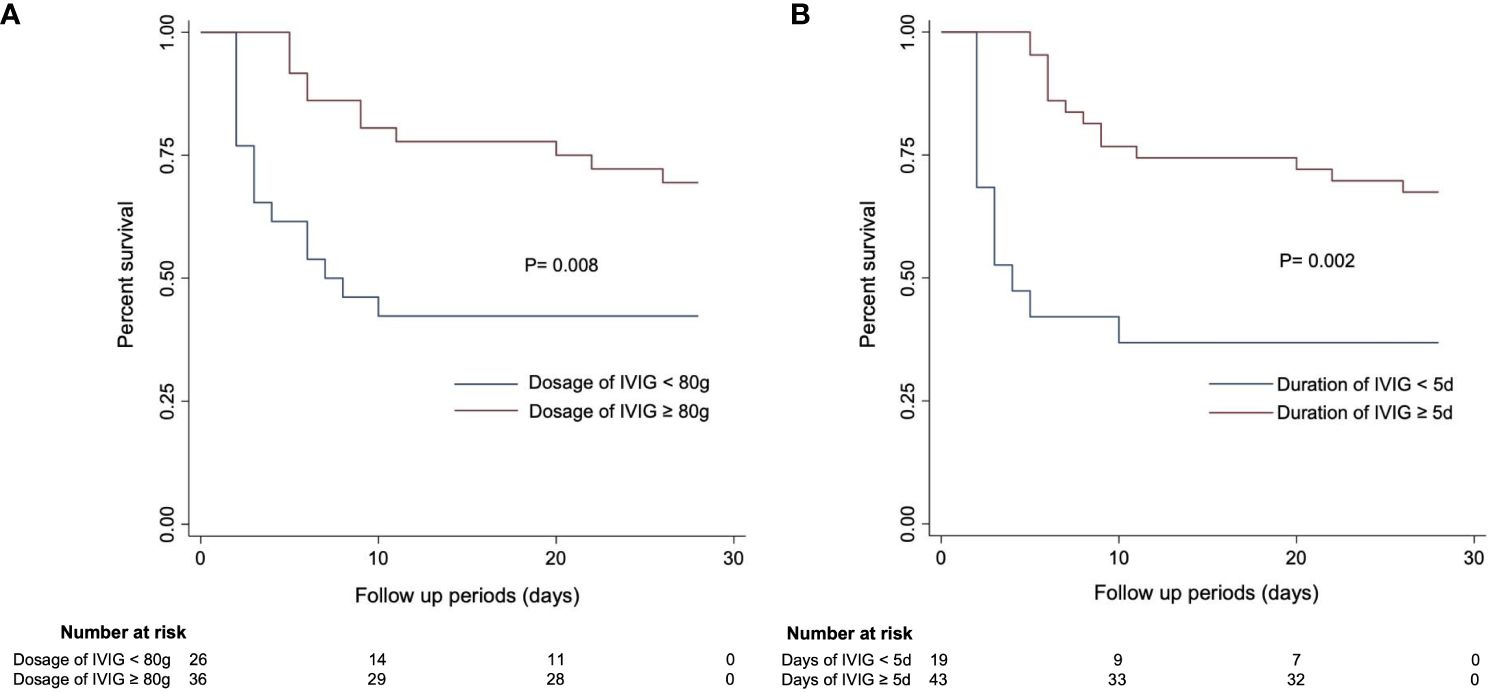
Figure 4 Kaplan–Meier curves estimating 28-day mortality in SFTS patients based on (A) IVIG dosage and (B) IVIG duration.
In the published article, there was an error in Table 1 as published. The unit of IVIG dosage was displayed as “mg”. The corrected Table 1 and its caption Baseline clinical characteristics and laboratory parameters of patients in the survival and death groups. appear below.

Table 1 Baseline clinical characteristics and laboratory parameters of patients in the survival and death groups.
In the published article, there was an error. The unit of IVIG dosage was displayed as “mg”.
A correction has been made to Introduction, Paragraph Number 161. This sentence previously stated:
“Ultimately, we determined that an IVIG dosage of more than or equal to 80 mg through a prolonged treatment duration of five or more days serves as a good prognosis predictor in SFTS with neurological symptoms.”
The corrected sentence appears below:
“Ultimately, we determined that an IVIG dosage of more than or equal to 80 g through a prolonged treatment duration of five or more days serves as a good prognosis predictor in SFTS with neurological symptoms.”
A correction has been made to Results, Paragraph Number 694. This sentence previously stated:
“Patients with an IVIG dosage of more than or equal to 80 mg (Figure 4A) and an IVIG duration of 5 days or more (Figure 4B) had higher survival rates.”
The corrected sentence appears below:
“Patients with an IVIG dosage of more than or equal to 80 g (Figure 4A) and an IVIG duration of 5 days or more (Figure 4B) had higher survival rates.”
A correction has been made to Discussion, Paragraph Number 884. This sentence previously stated:
“In this study, our findings suggested that higher dosages (≥80 mg) and a prolonged duration of IVIG treatment may improve the prognosis of SFTS patients.”
The corrected sentence appears below:
“In this study, our findings suggested that higher dosages (≥80 g) and a prolonged duration of IVIG treatment may improve the prognosis of SFTS patients.”
The authors apologize for the errors and state that this does not change the scientific conclusions of the article in any way. The original article has been updated.
Publisher’s note
All claims expressed in this article are solely those of the authors and do not necessarily represent those of their affiliated organizations, or those of the publisher, the editors and the reviewers. Any product that may be evaluated in this article, or claim that may be made by its manufacturer, is not guaranteed or endorsed by the publisher.
Keywords: intravenous immunoglobulin, mortality, severe fever with thrombocytopenia syndrome, neurological complications, dosage, duration
Citation: Liu Y, Tong H, He F, Zhai Y, Wu C, Wang J and Jiang C (2024) Corrigendum: Effect of intravenous immunoglobulin therapy on the prognosis of patients with severe fever with thrombocytopenia syndrome and neurological complications. Front. Immunol. 15:1383797. doi: 10.3389/fimmu.2024.1383797
Received: 08 February 2024; Accepted: 25 March 2024;
Published: 05 April 2024.
Edited by:
Keun Hwa Lee, Hanyang University, Republic of KoreaReviewed by:
Jeong Rae Yoo, Jeju National University, Republic of KoreaCopyright © 2024 Liu, Tong, He, Zhai, Wu, Wang and Jiang. This is an open-access article distributed under the terms of the Creative Commons Attribution License (CC BY). The use, distribution or reproduction in other forums is permitted, provided the original author(s) and the copyright owner(s) are credited and that the original publication in this journal is cited, in accordance with accepted academic practice. No use, distribution or reproduction is permitted which does not comply with these terms.
*Correspondence: Chenxiao Jiang, c2hhcmVqY3hAMTYzLmNvbQ==; Jun Wang, d2pnYW9nb3VAYWxpeXVuLmNvbQ==; Chao Wu, ZHIud3VAbmp1LmVkdS5jbg==
†These authors have contributed equally to this work