 Matthew A. Scott
 Robert Valeris-Chacin
 Alexis C. Thompson2
 Amelia R. Woolums
- 1Veterinary Education, Research, and Outreach Program, Texas A&M University, Canyon, TX, United States
- 2Texas A&M Veterinary Medical Diagnostic Laboratory, Canyon, TX, United States
- 3Department of Pathobiology and Population Medicine, College of Veterinary Medicine, Mississippi State University, Mississippi State, MS, United States
- 4Department of Animal and Dairy Sciences, Mississippi State University, Mississippi State, MS, United States
Bovine respiratory disease (BRD) remains the leading infectious disease in beef cattle production systems. Host gene expression upon facility arrival may indicate risk of BRD development and severity. However, a time-course approach would better define how BRD development influences immunological and inflammatory responses after disease occurrences. Here, we evaluated whole blood transcriptomes of high-risk beef cattle at three time points to elucidate BRD-associated host response. Sequenced jugular whole blood mRNA from 36 cattle (2015: n = 9; 2017: n = 27) across three time points (n = 100 samples; days [D]0, D28, and D63) were processed through ARS-UCD1.2 reference-guided assembly (HISAT2/Stringtie2). Samples were categorized into BRD-severity cohorts (Healthy, n = 14; Treated 1, n = 11; Treated 2+, n = 11) via frequency of antimicrobial clinical treatment. Assessment of gene expression patterns over time within each BRD cohort was modeled through an autoregressive hidden Markov model (EBSeq-HMM; posterior probability ≥ 0.5, FDR < 0.01). Mixed-effects negative binomial models (glmmSeq; FDR < 0.05) and edgeR (FDR < 0.10) identified differentially expressed genes between and across cohorts overtime. A total of 2,580, 2,216, and 2,381 genes were dynamically expressed across time in Healthy, Treated 1, and Treated 2+ cattle, respectively. Genes involved in the production of specialized resolving mediators (SPMs) decreased at D28 and then increased by D63 across all three cohorts. Accordingly, SPM production and alternative complement were differentially expressed between Healthy and Treated 2+ at D0, but not statistically different between the three groups by D63. Magnitude, but not directionality, of gene expression related to SPM production, alternative complement, and innate immune response signified Healthy and Treated 2+ cattle. Differences in gene expression at D63 across the three groups were related to oxygen binding and carrier activity, natural killer cell-mediated cytotoxicity, cathelicidin production, and neutrophil degranulation, possibly indicating prolonged airway pathology and inflammation weeks after clinical treatment for BRD. These findings indicate genomic mechanisms indicative of BRD development and severity over time.
1 Introduction
Bovine respiratory disease (BRD) remains the leading disease complex in North American beef cattle feeding systems (1, 2). In addition to being the leading cause of clinical intervention and mortality in feeder systems, clinical and subclinical BRD reduces feed efficiency, growth performance, and carcass quality, making it the costliest infectious disease process in post-weaned beef cattle systems (3–8). As a polymicrobial, multifactorial disease complex, BRD stems from the interplay of viral and bacterial pathogenic airway establishment, environmental stressors, and management factors (7–10). However, despite research and advancements in management tactics and diagnostics, BRD is commonly identified via undifferentiated clinical diagnosis and may be underreported antemortem (11–14). Moreover, concurrent prognostic and diagnostic testing fail to achieve early detection and targeted intervention, and the problems faced and/or priorities of individual feeding systems influence the utility and implementation of BRD mitigation tactics (11, 12, 15–17).
To provide potential novel methods and biomarkers to more accurately identify cattle that develop and/or succumb to BRD, our research group and others have focused on evaluating the host transcriptomes of cattle at the time of facility arrival with respect to naturally occurring BRD outcomes to identify potential indicators of concurrent subclinical or eventual development of BRD (18–21). Likewise, several research groups have evaluated cattle transcriptomes in case-control studies with regard to naturally occurring BRD in an effort to understand key molecular events and signaling pathways involved in respiratory disease development and clinical presentation (18, 22–24). Collectively, these studies have identified immune system-driven biological mechanisms, such as type-I interferon production, complement, and inflammatory mediation, in relative gene expression levels that appear to indicate BRD outcomes and potential severity. However, relatively few studies have assessed the impact that BRD acquisition has on the host immune response over time, particularly within the context of disease resolution (18).
Accordingly, we sought to analyze the transcriptomes of high-risk stocker cattle, enrolled over multiple years, to identify potential changes in immune function and signaling pathways associated with BRD development. Here, we hypothesized that BRD development (1) could be identifiable with host gene expression signaling upon arrival, defined by previously identified genes and enriched pathways (18–21), and (2) impacts the immune system in a prolonged and identifiable manner following disease resolution. The goal of this work is to provide key insights into the immunological influence and signaling influenced by BRD, which may impact health and performance outcomes when cattle are transitioned into feedlot or finisher production systems. Here, our findings provide a foundation for understanding immunological signaling influenced by respiratory disease development and resolution, which may be leveraged in future disease-mitigation research and approaches.
2 Materials and methods
2.1 Animal use approval and sample selection
Animal use and procedures were approved by the Mississippi State University Animal Care and Use Committee (IACUC Protocol No. 15-003 and No. 17-120) and carried out in accordance with relevant IACUC and agency guidelines and regulations. The information reported here is in accordance with Animal Research: Reporting of In Vivo Experiments (ARRIVE) guidelines (25).
The primary focus of this study was to determine gene expression patterns over time that were influenced by naturally occurring clinical BRD. The cattle used in this experiment were included in a multi-year (2015, 2017) clinical trial to determine the effect of vaccine and anthelminthic administration upon arrival on health and performance outcomes, compared in a 2 × 2 factorial design; complete study information, including treatment and pen allocation, feed and mineral source, and sampling schedule, is found elsewhere (26, 27). A total of 160 cattle from both years (n = 80, 2015; n = 80, 2017), confirmed to be free of bovine viral diarrhea virus persistent infection via ear notch antigen-capture ELISA, were housed and maintained in an identical fashion at the Leveck Animal Research Facility at Mississippi State University for 85 and 82 days for the 2015 and 2017 groups, respectively. For the 2015 study, jugular whole blood from cattle was collected into Tempus RNA blood tubes (Applied Biosystems, Waltham, MA, USA) at days 0, 14, 28, and 70. For the 2017 study, whole blood was collected in an identical fashion at days 0, 26 (referred to as 28 for simplicity), and 54. All blood samples were stored at − 80°C until analysis. Individual body weights were collected every 2 weeks in each study. All cattle were assessed for visual signs of clinical BRD and/or other disease processes by trained staff, where signs for BRD were assigned a severity score of 0–4 (0 = normal, 1 = mild, 2 = moderate, 3 = severe, 4 = moribund), closely resembling the scoring system previously described (28, 29). Antimicrobial treatment for BRD was instituted as described by Griffin and colleagues (26). Cattle deemed unlikely to recover were euthanized by project veterinarians via intravenous administration of pentobarbital, followed by a gross necropsy that was performed by trained staff. Following the conclusion of both studies, cattle were grouped based on the frequency of clinical treatment for BRD: never diagnosed nor treated (Healthy), treated one time throughout the course of their study (Treated 1), and treated twice or more and/or succumbed to clinical BRD (Treated 2+). Notably, only one individual included in this study (ID33_2015) succumbed to naturally occurring BRD and was found acutely dead on day 51 of the 2015 study (19).
Our primary objective for sample selection was to enroll random individuals while stratifying for relatively equal numbers of samples across treatment frequency groups, time points, and years. For this study, we utilized later time points from cattle whose at-arrival (D0) samples had been previously sequenced for the identification of candidate genes and mechanisms associated with BRD outcomes (19, 20) and randomly included nine additional cattle not previously transcriptomically evaluated at D0 (ID_20_2015, ID_40_2015, ID_60_2015, ID_68_2015, ID_71_2015, ID_114_2017, ID_147_2015, ID_166_2017, and ID_192_2017) to increase statistical power for differential gene expression detection. An a priori power analysis was performed with RnaSeqSampleSize (30) to calculate assumed study power with our combined RNA-Seq data set, utilizing the following parameters based on outcomes from our previous work (19, 20): minimum number of biological replicates per treatment frequency group (Healthy, Treated 1, and Treated 2+) of 11, minimum average read counts among prognostic genes of 200, maximum estimated gene-wise dispersion of 0.4, the ratio of the geometric mean of normalization factors of 1.5, total number of filtered genes to test across of 16,000, the top 200 genes being prognostic, desired minimum log2 fold-change of prognostic genes set to 2.0, and an established threshold of significance (FDR) of 0.10; statistical probability utilizing Exact test procedures resulted in a power of 0.81. As jugular blood sampling across these two populations was nonsequential when compared to each other, we elected to match the D0 and D28 time point samples from each year and include D70 samples from 2015 (26) and D54 samples from 2017 (27); the D70 and D54 samples were the furthest time points in which Tempus RNA blood tubes were collected from the 2015 and 2017 populations, respectively. For simplicity, these final sampling time points are referred to as D63, the average day of the final time point per sample collection. As peak incidence of BRD is often assumed to occur within the first 2–4 weeks of arrival in stocker cattle systems, D28 and D63 time points were selected to evaluate host gene expression changes at the point in which BRD likelihood would begin to decrease and at the relative end of the stocker production cycle when cattle are typically marketed for feedlot production system entry. We selected 73 samples from 36 individuals for RNA extraction and sequencing. The raw sequencing data from these samples and the corresponding raw sequencing D0 data from our previous experiments (19, 20), for a total of 100 samples from 36 individuals (n = 14, Healthy; n = 11, Treated 1; n = 11, Treated 2+) across three time points (D0, D28, D63), were analyzed. Complete metadata for the cattle enrolled in this study are found in Supplementary Table S1.
2.2 Sample processing and bioinformatic workflow of raw reads
To maintain similarity between RNA-Seq projects, the newly included 73 samples were processed in an equivalent manner to our previous work (19, 20). Total RNA isolation was performed with Tempus Spin RNA Isolation Kit (Applied Biosystems), per the manufacturer’s instructions. Following extraction, samples were evaluated for concentrations and RNA integrity via Qubit 4 fluorometry with RNA Broad Range quantification assay kits (ThermoFisher, Waltham, MA, USA) and TapeStation 4200 electrophoresis with RNA ScreenTapes and analysis reagents (Agilent, Santa Clara, CA, USA), respectively. One sample (ID68_D63) required RNA concentration via a Savant SpeedVac DNA 130 Integrated Vacuum Concentrator System (ThermoFisher, Waltham, MA, USA). All RNA samples were of acceptable quality (RIN: 6.0–9.7; mean = 9.1, SD = 0.6) and concentrations (ng/μL: 29.1–482.0; mean = 188.4, SD = 66.9) to proceed for sequencing library preparation. Library preparation and sequencing were performed by the Texas A&M University Institute for Genome Sciences and Society (TIGSS; College Station, TX, USA). Library preparation for mRNA was performed with the Stranded mRNA Prep Kit (Illumina, San Diego, CA, USA), following the manufacturer’s instructions. Paired-end sequencing for 150 base-pair read fragments was performed on an Illumina NovaSeq 6000 analyzer (v1.7+; S4 reagent kit v1.5) in one flow cell lane.
The 73 newly sequenced raw reads were processed bioinformatically together with the D0 samples from 2015 (19) and 2017 (20), in an effort to reduce technical bias across projects; the 2015 and 2017 samples were previously submitted and are found at the National Center for Biotechnology Information Gene Expression Omnibus (NCBI-GEO), under the accession numbers GSE136176 and GSE161396, respectively. Raw sequencing data for the 73 newly processed samples in this study are available at the NCBI-GEO under the accession number GSE194167. Raw reads were quality assessed with FastQC v0.11.9 (https://www.bioinformatics.babraham.ac.uk/projects/fastqc/) and MultiQC v1.12 (31). Trimmomatic v0.39 (32) was used to perform read pair trimming, adaptor removal, and minimal quality retainment with the following parameters: leading/trailing bases were removed if below a base Phred quality score of 3, removal of reads with 4 base-pair sliding window having a Phred quality score of less than 20, and removal of read fragments with a length below 32 bases. Retained reads were mapped and indexed to the bovine reference genome assembly ARS-UCD1.2 with HISAT2 v2.2.1 (33). Sequence Alignment/Map (SAM) files were converted to Binary Alignment Map (BAM) files prior to transcript assembly via Samtools v1.14 (34). Transcript assembly and gene-level expression estimation for downstream analyses were performed with StringTie v2.2.0 (35, 36), as described by Pertea and colleagues (37).
2.3 Differential gene expression analysis
Gene-level count matrices were processed and analyzed with R v4.1.2. To control batch effects, the package ComBat-seq [sva] v3.42.0 (38) was used to account for the sequencing platform across all samples. Briefly, the variable “Platform” (Supplementary Table S1) was used in ComBat-seq as the batch effect for each sample, indicated as the numeral “1” for all newly sequenced samples, “2” for GSE136176 samples, and “3” for GSE161396 samples, and “Severity” (Supplementary Table S1) was used as the biological condition of interest, with all other parameters set to default. Samples were further processed and filtered to reduce data sparsity by procedures described by Chen and colleagues (39), where any gene with a minimum total count above 100 and a count-per-million (CPM) of 0.5 in at least twelve samples was retained for further analysis.
Raw, filtered gene-level counts were normalized across samples with the trimmed mean of M-values (TMM) method (40) and had tagwise dispersion estimates calculated for input into glmmSeq v0.2.2 (https://github.com/myles-lewis/glmmSeq) for negative binomial mixed-effect time-course evaluation. Model adaptation allowed for the assessment of differentially expressed genes (DEGs) across time points, BRD severity groups (by frequency of antimicrobial therapy), and the interactions between time points and severity groups, where p-values were adjusted to control the false discovery rate (FDR) with the Benjamini–Hochberg method; genes were considered significantly expressed with an FDR < 0.05. The following negative binomial mixed-effect model was fitted to account for the three time points (“Day”) and treatment frequencies (“Severity”) as fixed effects, and individual (“actual_ID”), population (“Year”), and at-arrival vaccination (“Vax”) as random intercepts:
Model = gene count ~Day + Severity + Day: Severity + (1|actual_ID) + (1|Year) + (1|Vax)
Pairwise comparisons for DEGs between each severity group at each time point were performed with raw, filtered gene-level counts with edgeR v3.36.0 (41, 42). Within edgeR, genes were fitted under a generalized linear model (GLM) framework and analyzed via quasi-likelihood F-tests (QLF), following common dispersion estimation and blocking for a year and individual ID. Pairwise gene comparisons were considered significant with an FDR < 0.10.
2.4 Dynamic gene expression trend analyses
Gene expression dynamics over time were evaluated for each disease severity group (“Healthy”, “Treated 1”, “Treated 2”) independently. First, library size factors were calculated for raw filtered counts with the Upper-Quartile normalization method (43). Following normalization procedures, gene expressional paths over time were identified for each severity group through time-series differential analysis via EBSeq-HMM v1.28.0 (44). Briefly, EBSeq-HMM utilizes an autoregressive hidden Markov model to categorize expressional dependence over ordered conditions (time points D0, D28, and D63 in the case of this study) and identifies dynamic paths where gene expression continuously changes. For this study, we specifically retained genes possessing continuous changes (i.e., up- or downregulation) between each time point, with the four pathways described as “Up-Down” (for upregulation from D0 to D28, then downregulation from D28 to D63), “Up-Up” (for upregulation from D0 to D28, and continued upregulation from D28 to D63), “Down-Down” (downregulation from D0 to D28, and continued downregulation from D28 to D63), or “Down-Up” (downregulation from D0 to D28, then upregulation from D28 to D63). EBSeq-HMM was performed with 100 iterations of the Baum–Welsh algorithm (“UpdateRd=100”), an expected fold-change of 2.4 (“FCV=2.4”), two-chain mixture proportion updating set to FALSE (“UpdatePI=FALSE”), and all other parameters set to default. These parameters were set after 500 testing runs to maximize the log-likelihood estimates and eventual model fitting, per the developer’s instruction (https://www.bioconductor.org/packages/release/bioc/vignettes/EBSeqHMM/inst/doc/EBSeqHMM_vignette.pdf). The resulting maximized log-likelihood estimates and treatment plots for all tested parameters are found in Supplementary Table S2. Dynamically expressed genes were retained, having a posterior probability ≥ 0.50 and FDR < 0.01.
2.5 Gene-level functional enrichment analyses
Biological pathway and Gene Ontology (GO) term analyses were performed in the KOBAS-intelligence v3.0 API framework (accessed 20 May 2023) from DEGs found by (1) glmmSeq Severity and edgeR QLF testing at each time point and (2) glmmSeq Day: Severity interactions and the compiled list of DEGs from edgeR QLF testing (45). Within KOBAS-i, input genes were analyzed via the overrepresentation analysis method using the hypergeometric distribution, Fisher’s exact testing, and the Bos taurus genome as the background species reference. Specifically, functional enrichments within KOBAS-i utilized the GO knowledgebase, Kyoto Encyclopedia of Genes and Genomes, and Reactome databases (46–48). The Benjamini–Hochberg procedure was used to control the FDR, and any functional enrichment having an FDR < 0.05 was considered significant. An upset plot was generated to visualize the overlap of DEGs and functional enrichment terms identified between severity groups across each time point via Intervene (49, 50).
In an effort to avoid overdetection of terms and pathways enriched by DEGs by the same functional enrichment toolset (51–53), we elected to perform analyses with the directionally expressed genes identified by EBSeq-HMM with g:Profiler ve110_eg57_p18_4b54a898 (accessed 2 January 2024) (54). Here, genes identified in each directional pathway in each BRD severity group were imputed as the conserved gene name identified by the Bos taurus genome reference database. In g:Profiler, genes were input as an ordered query, ranked in descending order by maximum posterior probability (Supplementary Table S4), and the parameters included only annotated genes, the GO molecular function, cellular component, and biological process, KEGG, Reactome, and WikiPathways as the data source background, and applying the g:SCS multiple test correction technique with an adjusted p-value cutoff of 0.05 (54–57). All other parameters were set to default.
3 Results
3.1 Determination of significant gene expression patterns
Differential gene expression analysis with both edgeR and glmmSeq resulted in 3,257 uniquely identified DEGs between treatment groups over time (Supplementary Table S3). Following the overlapping of results between the two analysis platforms, a total of 203 and 286 DEGs were identified when evaluating the differences between each treatment group at each time point and the interaction of Severity and Time, respectively (Table 1). The overlaps of DEGs (gene names) identified within each time point are found in Figure 1. Here, the most unique DEGs were found between Healthy vs. Treated 2+ cattle at D63 (n = 50), Treated 1 vs. Treated 2+ cattle at D63 (n = 21), and Treated 1 vs. Treated 2+ cattle at Day 0 (n = 9). The greatest number of overlapping DEGs were observed between Healthy vs. Treated 2+ and Treated 1 vs. Treated 2+ at Day 63 (n = 35), Treated 1 vs. Treated 2+ and Healthy vs. Treated 2+ at Day 0 (n = 9), and Treated 1 vs. Treated 2+ and Healthy vs. Treated 1 at Day 63 (n = 5); no overlap was observed at Day 28.
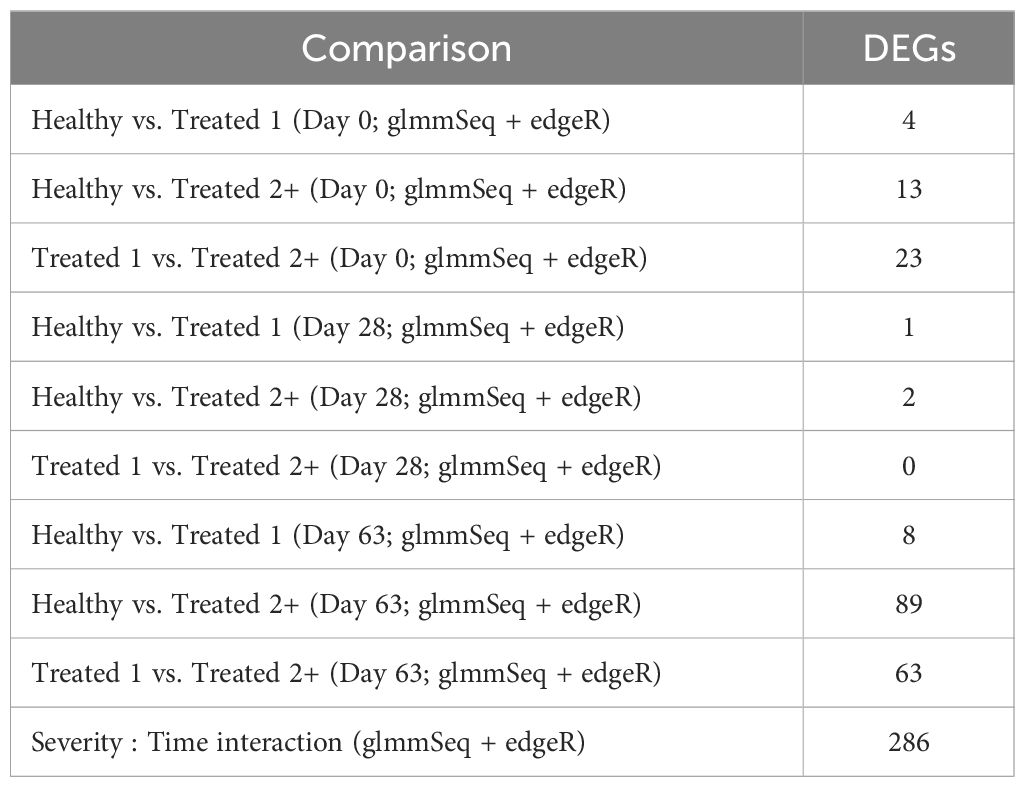
Table 1. Total number of differentially expressed genes identified for each comparative analysis via edgeR and glmmSeq.
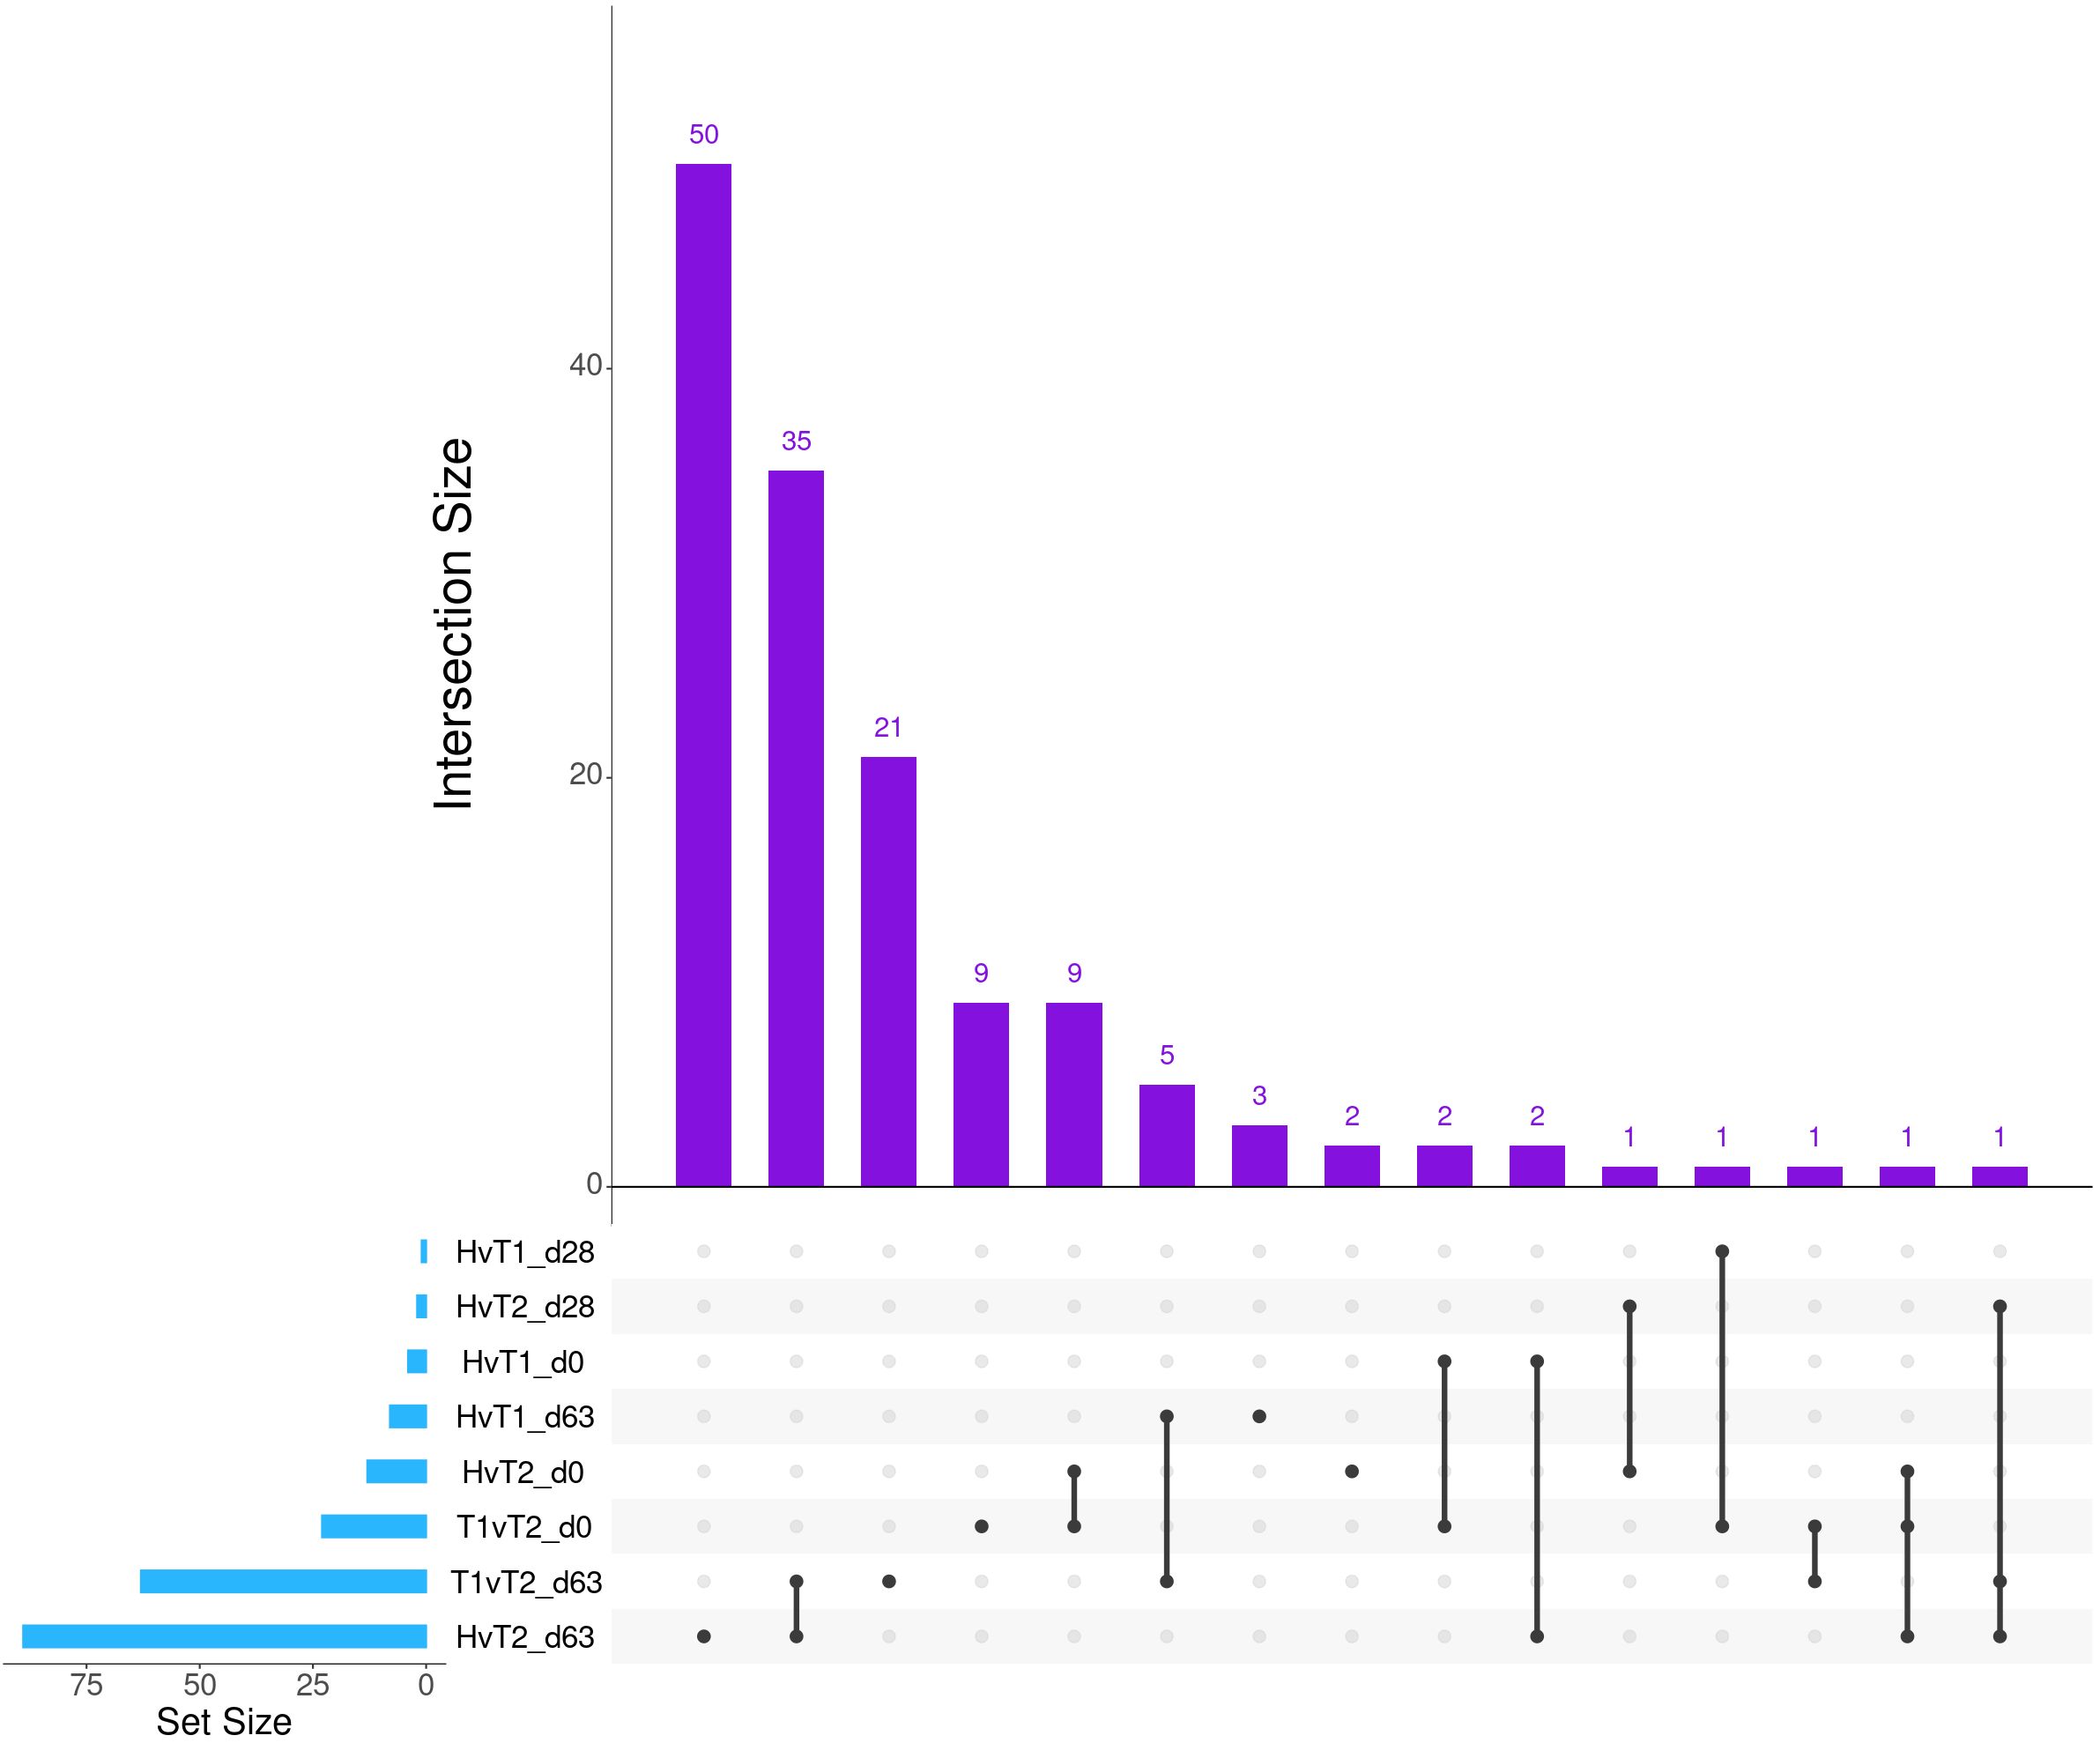
Figure 1. Matrix intersections of the number of differentially expressed genes (set size) identified between severity groups by edgeR and glmmSeq analyses. Each column represents the number of genes (intersection size) corresponding to one or more intersecting sets of analysis (row). Healthy cattle are indicated by “H”, Treated 1 cattle by “T1”, and Treated 2+ cattle by “T2”. Each day of sampling (0, 28, 63) is indicated by “d0”, “d28”, or “d63”.
A total of 7,177 genes were identified as dynamically expressed across all three severity groups via EBSeq-HMM analysis (Table 2; Supplementary Table S4). The Down-Down expressional direction was consistently the most highly expressed path, resulting in 2,232, 1,939, and 1,862 for Healthy, Treated 1, and Treated 2+ cattle, respectively. Likewise, the Down-Down expressional direction demonstrated the highest level of overlap between the three severity groups (n = 804; Figure 2). Next, the Down-Up expressional direction was the second-most abundant path, resulting in 184, 165, and 379 genes found in the Healthy, Treated 1, and Treated 2+ cattle, respectively. The Down-Up path demonstrated 13 genes to be uniquely shared between all three severity groups: ALOX5, ALOX15, ENHO, FRRS1, HPGD, KCTD15, LOC100295883 (CYP4F3), LOC100297044 (CCL14), LOC100337044 (ADGRE3), LOC112446413 (TRGV3), MAP6D1, SLC7A11, and SMPD3 (Supplementary Table S4; Figure 2). Analysis of the “Up-Down” expressional direction resulted in 163, 112, and 132 genes identified in Healthy, Treated 1, and Treated 2+ cattle, respectively, with no overlapping between all three severity groups. The Up-Up expressional direction resulted in the fewest identified genes, with one, 0, and eight found in the Healthy, Treated 1, and Treated 2+ groups, respectively; no overlap was identified between the Healthy and Treated 2+ group for Up-Up expression.
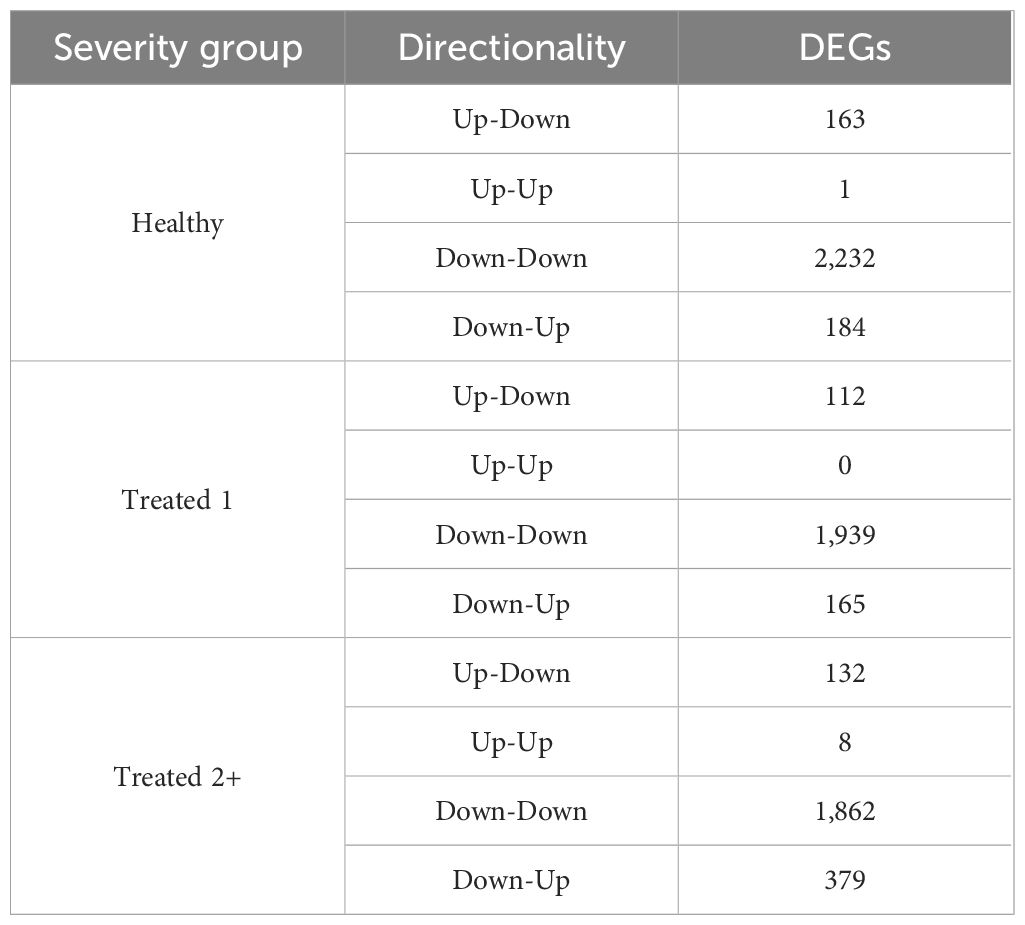
Table 2. Total number of dynamically expressed genes by directionality in each severity group via EBSeq-HMM.
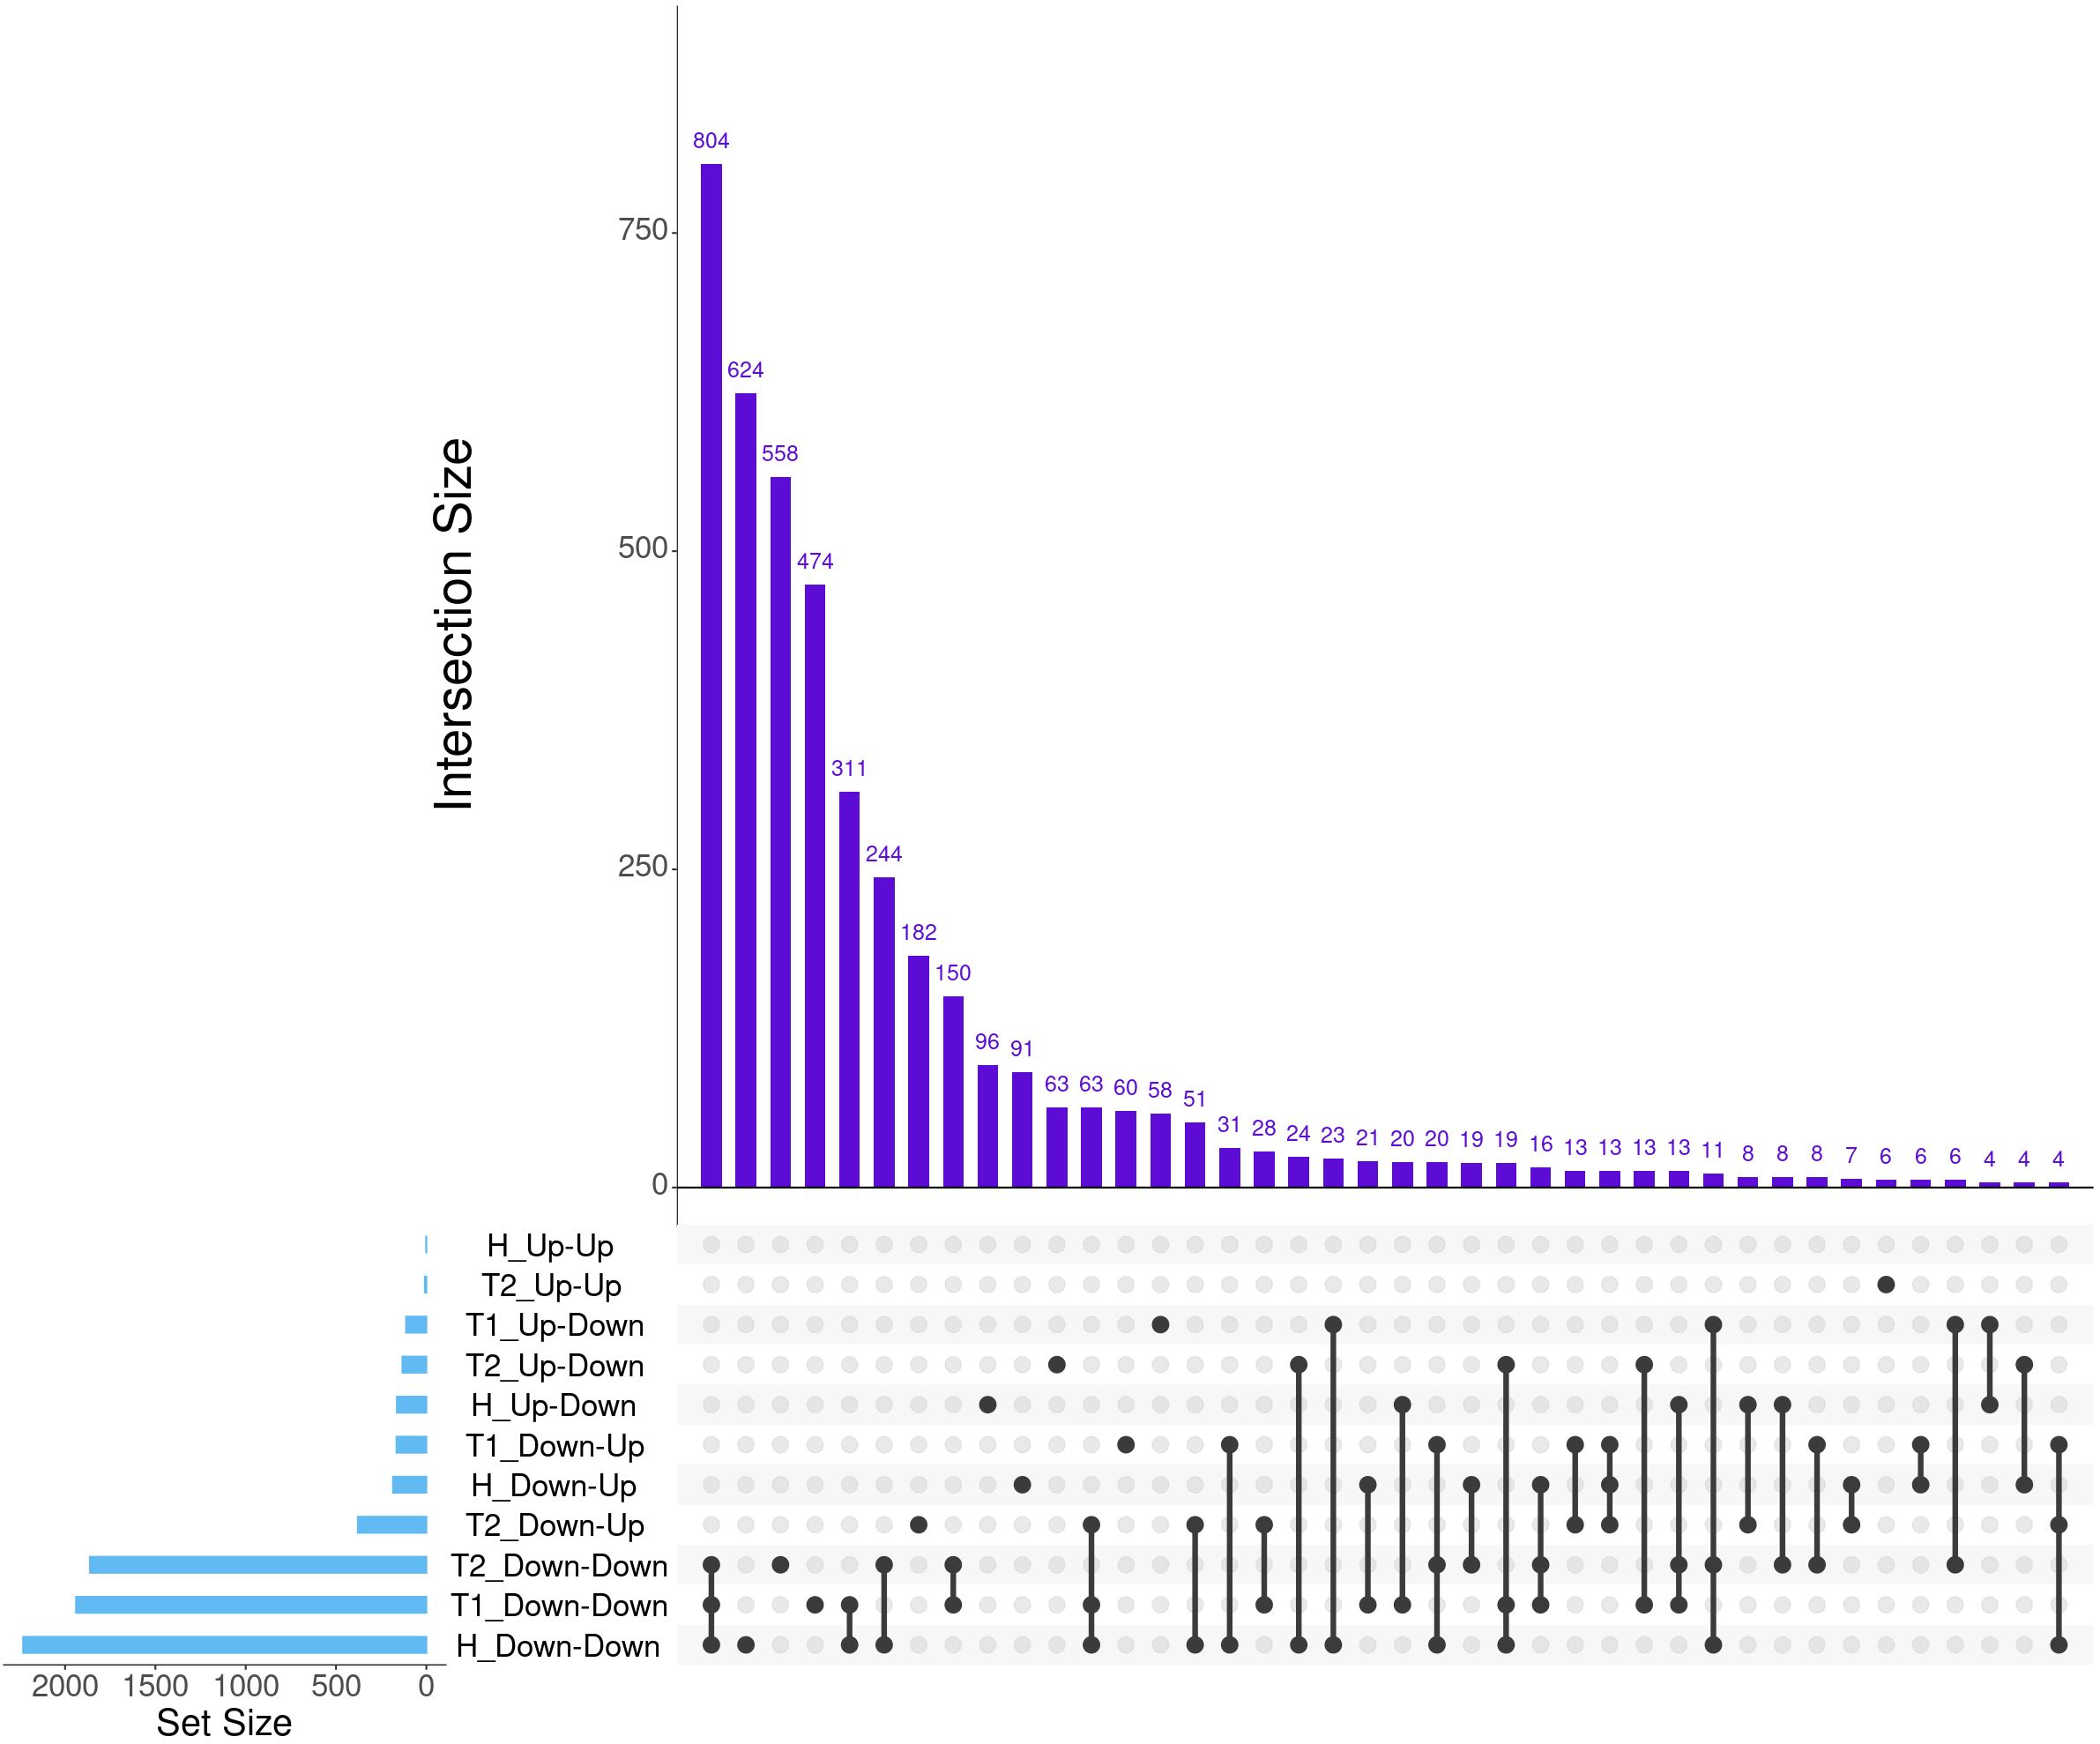
Figure 2. The top 40 matrix intersections of dynamically expressed genes (set size) identified between severity groups by EBSeq-HMM analyses. Each column represents the number of genes (intersection size) corresponding to one or more intersecting sets of analysis (row). Healthy cattle are indicated by “H”, Treated 1 cattle by “T1”, and Treated 2+ cattle by “T2”. Gene expression directionality is indicated by Up-Up, Up-Down, Down-Up, and Down-Down.
3.2 Functional enrichment analyses of differentially expressed genes
In total, 259 GO terms and 134 enriched pathways were identified from differential gene expression analyses via glmmSeq and edgeR (Supplementary Table S5). The total number of enriched GO terms and pathways from each comparison is found in Table 3. Generally, the most informative time points were at Day 0 and the final collection time point (Day 63); notably, no individual was treated after Day 42 (Supplementary Table S1). Regarding Healthy cattle when compared to Treated 1 cattle, no significantly enriched GO terms or pathways were identified for Days 0 and 28. Day 63 resulted in 32 and 26 GO terms and pathways, respectively. These enrichments primarily involved heme scavenging, erythrocyte exchange of O2/CO2, neutrophil degranulation, autophagy, fatty acid metabolism, metal ion binding, negative regulation of activated T-cell proliferation, and interferon-gamma-mediated signaling, fatty acid metabolism, and neutrophil degranulation. Trend-wise modeling of the genes driving the majority of these significant enrichments is found in Figure 3.
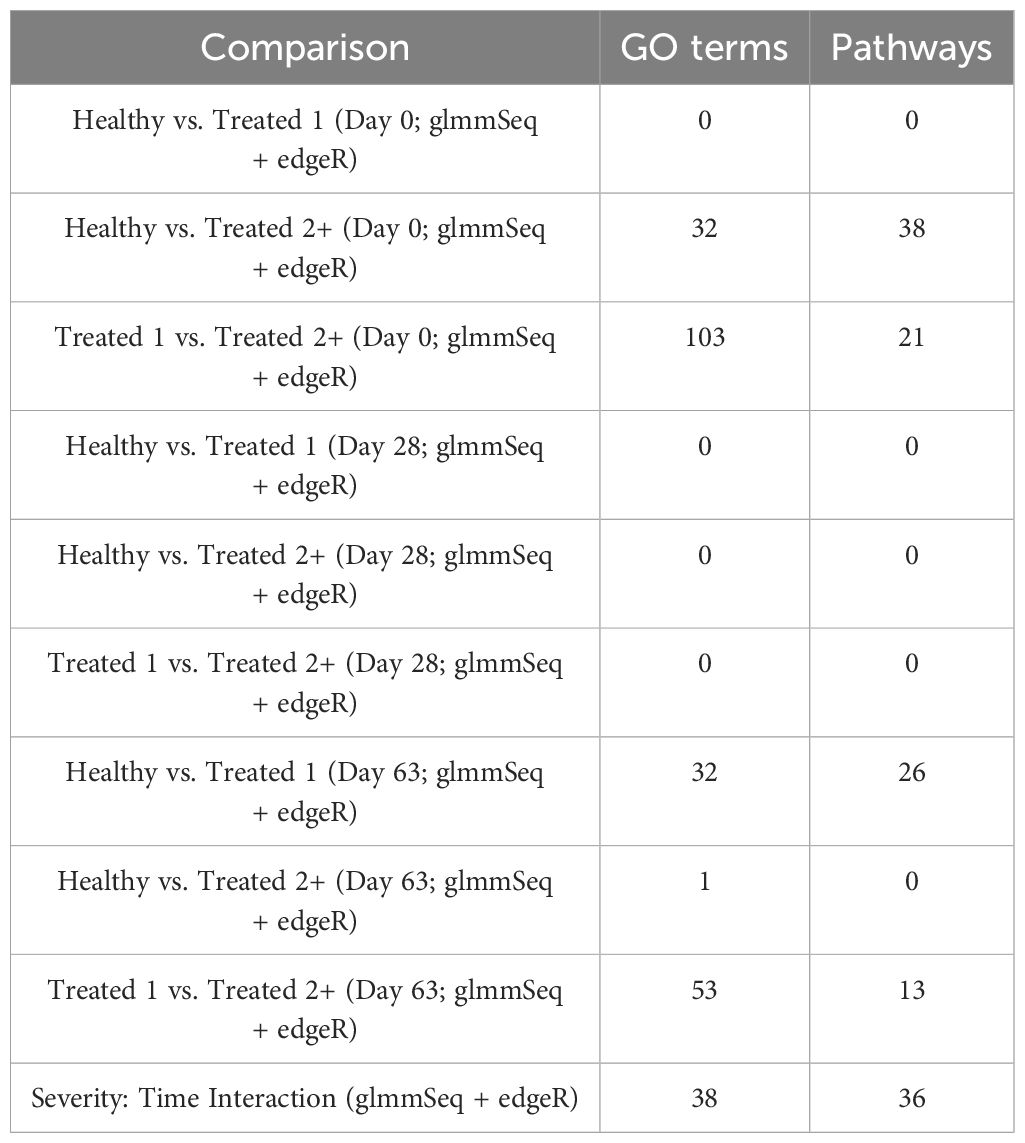
Table 3. Total number of enriched Gene Ontology (GO) terms and Reactome and KEGG pathways identified through differentially expressed genes discovered in each pairwise comparison via KOBAS-i.
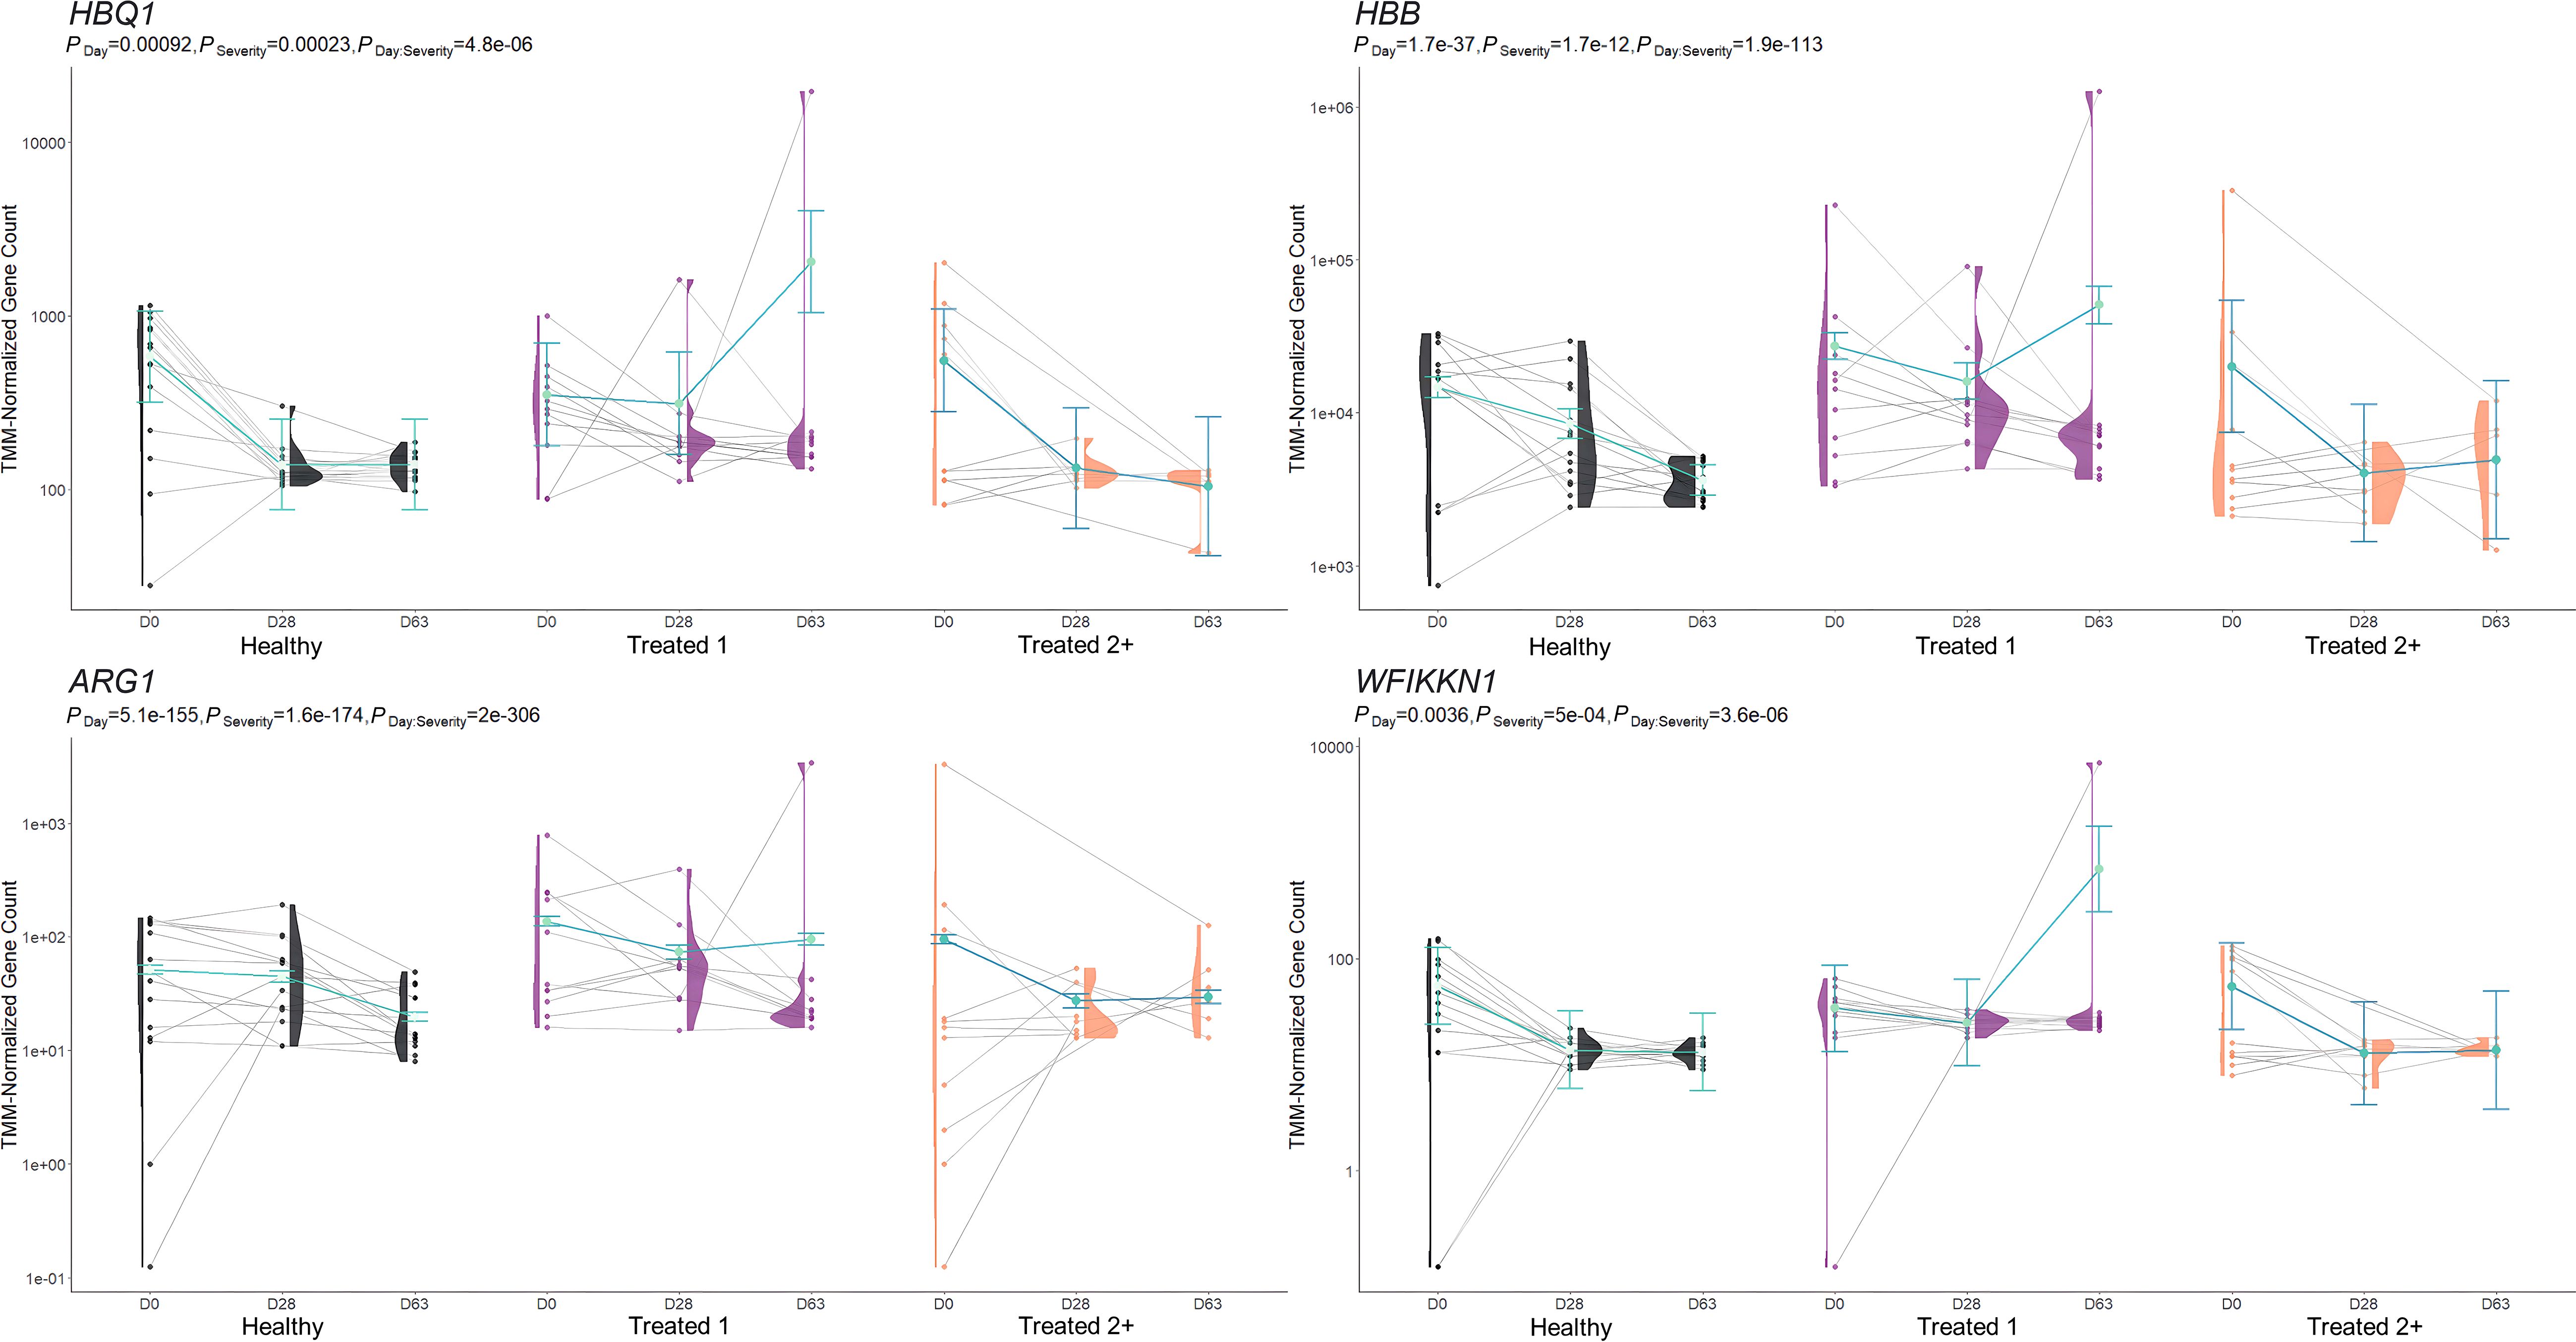
Figure 3. Model plot of key differentially expressed genes identified between Healthy and Treated 1 cattle (ARG1, HBB, HBQ1, and WFIKKN1). Gene expression levels of selected genes driving multiple significant enrichments are shown for all three severity groups, indicated by the x-axis (black: Healthy, purple: Treated 1, orange: Treated 2+) and further denoted by day (D0, D28, D63). Normalized relative gene expression levels for selected genes are indicated by the y-axis. Dots represent the relative gene expression for an individual, spaghetti plot lines indicate the relative trend of gene expression over time for an individual, violin plots represent the distribution of relative gene expression for a severity group at each time point, and overlapping blue lines represent the fitted model utilized by glmmSeq.
When comparing Healthy and Treated 2+ cattle, significant enrichments for GO terms and pathways were identified at Days 0 and 63. At Day 0, a total of 32 and 38 GO terms and pathways were discovered, respectively; these terms and pathways involved arachidonic acid and linoleic acid metabolism, synthesis of leukotrienes and eoxins, biosynthesis of pro-resolving mediators, antigen processing and presentation, MHC class II protein complex, T-cell differentiation, alternative complement activation, and AMP-activated protein kinase signaling. At Day 63, DEGs were found between Healthy and Treated 2+ cattle enriched for one GO term: natural killer cell-mediated cytotoxicity. Trend-wise modeling of the genes driving multiple of these significant enrichments is found in Figure 4.
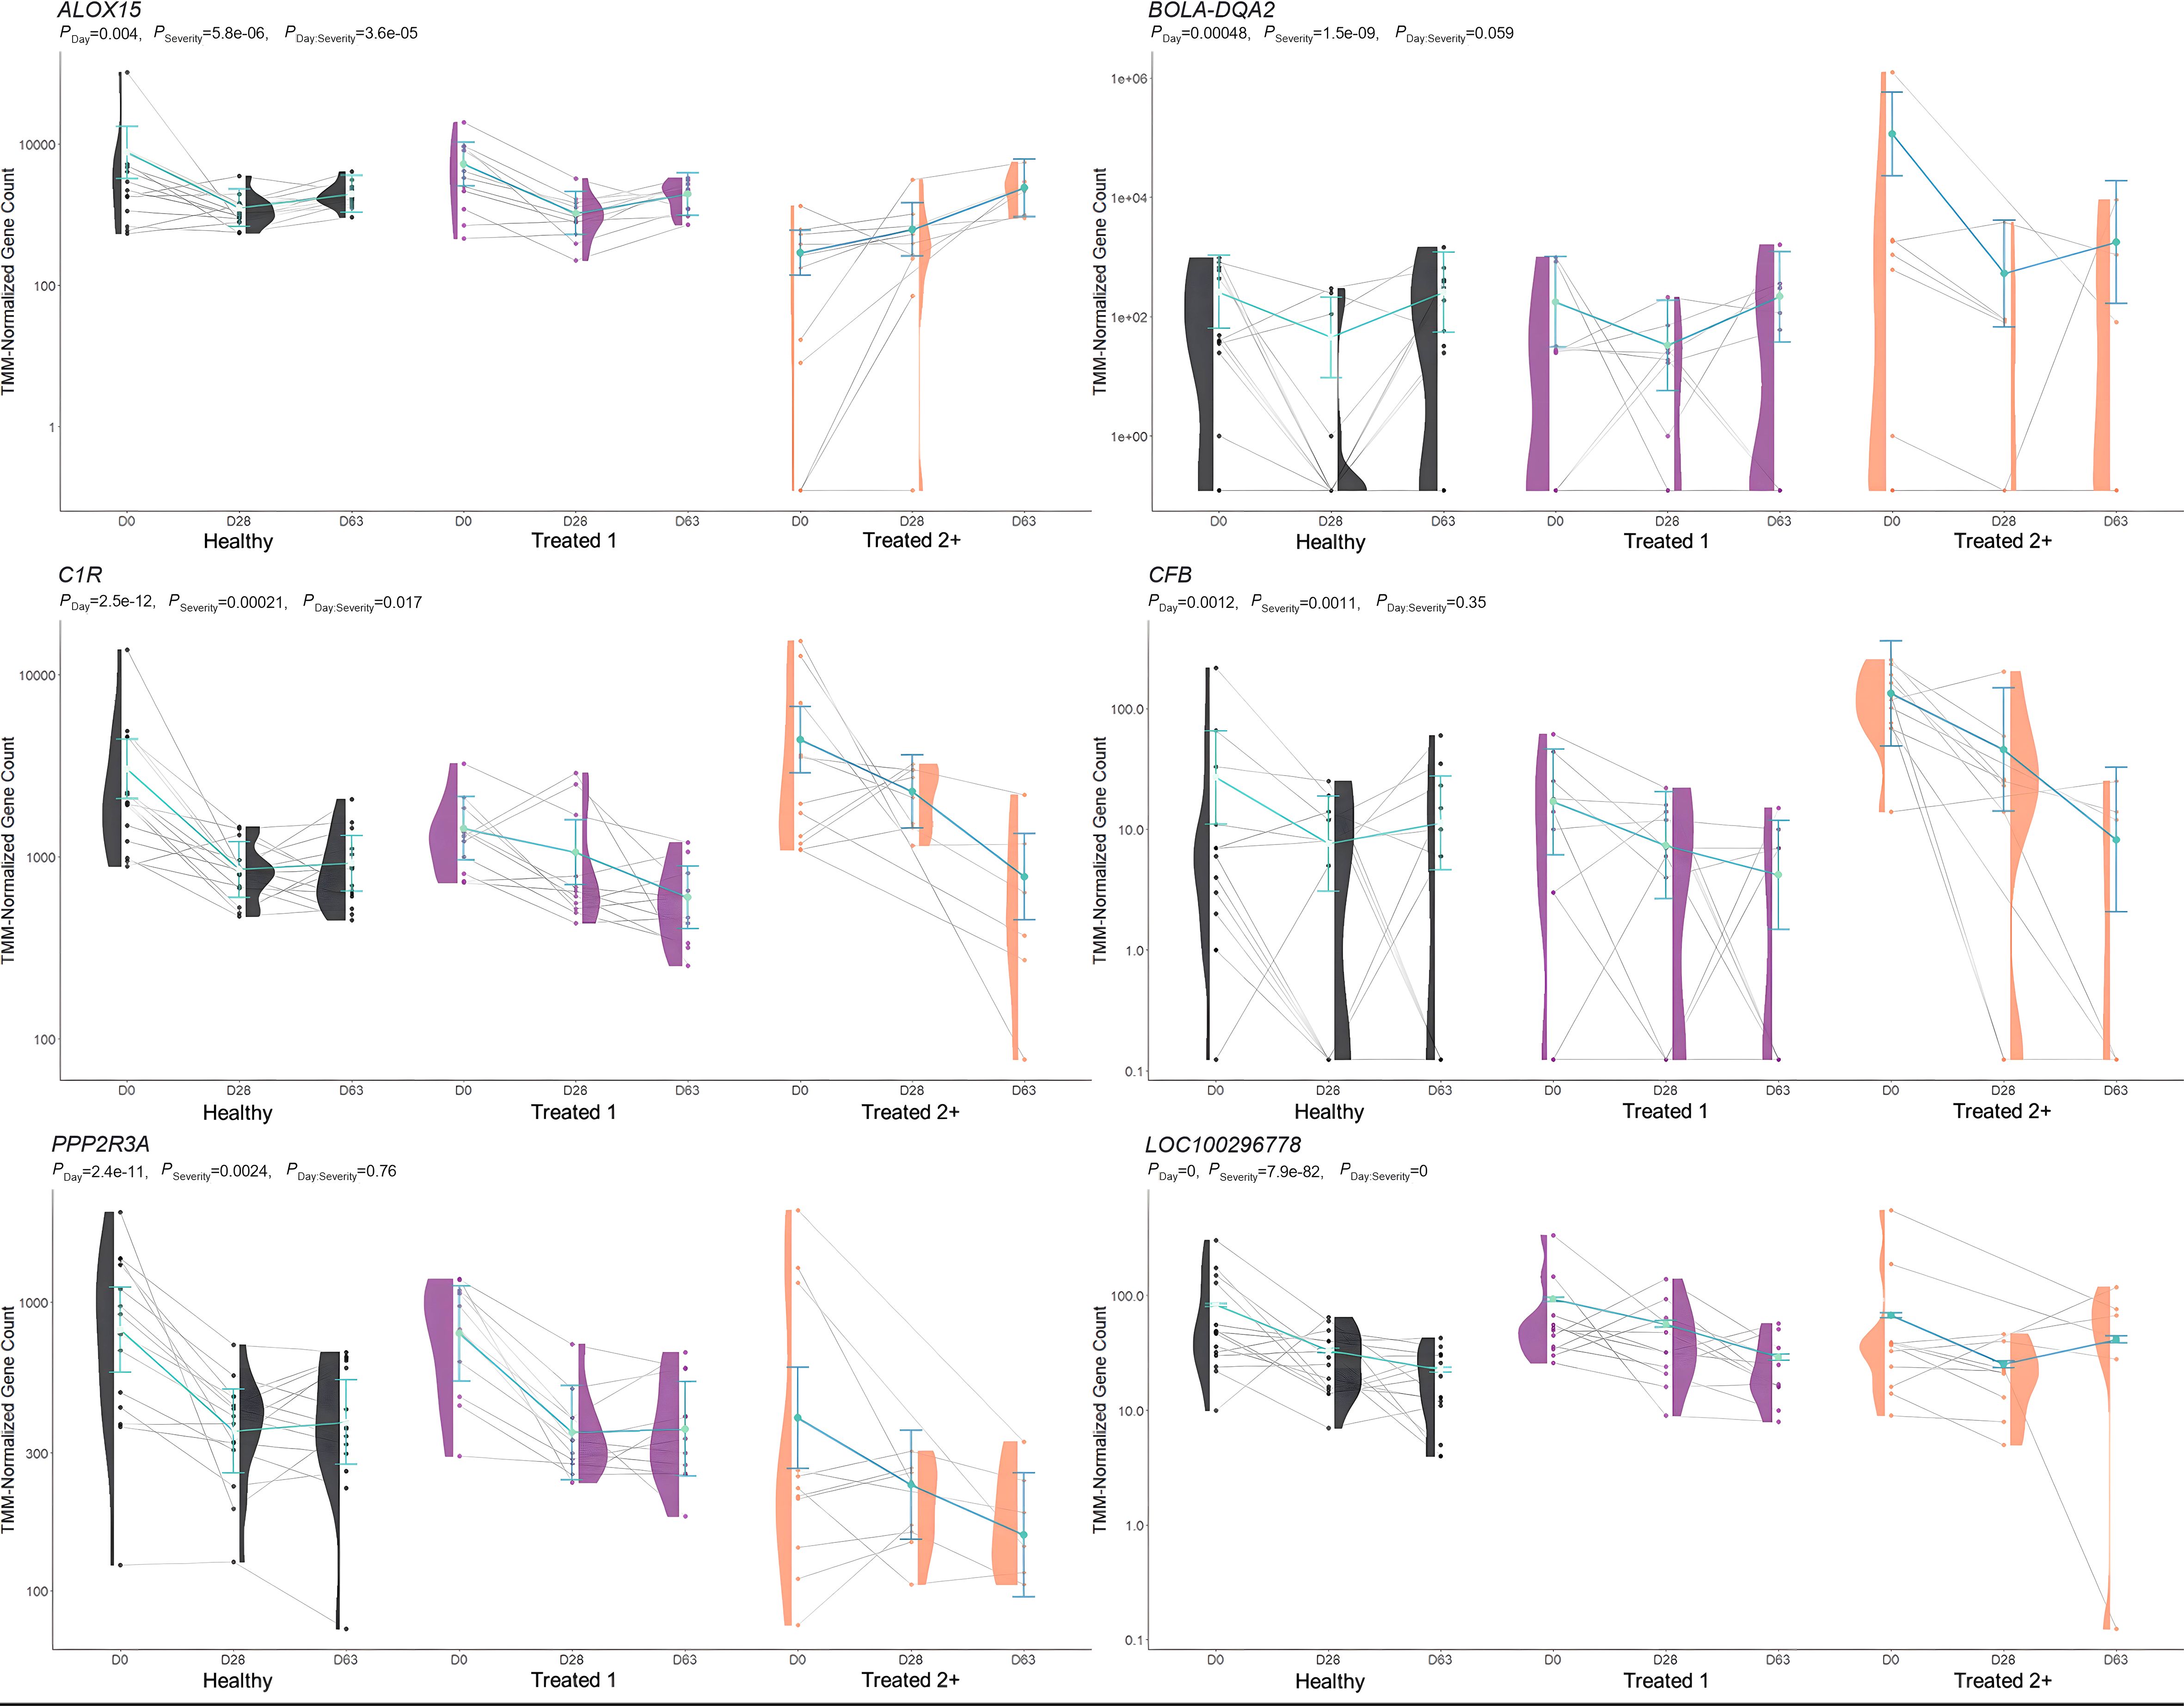
Figure 4. Model plot of key differentially expressed genes identified between healthy and treated 2+ cattle (ALOX15, BOLA-DQA2, C1R, CFB, PPP2R3A, and LOC100296778). Gene expression levels of selected genes driving multiple significant enrichments are shown for all three severity groups, indicated by the x-axis (black: healthy, purple: treated 1, orange: treated 2+) and further denoted by day (D0, D28, D63). Normalized relative gene expression levels for selected genes are indicated by the y-axis. Dots represent the relative gene expression for an individual, spaghetti plot lines indicate the relative trend of gene expression over time for an individual, violin plots represent the distribution of relative gene expression for a severity group at each time point, and overlapping blue lines represent the fitted model utilized by glmmSeq.
The comparison of Treated 1 and Treated 2+ cattle yielded significant enrichments for GO terms and pathways at Days 0 and 63, similar to the aforementioned analyses. At Day 0, 103 and 21 enriched GO terms and pathways were identified, respectively; particularly, these resulted primarily from the nine DEGs also found between Healthy and Treated 2+ cattle at Day 0: ALOX15, BOLA-DQA2, CFB, LCN8, LOC100337053 (ABCC4), LOC112441633 (uncharacterized noncoding RNA), LOC112445169 (MORF4L1 pseudogene), LOC112445170 (MORF4L1 pseudogene), LOC509854 (ABCC4-like), and PPP2R3A (Figures 1, 4). These enrichments involved genes related to bacterial infection, complement, and coagulation cascades (classical and alternative), growth factor binding, smooth muscle cell migration and development, arachidonic acid and linoleic acid metabolism, synthesis of leukotrienes and eoxins, biosynthesis of pro-resolving mediators, antigen processing and presentation, MHC class II protein complex, wound healing, and RNA processing and binding. At Days 63, 53 and 13 enriched GO terms and pathways were discovered between Treated 1 and Treated 2+ cattle, respectively; particularly, several resulted from five DEGs also found between Healthy and Treated 1 cattle at Day 63: ARG1, HBB, HBG, HBQ1, and WFIKKN1 (Figure 3). These enrichments primarily involved erythrocyte exchange of O2/CO2 and heme binding, neutrophil degranulation and innate immunity, autophagy, collagen biosynthesis, cytokine and acute phase responses, and muscle activity and fiber development. Trend-wise modeling of the genes driving these significant enrichments is found in Figure 5.
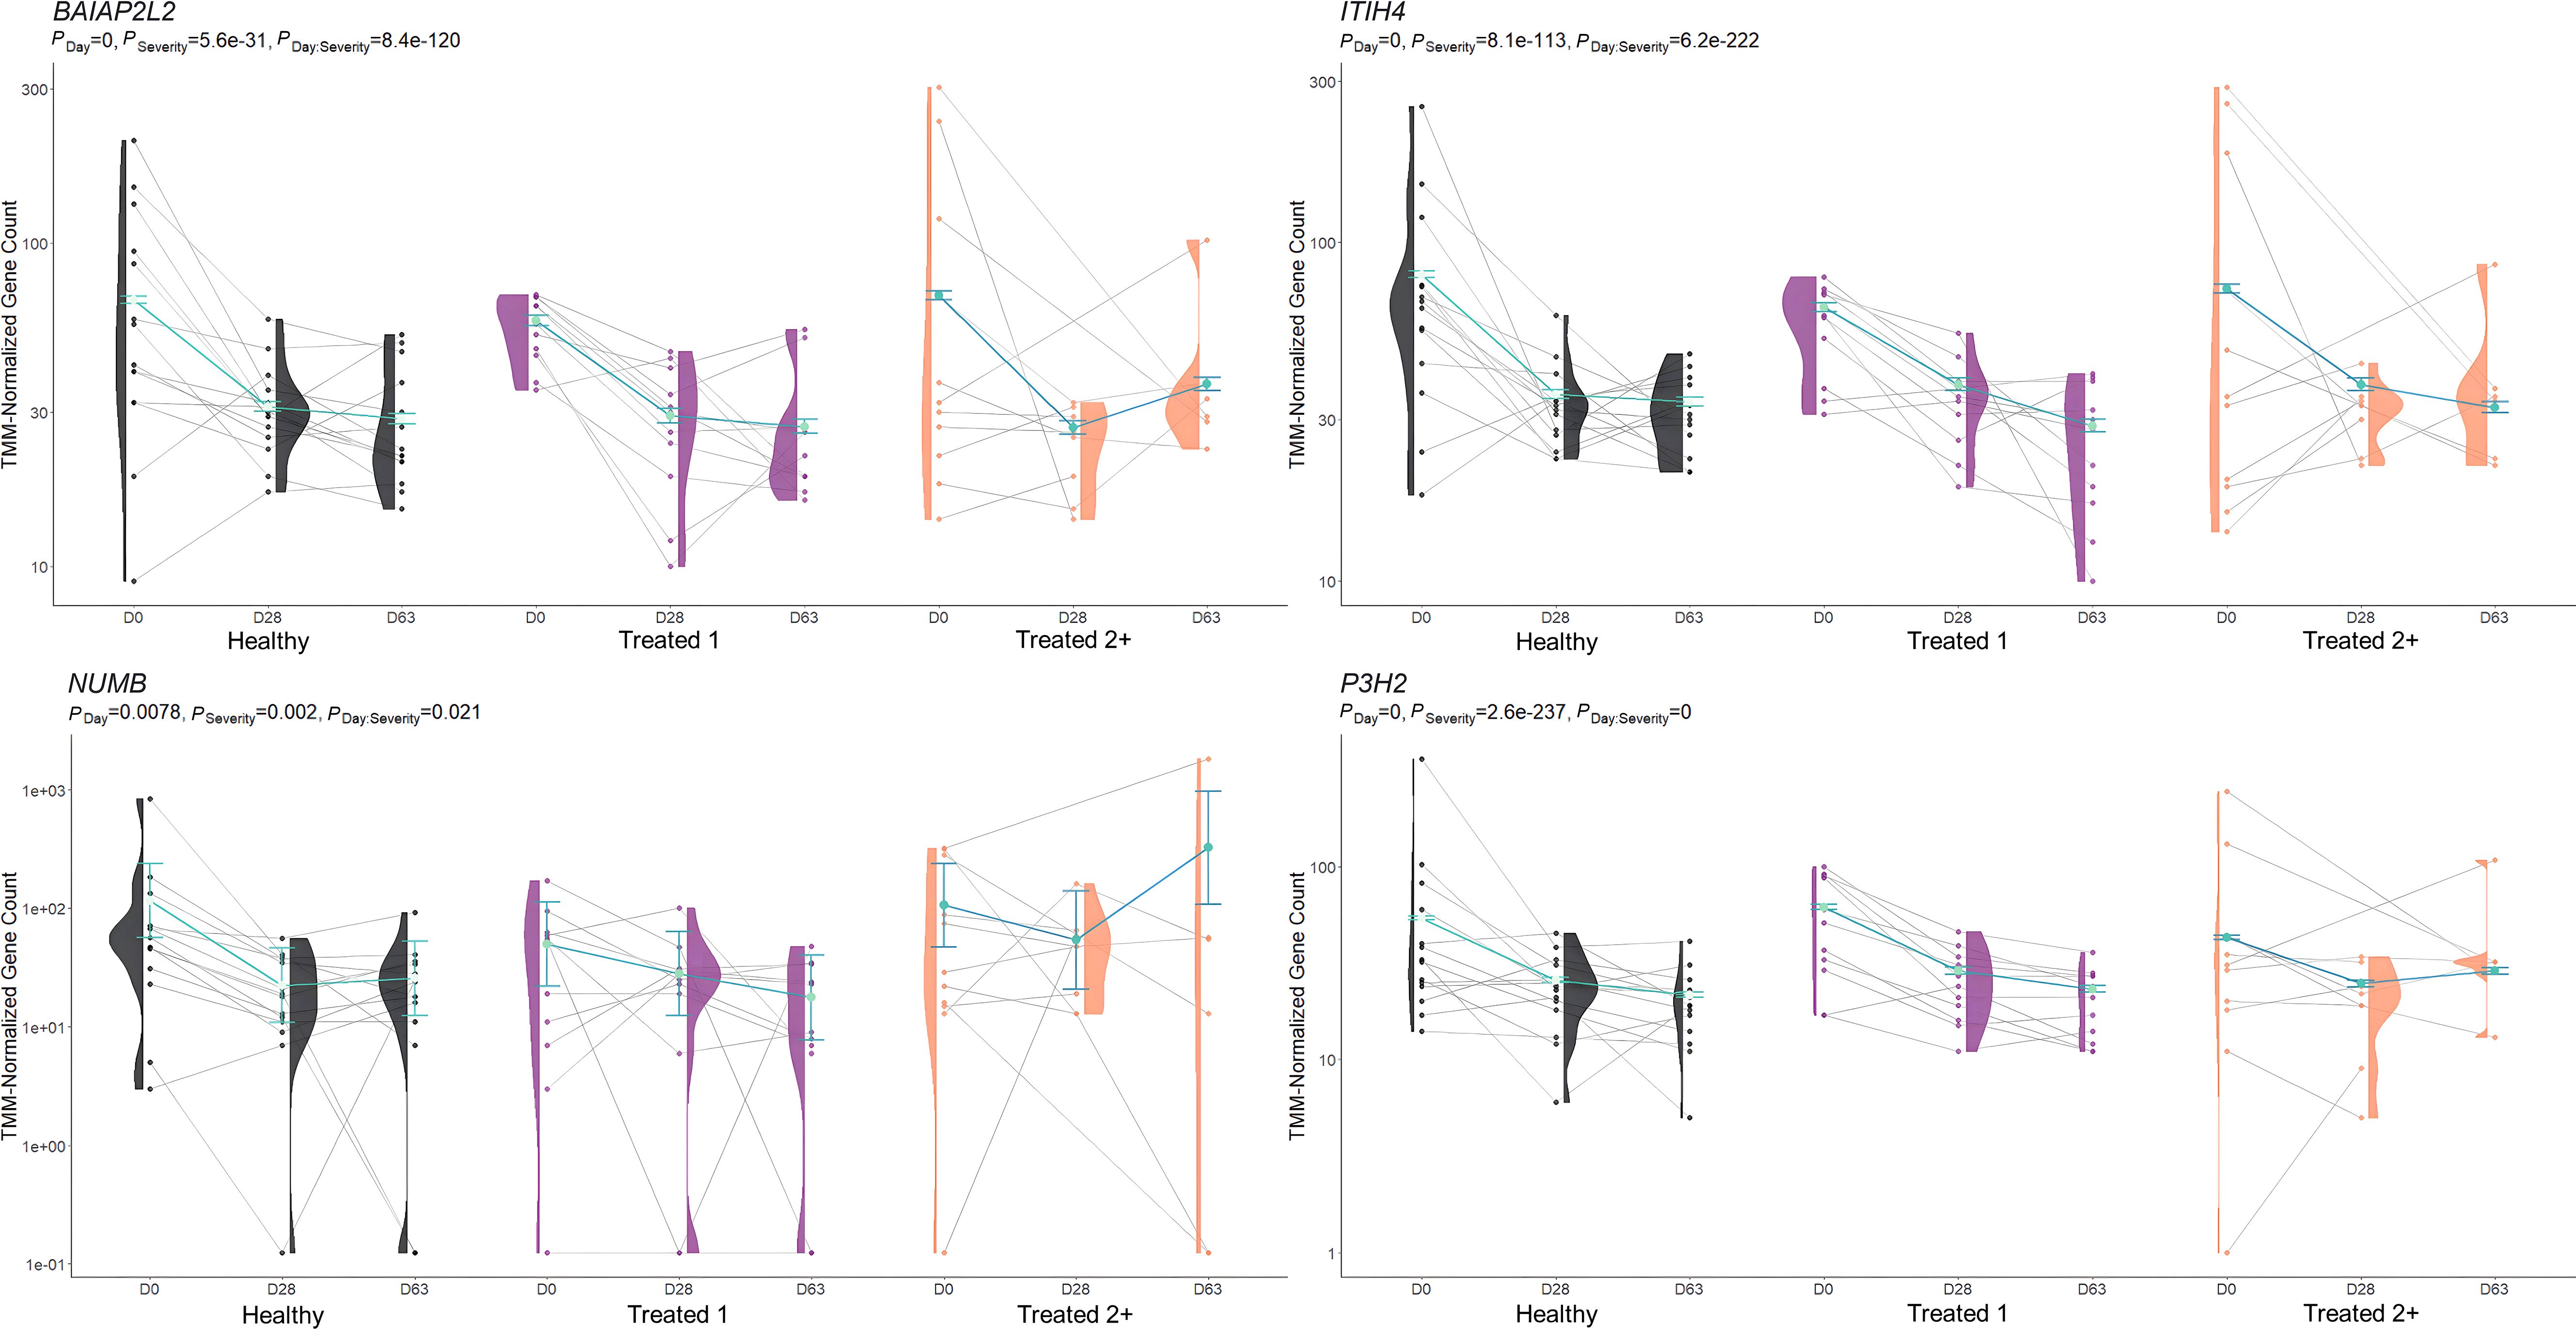
Figure 5. Model plot of key differentially expressed genes identified between treated 1 and treated 2+ cattle (BAIAP2L2, ITIH4, NUMB, and P3H2). Gene expression levels of selected genes driving multiple significant enrichments are shown for all three severity groups, indicated by the x-axis (black: Healthy, purple: Treated 1, orange: Treated 2+) and further denoted by day (D0, D28, D63). Normalized relative gene expression levels for selected genes are indicated by the y-axis. Dots represent the relative gene expression for an individual, spaghetti plot lines indicate the relative trend of gene expression over time for an individual, violin plots represent the distribution of relative gene expression for a severity group at each time point, and overlapping blue lines represent the fitted model utilized by glmmSeq.
Upon evaluation of the DEGs identified through the interaction of Severity and Time, 38 and 36 enriched GO terms and pathways were discovered, respectively. These enrichments are primarily related to RNA processing and metabolism, DNA repair, biosynthesis of pro-resolving mediators, IL-3, IL-5, and CM-CSF signaling, IgA production, T-cell receptor signaling and costimulation, and ubiquitination and tyrosine kinase signal transduction of immune-mediated pathways. Notably, several of these immune-related terms and pathways were enriched by genes previously discovered in the aforementioned analyses, such as ALOX15, ARG1, BAIAP2L2, HBB, HBQ1, ITIH4, P3H2, and WFIKKN1. Trend-wise modeling of the genes driving these significant immune-related enrichments is found in Figure 6.
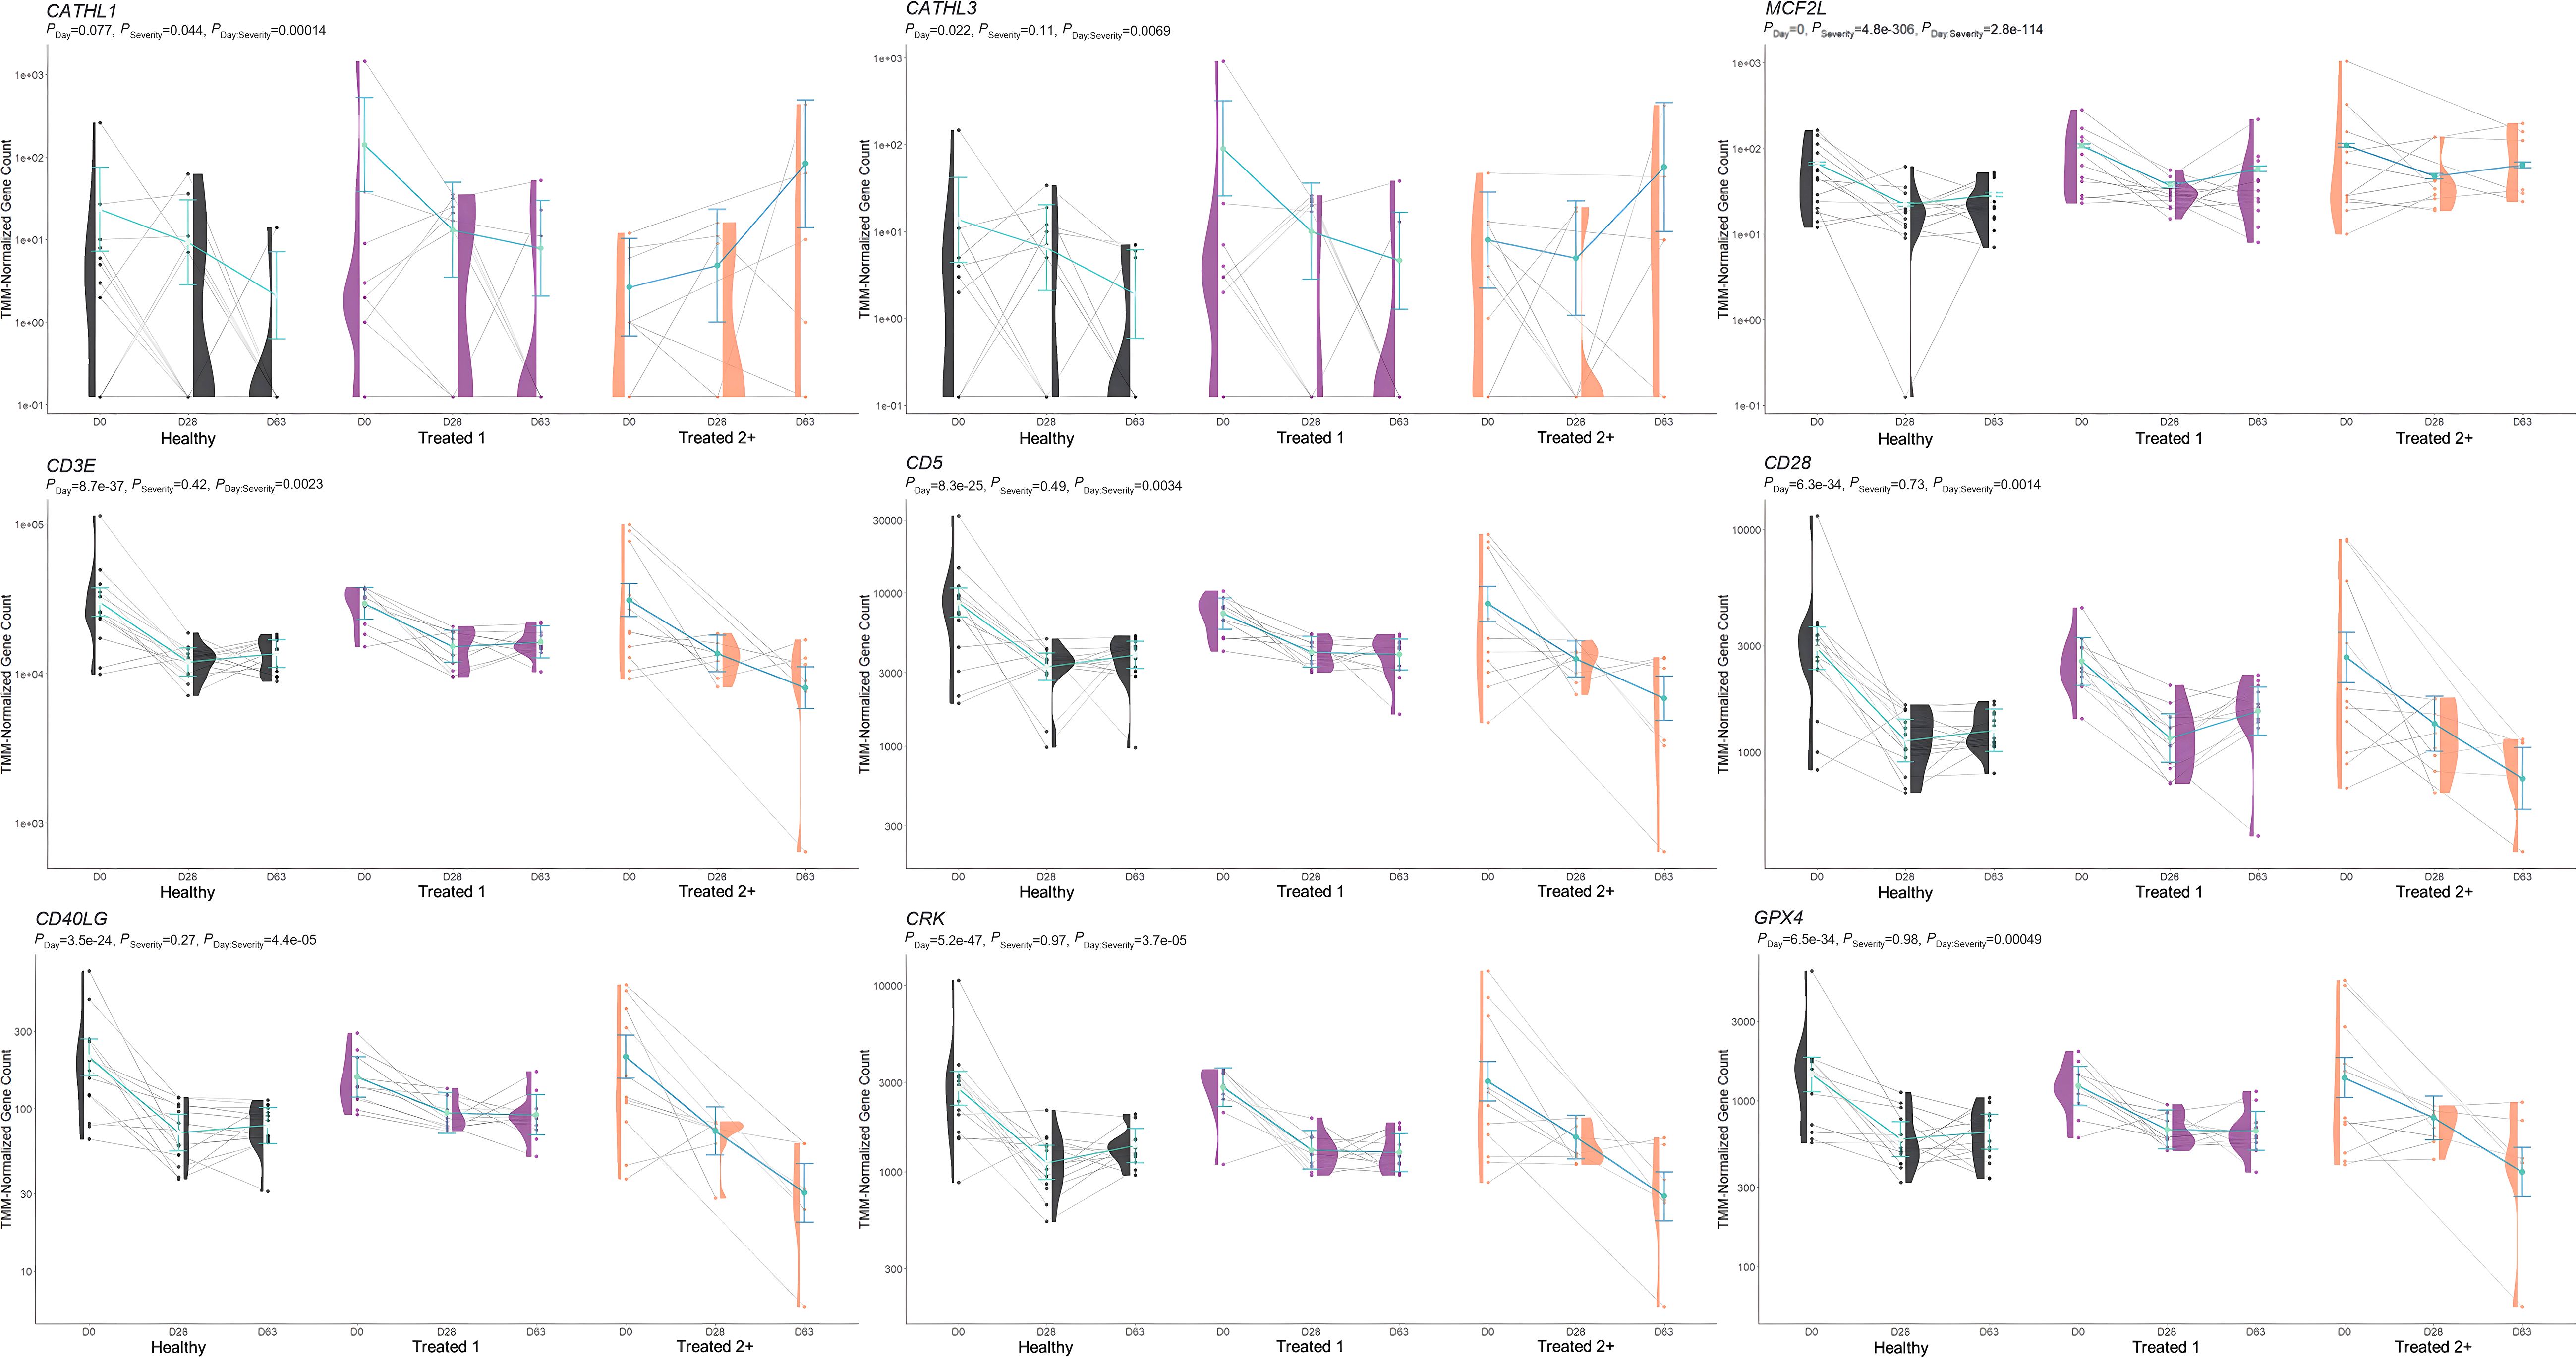
Figure 6. Model plot of key differentially expressed genes identified through the interaction of time and treatment frequency (CATHL1, CATHL3, MCF2L, CD3E, CD5, CD28, CD40LG, CRK, and GPX4). Gene expression levels of selected genes driving multiple significant enrichments are shown for all three severity groups, indicated by the x-axis (black: Healthy, purple: Treated 1, orange: Treated 2+) and further denoted by day (D0, D28, D63). Normalized relative gene expression levels for selected genes are indicated by the y-axis. Dots represent the relative gene expression for an individual, spaghetti plot lines indicate the relative trend of gene expression over time for an individual, violin plots represent the distribution of relative gene expression for a Severity group at each time point, and overlapping blue lines represent the fitted model utilized by glmmSeq.
Several overlapping enrichments were identified between each edgeR and glmmSeq comparison. Regarding Healthy vs. Treated 2+ at Day 0 and Treated 1 vs. Treated 2+ at Day 0, 27 shared GO terms were identified; these terms were primarily related to arachidonic acid/fatty acid metabolism and biosynthesis, MHC class II protein complex, apoptotic cell clearance and antigen presentation, inflammatory regulation and positive regulation of the extracellular signal-regulated kinase (ERK) cascade, and wound healing. Regarding Healthy vs. Treated 1 at D63 and Treated 1 vs. Treated 2+ at D63, 15 shared GO terms were identified; these terms were primarily related to oxygen transport and binding, heme binding, hydrogen peroxide catabolism, muscle fiber development, negative regulation of DNA binding and signaling receptor activity, and endopeptidase inhibitor activity. Regarding Healthy vs. Treated 1 at D63, Treated 1 vs. Treated 2+ at D63, and the interaction of Severity and Time, four shared GO terms were identified; these terms were primarily related to haptoglobin and hemoglobin complex and binding. The number of overlapping GO terms between all edgeR/glmmSeq comparisons is found in Figure 7A. With respect to Healthy vs. Treated 2+ at Day 0 and Treated 1 vs. Treated 2+ at Day 0, 11 shared pathways were identified; these pathways were primarily related to bacterial infection, complement and coagulation cascades, and arachidonic acid metabolism. Regarding Healthy vs. Treated 1 at Day 63 and Treated 1 vs. Treated 2+ at Day 63, 10 shared pathways were identified; these pathways were primarily related to heme scavenging, erythrocyte exchange of O2/CO2, autophagy, and binding/uptake of ligands by scavenger receptors. Lastly, Healthy vs. Treated 2+ at Day 0, Treated 1 vs. Treated 2+ at Day 0, and the interaction of Severity and Time groups resulted in three shared pathways: the synthesis of leukotrienes and eoxins, biosynthesis of specialized pro-resolving mediators, and intestinal immune network for IgA production. The number of overlapping pathways between all edgeR/glmmSeq comparisons is found in Figure 7B.
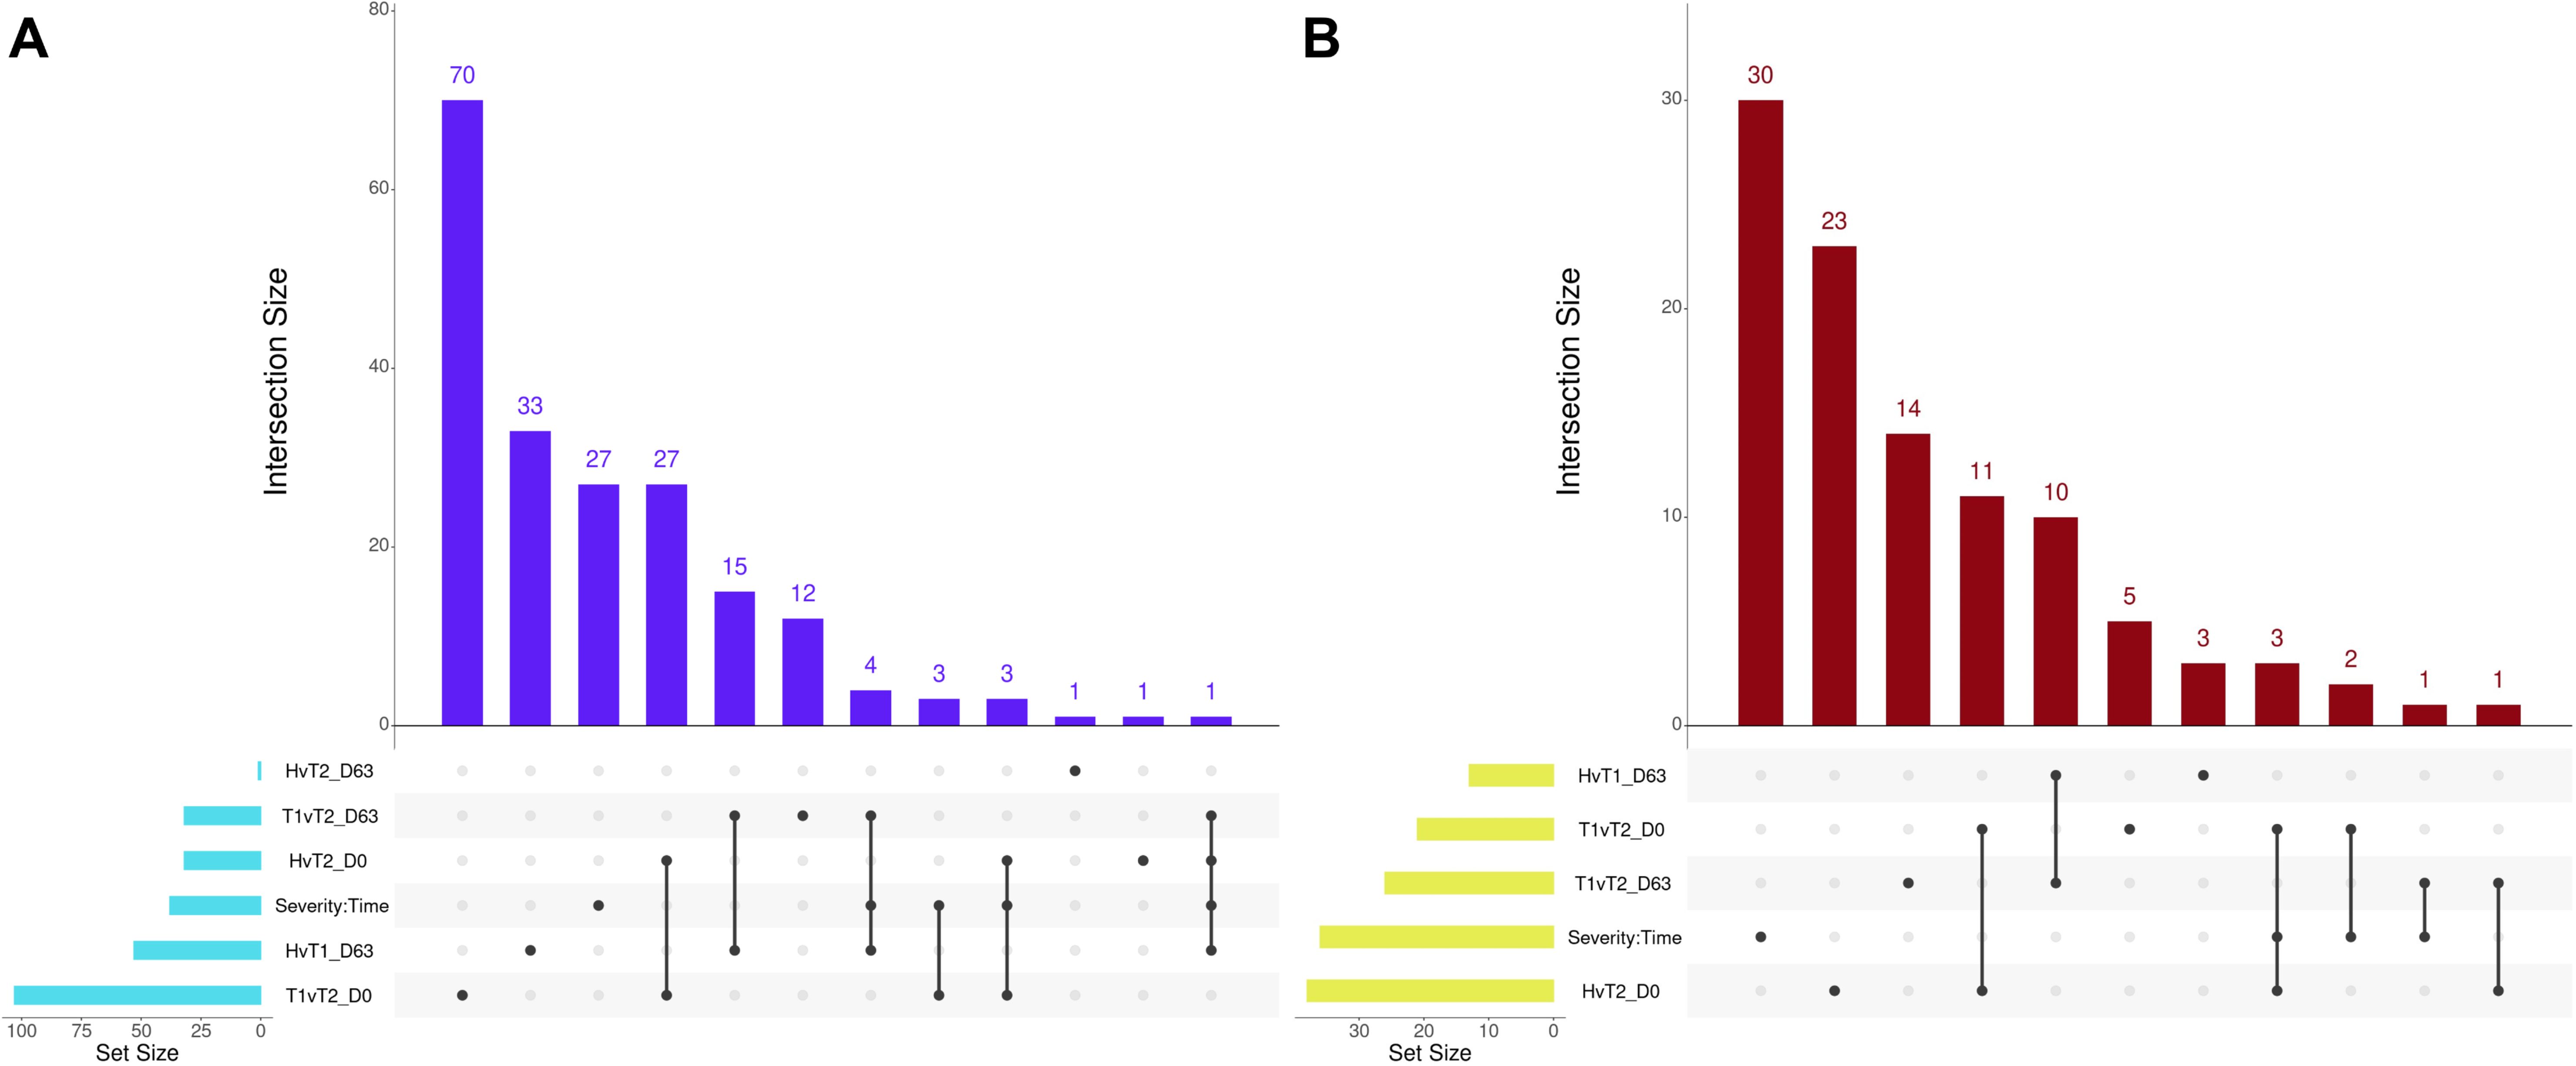
Figure 7. Matrix intersections of enriched Gene Ontology (GO) terms (A) and pathways (B) identified from differentially expressed genes following pairwise edgeR/glmmSeq analyses. Set size represents the number of enrichments identified between pairwise analyses, and columns represent the number of enrichments (intersection size) corresponding to one or more intersecting sets of analysis (row). Healthy cattle are indicated by “H”, Treated 1 cattle by “T1”, and Treated 2+ cattle by “T2”. Each day of sampling is indicated by “D0”, “D28”, or “D63”.
A total of 377 GO terms and 57 pathways were identified from dynamically expressed genes discovered through EBSeq-HMM analyses (Table 4; Supplementary Table S6). Regarding Up-Down gene expression directionality, three GO terms were enriched for Healthy cattle (sex differentiation, development of primary sexual characteristics, and extracellular region), two GO terms were enriched for Treated 1 cattle (regulation of type I interferon production and type I interferon production), and no GO terms were enriched for Treated 2+ cattle. The Up-Up gene expression directionality only demonstrated significant enrichment terms (3) for Treated 2+ cattle: apelin receptor binding, positive regulation of G protein-coupled receptor internalization, and gastrulation. The Down-Down gene expression directionality yielded the greatest number of total functional enrichments across all three disease groups; this is due, in part, to the high number of genes identified in this directionality when compared to the other three (Table 2). Moreover, the greatest amount of overlapping enrichments, based on term identification (“term_id”), were found between the three disease groups through the Down-Down gene expression directionality (Figure 8). Regarding these overlapping findings, all three treatment groups demonstrated enrichment for GO terms and pathways related to ABC-type transporter activity, ATP hydrolysis and ATP-dependent activity, peptide antigen binding, MHC class II protein complex binding, acid anhydride-acting hydrolase activity, immune and scavenger receptor activity, innate immune response and regulation, cytokine production, defense response to viruses and xenobiotics, cell killing, response to type I interferons, and activation of RAC1 downstream of NMDA receptors.
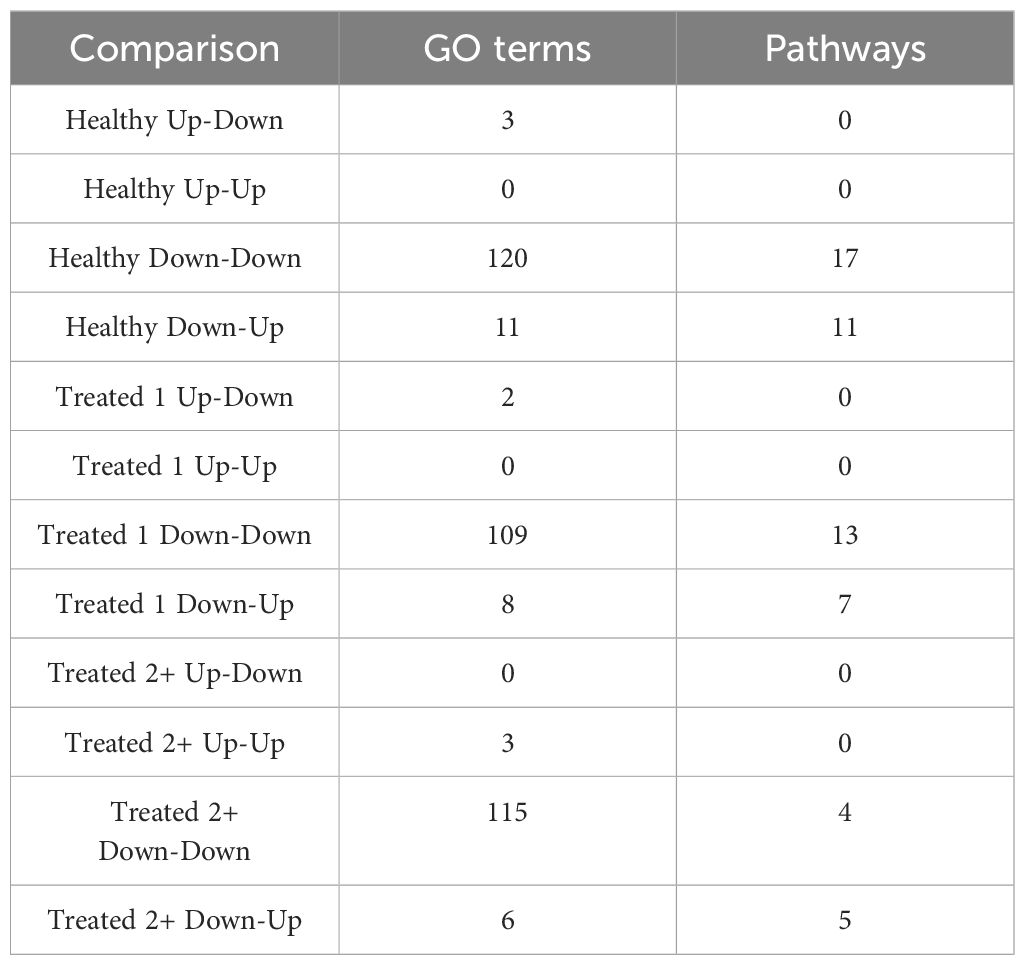
Table 4. Total number of enriched Gene Ontology (GO) terms and Reactome, KEGG, and WikiPathways pathways identified through dynamically expressed genes discovered in each EBSeq-HMM analysis via g:Profiler.
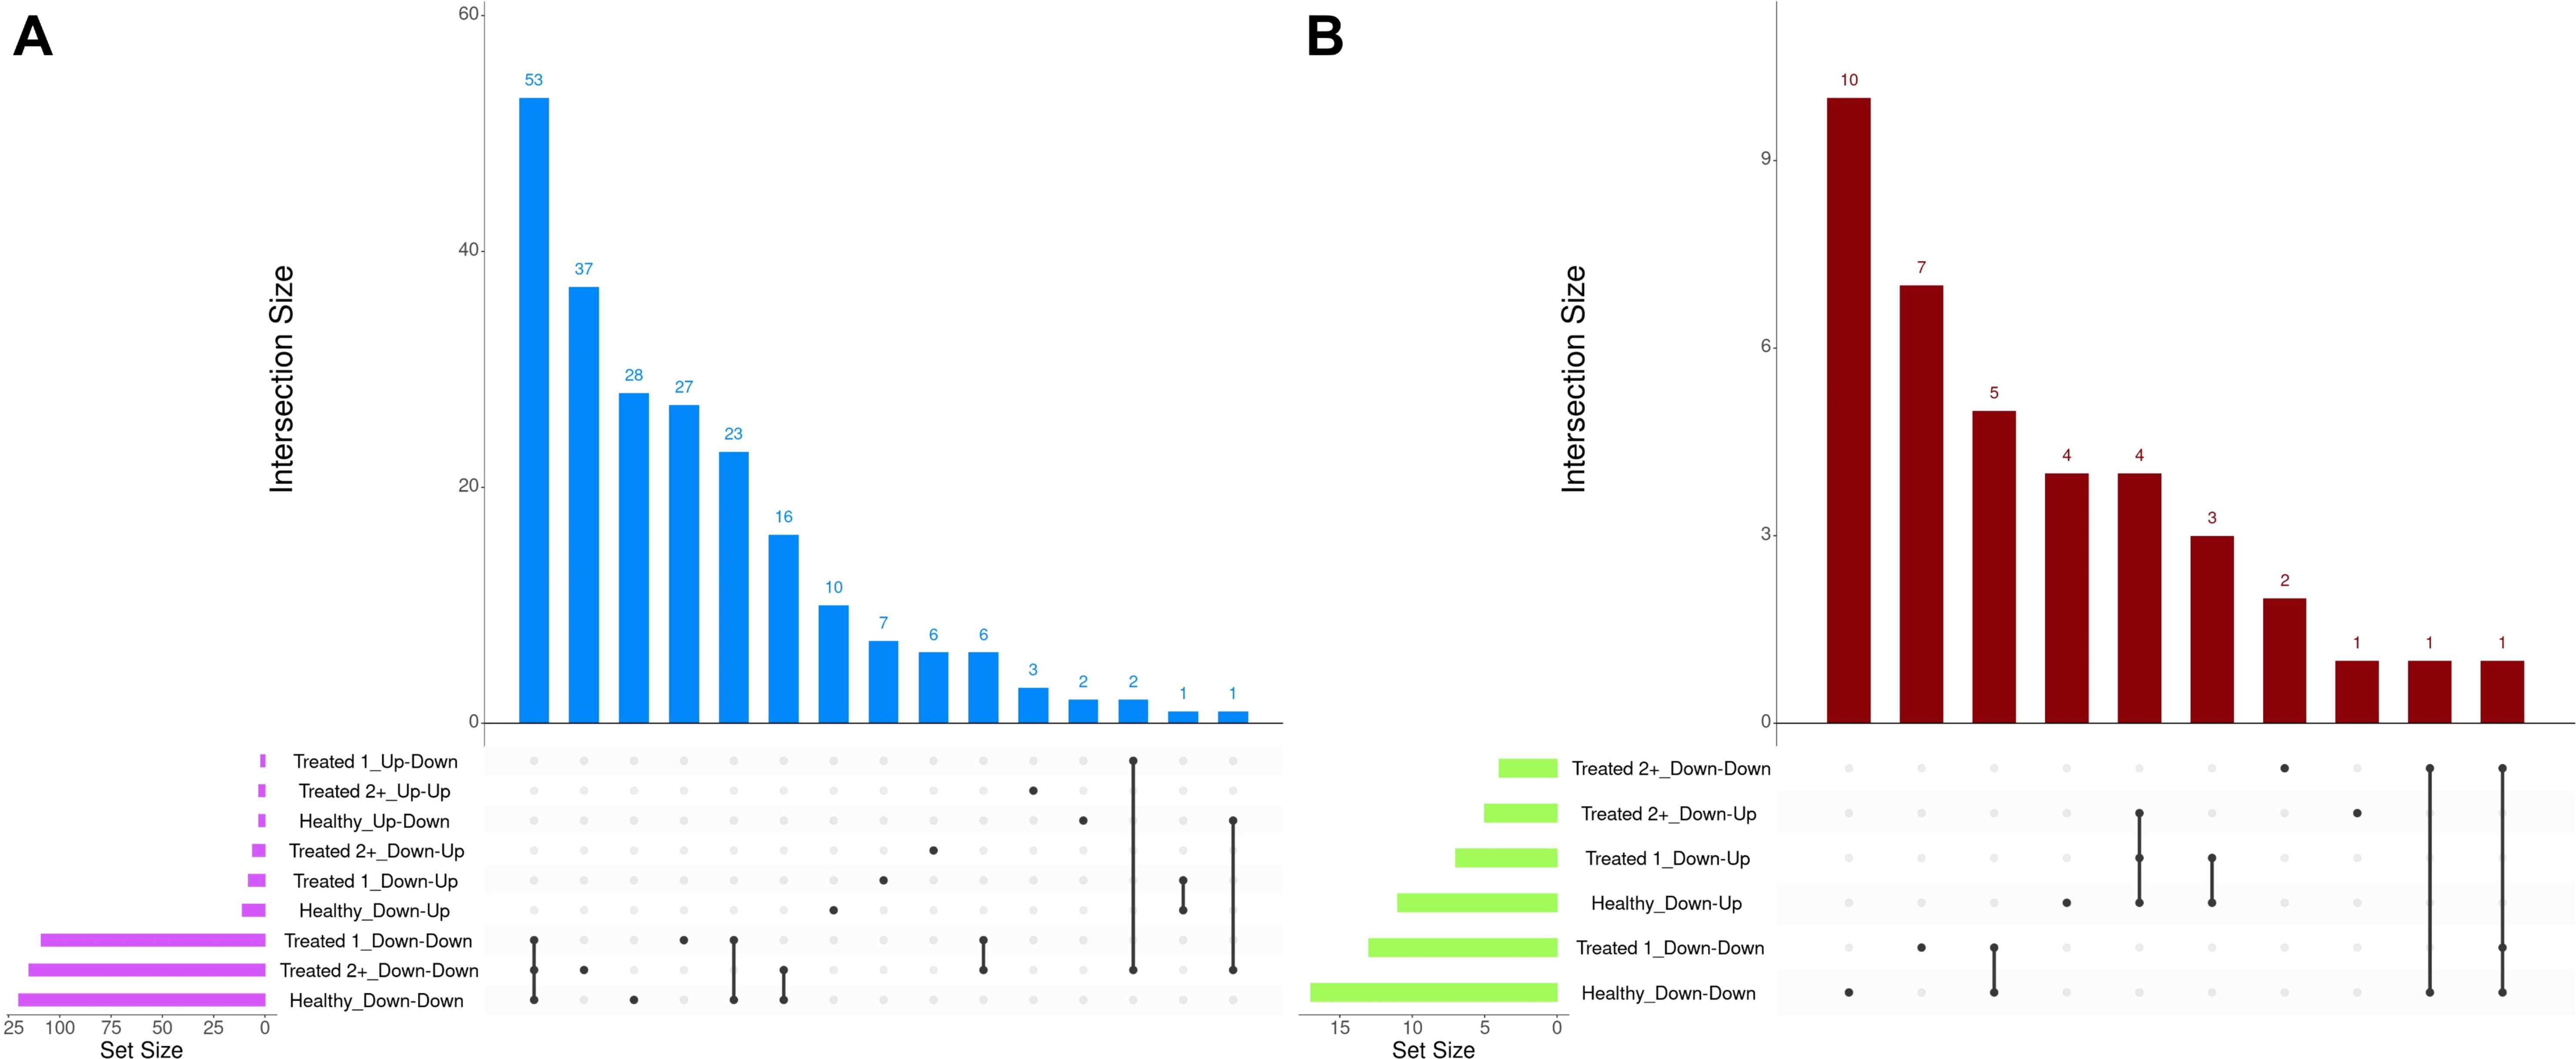
Figure 8. Matrix intersections of enriched Gene Ontology (GO) terms (A) and pathways (B) identified from dynamically expressed genes following EBSeq-HMM analyses. Set size represents the number of enrichments identified between dynamic expression trends, and columns represent the number of enrichments (intersection size) corresponding to one or more intersecting sets of analysis (row).
Down-Down enrichments unique to Healthy cattle included glycosaminoglycan binding, heparin-binding, sulfur compound binding, collagen fibril organization, adaptive immunity, regulation of multicellular organismal processes, extracellular structure organization, positive regulation of cytokine production, branched-chain amino acid catabolism, translocation of ZAP-70 to immunological synapse, PD-1 signal transduction, and the phosphorylation of CD3/T-cell receptor zeta chains. Specific to Treated 1 cattle, the Down-Down gene expression directionality enrichments included extracellular matrix structural constituent 5′-3′ DNA exonuclease activity, platelet-derived growth factor binding, ion and small molecule binding, Ca-dependent cysteine-type endopeptidase activity, cytoplasmic pattern recognition receptor signaling, myeloid leukocyte-mediated immunity, degradation of the extracellular matrix, integrin cell surface interactions, and collagen biosynthesis and modifying enzymes. Specific to Treated 2+ cattle, the Down-Down gene expression directionality enrichments included lipid transporter activity, positive regulation of leukocyte-mediated cytotoxicity, lymphocyte-mediated immunity, adaptive immune response based on somatic recombination of immune receptors built from immunoglobulin superfamily domains, and calmodulin-dependent protein kinase (CaMK)-mediated phosphorylation of cAMP-response element binding protein (CREB).
Evaluation of enrichments from the Down-Up gene expression directionality resulted in the greatest proportion of overlapping pathways across all three treatment groups. Specifically, all three groups shared Down-Up trends related to the biosynthesis of specialized pro-resolving mediators (resolvins, protectins, and lipoxins), driven by the genes ALOX5, ALOX15, HPGD, and GPX4 (Supplementary Table S6). GO terms unique to the three groups were related to platelet formation and regulation of the mitotic cell cycle in Healthy cattle, carbohydrate phosphatase activity, oxidoreductase activity, Ras protein signal transduction, and biomineral tissue development in Treated 1 cattle, and ferroptosis, negative regulation of wound healing, and regulation of cell morphogenesis in Treated 2+ cattle.
4 Discussion
This study was performed as an extension of our previous work, which focused on capturing at-arrival (D0) candidate biomarkers that may predict clinical BRD within the first 28 days after arrival to a growing operation (19, 20, 58, 59). From those studies, we established that genomic mechanisms related to specialized pro-resolving mediator production, type I interferon production and signaling, antiviral defense, alternative complement activation, alpha-beta T-cell complexes, Th2-type immune signaling, and antimicrobial peptide production were associated with later undifferentiated BRD outcomes, both in terms of visually identifiable clinical disease and mortality events. Other studies focusing on molecular approaches to measuring functional host response in association with BRD development and severity have been performed, identifying differentially expressed genes and functional mechanisms related to glucose and heavy metal metabolism, type I interferon production and response, cathelicidins and antimicrobial peptide production, lipoxygenase and serine-type peptidase activity, T-cell differentiation, and immune and inflammatory regulation (18, 22–24, 60–65). Collectively, these findings establish and corroborate several key immune and metabolic host mechanisms as clinically important prognostic indicators of BRD outcomes, which warrants focused research to determine whether the detection and quantification of any of these mechanisms can predict and be used to change BRD outcomes. The findings generated by these studies are highly relevant to current research, as there are no currently recommended biomarkers for predicting or prognosing BRD in commercial cattle production settings (66). Moreover, these studies demonstrate the complexity of undifferentiated BRD and highlight a need for combinational approaches and detection methods (66–69). While our work described here helps corroborate work performed by our group and others regarding potential at-arrival (D0) biomarkers for indicating future BRD development, one understudied element from those studies is evaluating physiological and immunological changes following disease resolution. Ultimately, genomic and diagnostic information related to disease resolution may help improve marketing and management practices, leading to better health for cattle moving into future phases of production, such as feedlot operations.
Importantly, Sun and colleagues in 2020 were one of the first research teams to perform whole blood transcriptome profiling of commercial beef cattle with and without visually observed BRD over multiple time points (18). This study is similar in scope and approach to their work but differs by (1) incorporating previously published data while simultaneously reassessing the at-arrival transcriptomes of cattle not previously sequenced but within the same populations and (2) longitudinally assesses the transcriptomes of cattle after BRD incidence has occurred. Our goals of this study were to further identify and/or corroborate gene expression and enriched mechanisms that indicate BRD development and severity as indicated by treatment frequency and to better understand the impact of BRD development on the host immune system as measured through the blood transcriptome.
While informative, several limitations and opportunities for future research endeavors are apparent from this study. First, the specific pathophysiology of the BRD cases illustrated in this study remains unknown, as none of these cattle underwent antemortem microbial isolation, transthoracic ultrasonography, or metagenomic sequencing of the respiratory tract. As such, the specific nature of the disease remains unclear. However, this is not unusual in commercial operations, as the diagnosis of clinical BRD remains predominantly dependent upon the detection of associated visual signs (65, 70–72). While emerging technologies and combinational approaches for early BRD detection are more routinely being tested and utilized, there is still no biomedical gold standard test for evaluating lung inflammation or pathology, and most novel risk factor associations and promising diagnostic strategies have not been validated prospectively in large-scale populations of cattle (73–77). Likewise, recent research underlines the polymicrobial and multifaceted nature of BRD acquisition, illustrating the lack of causal understanding despite decades of research (69, 78, 79). Collectively, this indicates that BRD is not a “one-size-fits-all” disease process; thus, the disease process and causal nature are most likely different from population to population, and prognostic and diagnostic efforts require a combinational approach. Second, our study utilized two independent populations of cattle. This element of the study serves as both a strength and limitation, as cross-populational studies will likely introduce variation more consistent with commercial cattle operations. However, the second and final sampling time points were different for each year. While studies have demonstrated that in vivo host gene expression in cattle is highly influenced by time, physiological development, and their associated microflora, it is still unclear how much variation is seen day-by-day (80–84). Lastly, while this study did not administer antimicrobials to cattle upon arrival (i.e., metaphylaxis), our recent work illustrates how antimicrobials greatly influence host gene expression days and weeks after administration (85). We observed no differential gene expression patterns at Day 28 between the treatment cohorts in this study but were unable to block the antimicrobial treatment effect; the lack of differential expression may be confounded, in part, by the effects of the antimicrobials used in clinical treatment.
4.1 At-arrival gene expression is useful in determining the risk of BRD
While relatively anticipated, we identified 40 at-arrival DEGs associated with BRD development within the first 28 days on-feed. First, we were only able to identify four DEGs between Healthy and Treated 1 cattle at arrival: GSE1 (Gse1 coiled-coil protein; comparatively increased in Healthy), LOC112446699 (uncharacterized; discontinued the recent update to the Bos taurus reference genome assembly), LOC112446744 (endogenous retrovirus group K member 25 Env polyprotein-like; discontinued the recent update to the Bos taurus reference genome assembly), and LOC112447761 (protein phosphatase 1B-like pseudogene). Ultimately, these genes had no discernible functional enrichment pattern and had not been reported in previous literature focusing on respiratory disease. Similar to our previous work, discernible differences in at-arrival gene expression patterns between Healthy and Treated 1 cattle were somewhat unclear (20, 21). Importantly, BRD diagnosis in this study was made based on visual perception of clinical disease, within semi-objective criteria. However, it is well understood that visual signs associated with BRD are relatively insensitive and nonspecific, limiting the confidence in claiming that both subclinical diseases did not exist in Healthy individuals and that Treated 1 cattle truly possessed lung pathology (11, 72, 85). The exact pathophysiology associated with Treated 1 cattle remains unclear; future research in an effort to better understand lung inflammation and physiological changes in Treated 1 cattle is highly warranted. Nevertheless, previous research suggests that, when observed retrospectively, increased treatment frequencies appear to indicate an increase in confidence for observing a lung pathology event, despite the potential for inconsistent observer agreement (7, 8, 86–88).
When evaluating Treated 2+ cattle, 13 and 23 at-arrival DEGs were identified when compared to Healthy and Treated 1 cattle, respectively. Regarding these findings, nine DEGs were identified between the two analyses and were unique to Day 0: ALOX15, BOLA-DQA2, CFB, LCN8, LOC100337053 (ATP-binding cassette subfamily C member 4), LOC112441633 (uncharacterized ncRNA), LOC112445170 (mortality factor 4-like protein 1 pseudogene), LOC509854 (ATP-binding cassette subfamily C member 4-like), and PPP2R3A. Moreover, 27 and 11 enriched GO terms and pathways were shared between the two comparisons, which were related to arachidonic acid/fatty acid metabolism and biosynthesis, MHC class II protein complex, apoptotic cell clearance and antigen presentation, complement activation, inflammatory regulation and positive regulation of the extracellular signal-regulated kinase (ERK) cascade, and wound healing. ALOX15, BOLA-class genes, CFB, LCN-genes, and PPP2R3A have been identified, with analogous gene expression trends, in previous research related to BRD development in commercial cattle; therefore, the products of these genes in particular warrant further evaluation to test their merit as biomarkers to predict severe BRD, or possibly, to diagnose active airway inflammation (18, 20–22, 89, 90).
ALOX15 was comparatively decreased in expression at arrival in Treated 2+ cattle when compared to both Healthy and Treated 1 cattle. It encodes for an arachidonic acid lipoxygenase involved in the oxygenation of polyunsaturated fatty acids (PUFAs) and is critical to the generation of PUFA metabolites, namely lipoxins, protectins, resolvins, and maresins, which maintain cellular homeostasis, induce macrophage subtype switching (M1 to M2), enhance the maturation of dendritic cells, and promote cellular clearance of apoptotic debris and self-antigens (91–95). Moreover, there is emerging research that suggests ALOX15 therapeutic activation and bioregulation are compelling targets for treating sepsis, airway pathology, and systemic inflammation in patients (96–105). While relatively understudied in cattle, previous research has demonstrated the expression and production of ALOX15 metabolites in polymorphonuclear cells, addressed the balance of leukotriene and lipoxin levels in relation to inflammatory signaling, and demonstrated, in vivo, the continuous increased expression over time in young cattle, suggesting its necessary role in immunological development (82, 83, 106–108).
BOLA-DQA2 was comparatively increased in expression at arrival in Treated 2+ cattle when compared to both Healthy and Treated 1 cattle and encodes for a class II major histocompatibility complex protein that is primarily involved in peptide loading for antigen presentation to CD4+ T cells (109, 110). Previous work has demonstrated that both the copy number, gene polymorphisms, and general heterozygosity of bovine leukocyte antigens (BoLA) are involved in bovine respiratory syncytial virus and bovine leukemia virus clearance, clinical mastitis, and vaccine response (111–118). It may be hypothesized that Treated 2+ cattle arrived with an underlying respiratory infection, hallmarked by the increase in BoLA production on D0, but the causal nature of the increased gene expression seen here remains unknown.
CFB, which was increased in expression at arrival in Treated 2+ cattle when compared to both Healthy and Treated 1 cattle, encodes for the single-chain glycoprotein Factor B, the initial molecule in the alternative pathway of complement (119, 120). Upon hydrolysis of C3 and cleavage by factor D, factor B forms a complex that acts upon the surface of xenobiotics and pathogens, opsonizing substances for phagocytosis, further amplifying complement production, and/or leading to the formation of a membrane attack complex, leading to cellular lysis of a target (119–123). Related to respiratory disease, factor B can be synthesized and secreted by alveolar type II pneumocytes, polymorphonuclear cells, and alveolar M1 macrophages and further induced by local or systemic IL-1, IL-6, TNF-α, and/or IFN-γ activity (124–127). Moreover, recent research suggests the overexpression of CFB may serve as a prognostic indicator of severe viral lung disease, such as that of SARS-CoV-2 infection or cardiovascular disease (128–132). Similar to BoLA production, increased CFB expression in Treated 2+ cattle on D0 may be due to disease at the time of arrival and a non-specific innate immune response to pathogenic infection.
LCN8 was comparatively increased in expression at arrival in Treated 2+ cattle when compared to both Healthy and Treated 1 cattle, and it encodes for a beta-sheet-rich member of the lipocalin protein family involved in a diverse array of extracellular transport functions (133, 134). Specifically, LCN8 has been primarily demonstrated as an important transporter protein for reproductive organ function in murine models (135–137). However, recent research suggests LCN8 may be involved in allergen-induced immunity and autoimmunity (138–141). Furthermore, while low amino acid sequence similarity exists between lipocalin subtypes, they have been shown to form inter-lipocalin protein complexes in mammalian species and may be evolutionarily constructed through gene duplication events; thus, we cannot rule out ancillary immune functionality in association with other lipocalin proteins (142–145).
PPP2R3A comparatively decreased in expression at arrival in Treated 2+ cattle when compared to both Healthy and Treated 1 cattle. This gene encodes for a regulatory subunit of phosphoprotein phosphatase 2 and is involved in the negative regulation of cellular development, metabolism, and signal transduction (146, 147). In several models, PPP2R3A has been demonstrated as a key regulator in cardiac and pulmonary function and cellular regeneration, and its impairment has been linked to degenerative inflammatory and oncogenic diseases of the pulmonary system (148–152).
4.2 BRD severity as measured by treatment frequency influences the bovine transcriptome after apparent disease resolution
When evaluating the host transcriptome after the apparent resolution of clinical BRD (D63), Treated 1 cattle exhibited increased gene expression for oxygen binding and carrier activity, the hemoglobin complex, iron ion binding, transforming growth factor beta (TGF-β) binding and skeletal muscle development, G-protein beta-subunit binding, and neutrophil degranulation activity when compared to Healthy and Treated 2+ cattle. The genes driving the functional enrichments for heme binding and oxygenation (HBB, HBQ1, and HBG) encode for various hemoglobin subunits. Interestingly, low or extreme levels of hemoglobin have been touted as a key predictor of worsening chronic obstructive pulmonary disease (COPD) in humans (153, 154). Likewise, recent research has described how hemoglobin subunits interact with or are expressed by epithelial and immunologically active cells and exhibit antimicrobial functionality (155–157). Furthermore, the genes driving neutrophilic activity and TGF-β binding/skeletal muscle development (WFIKKN1 and ARG1) have been shown to be activated and involved in COPD, pulmonary hypertension, and chronic airway inflammation (158–162). This may signify that underlying airway inflammation and/or infection was actually ongoing in the Treated 1 cattle, even in the absence of outward clinical signs of BRD. If true, this would support the insensitivity of recognizing BRD by visual signs alone and the need to monitor cattle over time using more advanced diagnostic modalities to gain a better understanding of BRD development and resolution. Future research investigating the upper and lower airways of cattle over time, through such modalities as transthoracic ultrasonography, intra-airway fluid cytology, and/or lung biopsy, may better our understanding of BRD pathophysiology.
The comparison of Treated 2+ cattle to Healthy cattle at D63 resulted in only one enriched GO term (natural killer cell-mediated cytotoxicity), despite the identification of 89 DEGs, including immune-related genes such as CATHL2, CCL25, CD177, LOC112444466 (SCART1), MCF2L, PRG3, and WC1-8. Notable, several of these genes have been indicated in previous research utilizing the host transcriptome to indicate or predict BRD, which may indicate prolonged gene expression throughout the feeding period, or perhaps ongoing subclinical disease (18, 20–22, 89, 90). While this single enriched GO term is both valid and informative, the lack of overlapping results from these immune-specific genes potentially conveys the need for further research invested in annotating functional enrichments with Bos taurus-specific gene expression datasets. Specifically, cattle are not widely accepted as a model organism in human-focused biomedical research, and functional enrichment terms of agricultural species are often inferred from experiments with model organisms (51–53, 163–167). The two genes driving the enrichment of natural killer cell-mediated cytotoxicity (LOC509956 [cathepsin G] and LOC100296778 [killer cell lectin-like receptor subfamily I member 1]), both increased in Treated 2+ cattle when compared to Healthy cattle, are indicated in inflammatory airway diseases such as allergen-induced asthma, COPD, and lung adenocarcinoma, and may serve as prognostic indicators (168–173). Currently, it is unclear if the activation of these genes is due to a prolonged infective state within the airways or if natural killer cell activity serves a protective role postinfection in these severely disease cattle (174). Furthermore, LCN8, previously discussed in the analysis of at-arrival transcriptomes, is again upregulated at D63 in Treated 2+ cattle when compared to Healthy cattle. The relationship between this lipocalin, immune system activity, and respiratory disease in cattle is currently unknown, but evidence suggests lipocalins possess immunomodulatory activity and may interact with natural killer cells and innate lymphoid cells in inflammatory responses (175–178).
When investigating the interaction of BRD severity as indicated by treatment frequency and time (Day: Severity in glmmSeq), we identified 286 DEGs, corresponding to 38 and 36 enriched GO terms and pathways, respectively. Here, the primary immunological findings pertain to the biosynthesis of pro-resolving mediators, the IL-3, IL-5, and GM-CSF signaling, IgA production, T-cell receptor signaling and costimulation, and ubiquitination and tyrosine kinase signal transduction of immune-mediated pathways. Further investigation of pairwise gene expression was performed with the genes driving these enrichments to better understand differences over time. First, genes driving the production of specialized pro-resolving mediators, namely ALOX15, were downregulated in Treated 2+ cattle at arrival when compared to both Healthy and Treated 1 cattle, but seemingly stabilized to an expressional level that possessed no difference to the Healthy and Treated 1 groups by Day 63. Orr and colleagues in 2015 demonstrated that gene expression related to specialized pro-resolving mediator production and leukotriene synthesis in patients hospitalized for traumatic injuries was significantly different whether patients demonstrated uncomplicated (< 5 days postpresentation) or complicated recoveries (≥ 14 days postpresentation, no recovery by 28 days postpresentation, or death) (179). Corresponding with our study, those investigators demonstrated that these genes were often upregulated within 12 h of traumatic injury presentation in patients that went on to have complicated recoveries, and the ratios of genes involved in lipoxin, resolving, and leukotriene production were the same between the two groups by 28 days posthospitalization (179). While both our work and the research conducted by Orr and colleagues failed to evaluate and capture the interactions of these lipid mediators themselves, these findings may indicate a collective return to homeostasis upon survival of traumatic disease that warrants more focused research (83, 179, 180).
Regarding cathelicidin production, we identified a decrease in CATHL1 expression at arrival in Treated 2+ cattle when compared to Treated 1 cattle; however, the expression of host antimicrobial peptides CATHL1 and CATHL3 was increased in Treated 2+ cattle at D63 when compared to Healthy cattle. Cathelicidins are a class of host-derived peptides involved in broad-spectrum antimicrobial activity and host defense during infectious disease (181, 182). Specifically, Bac1 and Bac7, the peptides encoded by CATHL1 and CATHL3, respectively, are primarily involved in extracellular bacterial killing and may be cytotoxic at high concentrations (181–184). While research has focused on the antimicrobial killing component of these peptides when cattle are faced with pathogenic challenges, the increased expression of these genes after peak incidence of BRD presentation within a population may be indicative of ongoing infectious lung pathology in more severe cases. Lastly, CD40LG, CD28, CD5, and CRK, all of which were non-differentially expressed between the three severity groups at arrival but downregulated in Treated 2+ cattle at D63 when compared to Healthy and Treated 1 cattle, encode for critical adaptor proteins and receptors that promote T-cell stimulation and activation (185–189). Coupled with cathelicidin and natural killer cell-mediated cytotoxicity gene expression findings on D63, this suggests that cattle having survived a severe course of BRD (Treated 2+) display a more innate immune-driven response following BRD resolution, perhaps indicating dysregulated immunity over time.
4.3 Commercial beef cattle share dynamic patterns of gene expression regardless of BRD development
Through the evaluation of dynamic gene expression trends via Bayesian inferential methodology (EBSeq-HMM), we identified numerous genes and associated enrichments with respect to the four selected directionalities (Up-Down, Up-Up, Down-Down, Down-Up) within each of the three severity groups, independently. Regarding Up-Down directionality, genes found in Healthy cattle did not correspond to apparent immunological function (sex differentiation, development of primary sexual characteristics) and may represent the normal physiology of young, developing male cattle. Up-Down genes identified in Treated 1 cattle corresponded to type I interferon production and regulation. Importantly, we did not identify differential expression of type I interferon-related genes at arrival or any posttreatment time point between the three BRD severity groups. This demonstrates the variability of undifferentiated BRD, as numerous other studies have demonstrated the impact of viral agents and the predictive nature of host antiviral signaling on outcomes associated with BRD (18, 22, 24, 58, 61, 64, 190, 191). Alternatively, differences between the three severity groups regarding transient viral infectivity may have been missed due to the relatively small number of sampling time points. While it is expected that a virulent viral challenge elicits a type I interferon-related response, it is unclear how long this type of immune response persists postexposure. Lastly, regarding Treated 2+ cattle, we failed to identify any genes corresponding with Up-Down directionality in this study. Concerning the Up-Up directionality, the Treated 2+ group was the only group to possess significant genes and enrichments; these enrichments corresponded with apelin receptor binding, the regulation of G protein-coupled receptor internalization, and gastrulation. It is unclear if these enrichments are incidental due to model species annotations, but these genes may be involved in influencing pulmonary inflammatory processes (192–195). In potential future studies, additionally, sampling time points may better indicate these gene expression patterns or those that may have been missed by this study.
The Down-Down directionality netted the greatest number of genes and enrichments across the four expressional directions. While several unique enrichments were identified from GO and pathway terms in each of the three severity groups, the overarching theme and genes driving these enrichments were highly similar and indicative of immunological function and signaling. For example, genes from Healthy cattle concerning the immune system involved heparin binding, collagen fibril organization, the adaptive immune response and positive regulation of cytokine production, PD-1 signal transduction, and the phosphorylation of CD3/T-cell receptor zeta chains; Treated 1 cattle enrichments included platelet-derived growth factor binding, cytoplasmic pattern recognition receptor signaling, myeloid leukocyte mediated immunity, and integrin cell surface interactions; Treated 2+ cattle enrichments included positive regulation of leukocyte mediated cytotoxicity, lymphocyte-mediated immunity, and adaptive immune response based on somatic recombination of immune receptors built from immunoglobulin superfamily domains. Several of the genes driving these “unique” immune-related enrichments (ARG1, BOLA-DQA2, CD5L, CD36, CD177, CFB, C1R, HBB, HBQ1, IL1R1, IL16, LOC100296778 (KLRI1), MEIS3, MIA, MYO18A, NUMB, and PRG3) were also identified as DEGs at D0 and D63 by edgeR QLF testing. Moreover, all three treatment groups demonstrated shared immunological enrichments related to ABC-type transporter activity, peptide antigen binding, MHC class II protein complex binding, immune and scavenger receptor activity, innate immune response and regulation, cytokine production, defense response to viruses and xenobiotics, cell killing, response to type I interferons, and activation of RAC1 downstream of NMDA receptors. This seemingly indicates a collective gradual decrease in immunological activity across the three severity groups following physiological pressure originating from commercial sale, transportation to the research unit, and novel penmate comingling.
Lastly, we evaluated the enrichments stemming from Down-Up gene expression directionality across the three severity groups. Here, we identified the greatest number of overlapping enrichments with respect to the total number identified. Genes involved in the synthesis of specialized pro-resolving mediators, specifically ALOX5, ALOX15, HPGD, and GPX4, were seen to decrease and then increase over time, regardless of BRD severity. Collectively, the results from evaluating dynamic gene expression trends appear to indicate that the magnitude of gene expression, not the directionality, is most indicative of BRD development and severity.
Data availability statement
The data presented in the study are deposited in the National Center for Biotechnology Information Gene Expression Omnibus (NCBI-GEO), accession number GSE194167. Previously generated data utilized by this study are found in the NCBI-GEO, under accession numbers GSE136176 and GSE161396. R code for statistical analyses of raw gene count data are found at https://github.com/mscott16/2023-Longitudinal-BRD.
Ethics statement
The animal study was approved by Mississippi State University Animal Care and Use Committee (IACUC protocols #15–003 and #17-120). The study was conducted in accordance with the local legislation and institutional requirements.
Author contributions
MS: Writing – review & editing, Writing – original draft, Visualization, Validation, Supervision, Software, Resources, Project administration, Methodology, Investigation, Funding acquisition, Formal analysis, Data curation, Conceptualization. RV-C: Writing – review & editing, Writing – original draft, Visualization, Validation, Methodology, Investigation, Formal analysis. AT: Writing – review & editing, Writing – original draft, Validation, Methodology, Investigation, Formal analysis. AW: Writing – review & editing, Supervision, Resources, Project administration, Methodology, Investigation, Funding acquisition, Conceptualization. BK: Writing – review & editing, Supervision, Resources, Project administration, Methodology, Investigation, Funding acquisition, Conceptualization.
Funding
The author(s) declare financial support was received for the research, authorship, and/or publication of this article. This research was supported in part by the US Department of Agriculture, National Institute of Food and Agriculture, Diseases of Agricultural Animals Program (Grant No. 2020-67016-31469). Additionally, this research was internally supported by the Department of Large Animal Clinical Sciences at Texas A&M University College of Veterinary Medicine and Biomedical Sciences, the Department of Pathobiology and Population Medicine at Mississippi State University College of Veterinary Medicine, and the Department of Animal and Dairy Sciences at Mississippi State University. The findings and conclusions in this work have not been formally disseminated by the US Department of Agriculture and should not be construed to represent any agency determination or policy.
Acknowledgments
The authors thank Merrilee Thoresen and the students and staff of the Mississippi Agricultural and Forestry Experiment Station (MAFES), Mississippi State University Animal and Dairy Science Department, and Mississippi State University College of Veterinary Medicine for their assistance in animal care and handling, sample collection, and logistical support. The authors additionally thank Dana Burk, Andrew Hillhouse, Rachel Huff, Cory Wolfe, and the students and staff of the Texas A&M Institute for Genome Sciences & Society (TIGSS) for their technical support regarding sample handling, sequencing, and data acquisition. Lastly, the authors thank Cyprianna Swiderski for her invaluable discussion regarding data analysis and interpretation.
Conflict of interest
The authors declare that the research was conducted in the absence of any commercial or financial relationships that could be construed as a potential conflict of interest.
Publisher’s note
All claims expressed in this article are solely those of the authors and do not necessarily represent those of their affiliated organizations, or those of the publisher, the editors and the reviewers. Any product that may be evaluated in this article, or claim that may be made by its manufacturer, is not guaranteed or endorsed by the publisher.
Supplementary material
The Supplementary Material for this article can be found online at: https://www.frontiersin.org/articles/10.3389/fimmu.2024.1412766/full#supplementary-material
References
1. Dargatz DA, Lombard JE. Summary of BRD data from the 2011 NAHMS feedlot and dairy heifer studies. Anim Health Res Rev. (2014) 15:123–5. doi: 10.1017/S1466252314000127
2. Rojas HA, White BJ, Amrine DE, Larson RL. Predicting bovine respiratory disease risk in feedlot cattle in the first 45 days post arrival. Pathogens. (2022) 11:442. doi: 10.3390/pathogens11040442
3. Griffin D. Economic impact associated with respiratory disease in beef cattle. Veterinary Clinics North America: Food Anim Pract. (1997) 13:367–77. doi: 10.1016/S0749-0720(15)30302-9
4. Brooks KR, Raper KC, Ward CE, Holland BP, Krehbiel CR, Step DL. Economic effects of bovine respiratory disease on feedlot cattle during backgrounding and finishing phases. Prof Anim Scientist. (2011) 27:195–203. doi: 10.15232/S1080-7446(15)30474-5
5. Avra TD, Abell KM, Shane DD, Theurer ME, Larson RL, White BJ. A retrospective analysis of risk factors associated with bovine respiratory disease treatment failure in feedlot cattle1. J Anim Sci. (2017) 95:1521–7. doi: 10.2527/jas.2016.1254
6. Blakebrough-Hall C, McMeniman JP, González LA. An evaluation of the economic effects of bovine respiratory disease on animal performance, carcass traits, and economic outcomes in feedlot cattle defined using four BRD diagnosis methods. J Anim Sci. (2020) 98:skaa005. doi: 10.1093/jas/skaa005
7. Cernicchiaro N, White BJ, Renter DG, Babcock AH. Evaluation of economic and performance outcomes associated with the number of treatments after an initial diagnosis of bovine respiratory disease in commercial feeder cattle. ajvr. (2013) 74:300–9. doi: 10.2460/ajvr.74.2.300
8. Schneider MJ, Tait RG, Busby WD, Reecy JM. An evaluation of bovine respiratory disease complex in feedlot cattle: Impact on performance and carcass traits using treatment records and lung lesion scores1,2. J Anim Sci. (2009) 87:1821–7. doi: 10.2527/jas.2008-1283
9. Smith KJ, Amrine DE, Larson RL, Theurer ME, Szaz JI, Bryant T, et al. Risk factors for mid- and late-feeding-stage bovine respiratory morbidity and mortality based on individual animal treatments of beef feedlot cattle. Appl Anim Sci. (2022) 38:360–72. doi: 10.15232/aas.2022-02311
10. Grissett GP, White BJ, Larson RL. Structured literature review of responses of cattle to viral and bacterial pathogens causing bovine respiratory disease complex. Veterinary Internal Medicne. (2015) 29:770–80. doi: 10.1111/jvim.12597
11. Timsit E, Dendukuri N, Schiller I, Buczinski S. Diagnostic accuracy of clinical illness for bovine respiratory disease (BRD) diagnosis in beef cattle placed in feedlots: A systematic literature review and hierarchical Bayesian latent-class meta-analysis. Prev Veterinary Med. (2016) 135:67–73. doi: 10.1016/j.prevetmed.2016.11.006
12. White BJ, Renter DG. Bayesian estimation of the performance of using clinical observations and harvest lung lesions for diagnosing bovine respiratory disease in post-weaned beef calves. J Vet Diagn Invest. (2009) 21:446–53. doi: 10.1177/104063870902100405
13. Bortoluzzi EM, White BJ, Schmidt PH, Mancke MR, Brown RE, Jensen M, et al. Epidemiological factors associated with gross diagnosis of pulmonary pathology in feedyard mortalities. Veterinary Sci. (2023) 10:522. doi: 10.3390/vetsci10080522
14. Schmidt PH, White BJ, Finley A, Bortoluzzi EM, Depenbusch BE, Mancke M, et al. Determining frequency of common pulmonary gross and histopathological findings in feedyard fatalities. Veterinary Sci. (2023) 10:228. doi: 10.3390/vetsci10030228
15. Babcock AH, White BJ, Dritz SS, Thomson DU, Renter DG. Feedlot health and performance effects associated with the timing of respiratory disease treatment1. J Anim Sci. (2009) 87:314–27. doi: 10.2527/jas.2008-1201
16. Cummings DB, Groves JT, Turner BL. Assessing the role of systems thinking for stocker cattle operations. Veterinary Sci. (2023) 10:69. doi: 10.3390/vetsci10020069
17. Mijares S, Edwards-Callaway L, Roman-Muniz IN, Coetzee JF, Applegate TJ, Cramer MC. Veterinarians’ perspectives of pain, treatment, and diagnostics for bovine respiratory disease in preweaned dairy calves. Front Pain Res. (2023) 4:1076100. doi: 10.3389/fpain.2023.1076100
18. Sun H-Z, Srithayakumar V, Jiminez J, Jin W, Hosseini A, Raszek M, et al. Longitudinal blood transcriptomic analysis to identify molecular regulatory patterns of bovine respiratory disease in beef cattle. Genomics. (2020) 112:3968–77. doi: 10.1016/j.ygeno.2020.07.014
19. Scott MA, Woolums AR, Swiderski CE, Perkins AD, Nanduri B, Smith DR, et al. Whole blood transcriptomic analysis of beef cattle at arrival identifies potential predictive molecules and mechanisms that indicate animals that naturally resist bovine respiratory disease. PloS One. (2020) 15:e0227507. doi: 10.1371/journal.pone.0227507
20. Scott MA, Woolums AR, Swiderski CE, Perkins AD, Nanduri B, Smith DR, et al. Multipopulational transcriptome analysis of post-weaned beef cattle at arrival further validates candidate biomarkers for predicting clinical bovine respiratory disease. Sci Rep. (2021) 11:23877. doi: 10.1038/s41598-021-03355-z
21. Scott MA, Woolums AR, Swiderski CE, Thompson AC, Perkins AD, Nanduri B, et al. Use of nCounter mRNA profiling to identify at-arrival gene expression patterns for predicting bovine respiratory disease in beef cattle. BMC Vet Res. (2022) 18:77. doi: 10.1186/s12917-022-03178-8
22. Jiminez J, Timsit E, Orsel K, van der Meer F, Guan LL, Plastow G. Whole-blood transcriptome analysis of feedlot cattle with and without bovine respiratory disease. Front Genet. (2021) 12:627623. doi: 10.3389/fgene.2021.627623
23. Cao H, Fang C, Wang Q, Liu L-L, Liu W-J. Transcript characteristics on the susceptibility difference of bovine respiratory disease. Int J Genomics. (2023) 2023:1–12. doi: 10.1155/2023/9934684
24. Hasankhani A, Bahrami A, Sheybani N, Fatehi F, Abadeh R, Ghaem Maghami Farahani H, et al. Integrated network analysis to identify key modules and potential hub genes involved in bovine respiratory disease: A systems biology approach. Front Genet. (2021) 12:753839. doi: 10.3389/fgene.2021.753839
25. Percie Du Sert N, Hurst V, Ahluwalia A, Alam S, Avey MT, Baker M, et al. The ARRIVE guidelines 2.0: Updated guidelines for reporting animal research*. J Cereb Blood Flow Metab. (2020) 40:1769–77. doi: 10.1177/0271678X20943823
26. Griffin CM, Scott JA, Karisch BB, Woolums AR, Blanton JR, Kaplan RM, et al. A randomized controlled trial to test the effect of on-arrival vaccination and deworming on stocker cattle health and growth performance. Bov Pract (Stillwater). (2018) 52:26–33. doi: 10.21423/bovine-vol52no1p26-33
27. Wagner RT, Karisch BB, Blanton JR, Woolums A, Smith DR, Kaplan R. 95 assessment of on-arrival vaccination and deworming on stocker cattle health and growth performance. J Anim Sci. (2018) 96:55–6. doi: 10.1093/jas/sky027.104
28. Holland BP, Step DL, Burciaga-Robles LO, Fulton RW, Confer AW, Rose TK, et al. Effectiveness of sorting calves with high risk of developing bovine respiratory disease on the basis of serum haptoglobin concentration at the time of arrival at a feedlot. ajvr. (2011) 72:1349–60. doi: 10.2460/ajvr.72.10.1349
29. Woolums AR, Karisch BB, Frye JG, Epperson W, Smith DR, Blanton J, et al. Multidrug resistant Mannheimia haemolytica isolated from high-risk beef stocker cattle after antimicrobial metaphylaxis and treatment for bovine respiratory disease. Veterinary Microbiol. (2018) 221:143–52. doi: 10.1016/j.vetmic.2018.06.005
30. Zhao S, Li C-I, Guo Y, Sheng Q, Shyr Y. RnaSeqSampleSize: real data based sample size estimation for RNA sequencing. BMC Bioinf. (2018) 19:191. doi: 10.1186/s12859-018-2191-5
31. Ewels P, Magnusson M, Lundin S, Käller M. MultiQC: summarize analysis results for multiple tools and samples in a single report. Bioinformatics. (2016) 32:3047–8. doi: 10.1093/bioinformatics/btw354
32. Bolger AM, Lohse M, Usadel B. Trimmomatic: a flexible trimmer for Illumina sequence data. Bioinformatics. (2014) 30:2114–20. doi: 10.1093/bioinformatics/btu170
33. Kim D, Paggi JM, Park C, Bennett C, Salzberg SL. Graph-based genome alignment and genotyping with HISAT2 and HISAT-genotype. Nat Biotechnol. (2019) 37:907–15. doi: 10.1038/s41587-019-0201-4
34. Danecek P, Bonfield JK, Liddle J, Marshall J, Ohan V, Pollard MO, et al. Twelve years of SAMtools and BCFtools. GigaScience. (2021) 10:giab008. doi: 10.1093/gigascience/giab008
35. Pertea M, Pertea GM, Antonescu CM, Chang T-C, Mendell JT, Salzberg SL. StringTie enables improved reconstruction of a transcriptome from RNA-seq reads. Nat Biotechnol. (2015) 33:290–5. doi: 10.1038/nbt.3122
36. Kovaka S, Zimin AV, Pertea GM, Razaghi R, Salzberg SL, Pertea M. Transcriptome assembly from long-read RNA-seq alignments with StringTie2. Genome Biol. (2019) 20:278. doi: 10.1186/s13059-019-1910-1
37. Pertea M, Kim D, Pertea GM, Leek JT, Salzberg SL. Transcript-level expression analysis of RNA-seq experiments with HISAT, StringTie and Ballgown. Nat Protoc. (2016) 11:1650–67. doi: 10.1038/nprot.2016.095
38. Zhang Y, Parmigiani G, Johnson WE. ComBat-seq: batch effect adjustment for RNA-seq count data. NAR Genomics Bioinf. (2020) 2:lqaa078. doi: 10.1093/nargab/lqaa078
39. Chen Y, Lun ATL, Smyth GK. From reads to genes to pathways: differential expression analysis of RNA-Seq experiments using Rsubread and the edgeR quasi-likelihood pipeline. F1000Res. (2016) 5:1438. doi: 10.12688/f1000research.8987.2
40. Robinson MD, Oshlack A. A scaling normalization method for differential expression analysis of RNA-seq data. Genome Biol. (2010) 11:R25. doi: 10.1186/gb-2010-11-3-r25
41. Robinson MD, McCarthy DJ, Smyth GK. edgeR : a Bioconductor package for differential expression analysis of digital gene expression data. Bioinformatics. (2010) 26:139–40. doi: 10.1093/bioinformatics/btp616
42. McCarthy DJ, Chen Y, Smyth GK. Differential expression analysis of multifactor RNA-Seq experiments with respect to biological variation. Nucleic Acids Res. (2012) 40:4288–97. doi: 10.1093/nar/gks042
43. Bullard JH, Purdom E, Hansen KD, Dudoit S. Evaluation of statistical methods for normalization and differential expression in mRNA-Seq experiments. BMC Bioinf. (2010) 11:94. doi: 10.1186/1471-2105-11-94
44. Leng N, Li Y, McIntosh BE, Nguyen BK, Duffin B, Tian S, et al. EBSeq-HMM: a Bayesian approach for identifying gene-expression changes in ordered RNA-seq experiments. Bioinformatics. (2015) 31:2614–22. doi: 10.1093/bioinformatics/btv193
45. Bu D, Luo H, Huo P, Wang Z, Zhang S, He Z, et al. KOBAS-i: intelligent prioritization and exploratory visualization of biological functions for gene enrichment analysis. Nucleic Acids Res. (2021) 49:W317–25. doi: 10.1093/nar/gkab447
47. Kanehisa M. KEGG: kyoto encyclopedia of genes and genomes. Nucleic Acids Res. (2000) 28:27–30. doi: 10.1093/nar/28.1.27
48. Fabregat A, Sidiropoulos K, Viteri G, Forner O, Marin-Garcia P, Arnau V, et al. Reactome pathway analysis: a high-performance in-memory approach. BMC Bioinf. (2017) 18:142. doi: 10.1186/s12859-017-1559-2
49. Conway JR, Lex A, Gehlenborg N. UpSetR: an R package for the visualization of intersecting sets and their properties. Bioinformatics. (2017) 33:2938–40. doi: 10.1093/bioinformatics/btx364
50. Khan A, Mathelier A. Intervene: a tool for intersection and visualization of multiple gene or genomic region sets. BMC Bioinf. (2017) 18:287. doi: 10.1186/s12859-017-1708-7
51. Timmons JA, Szkop KJ, Gallagher IJ. Multiple sources of bias confound functional enrichment analysis of global -omics data. Genome Biol. (2015) 16:186. doi: 10.1186/s13059-015-0761-7
52. Wijesooriya K, Jadaan SA, Perera KL, Kaur T, Ziemann M. Urgent need for consistent standards in functional enrichment analysis. PloS Comput Biol. (2022) 18:e1009935. doi: 10.1371/journal.pcbi.1009935
53. Zhao K, Rhee SY. Interpreting omics data with pathway enrichment analysis. Trends Genet. (2023) 39:308–19. doi: 10.1016/j.tig.2023.01.003
54. Kolberg L, Raudvere U, Kuzmin I, Adler P, Vilo J, Peterson H. g:Profiler—interoperable web service for functional enrichment analysis and gene identifier mapping (2023 update). Nucleic Acids Res. (2023) 51:W207–12. doi: 10.1093/nar/gkad347
55. Kanehisa M, Furumichi M, Sato Y, Kawashima M, Ishiguro-Watanabe M. KEGG for taxonomy-based analysis of pathways and genomes. Nucleic Acids Res. (2023) 51:D587–92. doi: 10.1093/nar/gkac963
56. Gillespie M, Jassal B, Stephan R, Milacic M, Rothfels K, Senff-Ribeiro A, et al. The reactome pathway knowledgebase 2022. Nucleic Acids Res. (2022) 50:D687–92. doi: 10.1093/nar/gkab1028
57. Agrawal A, Balcı H, Hanspers K, Coort SL, Martens M, Slenter DN, et al. WikiPathways 2024: next generation pathway database. Nucleic Acids Res. (2024) 52:D679–89. doi: 10.1093/nar/gkad960
58. Scott MA, Woolums AR, Swiderski CE, Perkins AD, Nanduri B, Smith DR, et al. Comprehensive at-arrival transcriptomic analysis of post-weaned beef cattle uncovers type I interferon and antiviral mechanisms associated with bovine respiratory disease mortality. PloS One. (2021) 16:e0250758. doi: 10.1371/journal.pone.0250758
59. Scott MA, Woolums AR, Swiderski CE, Finley A, Perkins AD, Nanduri B, et al. Hematological and gene co-expression network analyses of high-risk beef cattle defines immunological mechanisms and biological complexes involved in bovine respiratory disease and weight gain. PloS One. (2022) 17:e0277033. doi: 10.1371/journal.pone.0277033
60. Aich P, Babiuk LA, Potter AA, Griebel P. Biomarkers for prediction of bovine respiratory disease outcome. OMICS: A J Integr Biol. (2009) 13:199–209. doi: 10.1089/omi.2009.0012
61. Johnston D, Earley B, McCabe MS, Kim J, Taylor JF, Lemon K, et al. Messenger RNA biomarkers of Bovine Respiratory Syncytial Virus infection in the whole blood of dairy calves. Sci Rep. (2021) 11:9392. doi: 10.1038/s41598-021-88878-1
62. Chen J, Yang C, Tizioto PC, Huang H, Lee MOK, Payne HR, et al. Expression of the bovine NK-lysin gene family and activity against respiratory pathogens. PloS One. (2016) 11:e0158882. doi: 10.1371/journal.pone.0158882
63. Lebedev M, McEligot HA, Mutua VN, Walsh P, Carvallo Chaigneau FR, Gershwin LJ. Analysis of lung transcriptome in calves infected with Bovine Respiratory Syncytial Virus and treated with antiviral and/or cyclooxygenase inhibitor. PloS One. (2021) 16:e0246695. doi: 10.1371/journal.pone.0246695
64. O’Donoghue S, Earley B, Johnston D, McCabe MS, Kim JW, Taylor JF, et al. Whole blood transcriptome analysis in dairy calves experimentally challenged with bovine herpesvirus 1 (BoHV-1) and comparison to a bovine respiratory syncytial virus (BRSV) challenge. Front Genet. (2023) 14:1092877. doi: 10.3389/fgene.2023.1092877
65. Blakebrough-Hall C, Dona A, D’occhio MJ, McMeniman J, González LA. Diagnosis of Bovine Respiratory Disease in feedlot cattle using blood 1H NMR metabolomics. Sci Rep. (2020) 10:115. doi: 10.1038/s41598-019-56809-w
66. Li J, Zhu Y, Shoemake B, Liu B, Adkins P, Wallace L. A systematic review of the utility of biomarkers as aids in the early diagnosis and outcome prediction of bovine respiratory disease complex in feedlot cattle. J Vet Diagn Invest. (2022) 34:577–86. doi: 10.1177/10406387221081232
67. Humblet M-F, Coghe J, Lekeux P, Godeau J-M. Acute phase proteins assessment for an early selection of treatments in growing calves suffering from bronchopneumonia under field conditions. Res Veterinary Sci. (2004) 77:41–7. doi: 10.1016/j.rvsc.2004.02.009
68. Theurer ME, Anderson DE, White BJ, Miesner MD, Mosier DA, Coetzee JF, et al. Effect of Mannheimia haemolytica pneumonia on behavior and physiologic responses of calves during high ambient environmental temperatures1. J Anim Sci. (2013) 91:3917–29. doi: 10.2527/jas.2012-5823
69. Gaudino M, Nagamine B, Ducatez MF, Meyer G. Understanding the mechanisms of viral and bacterial coinfections in bovine respiratory disease: a comprehensive literature review of experimental evidence. Vet Res. (2022) 53:70. doi: 10.1186/s13567-022-01086-1
70. Griffin D. The monster we don’t see: subclinical BRD in beef cattle. Anim Health Res Rev. (2014) 15:138–41. doi: 10.1017/S1466252314000255
71. Fulton RW, Confer AW. Laboratory test descriptions for bovine respiratory disease diagnosis and their strengths and weaknesses: gold standards for diagnosis, do they exist? Can Vet J. (2012) 53:754–61.
72. Kamel MS, Davidson JL, Verma MS. Strategies for bovine respiratory disease (BRD) diagnosis and prognosis: A comprehensive overview. Animals. (2024) 14:627. doi: 10.3390/ani14040627
73. Smock TM, Broadway PR, Burdick Sanchez NC, Carroll JA, Hoffman AA, Long NS, et al. Infrared thermography or rectal temperature as qualification for targeted metaphylaxis in newly received beef steers and the effects on growth performance, complete blood count, and serum haptoglobin during a 42-day feedlot receiving period*. Appl Anim Sci. (2023) 39:213–26. doi: 10.15232/aas.2022-02370
74. Broadway PR, Mauget SA, Burdick Sanchez NC, Carroll JA. Correlation of ambient temperature with feedlot cattle morbidity and mortality in the texas panhandle. Front Vet Sci. (2020) 7:413. doi: 10.3389/fvets.2020.00413
75. Cantor MC, Casella E, Silvestri S, Renaud DL, Costa JHC. Using machine learning and behavioral patterns observed by automated feeders and accelerometers for the early indication of clinical bovine respiratory disease status in preweaned dairy calves. Front Anim Sci. (2022) 3:852359. doi: 10.3389/fanim.2022.852359
76. Gwaka JK, Demafo MA, N’konzi J-PN, Pak A, Olumoh J, Elfaki F, et al. Machine-learning approach for risk estimation and risk prediction of the effect of climate on bovine respiratory disease. Mathematics. (2023) 11:1354. doi: 10.3390/math11061354
77. Wisnieski L, Amrine DE, Renter DG. Predictive modeling of bovine respiratory disease outcomes in feedlot cattle: A narrative review. Livestock Sci. (2021) 251:104666. doi: 10.1016/j.livsci.2021.104666
78. Frucchi APS, Dall Agnol AM, Bronkhorst DE, Beuttemmuller EA, Alfieri AA, Alfieri AF. Bovine coronavirus co-infection and molecular characterization in dairy calves with or without clinical respiratory disease. Front Vet Sci. (2022) 9:895492. doi: 10.3389/fvets.2022.895492
79. Zhang X, Outlaw C, Olivier AK, Woolums A, Epperson W, Wan X-F. Pathogenesis of co-infections of influenza D virus and Mannheimia haemolytica in cattle. Veterinary Microbiol. (2019) 231:246–53. doi: 10.1016/j.vetmic.2019.03.027
80. Li W, Larsen A, Murphy B, Fregulia P. Liver microbial community and associated host transcriptome in calves with feed induced acidosis. Front Vet Sci. (2023) 10:1193473. doi: 10.3389/fvets.2023.1193473
81. Özmen Ö, Karaman K. Transcriptome analysis and potential mechanisms of bovine oocytes under seasonal heat stress. Anim Biotechnol. (2023) 34:1179–95. doi: 10.1080/10495398.2021.2016429
82. Scott MA, Woolums AR, Karisch BB, Harvey KM, Capik SF. Impact of preweaning vaccination on host gene expression and antibody titers in healthy beef calves. Front Vet Sci. (2022) 9:1010039. doi: 10.3389/fvets.2022.1010039
83. Elder LA, Hinnant HR, Mandella CM, Claus-Walker RA, Parrish LM, Slanzon GS, et al. Differential gene expression in peripheral leukocytes of pre-weaned Holstein heifer calves with respiratory disease. PloS One. (2023) 18:e0285876. doi: 10.1371/journal.pone.0285876
84. Cattaneo L, Mezzetti M, Lopreiato V, Piccioli-Cappelli F, Trevisi E, Minuti A. Gene network expression of whole blood leukocytes in dairy cows with different milk yield at dry-off. PloS One. (2021) 16:e0260745. doi: 10.1371/journal.pone.0260745
85. Massi RP, Lunardi M, Alfieri AF, Alfieri AA. Neglected bacterial infections associated to bovine respiratory disease in lactating cows from high-yielding dairy cattle herds. Braz J Microbiol. (2023) 54:3275–81. doi: 10.1007/s42770-023-01165-1
86. Wilson BK, Step DL, Maxwell CL, Gifford CA, Richards CJ, Krehbiel CR. Effect of bovine respiratory disease during the receiving period on steer finishing performance, efficiency, carcass characteristics, and lung scores. Prof Anim Scientist. (2017) 33:24–36. doi: 10.15232/pas.2016-01554
87. Holland BP, Burciaga-Robles LO, VanOverbeke DL, Shook JN, Step DL, Richards CJ, et al. Effect of bovine respiratory disease during preconditioning on subsequent feedlot performance, carcass characteristics, and beef attributes1,2. J Anim Sci. (2010) 88:2486–99. doi: 10.2527/jas.2009-2428
88. Amrine DE, White BJ, Larson R, Anderson DE, Mosier DA, Cernicchiaro N. Precision and accuracy of clinical illness scores, compared with pulmonary consolidation scores, in Holstein calves with experimentally induced Mycoplasma bovis pneumonia. ajvr. (2013) 74:310–5. doi: 10.2460/ajvr.74.2.310
89. Green MM, Woolums AR, Karisch BB, Harvey KM, Capik SF, Scott MA. Influence of the at-arrival host transcriptome on bovine respiratory disease incidence during backgrounding. Veterinary Sci. (2023) 10:211. doi: 10.3390/vetsci10030211
90. Li J, Mukiibi R, Jiminez J, Wang Z, Akanno EC, Timsit E, et al. Applying multi-omics data to study the genetic background of bovine respiratory disease infection in feedlot crossbred cattle. Front Genet. (2022) 13:1046192. doi: 10.3389/fgene.2022.1046192
91. Kuhn H, Humeniuk L, Kozlov N, Roigas S, Adel S, Heydeck D. The evolutionary hypothesis of reaction specificity of mammalian ALOX15 orthologs. Prog Lipid Res. (2018) 72:55–74. doi: 10.1016/j.plipres.2018.09.002
92. Çolakoğlu M, Tunçer S, Banerjee S. Emerging cellular functions of the lipid metabolizing enzyme 15-Lipoxygenase-1. Cell Proliferation. (2018) 51:e12472. doi: 10.1111/cpr.12472
93. Uderhardt S, Herrmann M, Oskolkova OV, Aschermann S, Bicker W, Ipseiz N, et al. 12/15-lipoxygenase orchestrates the clearance of apoptotic cells and maintains immunologic tolerance. Immunity. (2012) 36:834–46. doi: 10.1016/j.immuni.2012.03.010
94. Tang S, Wan M, Huang W, Stanton RC, Xu Y. Maresins: specialized proresolving lipid mediators and their potential role in inflammatory-related diseases. Mediators Inflammation. (2018) 2018:1–8. doi: 10.1155/2018/2380319
95. Snodgrass RG, Brüne B. Regulation and functions of 15-lipoxygenases in human macrophages. Front Pharmacol. (2019) 10:719. doi: 10.3389/fphar.2019.00719
96. Stevens WW, Staudacher AG, Hulse KE, Carter RG, Winter DR, Abdala-Valencia H, et al. Activation of the 15-lipoxygenase pathway in aspirin-exacerbated respiratory disease. J Allergy Clin Immunol. (2021) 147:600–12. doi: 10.1016/j.jaci.2020.04.031
97. Xu X, Li J, Zhang Y, Zhang L. Arachidonic acid 15-lipoxygenase: effects of its expression, metabolites, and genetic and epigenetic variations on airway inflammation. Allergy Asthma Immunol Res. (2021) 13:684. doi: 10.4168/aair.2021.13.5.684
98. Rossaint J, Nadler JL, Ley K, Zarbock A. Eliminating or blocking 12/15-lipoxygenase reduces neutrophil recruitment in mouse models of acute lung injury. Crit Care. (2012) 16:R166. doi: 10.1186/cc11518
99. Benatzy Y, Palmer MA, Brüne B. Arachidonate 15-lipoxygenase type B: Regulation, function, and its role in pathophysiology. Front Pharmacol. (2022) 13:1042420. doi: 10.3389/fphar.2022.1042420
100. Liang Z, Yan B, Liu C, Tan R, Wang C, Zhang L. Predictive significance of arachidonate 15-lipoxygenase for eosinophilic chronic rhinosinusitis with nasal polyps. Allergy Asthma Clin Immunol. (2020) 16:82. doi: 10.1186/s13223-020-00480-8
101. Singh NK, Rao GN. Emerging role of 12/15-Lipoxygenase (ALOX15) in human pathologies. Prog Lipid Res. (2019) 73:28–45. doi: 10.1016/j.plipres.2018.11.001
102. Evans CE, Zhang X, Machireddy N, Zhao Y-Y. The unexpected protective role of thrombosis in sepsis-induced inflammatory lung injury via endothelial alox15. Respir Med. (2023). doi: 10.1101/2023.03.29.23287934
103. Zamora A, Nougué M, Verdu L, Balzan E, Draia-Nicolau T, Benuzzi E, et al. 15-Lipoxygenase promotes resolution of inflammation in lymphedema by controlling Treg cell function through IFN-β. Nat Commun. (2024) 15:221. doi: 10.1038/s41467-023-43554-y
104. Brunnström Å, Tryselius Y, Feltenmark S, Andersson E, Leksell H, James A, et al. On the biosynthesis of 15-HETE and eoxin C4 by human airway epithelial cells. Prostaglandins Other Lipid Mediators. (2015) 121:83–90. doi: 10.1016/j.prostaglandins.2015.04.010
105. Miyata J, Yokokura Y, Moro K, Arai H, Fukunaga K, Arita M. 12/15-lipoxygenase regulates IL-33-induced eosinophilic airway inflammation in mice. Front Immunol. (2021) 12:687192. doi: 10.3389/fimmu.2021.687192
106. Fischer CD, Duquette SC, Renaux BS, Feener TD, Morck DW, Hollenberg MD, et al. Tulathromycin exerts proresolving effects in bovine neutrophils by inhibiting phospholipases and altering leukotriene B 4, prostaglandin E 2, and lipoxin A 4 production. Antimicrob Agents Chemother. (2014) 58:4298–307. doi: 10.1128/AAC.02813-14
107. Boutet P, Bureau F, Degand G, Lekeux P. Imbalance between lipoxin A4 and leukotriene B4 in chronic mastitis-affected cows. J Dairy Sci. (2003) 86:3430–9. doi: 10.3168/jds.S0022-0302(03)73947-2
108. Walstra P, Verhagen J, Vermeer MA, Klerks JPM, Veldink GA, Vliegenthart JFG. Evidence for lipoxin formation by bovine polymorphonuclear leukocytes via triple dioxygenation of arachidonic acid. FEBS Lett. (1988) 228:167–71. doi: 10.1016/0014-5793(88)80609-4
109. Andersson L, Rask L. Characterization of the MHC class II region in cattle. The number of DQ genes varies between haplotypes. Immunogenetics. (1988) 27:110–20. doi: 10.1007/BF00351084
110. Behl JD, Verma NK, Tyagi N, Mishra P, Behl R, Joshi BK. The major histocompatibility complex in bovines: A review. ISRN Veterinary Sci. (2012) 2012:1–12. doi: 10.5402/2012/872710
111. Hayashi T, Mekata H, Sekiguchi S, Kirino Y, Mitoma S, Honkawa K, et al. Cattle with the BoLA class II DRB3*0902 allele have significantly lower bovine leukemia proviral loads. J Veterinary Med Sci. (2017) 79:1552–5. doi: 10.1292/jvms.16-0601
112. Lo C, Takeshima S, Wada S, Matsumoto Y, Aida Y. Bovine major histocompatibility complex (BoLA) heterozygote advantage against the outcome of bovine leukemia virus infection. HLA. (2021) 98:132–9. doi: 10.1111/tan.14285
113. Glass EJ, Baxter R, Leach RJ, Jann OC. Genes controlling vaccine responses and disease resistance to respiratory viral pathogens in cattle. Veterinary Immunol Immunopathology. (2012) 148:90–9. doi: 10.1016/j.vetimm.2011.05.009
114. Fukunaga K, Yamashita Y, Yagisawa T. Copy number variations in BOLA-DQA2, BOLA-DQB, and BOLA-DQA5 show the genomic architecture and haplotype frequency of major histocompatibility complex class II genes in Holstein cows. HLA. (2020) 96:601–9. doi: 10.1111/tan.14086
115. Hou Q, Huang J, Ju Z, Li Q, Li L, Wang C, et al. Identification of splice variants, targeted microRNAs and functional single nucleotide polymorphisms of the BOLA-DQA2 gene in dairy cattle. DNA Cell Biol. (2012) 31:739–44. doi: 10.1089/dna.2011.1402
116. Miyasaka T, Takeshima S-N, Sentsui H, Aida Y. Identification and diversity of bovine major histocompatibility complex class II haplotypes in Japanese Black and Holstein cattle in Japan. J Dairy Sci. (2012) 95:420–31. doi: 10.3168/jds.2011-4621
117. Derakhshani H, Plaizier JC, De Buck J, Barkema HW, Khafipour E. Association of bovine major histocompatibility complex (BoLA) gene polymorphism with colostrum and milk microbiota of dairy cows during the first week of lactation. Microbiome. (2018) 6:203. doi: 10.1186/s40168-018-0586-1
118. Zhang S, Yao Z, Li X, Zhang Z, Liu X, Yang P, et al. Assessing genomic diversity and signatures of selection in Pinan cattle using whole-genome sequencing data. BMC Genomics. (2022) 23:460. doi: 10.1186/s12864-022-08645-y
119. Harboe M, Mollnes TE. The alternative complement pathway revisited. J Cell Mol Medi. (2008) 12:1074–84. doi: 10.1111/j.1582-4934.2008.00350.x
120. Sethi MS, Tabel H. Fragment Bb of bovine complement factor B: stimulatory effect on the microbicidal activity of bovine monocytes. Can J Vet Res. (1990) 54:405–9.
121. Zou L, Feng Y, Li Y, Zhang M, Chen C, Cai J, et al. Complement factor B is the downstream effector of TLRs and plays an important role in a mouse model of severe sepsis. J Immunol. (2013) 191:5625–35. doi: 10.4049/jimmunol.1301903
122. Barratt J, Weitz I. Complement factor D as a strategic target for regulating the alternative complement pathway. Front Immunol. (2021) 12:712572. doi: 10.3389/fimmu.2021.712572
123. Boyer DS, Schmidt-Erfurth U, Van Lookeren Campagne M, Henry EC, Brittain C. THE PATHOPHYSIOLOGY OF GEOGRAPHIC ATROPHY SECONDARY TO AGE-RELATED MACULAR DEGENERATION AND THE COMPLEMENT PATHWAY AS A THERAPEUTIC TARGET. Retina. (2017) 37:819–35. doi: 10.1097/IAE.0000000000001392
124. Strunk RC, Eidlen DM, Mason RJ. Pulmonary alveolar type II epithelial cells synthesize and secrete proteins of the classical and alternative complement pathways. J Clin Invest. (1988) 81:1419–26. doi: 10.1172/JCI113472
125. Hartung HP, Hadding U. Synthesis of complement by macrophages and modulation of their functions through complement activation. Springer Semin Immunopathol. (1983) 6:283–326. doi: 10.1007/BF02116277
126. Volanakis JE. Transcriptional regulation of complement genes. Annu Rev Immunol. (1995) 13:277–305. doi: 10.1146/annurev.iy.13.040195.001425
127. Pandya PH, Wilkes DS. Complement system in lung disease. Am J Respir Cell Mol Biol. (2014) 51:467–73. doi: 10.1165/rcmb.2013-0485TR
128. Aishwarya S, Gunasekaran K. Differential gene expression profiles involved in the inflammations due to COVID-19 and inflammatory bowel diseases and the investigation of predictive biomarkers. Biochem Genet. (2023) 62:311–32. doi: 10.1007/s10528-023-10414-9
129. Coan PM, Barrier M, Alfazema N, Carter RN, Marion De Procé S, Dopico XC, et al. Complement factor B is a determinant of both metabolic and cardiovascular features of metabolic syndrome. Hypertension. (2017) 70:624–33. doi: 10.1161/HYPERTENSIONAHA.117.09242
130. Fassan M, Collesei A, Angerilli V, Sbaraglia M, Fortarezza F, Pezzuto F, et al. Multi-design differential expression profiling of COVID-19 lung autopsy specimens reveals significantly deregulated inflammatory pathways and SFTPC impaired transcription. Cells. (2022) 11:1011. doi: 10.3390/cells11061011
131. Messner CB, Demichev V, Wendisch D, Michalick L, White M, Freiwald A, et al. Ultra-high-throughput clinical proteomics reveals classifiers of COVID-19 infection. Cell Syst. (2020) 11:11–24.e4. doi: 10.1016/j.cels.2020.05.012
132. Lim EHT, Van Amstel RBE, De Boer VV, Van Vught LA, De Bruin S, Brouwer MC, et al. Complement activation in COVID-19 and targeted therapeutic options: A scoping review. Blood Rev. (2023) 57:100995. doi: 10.1016/j.blre.2022.100995
133. Suzuki K, Lareyre J-J, Sánchez D, Gutierrez G, Araki Y, Matusik RJ, et al. Molecular evolution of epididymal lipocalin genes localized on mouse chromosome 2. Gene. (2004) 339:49–59. doi: 10.1016/j.gene.2004.06.027
134. Flower DR. The lipocalin protein family: structure and function. Biochem J. (1996) 318:1–14. doi: 10.1042/bj3180001
135. Stopková R, Otčenášková T, Matějková T, Kuntová B, Stopka P. Biological roles of lipocalins in chemical communication, reproduction, and regulation of microbiota. Front Physiol. (2021) 12:740006. doi: 10.3389/fphys.2021.740006
136. Sakurai N, Fujihara Y, Kobayashi K, Ikawa M. CRISPR/Cas9-mediated disruption of lipocalins, Ly6g5b, and Ly6g5c causes male subfertility in mice. Andrology. (2022) 12(5):981–90. doi: 10.1111/andr.13350
137. Wen Z, Liu D, Zhu H, Sun X, Xiao Y, Lin Z, et al. Deficiency for Lcn8 causes epididymal sperm maturation defects in mice. Biochem Biophys Res Commun. (2021) 548:7–13. doi: 10.1016/j.bbrc.2021.02.052
138. Mäntyjärvi R, Parkkinen S, Rytkönen M, Pentikäinen J, Pelkonen J, Rautiainen J, et al. Complementary DNA cloning of the predominant allergen of bovine dander: A new member in the lipocalin family. J Allergy Clin Immunol. (1996) 97:1297–303. doi: 10.1016/S0091-6749(96)70198-7
139. Fahlbusch B, Rudeschko O, Schlott B, Henzgen M, Schlenvoigt G, Schubert H, et al. Further characterization of IgE-binding antigens from Guinea pig hair as new members of the lipocalin family. Allergy. (2003) 58:629–34. doi: 10.1034/j.1398-9995.2003.00177.x
140. Altman MC, Gern JE. Reply. J Allergy Clin Immunol. (2018) 142:713. doi: 10.1016/j.jaci.2018.04.035
141. Vastrad B, Vastrad C. Identification of candidate biomarkers and pathways associated with multiple sclerosis using bioinformatics and next generation sequencing data analysis. Bioinformatics. (2023). doi: 10.1101/2023.12.05.570305
142. Diez-Hermano S, Ganfornina MD, Skerra A, Gutiérrez G, Sanchez D. An evolutionary perspective of the lipocalin protein family. Front Physiol. (2021) 12:718983. doi: 10.3389/fphys.2021.718983
143. Yang H-H, Wang X, Li S, Liu Y, Akbar R, Fan G-C. Lipocalin family proteins and their diverse roles in cardiovascular disease. Pharmacol Ther. (2023) 244:108385. doi: 10.1016/j.pharmthera.2023.108385
144. Wang X, Li Y, Gao S, Xia W, Gao K, Kong Q, et al. Increased serum levels of lipocalin-1 and -2 in patients with stable chronic obstructive pulmonary disease. COPD. (2014) 9(1):543–9. doi: 10.2147/COPD.S62700
145. Perez MF, Yurieva M, Poddutoori S, Mortensen EM, Crotty Alexander LE, Williams A. Transcriptomic responses in the blood and sputum of cigarette smokers compared to e-cigarette vapers. Respir Res. (2023) 24:134. doi: 10.1186/s12931-023-02438-x
146. Hendrix P, Mayer-Jackel RE, Cron P, Goris J, Hofsteenge J, Merlevede W, et al. Structure and expression of a 72-kDa regulatory subunit of protein phosphatase 2A. Evidence for different size forms produced by alternative splicing. J Biol Chem. (1993) 268:15267–76. doi: 10.1016/S0021-9258(18)82465-6
147. Davis AJ, Yan Z, Martinez B, Mumby MC. Protein phosphatase 2A is targeted to cell division control protein 6 by a calcium-binding regulatory subunit. J Biol Chem. (2008) 283:16104–14. doi: 10.1074/jbc.M710313200
148. Yang J, Li Z, Gan X, Zhai G, Gao J, Xiong C, et al. Deletion of pr130 interrupts cardiac development in zebrafish. IJMS. (2016) 17:1746. doi: 10.3390/ijms17111746
149. Yu H, Zaveri S, Sattar Z, Schaible M, Perez Gandara B, Uddin A, et al. Protein phosphatase 2A as a therapeutic target in pulmonary diseases. Medicina. (2023) 59:1552. doi: 10.3390/medicina59091552
150. Zhang M, Liu C, Zhao L, Zhang X, Su Y. The emerging role of protein phosphatase in regeneration. Life. (2023) 13:1216. doi: 10.3390/life13051216
151. Lake CM, Breen JJ. Sequence similarity between SARS-CoV-2 nucleocapsid and multiple sclerosis-associated proteins provides insight into viral neuropathogenesis following infection. Sci Rep. (2023) 13:389. doi: 10.1038/s41598-022-27348-8
152. Shi X, Wang J, Zhang X, Yang S, Luo W, Wang S, et al. GREM1/PPP2R3A expression in heterogeneous fibroblasts initiates pulmonary fibrosis. Cell Biosci. (2022) 12:123. doi: 10.1186/s13578-022-00860-0
153. Balasubramanian A, Henderson RJ, Putcha N, Fawzy A, Raju S, Hansel NN, et al. Haemoglobin as a biomarker for clinical outcomes in chronic obstructive pulmonary disease. ERJ Open Res. (2021) 7:00068–2021. doi: 10.1183/23120541.00068-2021
154. Toft-Petersen AP, Torp-Pedersen C, Weinreich UM, Rasmussen BS. Association between hemoglobin and prognosis in patients admitted to hospital for COPD. Int J Chron Obstruct Pulmon Dis. (2016) 11:2813–20. doi: 10.2147/COPD.S116269
155. Li D, Dong H, Li S, Munir M, Chen J, Luo Y, et al. Hemoglobin subunit beta interacts with the capsid protein and antagonizes the growth of classical swine fever virus. J Virol. (2013) 87:5707–17. doi: 10.1128/JVI.03130-12
156. Saha D, Patgaonkar M, Shroff A, Ayyar K, Bashir T, Reddy KVR. Hemoglobin expression in nonerythroid cells: novel or ubiquitous? Int J Inflammation. (2014) 2014:1–8. doi: 10.1155/2014/803237
157. Dutra FF, Bozza MT. Heme on innate immunity and inflammation. Front Pharmacol. (2014) 5:115. doi: 10.3389/fphar.2014.00115
158. North ML, Khanna N, Marsden PA, Grasemann H, Scott JA. Functionally important role for arginase 1 in the airway hyperresponsiveness of asthma. Am J Physiology-Lung Cell Mol Physiol. (2009) 296:L911–20. doi: 10.1152/ajplung.00025.2009
159. Cloots RHE, Sankaranarayanan S, Poynter ME, Terwindt E, Van Dijk P, Lamers WH, et al. Arginase 1 deletion in myeloid cells affects the inflammatory response in allergic asthma, but not lung mechanics, in female mice. BMC Pulm Med. (2017) 17:158. doi: 10.1186/s12890-017-0490-7
160. Guignabert C, Humbert M. Targeting transforming growth factor-β receptors in pulmonary hypertension. Eur Respir J. (2021) 57:2002341. doi: 10.1183/13993003.02341-2020
161. Zhuang Y, Xing F, Ghosh D, Hobbs BD, Hersh CP, Banaei-Kashani F, et al. Deep learning on graphs for multi-omics classification of COPD. PloS One. (2023) 18:e0284563. doi: 10.1371/journal.pone.0284563
162. Monestier O, Blanquet V. WFIKKN1 and WFIKKN2: “Companion” proteins regulating TGFB activity. Cytokine Growth Factor Rev. (2016) 32:75–84. doi: 10.1016/j.cytogfr.2016.06.003
163. Kemper KE, Goddard ME. Understanding and predicting complex traits: knowledge from cattle. Hum Mol Genet. (2012) 21:R45–51. doi: 10.1093/hmg/dds332
164. Khorramizadeh MR, Saadat F. Chapter 8 - Animal models for human disease. Amsterdam, The Netherlands: Elsevier (2020). doi: 10.1016/B978-0-12-811710-1.00008-2
165. Berg BHVD, Thanthiriwatte C, Manda P, Bridges SM. Comparing gene annotation enrichment tools for functional modeling of agricultural microarray data. BMC Bioinf. (2009) 10:S9. doi: 10.1186/1471-2105-10-S11-S9
166. Newton MA, He Q, Kendziorski C. A model-based analysis to infer the functional content of a gene list. Stat Appl Genet Mol Biol. (2012) 11(2). doi: 10.2202/1544-6115.1716
167. Zhang D, Hu Q, Liu X, Zou K, Sarkodie EK, Liu X, et al. AllEnricher: a comprehensive gene set function enrichment tool for both model and non-model species. BMC Bioinf. (2020) 21:106. doi: 10.1186/s12859-020-3408-y
168. Zhang Y, Chen Z, Jiang A, Gao G. KLRK1 as a prognostic biomarker for lung adenocarcinoma cancer. Sci Rep. (2022) 12:1976. doi: 10.1038/s41598-022-05997-z
169. Wortham BW, Eppert BL, Motz GT, Flury JL, Orozco-Levi M, Hoebe K, et al. NKG2D mediates NK cell hyperresponsiveness and influenza-induced pathologies in a mouse model of chronic obstructive pulmonary disease. J Immunol. (2012) 188:4468–75. doi: 10.4049/jimmunol.1102643
170. Farhadi N, Lambert L, Triulzi C, Openshaw PJM, Guerra N, Culley FJ. Natural killer cell NKG2D and granzyme B are critical for allergic pulmonary inflammation☆. J Allergy Clin Immunol. (2014) 133:827–835.e3. doi: 10.1016/j.jaci.2013.09.048
171. Kim W-D, Chi H-S, Choe K-H, Kim W-S, Hogg JC, Sin DD. The role of granzyme B containing cells in the progression of chronic obstructive pulmonary disease. Tuberc Respir Dis. (2020) 83:S25–33. doi: 10.4046/trd.2020.0089
172. Gao S. Cathepsin G. and its role in inflammation and autoimmune diseases. Arch Rheumatol. (2018) 33:498–504. doi: 10.5606/ArchRheumatol.2018.6595
173. Guerra M, Frey D, Hagner M, Dittrich S, Paulsen M, Mall MA, et al. Cathepsin G activity as a new marker for detecting airway inflammation by microscopy and flow cytometry. ACS Cent Sci. (2019) 5:539–48. doi: 10.1021/acscentsci.8b00933
174. Culley FJ. Natural killer cells in infection and inflammation of the lung. Immunology. (2009) 128:151–63. doi: 10.1111/j.1365-2567.2009.03167.x
175. Lögdberg L, Wester L. Immunocalins: a lipocalin subfamily that modulates immune and inflammatory responses. Biochim Biophys Acta (BBA) - Protein Structure Mol Enzymology. (2000) 1482:284–97. doi: 10.1016/S0167-4838(00)00164-3
176. Elemam NM, Ramakrishnan RK, Hundt JE, Halwani R, Maghazachi AA, Hamid Q. Innate lymphoid cells and natural killer cells in bacterial infections: function, dysregulation, and therapeutic targets. Front Cell Infect Microbiol. (2021) 11:733564. doi: 10.3389/fcimb.2021.733564
177. Ormiston ML, Chang C, Long LL, Soon E, Jones D, MaChado R, et al. Impaired natural killer cell phenotype and function in idiopathic and heritable pulmonary arterial hypertension. Circulation. (2012) 126:1099–109. doi: 10.1161/CIRCULATIONAHA.112.110619
178. An X, Qin J, Hu X, Zhou Y, Fu B, Wei H. Overexpression of lipocalin 2 in PBX1 -deficient decidual NK cells promotes inflammation at the maternal-fetal interface. Am J Rep Immunol. (2023) 89:e13676. doi: 10.1111/aji.13676
179. Orr SK, Butler KL, Hayden D, Tompkins RG, Serhan CN, Irimia D. Gene expression of proresolving lipid mediator pathways is associated with clinical outcomes in trauma patients. Crit Care Med. (2015) 43:2642–50. doi: 10.1097/CCM.0000000000001312
180. Rao Z, Brunner E, Giszas B, Iyer-Bierhoff A, Gerstmeier J, Börner F, et al. Glucocorticoids regulate lipid mediator networks by reciprocal modulation of 15-lipoxygenase isoforms affecting inflammation resolution. Proc Natl Acad Sci USA. (2023) 120:e2302070120. doi: 10.1073/pnas.2302070120
181. Baumann A, Kiener MS, Haigh B, Perreten V, Summerfield A. Differential ability of bovine antimicrobial cathelicidins to mediate nucleic acid sensing by epithelial cells. Front Immunol. (2017) 8:59. doi: 10.3389/fimmu.2017.00059
182. Young-Speirs M, Drouin D, Cavalcante PA, Barkema HW, Cobo ER. Host defense cathelicidins in cattle: types, production, bioactive functions and potential therapeutic and diagnostic applications. Int J Antimicrobial Agents. (2018) 51:813–21. doi: 10.1016/j.ijantimicag.2018.02.006
183. Tomasinsig L, Benincasa M, Scocchi M, Skerlavaj B, Tossi A, Zanetti M, et al. Role of cathelicidin peptides in bovine host defense and healing. Probiotics Antimicro Prot. (2010) 2:12–20. doi: 10.1007/s12602-010-9035-6
184. Pelillo C, Benincasa M, Scocchi M, Gennaro R, Tossi A, Pacor S. Cellular internalization and cytotoxicity of the antimicrobial proline-rich peptide Bac7(1-35) in monocytes/macrophages, and its activity against phagocytosed Salmonella typhimurium. Protein Pept Lett. (2014) 21:382–90. doi: 10.2174/09298665113206660109
185. Tay NQ, Lee DCP, Chua YL, Prabhu N, Gascoigne NRJ, Kemeny DM. CD40L expression allows CD8+ T cells to promote their own expansion and differentiation through dendritic cells. Front Immunol. (2017) 8:1484. doi: 10.3389/fimmu.2017.01484
186. Huang Y, Clarke F, Karimi M, Roy NH, Williamson EK, Okumura M, et al. CRK proteins selectively regulate T cell migration into inflamed tissues. J Clin Invest. (2015) 125:1019–32. doi: 10.1172/JCI77278
187. Matson CA, Choi S, Livak F, Zhao B, Mitra A, Love PE, et al. CD5 dynamically calibrates basal NF-κB signaling in T cells during thymic development and peripheral activation. Proc Natl Acad Sci USA. (2020) 117:14342–53. doi: 10.1073/pnas.1922525117
188. Alegre M-L, Frauwirth KA, Thompson CB. T-cell regulation by CD28 and CTLA-4. Nat Rev Immunol. (2001) 1:220–8. doi: 10.1038/35105024
189. Linsley PS, Ledbetter JA. The role of the CD28 receptor during T cell responses to antigen. Annu Rev Immunol. (1993) 11:191–212. doi: 10.1146/annurev.iy.11.040193.001203
190. Tizioto PC, Kim J, Seabury CM, Schnabel RD, Gershwin LJ, Van Eenennaam AL, et al. Immunological response to single pathogen challenge with agents of the bovine respiratory disease complex: an RNA-sequence analysis of the bronchial lymph node transcriptome. PloS One. (2015) 10:e0131459. doi: 10.1371/journal.pone.0131459
191. Behura SK, Tizioto PC, Kim J, Grupioni NV, Seabury CM, Schnabel RD, et al. Tissue tropism in host transcriptional response to members of the bovine respiratory disease complex. Sci Rep. (2017) 7:17938. doi: 10.1038/s41598-017-18205-0
192. Harbaum L, Wellbrock J, Diedrich J, Hennigs JK, Heyckendorf J, Bokemeyer C, et al. M2 macrophages derived from patients with idiopathic pulmonary arterial hypertension are susceptible for apelin-mediated suppression of pro-inflammatory cytokines. Eur Respir J. (2014) 44:311. https://erj.ersjournals.com/content/44/Suppl_58/P311.
193. Wang H, Cong L, Yin X, Zhang N, Zhu M, Sun T, et al. The Apelin-APJ axis alleviates LPS-induced pulmonary fibrosis and endothelial mesenchymal transformation in mice by promoting Angiotensin-Converting Enzyme 2. Cell Signalling. (2022) 98:110418. doi: 10.1016/j.cellsig.2022.110418
194. Becker K, Soellner J, Schlange T, Hesslinger C, Vinisko R, Leonard TB, et al. Machine learning-based identification of RNA and protein biomarkers predictive of disease progression or death in the IPF-PRO Registry. In: Idiopathic interstitial pneumonias. Milan, Italy: European Respiratory Society (2023). p. PA1147. doi: 10.1183/13993003.congress-2023.PA1147
Keywords: cattle, bovine respiratory disease, inflammation, specialized pro-resolving mediators, major histocompatibility complex, immunoglobulin, interleukin, transcriptome
Citation: Scott MA, Valeris-Chacin R, Thompson AC, Woolums AR and Karisch BB (2024) Comprehensive time-course gene expression evaluation of high-risk beef cattle to establish immunological characteristics associated with undifferentiated bovine respiratory disease. Front. Immunol. 15:1412766. doi: 10.3389/fimmu.2024.1412766
Received: 05 April 2024; Accepted: 20 August 2024;
Published: 13 September 2024.
Edited by:
Lingzhao Fang, Aarhus University, DenmarkReviewed by:
Ze Yan, China Agricultural University, ChinaCarol Geralyn Chitko-McKown, Agricultural Research Service (USDA), United States
Copyright © 2024 Scott, Valeris-Chacin, Thompson, Woolums and Karisch. This is an open-access article distributed under the terms of the Creative Commons Attribution License (CC BY). The use, distribution or reproduction in other forums is permitted, provided the original author(s) and the copyright owner(s) are credited and that the original publication in this journal is cited, in accordance with accepted academic practice. No use, distribution or reproduction is permitted which does not comply with these terms.
*Correspondence: Matthew A. Scott, bWF0dGhld3Njb3R0QHRhbXUuZWR1