 Pei Zhang1,2
 Yanju Jia1,3
 Hui Song1,2,3
 Yifan Fan1,2,3
 Yan Lv3
 Hao Geng1,2,3
 Ying Zhao1,2,3
 Hongyan Cui1,3
 Xu Chen1,2,3*
- 1School of Medicine, Nankai University, Tianjin, China
- 2Tianjin Key Laboratory of Human Development and Reproductive Regulation, Tianjin, China
- 3Department of Obstetrics, Tianjin Central Hospital of Gynecology Obstetrics, Tianjin, China
Background: Postpartum hemorrhage (PPH) is the primary cause of maternal mortality globally, with uterine atony being the predominant contributing factor. However, accurate prediction of PPH in the general population remains challenging due to a lack of reliable biomarkers.
Methods: Using retrospective cohort data, we quantified 48 cytokines in plasma samples from 40 women diagnosed with PPH caused by uterine atony. We also analyzed previously reported hemogram and coagulation parameters related to inflammatory response. The least absolute shrinkage and selection operator (LASSO) and logistic regression were applied to develop predictive models. Established models were further evaluated and temporally validated in a prospective cohort.
Results: Fourteen factors showed significant differences between the two groups, among which IL2Rα, IL9, MIP1β, TNFβ, CTACK, prenatal Hb, Lymph%, PLR, and LnSII were selected by LASSO to construct predictive model A. Further, by logistic regression, model B was constructed using prenatal Hb, PLR, IL2Rα, and IL9. The area under the curve (AUC) values of model A in the training set, internal validation set, and temporal validation set were 0.846 (0.757–0.934), 0.846 (0.749–0.930), and 0.875 (0.789–0.961), respectively. And the corresponding AUC values for model B were 0.805 (0.709–0.901), 0.805 (0.701–0.894), and 0.901 (0.824–0.979). Decision curve analysis results showed that both nomograms had a high net benefit for predicting atonic PPH.
Conclusion: We identified novel biomarkers and developed predictive models for atonic PPH in women undergoing “low-risk” vaginal delivery, providing immunological insights for further exploration of the mechanism underlying atonic PPH.
Introduction
Postpartum hemorrhage (PPH), the leading cause of maternal mortality, affects 3%–10% of deliveries and accounts for nearly 27% of maternal deaths worldwide (1, 2). Researchers at numerous academic institutions have investigated related risk factors and developed tools to assess the risk of PPH, which merely stratified the risk of PPH based on clinical characteristics. However, emerging evidence suggests that these tools have limited predictive performance. For example, approximately 40% of women classified as high-risk individuals did not experience postpartum bleeding (3, 4). Although common risk factors increase the risk of PPH, our clinical data demonstrate that even low-risk women are susceptible to this condition. Additionally, the amount of bleeding is often underestimated and the importance of this symptom is overlooked, leading to delayed diagnosis and treatment and causing severe adverse outcomes among these women. The insufficiency in our current understanding of PPH highlights the need to explore novel indicators and establish a comprehensive predictive model.
Uterine atony continues to be the primary cause of PPH, accounting for approximately 70% of cases (5). Effective uterine contraction is crucial in reducing PPH, while factors that impede proper contraction can lead to atonic PPH and even death in severe cases. Almost all women giving birth are at risk of bleeding due to uterine atony. Compared to cesarean section, where timely measures can be taken, vaginal deliveries pose a greater risk to maternal and child safety due to the more sudden onset of PPH and limited access to emergency resources, especially in low-resource countries.
Recent studies have shown the crucial role of immune cells and cytokines in maintaining pregnancy and initiating labor (6, 7). Previous research found a correlation between certain cytokines and preterm birth, with some markers being able to predict delivery timing and adverse pregnancy outcomes (8, 9). The onset of labor is accompanied by substantial changes in fetomaternal physiology that facilitate successful delivery. These changes include the disruption of immune tolerance within the fetal membrane and placenta due to immune infiltration, as well as changes in the maternal internal immune environment (10, 11). Notably, evident chemotaxis and infiltration of neutrophils and macrophages into the myometrium occur after labor begins, leading to increased expression of inflammatory cytokines (12, 13). The secretion of cytokines plays a crucial role in the initiation and progression of uterine contractions and labor during pregnancy (14, 15). However, the association between maternal inflammatory cytokines in labor and uterine atony has not been investigated. Besides, recent studies have suggested that hemogram and coagulation parameters may also be related to this inflammatory response.
The predictive value of clinical features for uterine atony among low-risk women undergoing vaginal delivery is extremely limited. Currently, no clinical characteristics can accurately predict postpartum atony in the general population. Therefore, this study was initiated to analyze plasma cytokines in women undergoing vaginal delivery and establish a predictive model by integrating hemogram and coagulation parameters, providing valuable insights for identifying atonic PPH in the general population.
Materials and methods
Patients
Utilizing our extensive biobank, we conducted a nested case-control study to identify plasma biomarkers associated with atonic PPH in ‘low-risk’ primiparous women from April 2022 to November 2023. The inclusion criteria were as follows: primipara with full-term singleton infant, fetal head presentation, and age range of 18 to 34 years. The following exclusion criteria were applied: (1) women with autoimmune diseases; (2) women with pregnancy comorbidities and complications potentially associated with PPH (including preeclampsia, poorly controlled or medically controlled gestational diabetes mellitus, placental abruption, scarred uterus, coagulopathy, and induced labor); (3) women who delivered low-birth-weight infants or macrosomia clinically diagnosed after birth; (4) PPH cases caused by placental factors (identified through ultrasound and placental examination); (5) traumatic PPH cases with severe lacerations of the birth canal; (6) women with intrauterine infection; (7) cases positive for group B streptococcus. Given the high prevalence of obstetric lacerations, it is worth noting that most minor ones do not result in significant PPH. Therefore, our study included individuals with mild obstetric lacerations, defined as mild cervical lacerations (<1cm) or first-degree lacerations of perineum. Furthermore, these lacerations would be confirmed by a senior doctor and not considered as the primary cause of bleeding.
The blood samples were collected during the latent phase of the first stage of labor, which was defined as a period characterized by regular uterine contractions and progressive changes of the cervix, including some degree of effacement and slower progression of dilatation up to 5 cm (16). PPH was diagnosed based on excessive bleeding (≥ 500 ml) in the first 24 h after birth. This study employed volumetric methods instead of traditional approaches to accurately quantify blood loss (17). In brief, intrapartum blood loss was measured using a V-shaped blood collection bag with scale lines and warning lines, which allows the blood loss to be read at any time (Supplementary Figure S1). Atonic PPH was diagnosed based on specific criteria: vaginal bleeding (≥ 500 ml) following spontaneous placental expulsion and identification of a flaccid uterus during physical examination.
Eligible women who experienced atonic PPH after vaginal delivery were assigned to the atonic PPH group, while the remaining pregnant women without PPH were matched to the atonic PPH group in a 1:1 ratio using propensity scores. Gestational age, BMI (both before pregnancy and at delivery), and newborn birth weight were considered as predictors for PPH outcome during sample collection, and logistic regression was used to calculate the propensity score. Propensity score matching (PSM) was performed using maximized execution performance without replacement, with a caliper width set at 0.02 standard deviations of the logit of propensity score. Finally, a training cohort comprising 40 women diagnosed with atonic PPH and their matched controls was established. Similarly, in the prospective validation cohort, samples were collected from 41 women who experienced atonic PPH and matched with 41 normal controls.
The baseline characteristics were extracted from the electronic medical record, while data on obstetric and perinatal complications were collected through timely follow-up by trained nurses. Written informed consent was obtained from each subject, and this study was approved by the Ethical Review Committee of the local hospital (2022KY 063). The study flow is shown in Figure 1.
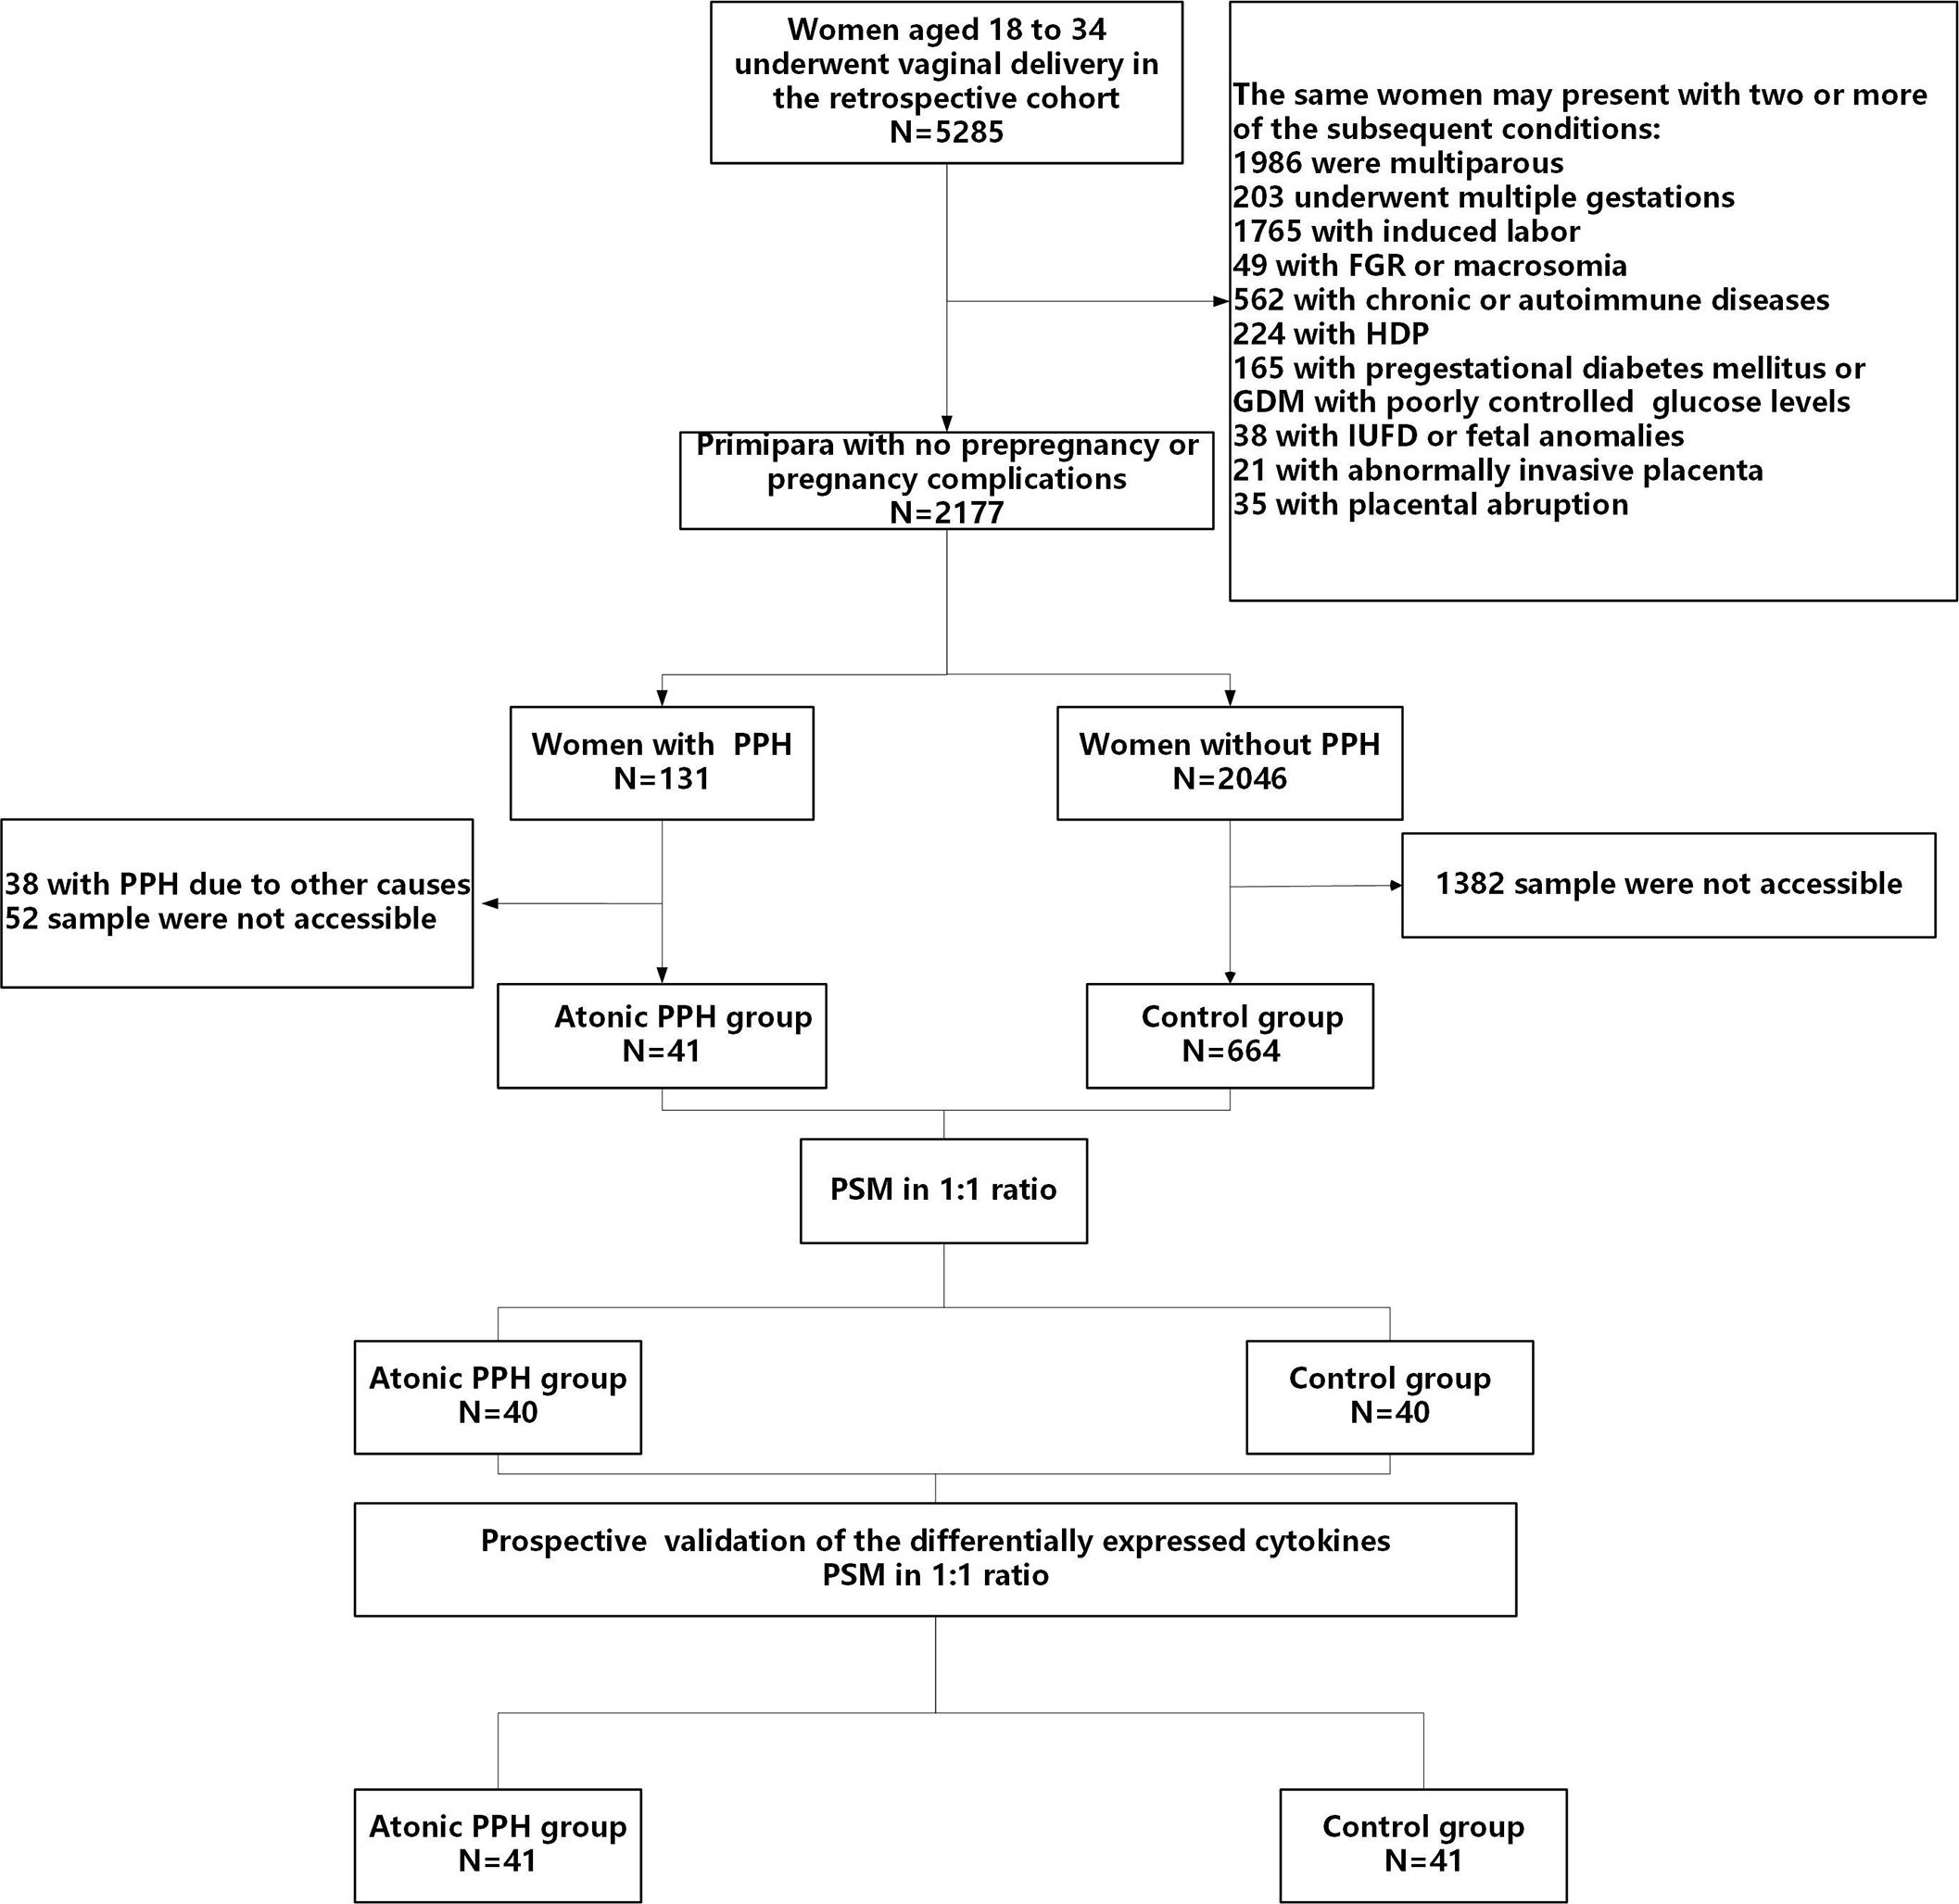
Figure 1 Flow diagram illustrating the process of participant screening and enrollment. FGR, fetal growth restriction; HDP, hypertensive disorders of pregnancy; GDM, gestational diabetes mellitus; IUFD, intrauterine fetal death; PPH, postpartum hemorrhage; PSM, propensity score matching.
Sample collection
Specimens were collected during the latent first stage after spontaneous labor. Samples of 6 ml of peripheral blood were taken from each participant via venipuncture using EDTA anticoagulant tubes for detection. After centrifugation at 3000 rpm for 10 min at 4°C, the supernatant plasma was separated and stored at −80°C.
Assessment of potential biomarkers
Cytokine profiling
The frozen-thawed plasma was centrifuged and diluted 2-fold with a diluent. Subsequently, a 50 μL sample was taken for testing. The Bio-Plex Pro Human Cytokine Screening 48-Plex Panel (Bio-Rad, #12007283) was used to detect the levels of 48 cytokines (Table 1). The detailed procedures for biomarker measurement methods can be found in Additional File 1: Detailed Methods. Representative assay working ranges, assay sensitivity, and precision are presented in Additional Files (Supplementary Table S1).
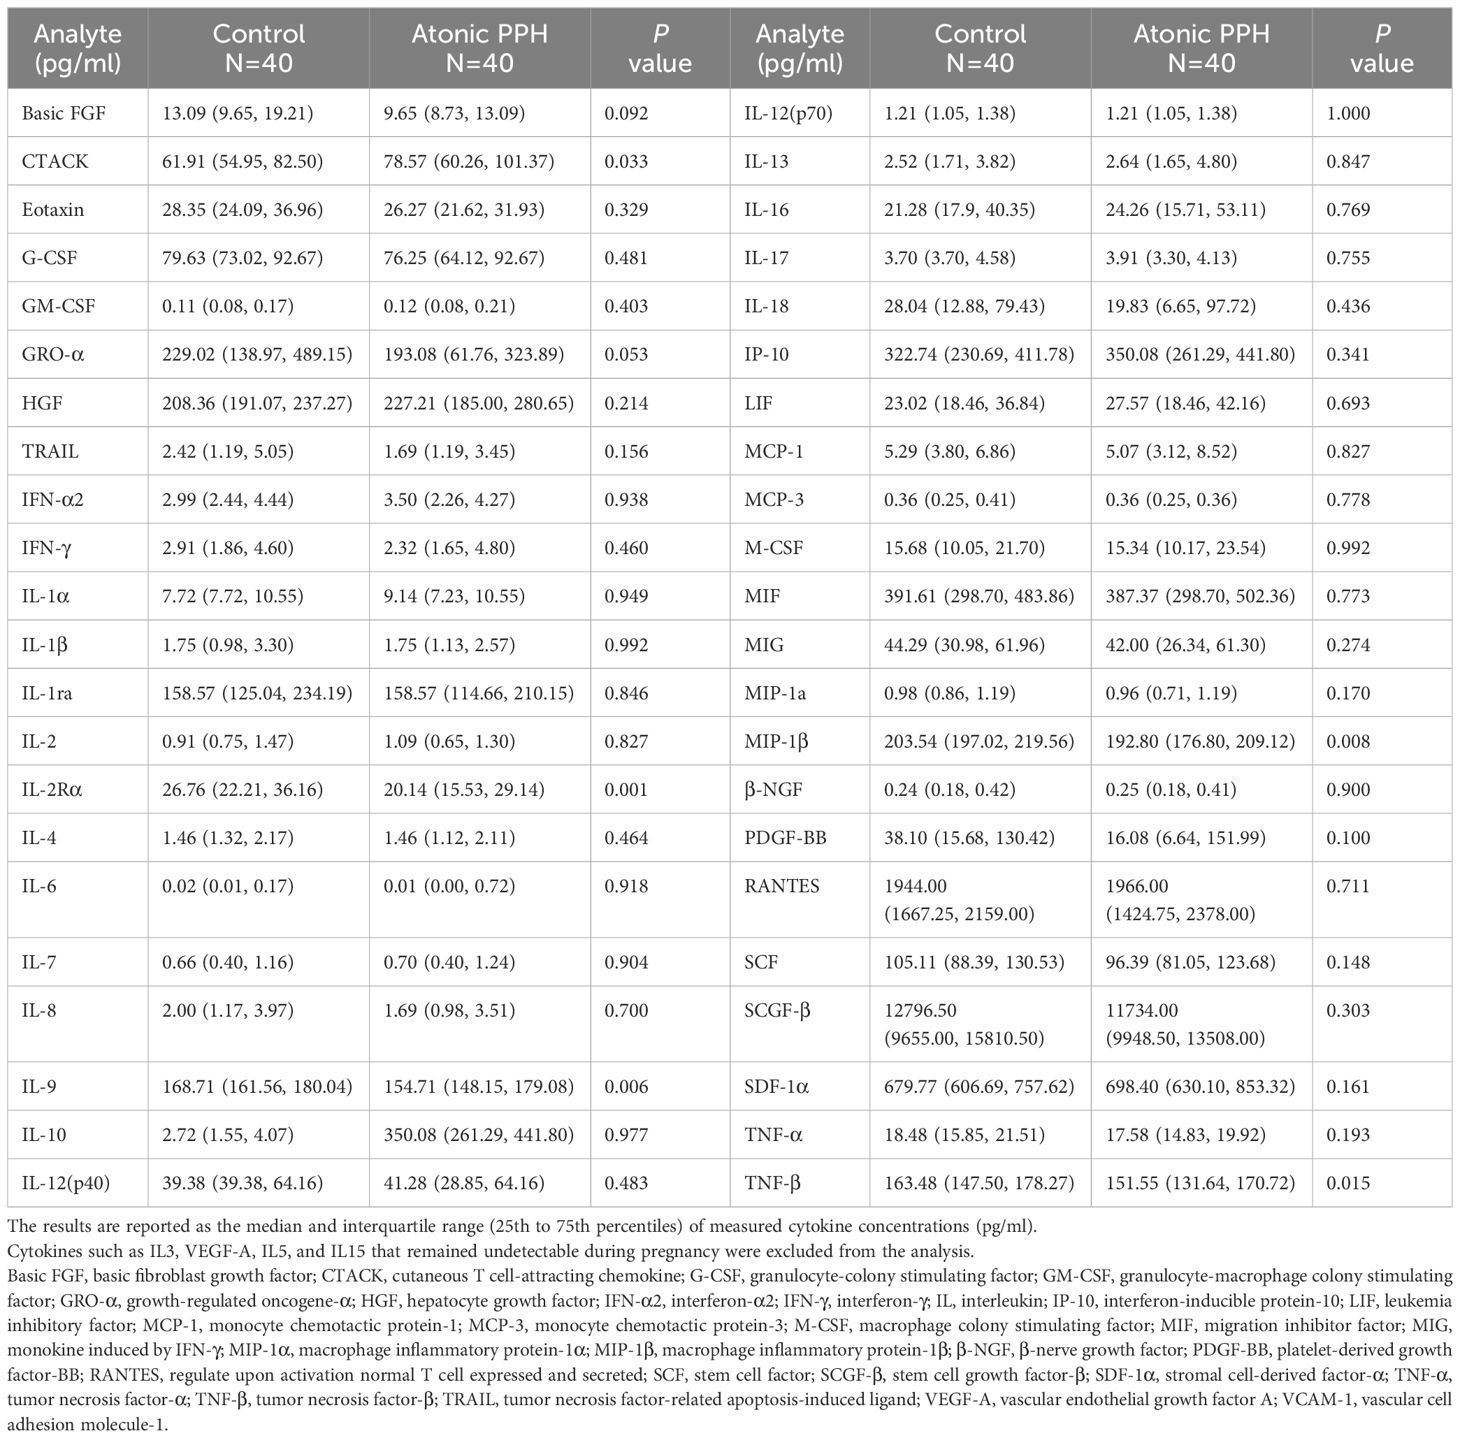
Table 1 Comparisons of concentrations of cytokines between the atonic PPH and matched control group in training cohort.
Routine laboratory tests
Results of the last laboratory test before delivery, including whole blood cell analysis and coagulation tests, were obtained upon patients’ admission. The complete blood count parameters were analyzed using Cell-Dyn 3700 (Abbott Diagnostics, Santa Clara, CA, USA). Coagulation tests were conducted using the Sysmex CS 2500 System coagulation analyzer (Siemens Healthcare Diagnostics, Erlangen, Germany). All measurements were performed within a 2-h time frame after blood sampling. Neutrophil-to-lymphocyte ratio (NLR), monocyte-to-lymphocyte ratio (MLR), platelet-to-lymphocyte ratio (PLR), systemic immune-inflammation index (SII), and LnSII were calculated based on these laboratory test parameters, which were previously reported to be related to systemic immune response. The SII was obtained by multiplying the neutrophil count by the PLR and LnSII was the natural logarithm of SII.
Enzyme-linked immunosorbent assay (ELISA)
The concentrations of differentially expressed cytokines were verified in the temporal validation cohort. Human IL2Rα, IL9, MIP1β, TNFβ, and CTACK ELISA kits from Thermo Fisher Scientific (Waltham, MA, USA) were employed for prospective temporal validation. Plasma samples were appropriately diluted with manufacturer-provided diluents to ensure that absorbance readings fell within the range of the standard curve. The concentration of each sample was determined by constructing a linear standard curve using the provided software, in accordance with the manufacturer’s instructions.
Statistical analysis
Statistical analysis was performed using SPSS 26.0 (IBM, Armonk, NY, USA), R 4.3.1 (R Foundation for Statistical Computing, Vienna, Austria), and GraphPad Prism 9.0 (GraphPad Software, San Diego, CA, USA). For continuous variables, normally distributed data are presented as mean ± standard deviation, and non-normally distributed data are presented as median and interquartile range. Independent samples t-test was employed for normally distributed continuous variables, whereas Mann-Whitney U test was used for non-normally distributed ones. Paired comparisons were conducted using the Wilcoxon paired test. Categorical variables are presented as counts (percentages) and were compared using chi-square analysis or Fisher’s exact test. Statistical significance in cytokines was determined at P< 0.05. Multiple comparisons in hemogram and coagulation parameters were adjusted for using a false discovery rate (FDR)<0.1. Differentially expressed cytokines, hemogram, and coagulation parameters were incorporated into subsequent variable screening and the construction of predictive models.
Considering the limited number of observed events, we used least absolute shrinkage and selection operator (LASSO) regression with tenfold cross-validation to mitigate potential collinearity and overfitting issues. A higher λ value would shrink smaller coefficients towards zero, retaining only the most influential predictors. To ensure model conciseness, we selected the λmin resulting in nine predictors to construct predictive model A. Then, we further analyzed significant variables selected by LASSO regression using logistic regression to identify predictors to construct model B. Risk assessment nomograms for atonic PPH were generated. The models established using the training set were validated. Internal validation was performed using the bootstrap method (1000 times), while temporal validation used prospective cohort data. Discrimination of the model was evaluated by drawing a receiver operating characteristic curve (ROC) and calculating the area under the curve (AUC). Calibration curves were plotted to visualize the calibration of the nomograms and assessed using Hosmer–Lemeshow (H-L) chi-square statistics. Additionally, the clinical utility of the predictive models was assessed by conducting decision curve analyses (DCA) to demonstrate the potential net benefit of the model at various threshold probabilities.
Results
Baseline characteristics and pregnancy outcomes
In the retrospective cohort, a total of 5285 women underwent vaginal deliveries. After applying the predetermined inclusion and exclusion criteria and considering the availability of blood samples, we included 40 ‘low-risk’ women with atonic PPH and matched them with 40 normal controls. For temporal validation, we prospective recruited 41 women who developed atonic PPH and matched them with 41 normal controls (Figure 1). The baseline characteristics, including maternal age, BMI, blood pressure, gestational age, newborn birth weight, and other characteristics were comparable in both two pairs of compared groups (Table 2).
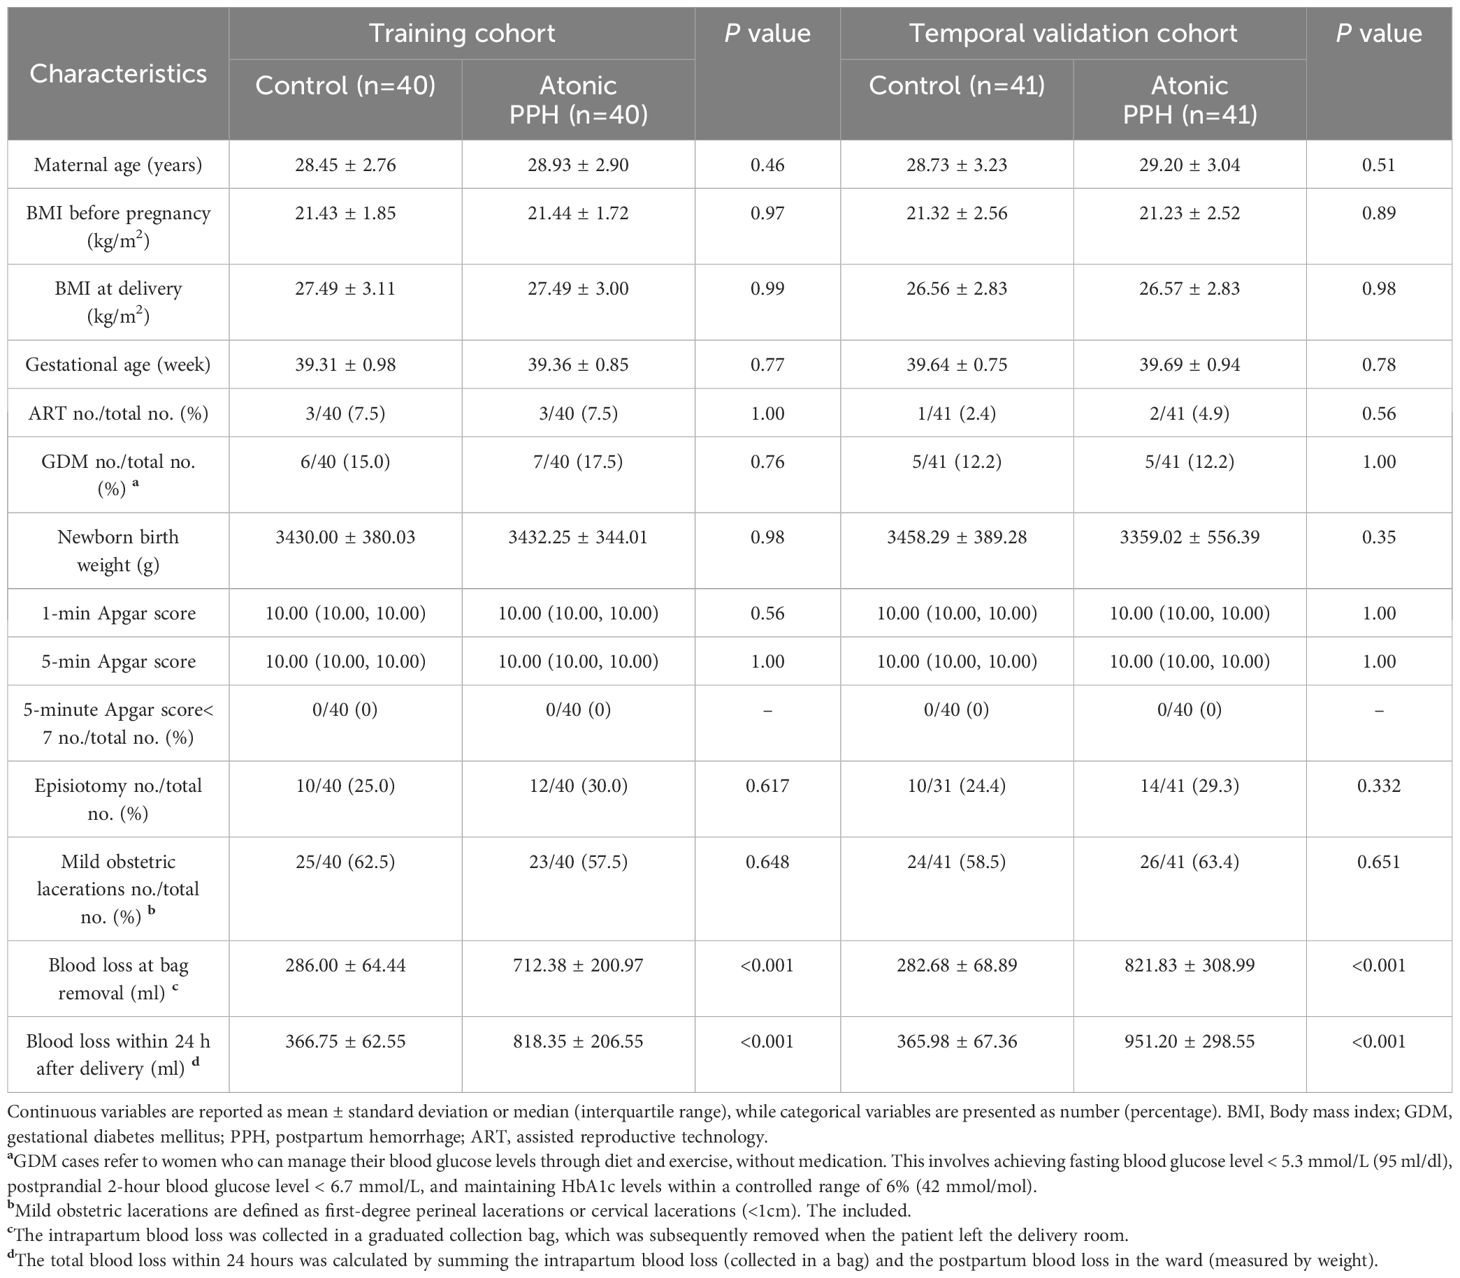
Table 2 Baseline characteristics of participants.
Analysis of maternal circulating cytokines revealed dysregulation in five cytokines associated with atonic PPH
Table 1 provides a summary of the cytokine expression profile in both the atonic PPH and control groups. And to compare differences in cytokine levels across different groups, overall cytokine data was visualized in a heat map representation (Supplementary Figure S2). Besides, pairwise Pearson’s correlation analysis between cytokines was performed in the training cohort (Supplementary Figure S3). Among these cytokines, the expression levels of IL2Rα, IL9, TNFβ, and MIP1β in the PPH group were significantly lower than those in the control group. Conversely, CTACK exhibited significantly higher levels in atonic PPH than in the control group. Violin plots were generated for these five cytokines (Figure 2).
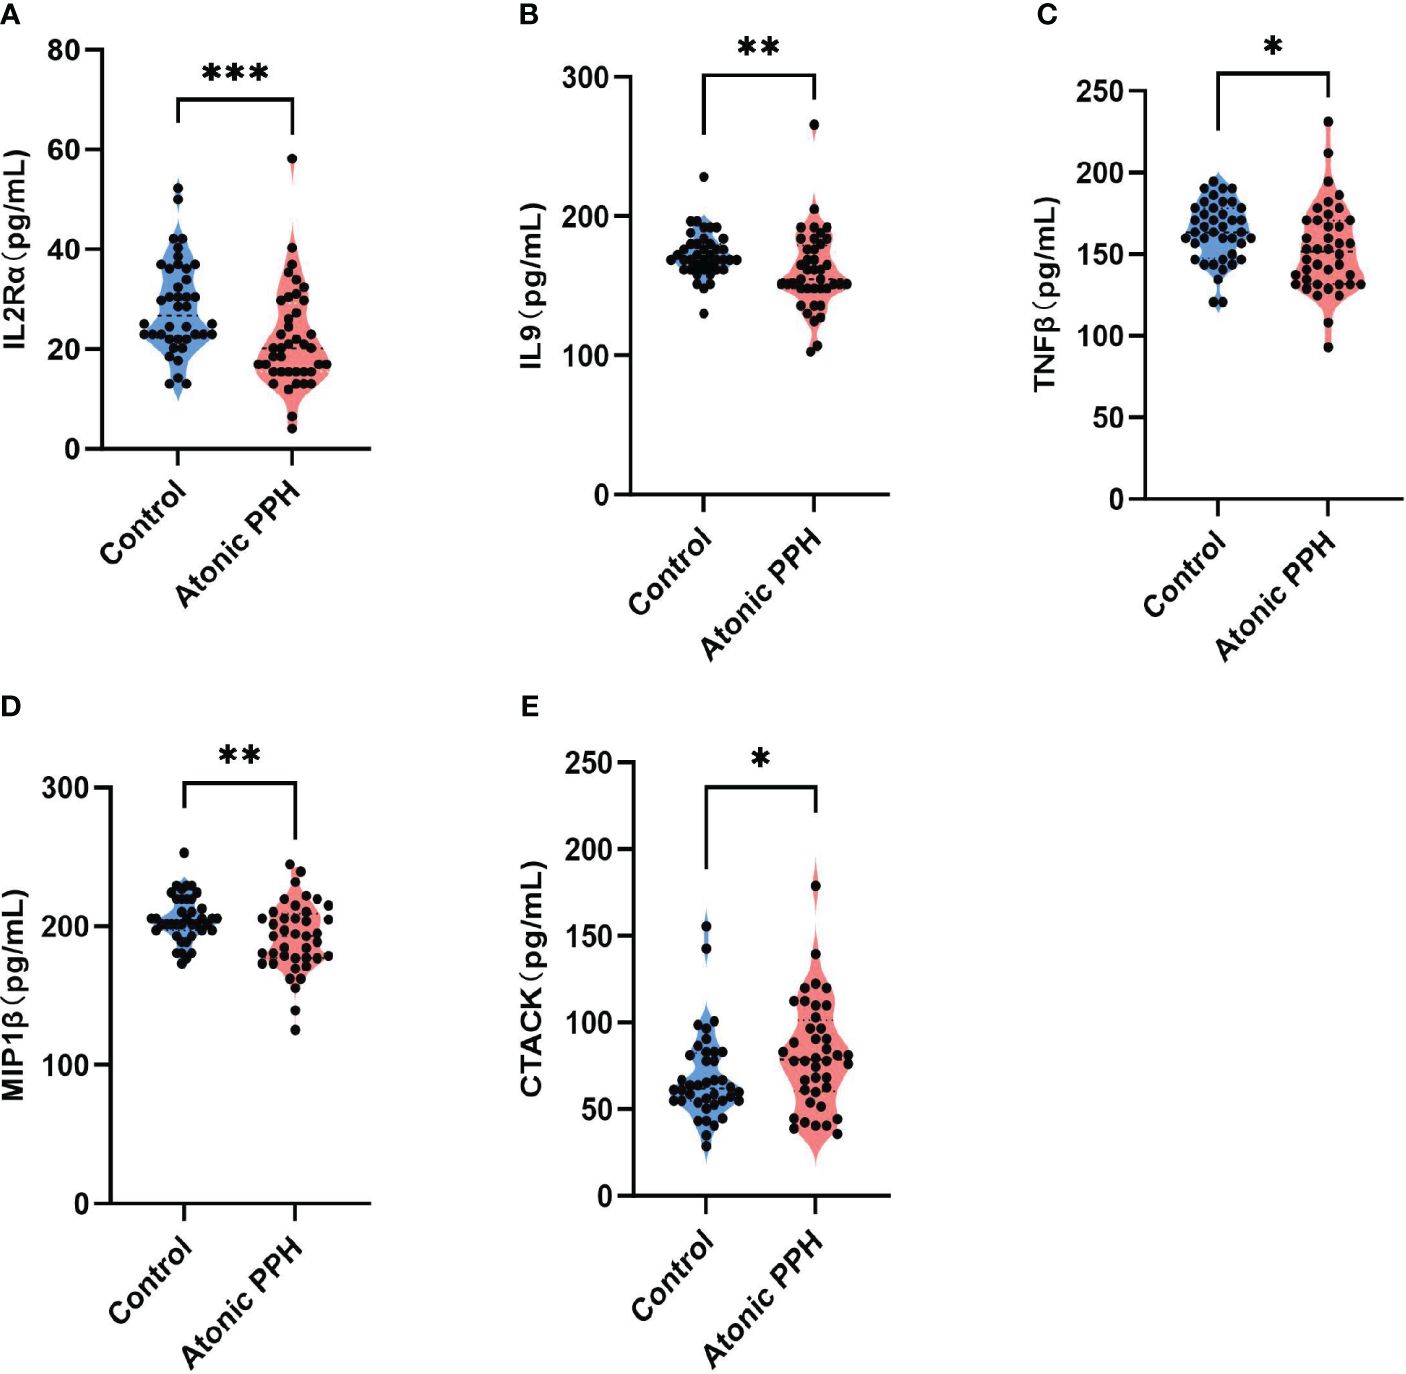
Figure 2 (A–E) Violin plots show significant differences in 5 plasma cytokines between the atonic PPH group and the normal control group, including (A) IL-2rα, (B) IL-9, (C) TNF-β, (D) MIP1β and (E) CTACK. IL-2rα, interleukin−2Rα; IL-9, interleukin−9; TNF-β, tumor necrosis factor−β; MIP1β, macrophage inflammatory protein-1β; CTACK, cutaneous T cell-attracting chemokine. Mann-Whitney U test was used for assessing intergroup differences across these factors. * P<0.05; ** P<0.01; *** P<0.001.
Analysis of hemogram and coagulation parameters identified nine biomarkers associated with atonic PPH
Peripheral blood cell parameters and coagulation parameters in the two groups were compared; detailed results are provided in Table 3. The findings revealed that prenatal Hb (P = 0.032, adjusted P = 0.064), WBC (P = 0.020, adjusted P = 0.057), ANC (P = 0.008, adjusted P = 0.027), Neu% (P = 0.005, adjusted P = 0.020), NLR (P = 0.004, adjusted P = 0.020), PLR (P = 0.030, adjusted P = 0.064), SII (P = 0.002, adjusted P = 0.020) and LnSII (P = 0.002, adjusted P = 0.020) were significant lower in the atonic PPH group than that in the control group. Conversely, women in the atonic PPH group had a higher level of Lymph% (P = 0.004, adjusted P = 0.020) and D-dimer (P = 0.028, adjusted P = 0.064) compared to matched controls (Table 3). Violin plots depicting these nine biomarkers were generated (Figure 3).
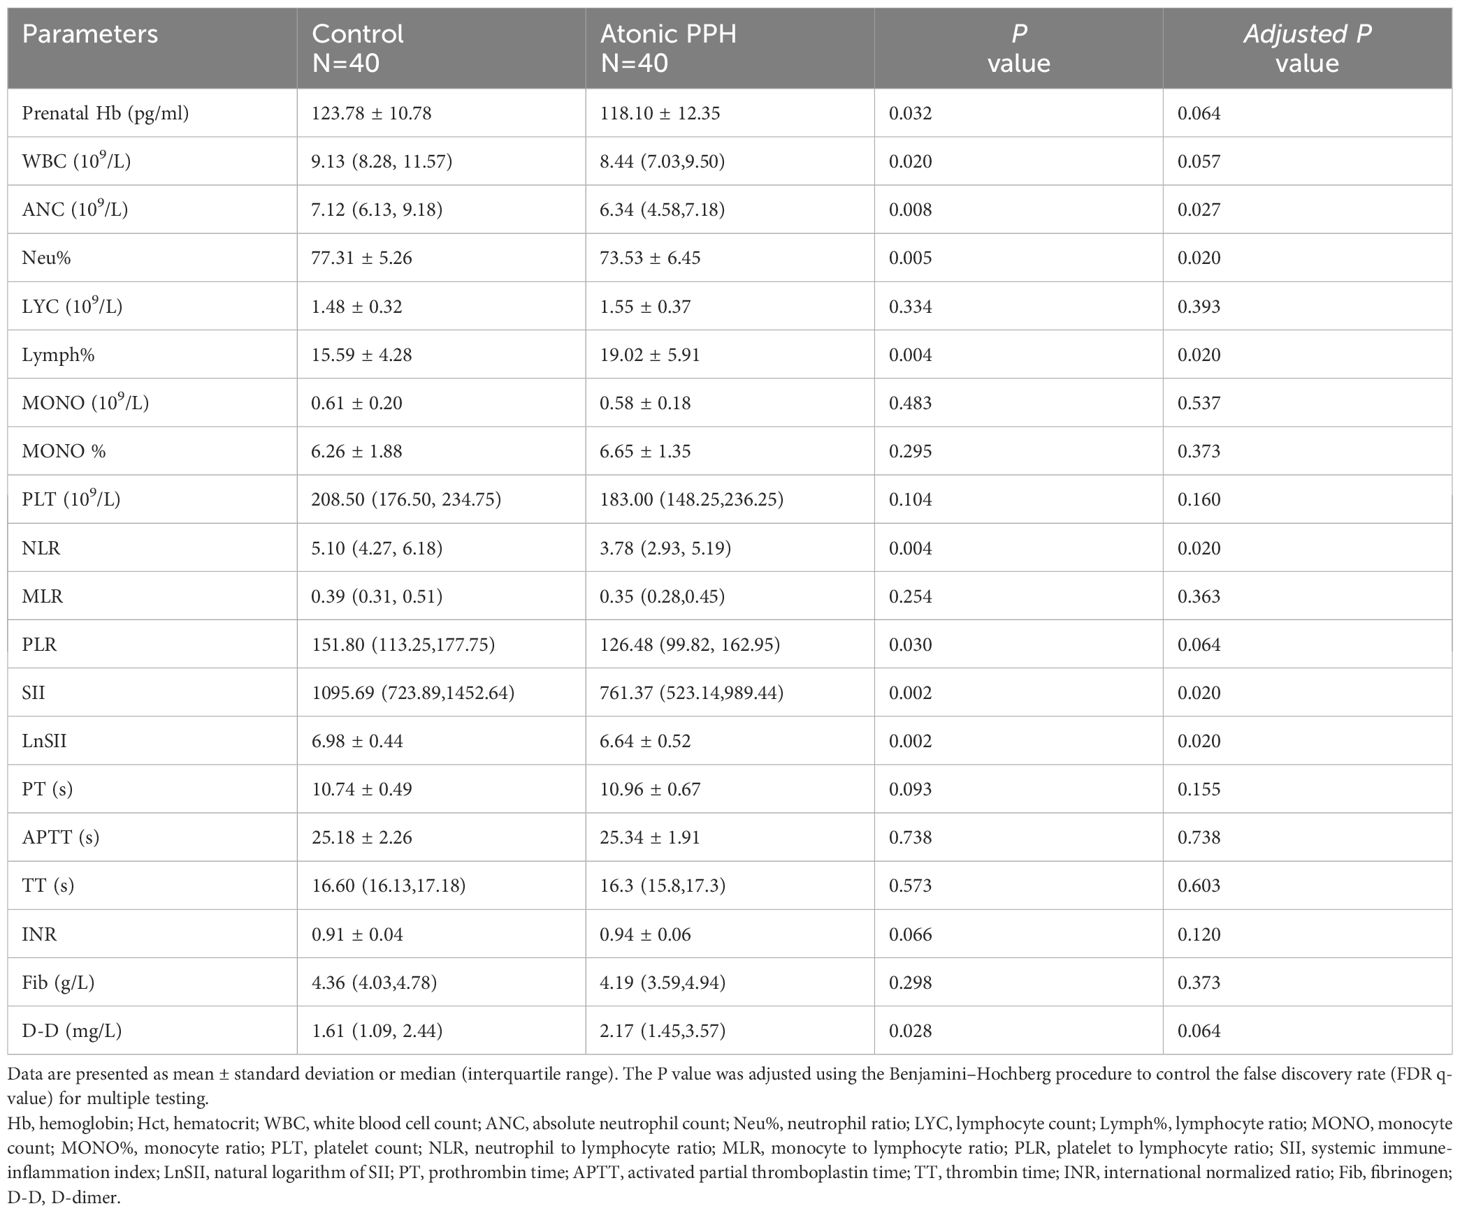
Table 3 Hemogram and coagulation indices in atonic PPH and matched controls in training cohort.
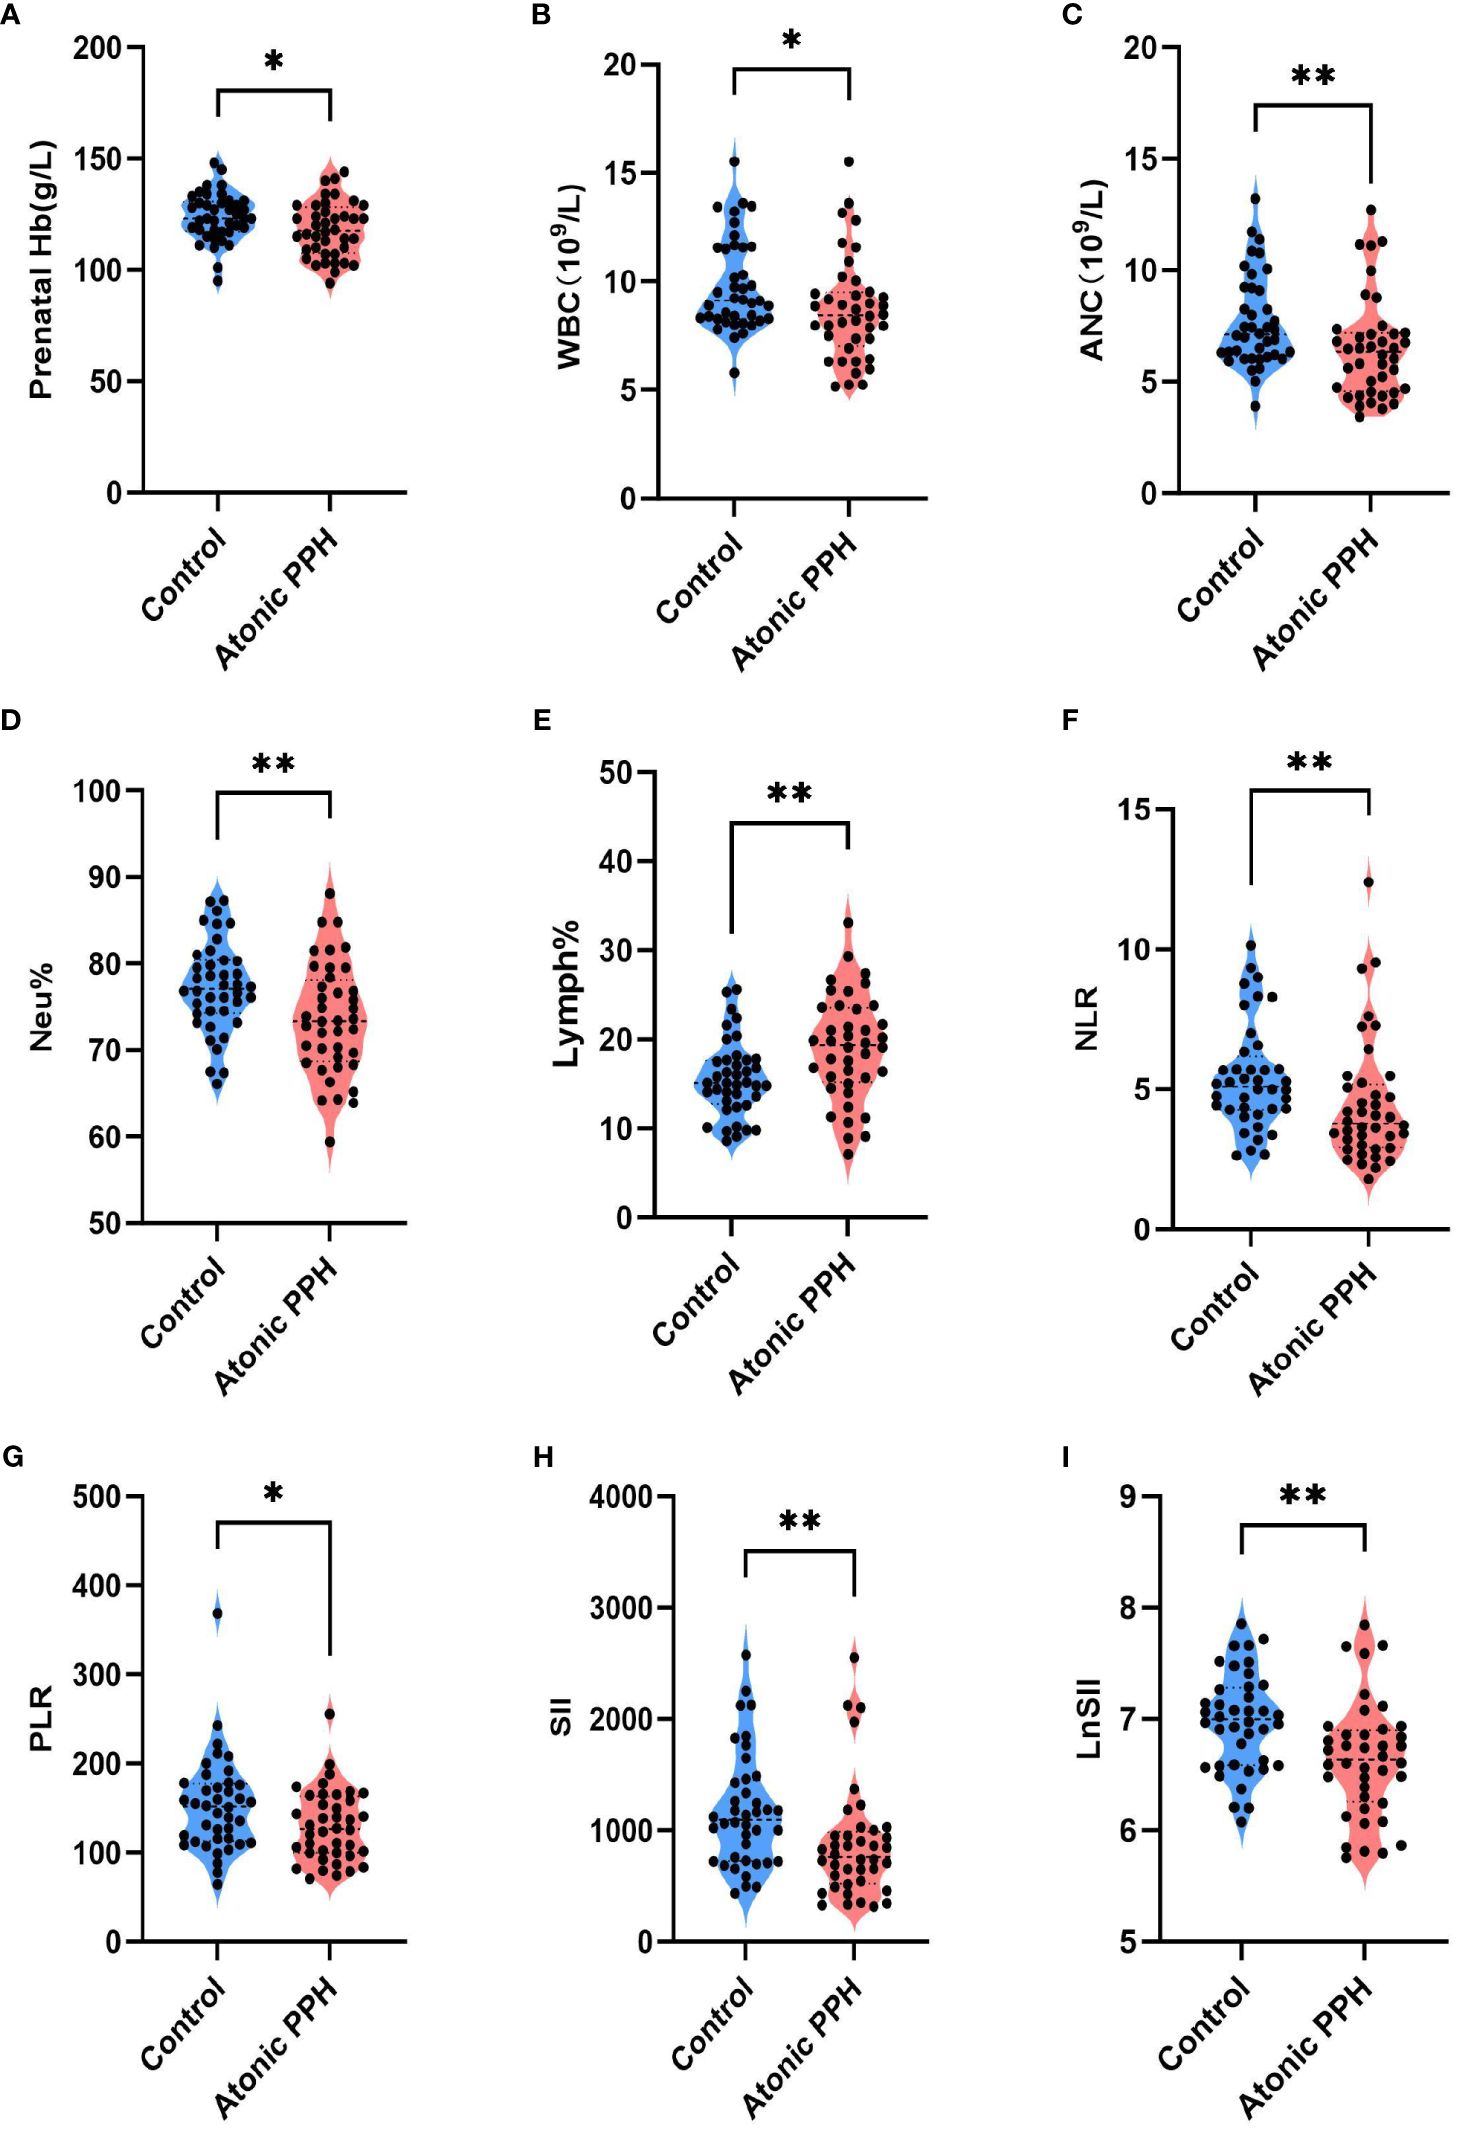
Figure 3 (A–I) Violin plots show significant differences in 9 hemogram and coagulation indicators between the atonic PPH group and the normal control group, including (A) Prenatal Hb, (B) WBC, (C) ANC, (D) Neu%, (E) Lymph%, (F) NLR, (G) PLR, (H) SII and (I) LnSII. Hb, hemoglobin; WBC, white blood cell count; ANC, absolute neutrophil count; Neu%, proportion of neutrophils; Lymph%, proportion of lymphocytes; NLR, neutrophil-to-lymphocyte ratio; PLR, platelet-to-lymphocyte ratio; SII, systemic immune-inflammation index; LnSII, natural logarithm of SII. Independent samples t-test was employed for Prenatal Hb, Neu%, Lymph% and LnSII. Mann-Whitney U test was used for WBC, ANC, NLR, PLR, and SII. * P<0.05; ** P<0.01; *** P<0.001.
Screening of predictors for atonic PPH in low-risk women
To mitigate the influence of multicollinearity between variables, LASSO was conducted for screening from the initial 14 differentially expressed variables (5 cytokines and 9 hemogram- and coagulation-related parameters). By gradually compressing the variable coefficients as the penalty coefficient λ changed (Figure 4), overfitting was avoided. When λmin=0.02388906, nine factors with non-zero regression coefficients were selected: IL−2Rα (AUC: 0.715, 95% CI 0.600–0.829, P< 0.001), IL−9 (AUC: 0.677, 95% CI 0.554–0.800, P = 0.003), TNF−β (AUC: 0.657, 95% CI 0.535–0.764, P = 0.017), MIP1β (AUC: 0.626, 95% CI 0.501–0.752, P = 0.026), CTACK (AUC: 0.638, 95% CI 0.513–0.767, P = 0.039), prenatal Hb (AUC: 0.637, 95% CI 0.514–0.760, P = 0.017), Lymph% (AUC: 0.688, 95% CI 0.568–0.807, P = 0.002), PLR (AUC: 0.641, 95% CI 0.519–0.762, P = 0.015), and LnSII (AUC: 0.705, 95% CI 0.589–0.821, P = 0.001) (Supplementary Table S2). Their ROC curves were presented in Figure 5.
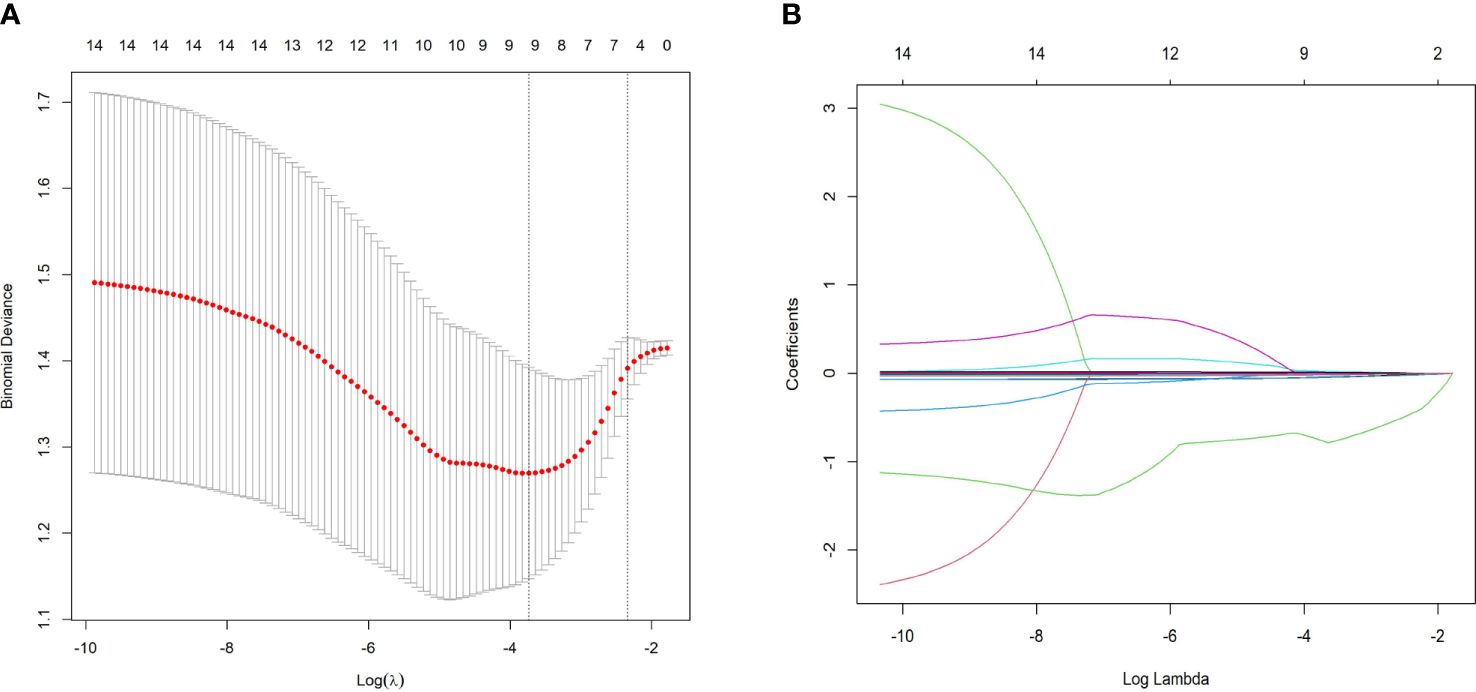
Figure 4 Predictor selection using LASSO regression analysis with tenfold cross-validation. (A) LASSO coefficient profiles of the 14 risk factors were created against the log (λ) sequence. (B) Tuning parameter (lambda, λ) selection of deviance in the LASSO regression based on the minimum criterion (left dotted line) and the 1-SE criterion (right dotted line). In the present study, predictor selection was performed according to the minimum criterion (including Prenatal Hb, Lymph%, PLR, LnSII, IL2Rα, MIP1β, TNFβ, CTACK, and IL9). LASSO least absolute shrinkage and selection operator, SE standard error.
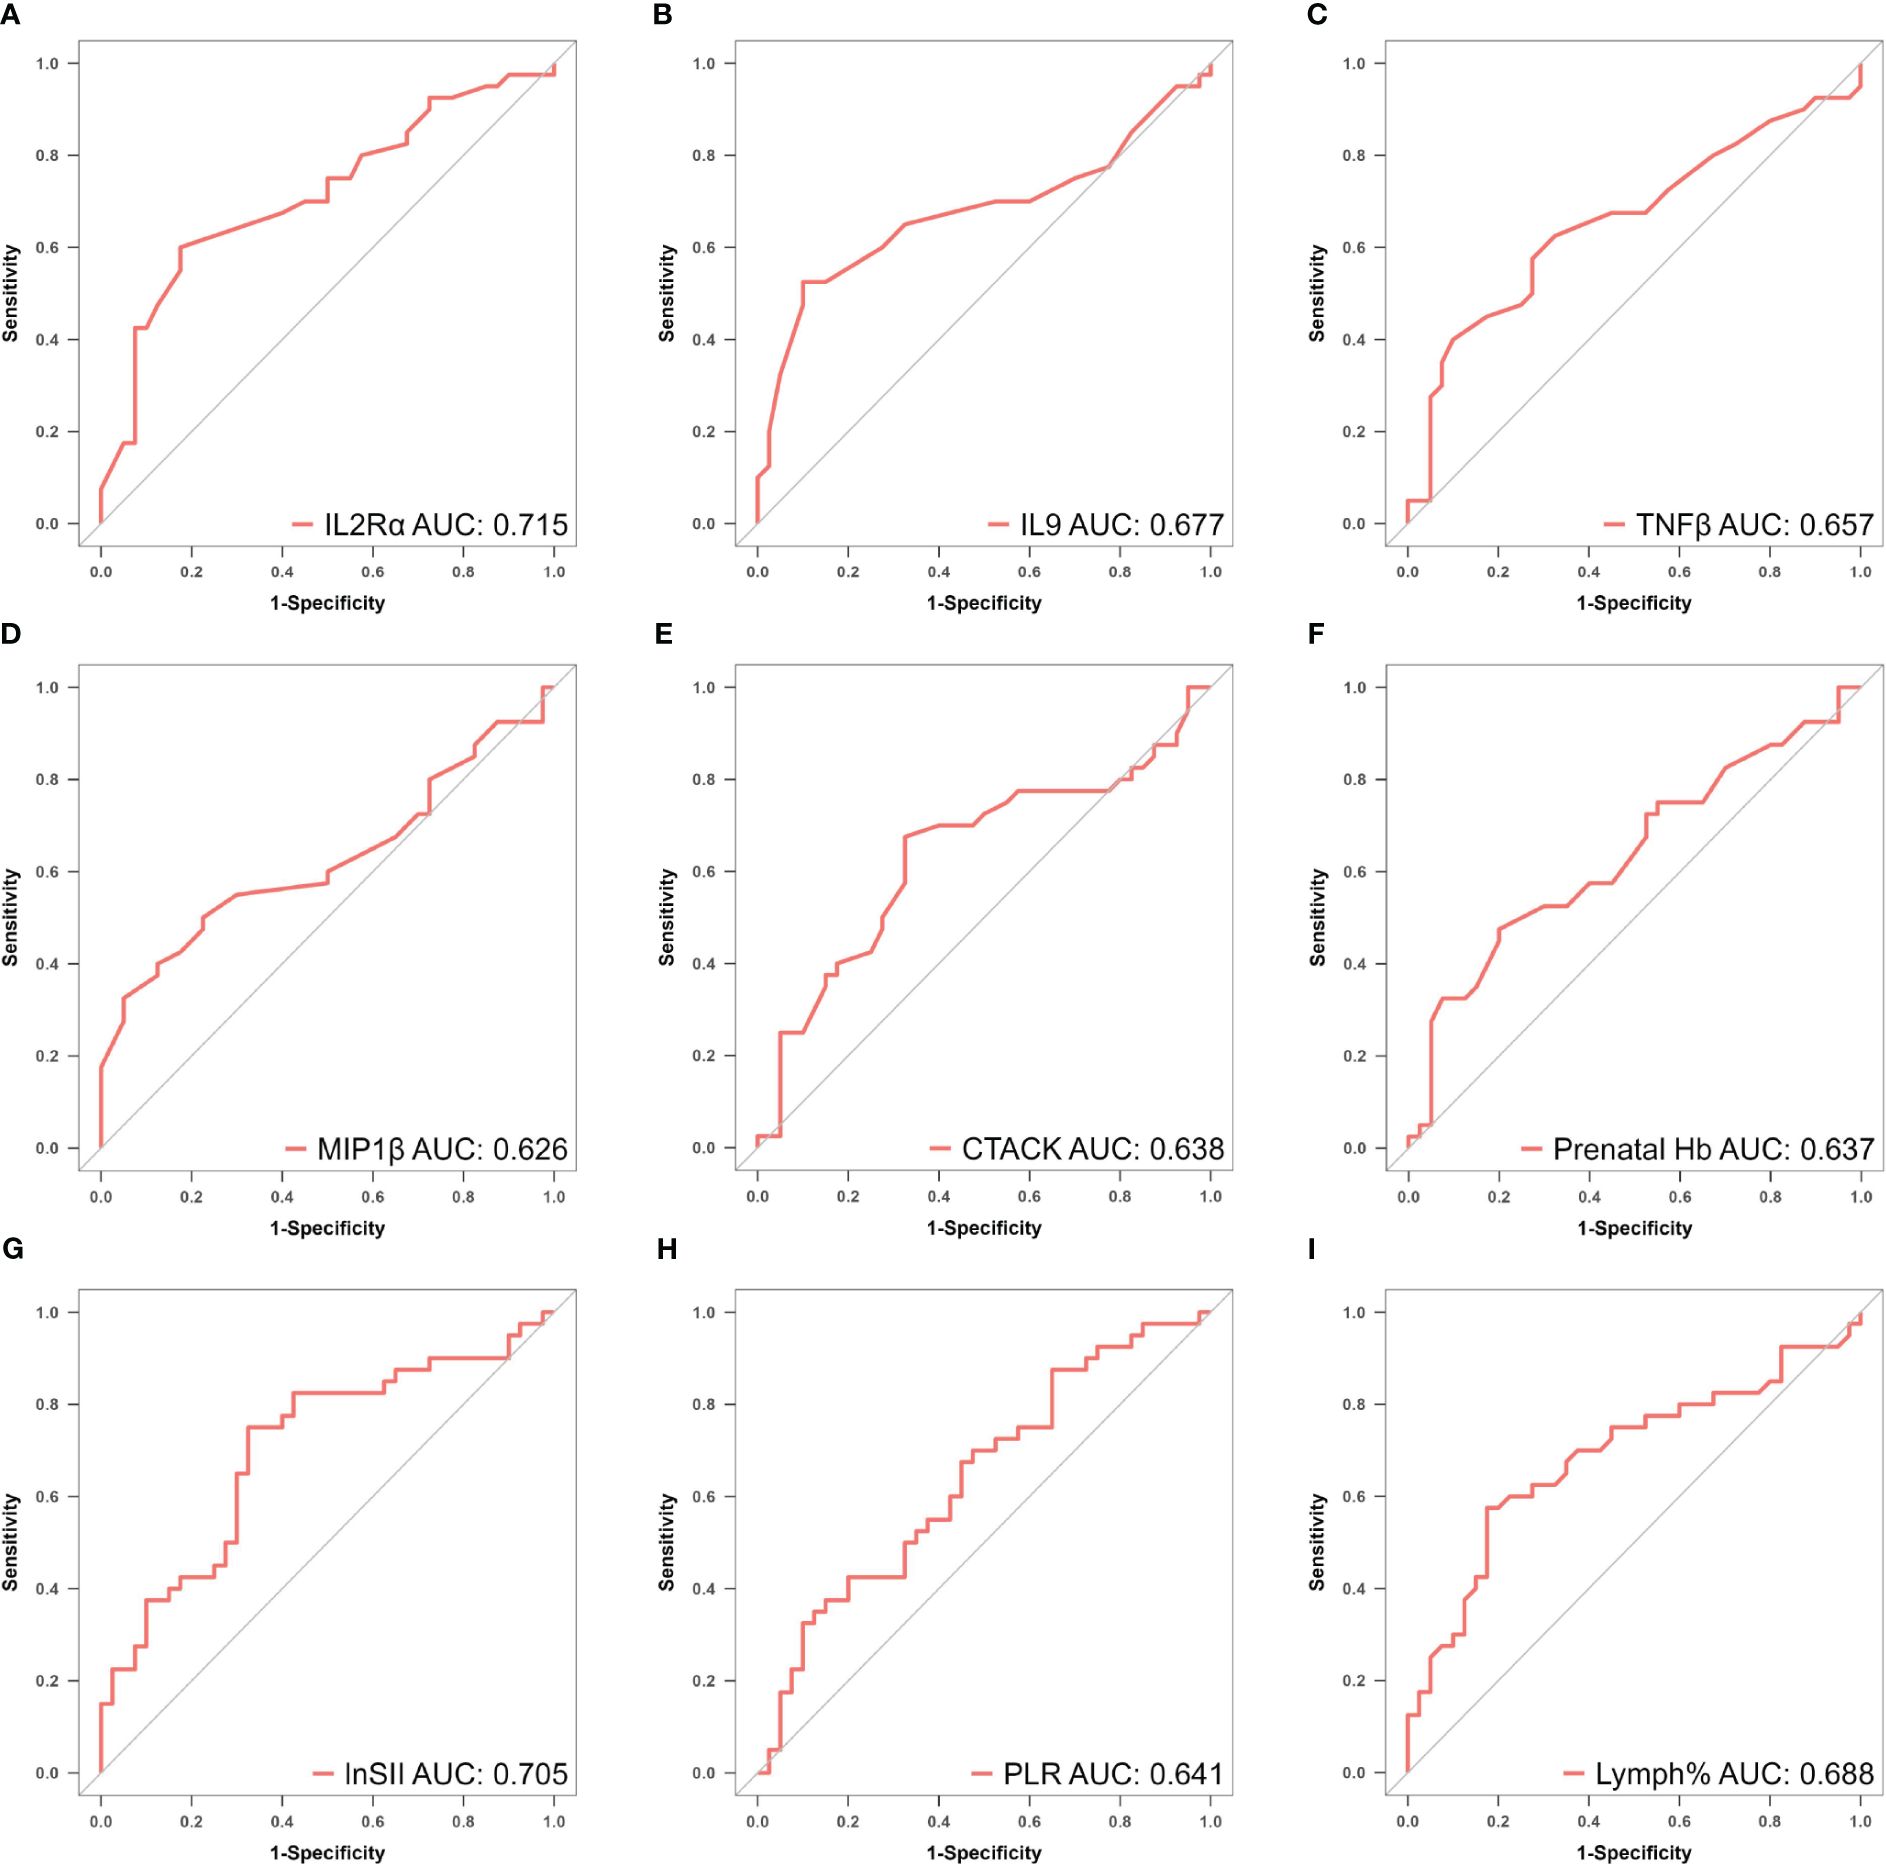
Figure 5 (A–I) ROC curves of identified biomarkers for atonic PPH: (A) IL−2Rα (AUC: 715, 95% CI 0.600–0.829, P < 0.001), (B) IL−9 (AUC: 0.677, 95% CI 0.554–0.800, P = 0.003), (C) TNF−β (AUC: 0.657, 95% CI 0.535–0.764, P = 0.017), (D) MIP1β(AUC: 0.626, 95% CI 0.501–0.752, P = 0.026), (E) CTACK (AUC: 0.638, 95% CI 0.513–0.767, P = 0.039), (F) Prenatal Hb (AUC: 0.637, 95% CI 0.514–0.760, P = 0.017), (G) Lymph% (AUC: 0.688, 95% CI 0.568–0.807, P = 0.002), (H) PLR (AUC: 0.641, 95% CI 0.519–0.762, P = 0.015), and (I) LnSII (AUC: 0.705, 95% CI 0.589–0.821, P = 0.001). IL2Rα, interleukin-2 receptor subunit α; MIP1β, macrophage inflammatory protein-1β; TNF-β, tumor necrosis factor-β; IL9, interleukin-9; CTACK, cutaneous T cell-attracting chemokine; Hb, hemoglobin; Lymph%, lymphocyte ratio; PLR, platelet-to-lymphocyte ratio; SII, systemic immune-inflammation index; LnSII, natural logarithm of SII; ROC, receiver operating characteristic; AUC, area under the ROC curve.
Construction of the predictive models
The nine factors selected by LASSO were all used to construct predictive model A (Supplementary Table S3). Subsequently, to further control the influence of confounding factors, the above nine factors were analyzed using logistic regression. Finally, only prenatal Hb, PLR, IL2Rα, and IL9 were determined to be independent predictors (P< 0.05), as shown in Supplementary Table S4. These four factors were used to develop model B accordingly. The formulas for both predictive models are presented below:
Predictive nomograms for atonic PPH
The “rms” package was used to draw nomograms for atonic PPH in women with vaginal delivery (Figure 6), which could predict the risk of atonic PPH in individual patients. In clinical application, the individual score for each predictor could be acquired and then added together to obtain the total score. Finally, on the number axis of the total score, the corresponding predicted probability projected downward would be the risk of atonic PPH for individuals.
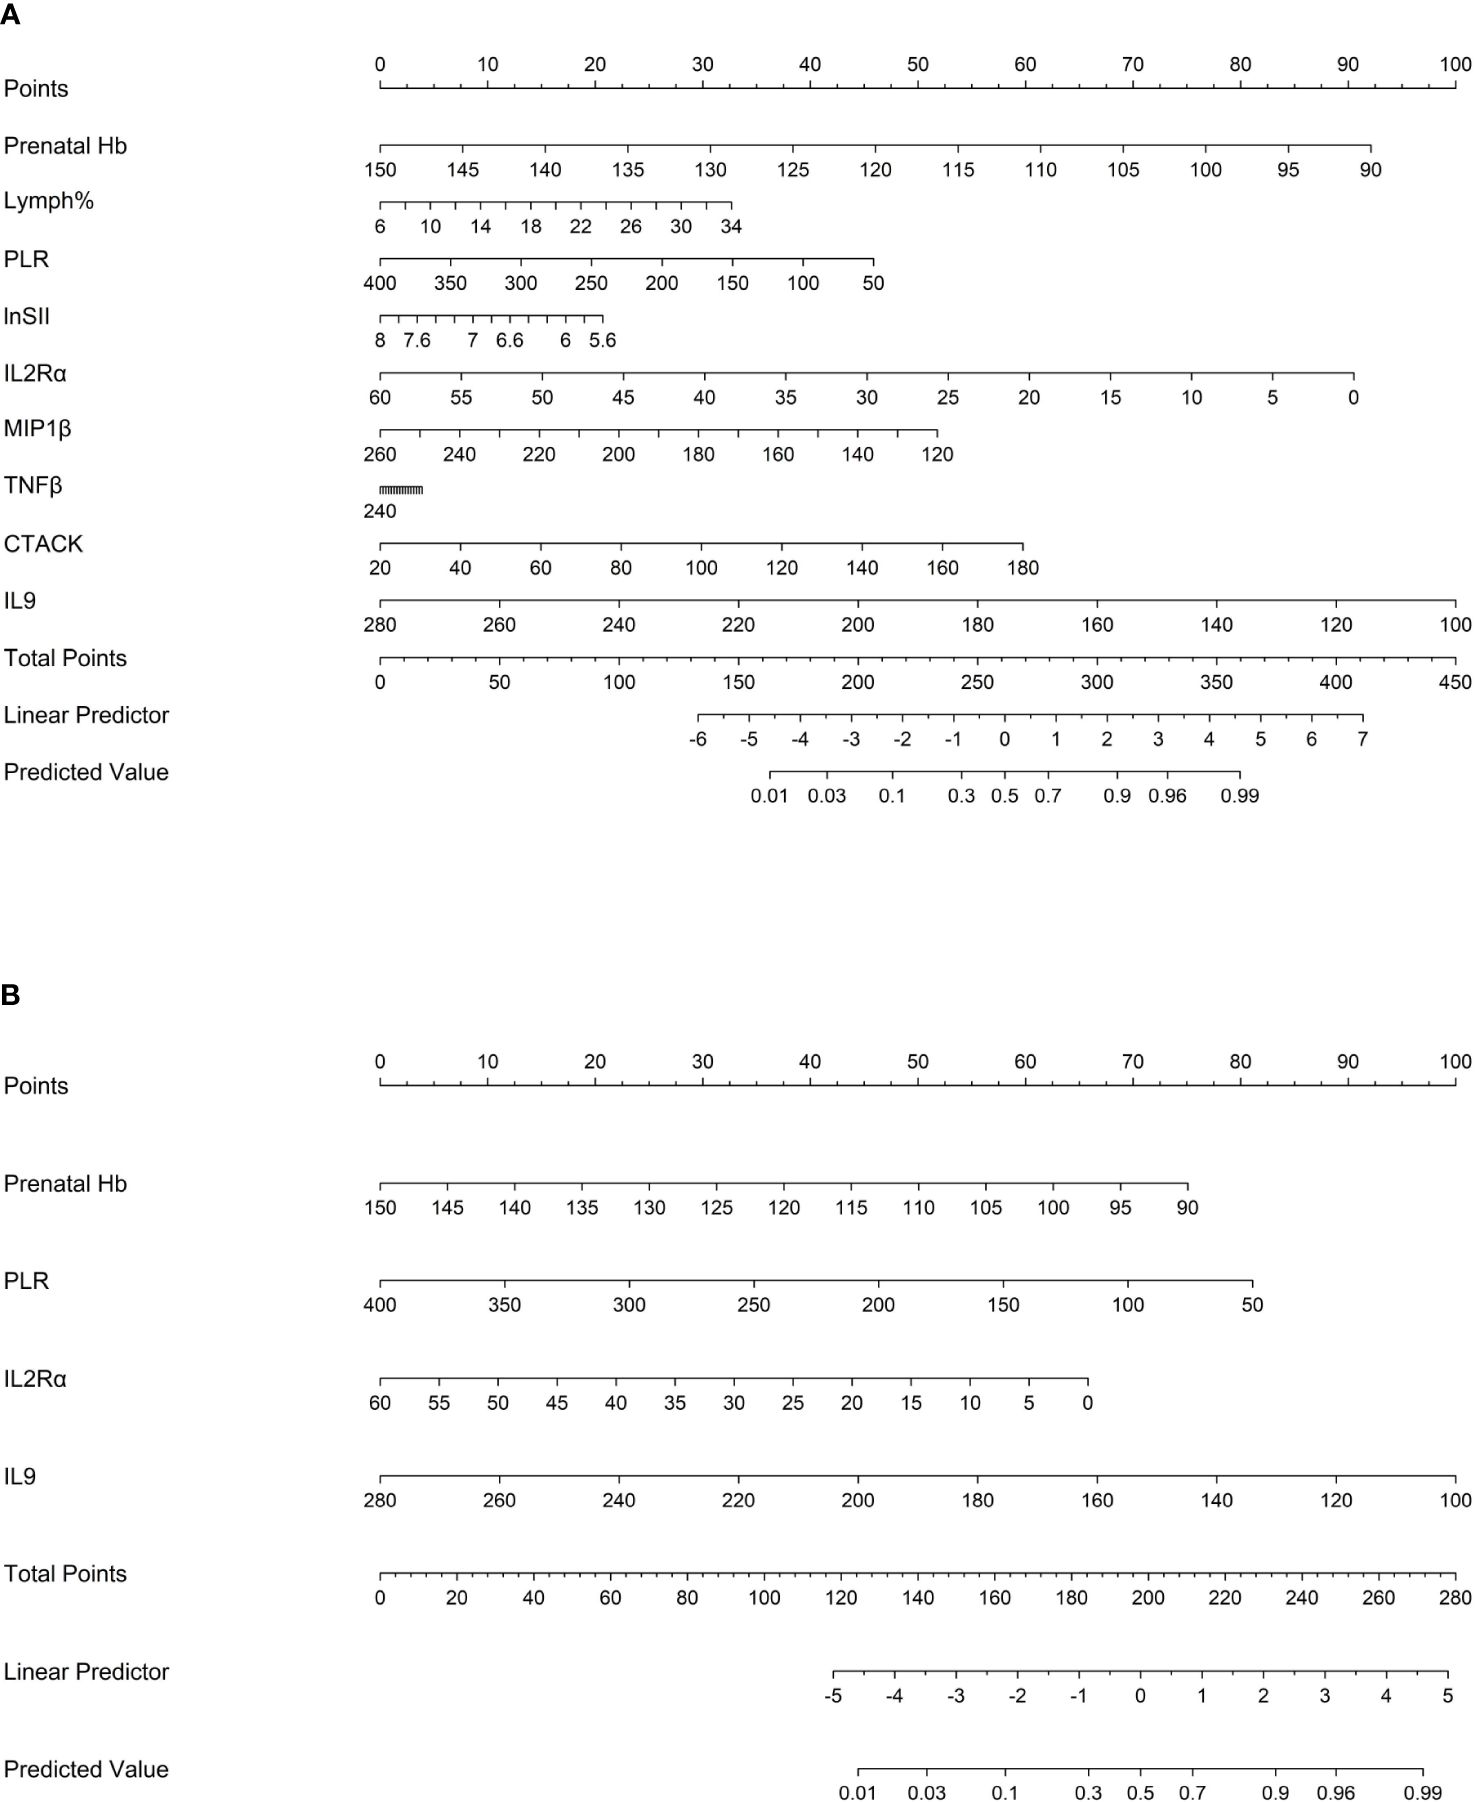
Figure 6 Nomogram1 and nomogram2 were constructed to predict the incidence of atonic PPH among women in labor. (A) Nomogram1 including IL2Rα, IL9, MIP1β, TNF-β, CTACK, Prenatal Hb, Lymph%, PLR, and LnSII for assessing the risk of atonic PPH among women in labor. (B) Nomogram2 including IL2Rα, IL9, Prenatal Hb, and PLR for assessing the risk of atonic PPH among women in labor. Nomogram1 and nomogram2 are used to obtain the risk of atonic PPH by adding up the points identified on the points’ scale for each variable. IL2Rα, interleukin-2 receptor subunit α; MIP1β, macrophage inflammatory protein-1β; TNF-β, tumor necrosis factor-β; IL9, interleukin-9; CTACK, cutaneous T cell-attracting chemokine; Hb, hemoglobin; Lymph%, lymphocyte ratio; PLR, platelet-to-lymphocyte ratio; SII, systemic immune-inflammation index; LnSII, natural logarithm of SII.
Temporal validation
ELISA was employed to quantify IL2Rα, MIP1β, TNFβ, CTACK, and IL9 levels in maternal plasma obtained from a prospective cohort. Relevant predictive laboratory parameters (Prenatal Hb, Lymph%) were extracted from electronic medical records and hemogram-derived indices (PLR, LnSII) were calculated. The results revealed significant lower levels of IL2Rα (P<0.001), MIP1β (P<0.001), TNFβ (P<0.001), and IL9 (P<0.001) in the atonic PPH group compared to the control group. Conversely, CTACK levels were found to be significantly elevated in women with atonic PPH compared to the matched control group (P<0.001). Furthermore, lower levels of Prenatal Hb (P = 0.004), PLR (P = 0.007), and LnSII (P = 0.005) were observed in women diagnosed with atonic PPH, while Lymph% (P = 0.026) showed a significant increase in this group (Table 4, Figure 7).
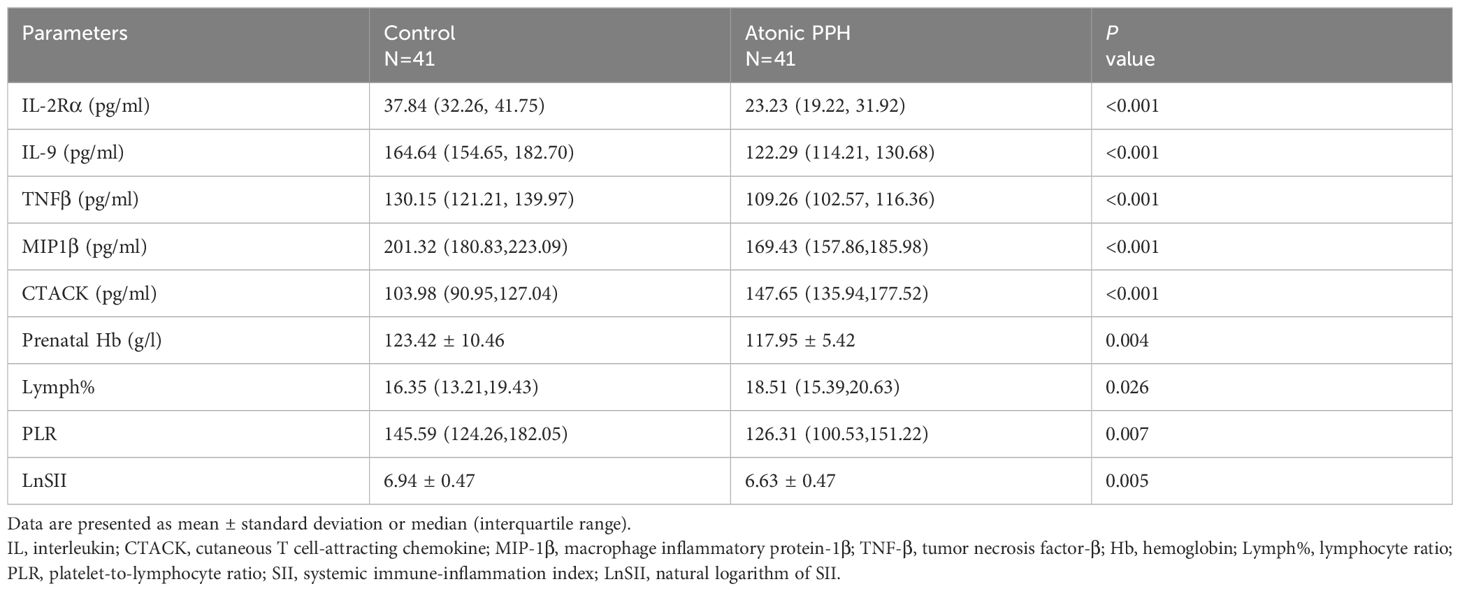
Table 4 Validation of differentially expressed markers in a prospective cohort.
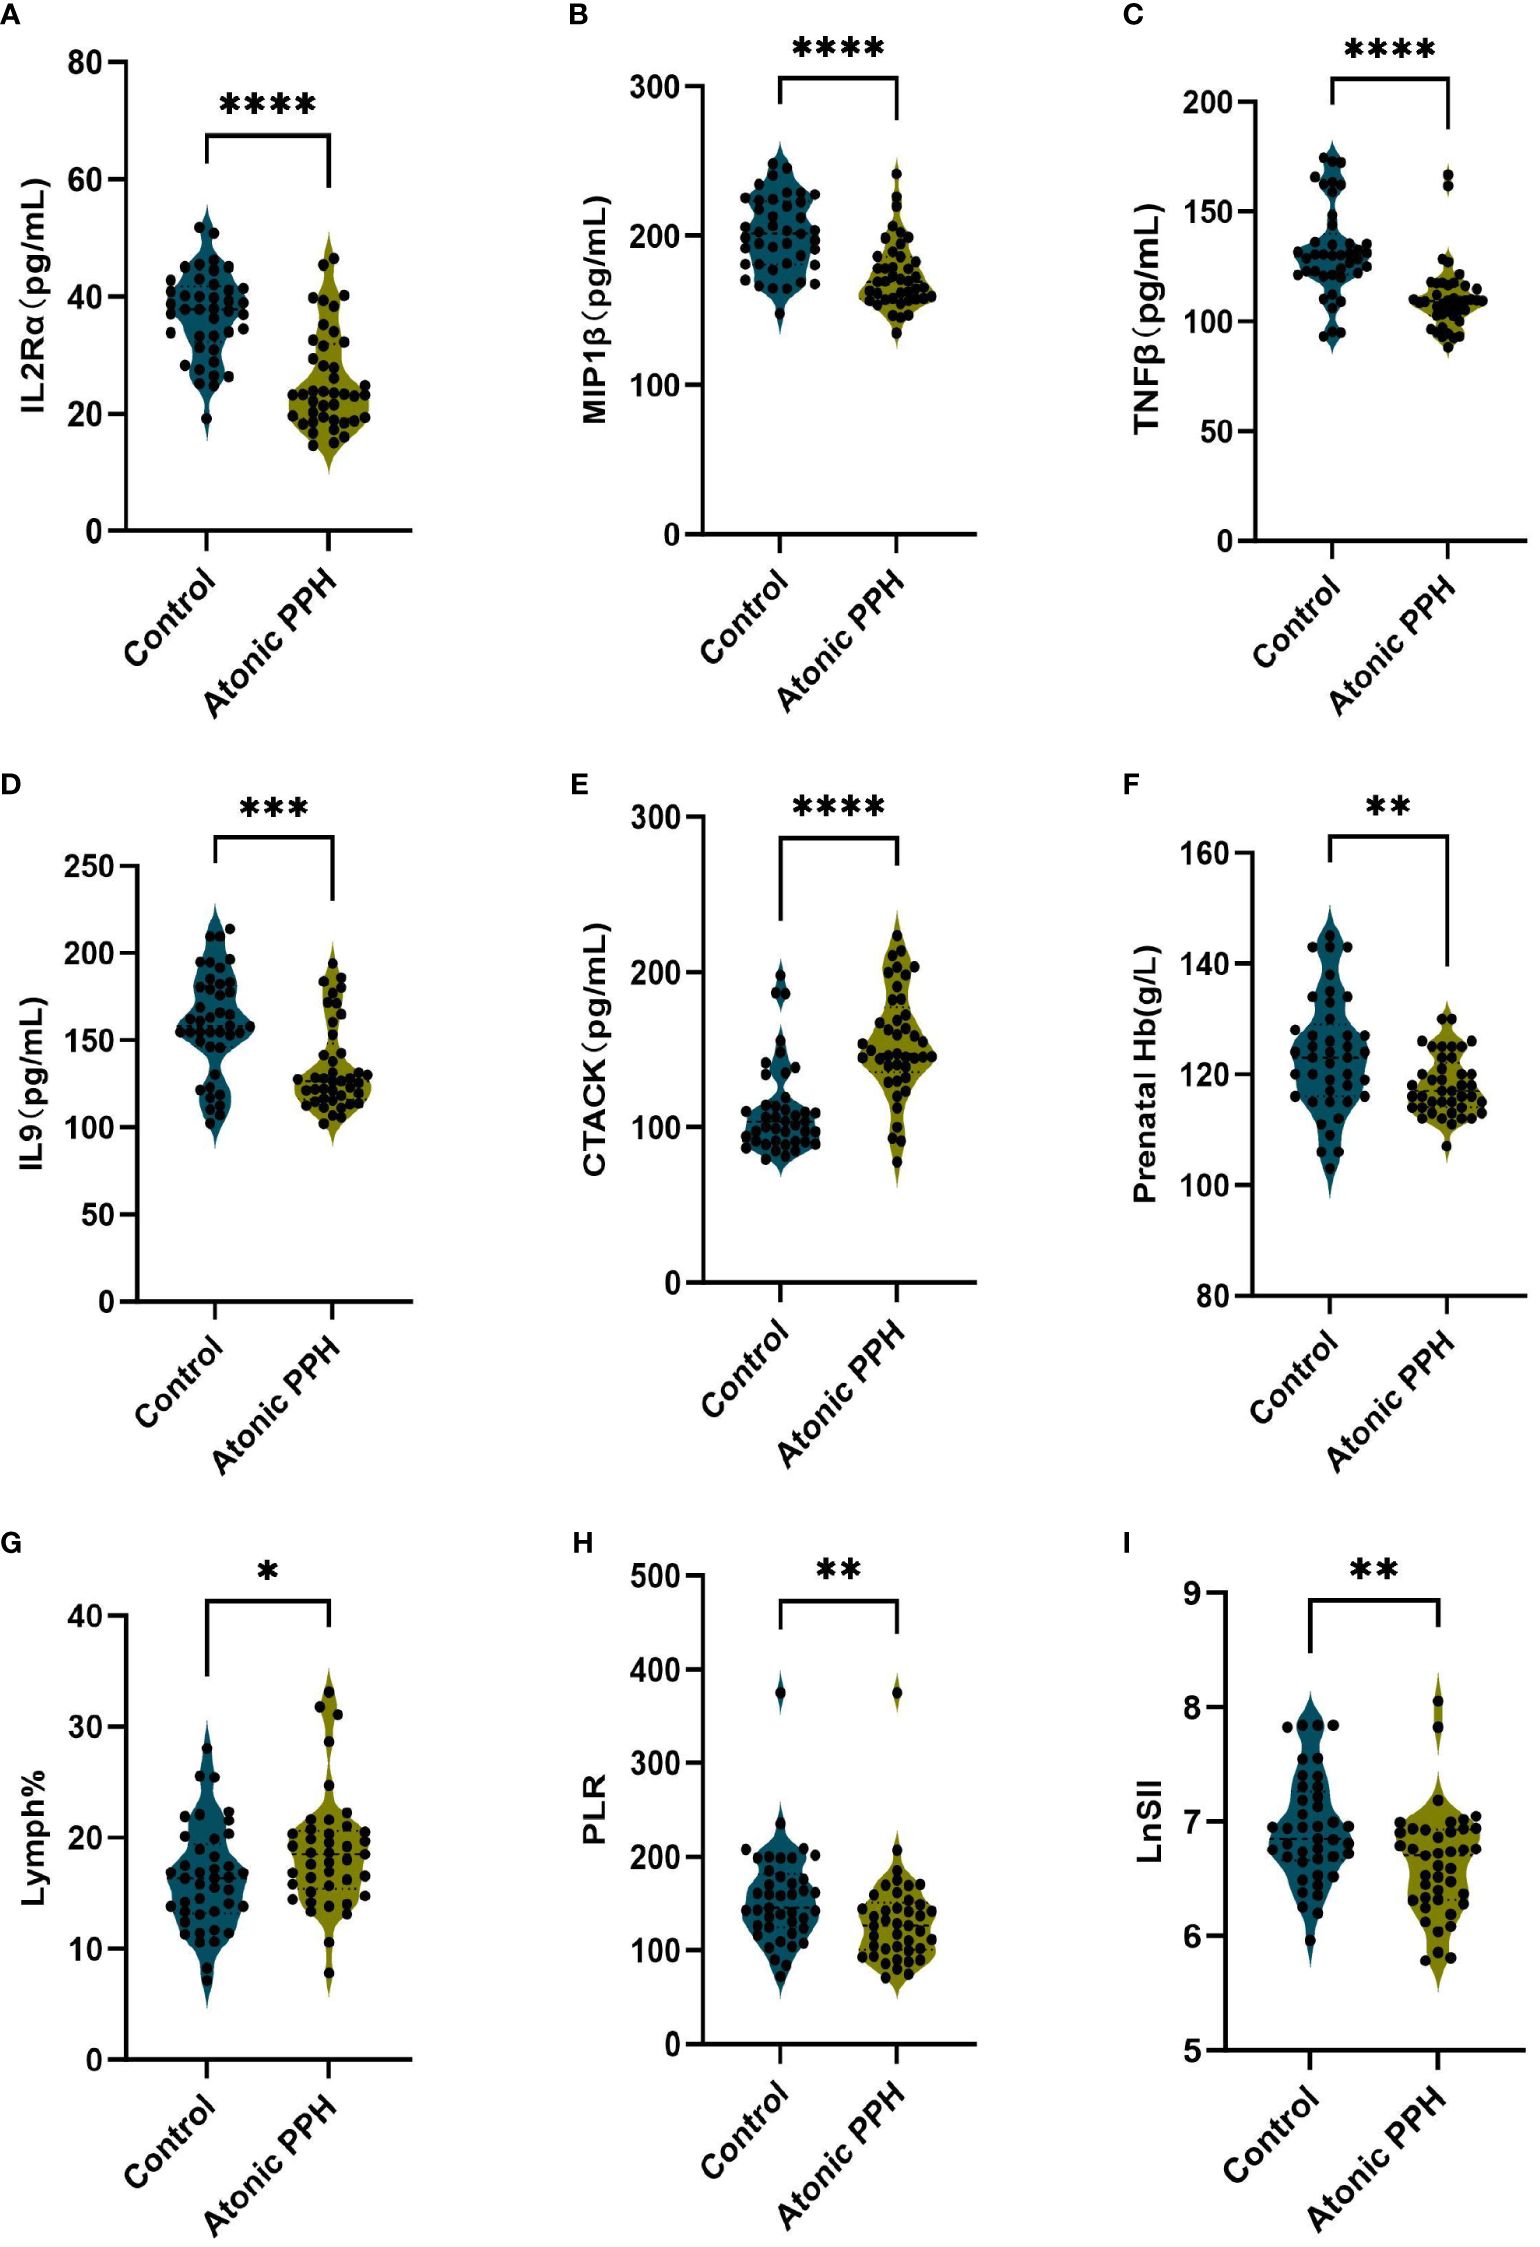
Figure 7 (A–I) Violin plots illustrate validated differentially expressed biomarkers between the atonic PPH group and control group in a prospective cohort, including (A) IL-2rα, (B) IL-9, (C) TNF-β, (D) MIP1β, (E) CTACK, (F) Prenatal Hb, (G) Lymph%, (H) PLR and (I) LnSII. IL-2rα, interleukin−2Rα; IL-9, interleukin−9; TNF-β, tumor necrosis factor−β; MIP1β, macrophage inflammatory protein-1β; CTACK, cutaneous T cell-attracting chemokine; Hb, hemoglobin; Lymph%, proportion of lymphocytes; PLR, platelet-to-lymphocyte ratio; LnSII, natural logarithm of SII. Data are presented as mean ± standard deviation or median (interquartile range). Independent samples t-test was employed for Prenatal Hb and LnSII. Mann-Whitney U test was used for IL-2rα, IL-9, TNF-β, MIP1β, CTACK, Lymph% and PLR. * P <0.05; ** P <0.01; *** P <0.001; **** P <0.0001.
Evaluation of models
Discrimination
The AUC values for model A in the training set, internal validation set, and temporal validation set were 0.846 (0.757–0.934), 0.846 (0.749–0.930), and 0.875 (0.789–0.961) respectively. The corresponding AUC values for model B were 0.805 (0.709–0.901), 0.805 (0.701–0.894), and 0.901 (0.824–0.979). ROC curves was plotted for both model A and model B (Figure 8). The accuracy, sensitivity, and specificity of model A in the training cohort were 0.813, 0.850, and 0.775 respectively, while in the validation cohort they were 0.756, 0.902 and 0.625 respectively. The corresponding values for model B in the training cohort were 0.750, 0.725 and 0.775, whereas in the validation cohort they were measured as 0.841, 0.854 and 0.829.
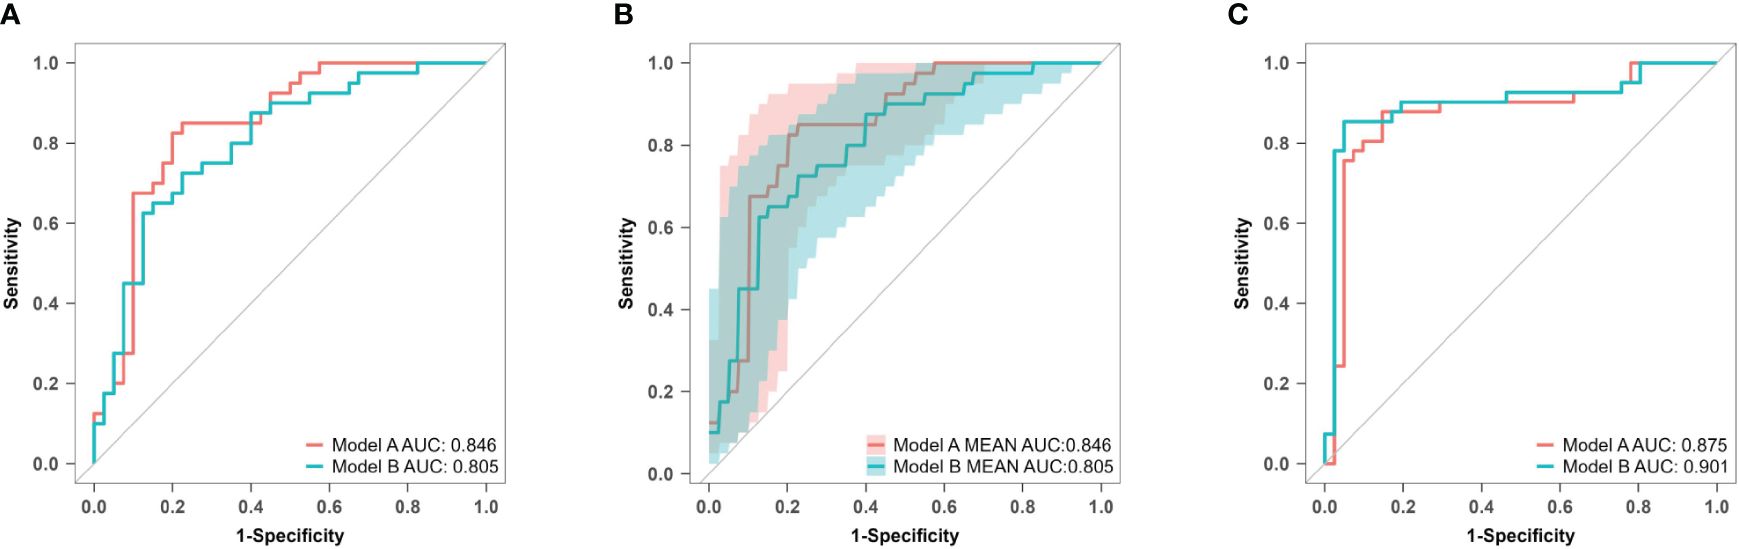
Figure 8 ROC curves of model A and model B for predicting atonic PPH. (A) ROC curves of predictive models A and B in the training set. Model A (AUC: 0.846, 95% CI 0.757–0.934, P< 0.001), model B (AUC: 0.805, 95% CI 0.709–0.901, P< 0.001). (B) ROC curves of predictive models A and B in the internal validation set. Model A (AUC: 0.876, 95% CI 0.749–0.930, P< 0.001), model B (AUC: 0.805, 95% CI 0.701–0.894, P< 0.001). (C) ROC curves of predictive models A and B in the temporal validation set. Model A (AUC: 0.875, 95% CI 0.789–0.961, P< 0.001), model B (AUC: 0.901, 95% CI 0.824–0.979, P< 0.001). ROC receiver operating characteristic, AUC area under the ROC curve.
Calibration
For model A, the P values of the H-L test were 0.088 in the training set and< 0.001 in the prospective validation cohort. For model B, the corresponding values were 0.827 and 0.158. Calibration curves for both models are presented in Figure 9. The results indicate that model A exhibited poor fitting performance on the prospective validation set. Furthermore, the calibration curve revealed that the predicted values of model A demonstrated greater deviation from the ideal calibration curve. In contrast, model B exhibits superior calibration on the prospective validation set.
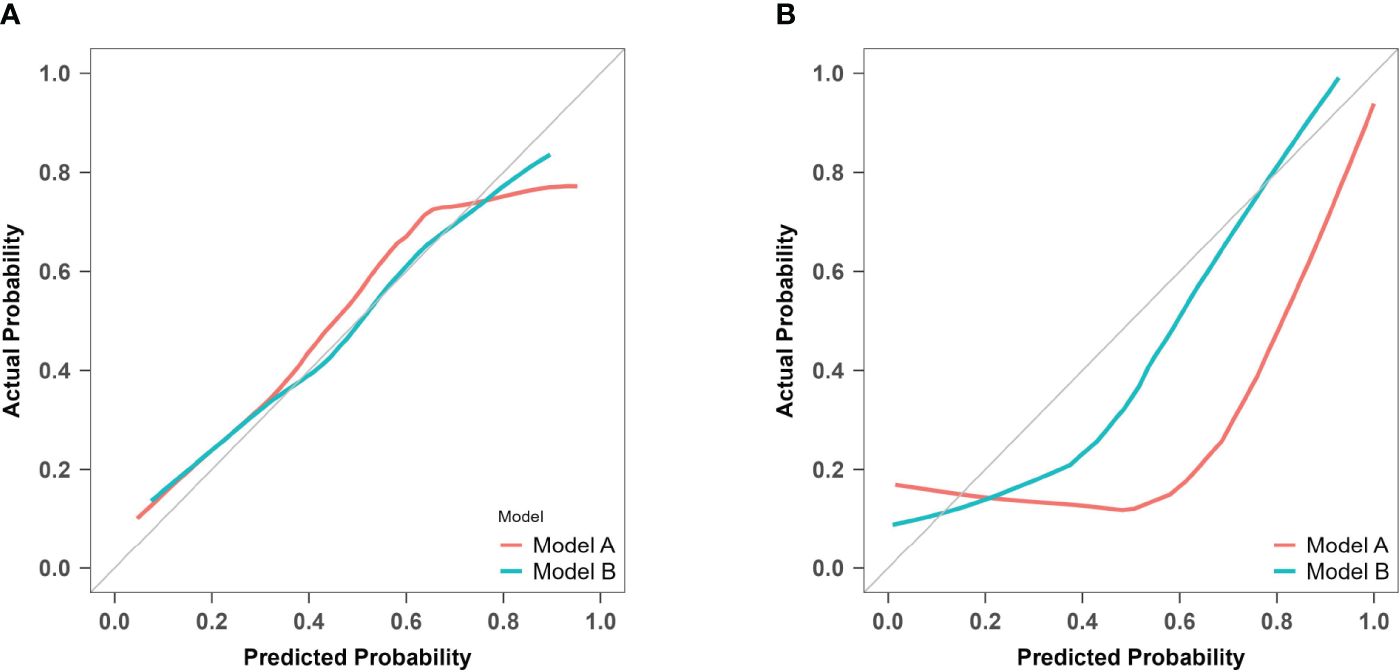
Figure 9 Calibration curves of model A and model B for predicting atonic PPH. (A) Calibration curves for the training cohort of predictive models A and B The red line (Bias corrected line for model A) and the green line (Bias corrected line for model B) represent the performance during internal validation by bootstrapping (B = 1000 repetitions). (B) Calibration curves for the prospective validation of predictive models A and B The red line (Apparent line for model A) and the green line (Apparent line for model B) represent the original performance in a prospective cohort.
Clinical utility
DCA was used to evaluate model A and model B in both the training set and the temporal validation set (Figure 10). Both models showed better net benefit for predicting atonic PPH across all potential thresholds (0% to 80%). This suggested that both models achieved a more optimal balance of clinical intervention for atonic PPH, regardless of the chosen risk threshold.
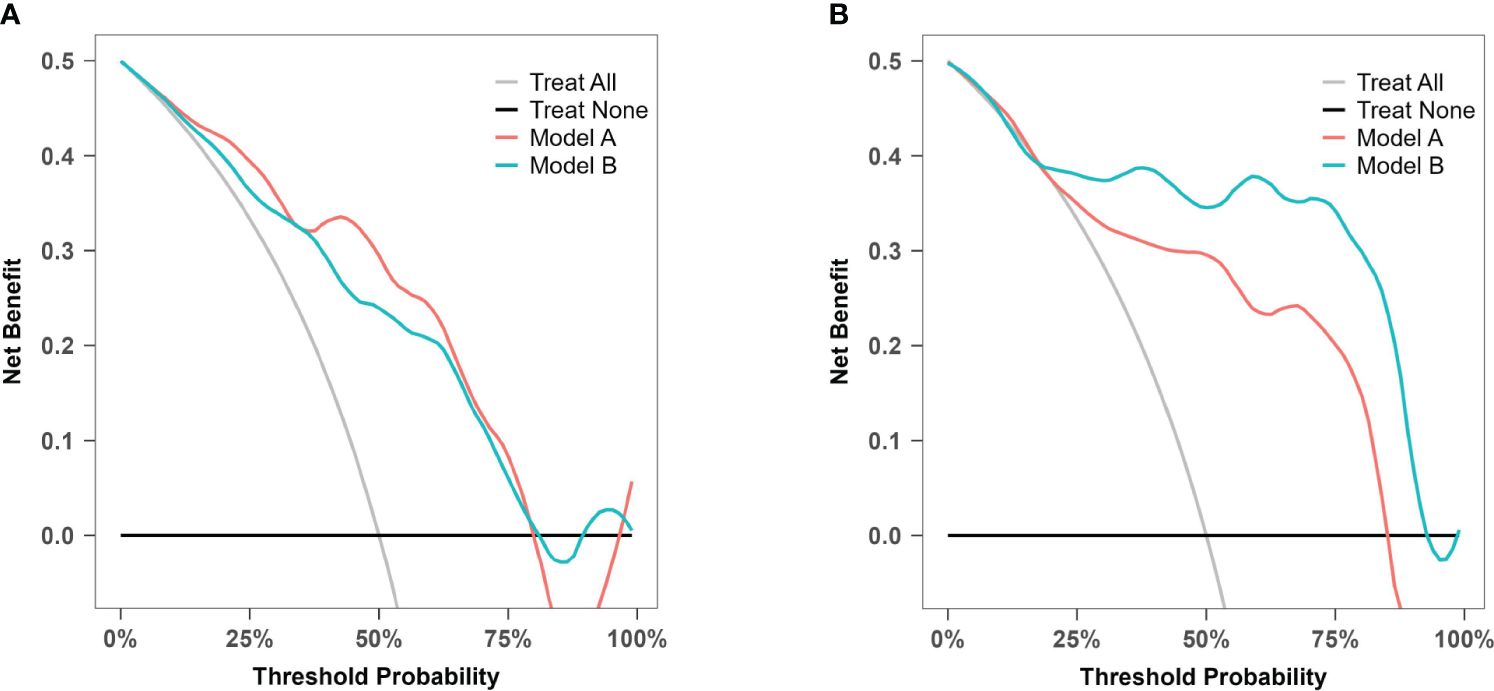
Figure 10 Decision curve analysis for model A and model B. (A) Decision curve analysis for prediction model A and B in the training cohort. (B) Decision curve analysis for prediction model A and B in the prospective validation cohort.
Discussion
Using LASSO and multivariate logistic regression, we developed predictive models A and B for atonic PPH in “low-risk” women based on samples from a retrospective cohort and matched controls. The performance of the models was assessed through both internal and temporal validation. The findings of this study suggested that model B was promising for clinical implementation.
Early identification of risk factors allows obstetric healthcare professionals to adequately prepare for potentially life-threatening hemorrhages (1). Numerous relevant risk factors are currently used in predictive models, with almost all mentioned in the literature being clinical indicators. The variables frequently included in predictive models include parity, antenatal hemoglobin level, antepartum bleeding, maternal age ≥35 years old, gestational age, newborn weight, multiple pregnancies, obesity, a history of previous cesarean section, and placenta previa (18). For instance, the California Maternal Quality Care Collaborative (CMQCC) developed risk stratification tools for PPH based on major clinical and laboratory risk factors (19). A retrospective study involving 10,134 patients demonstrated that this tool correctly identified 80% of severe PPH cases, but its specificity was only 60% (3). Besides, limited research has been performed specifically focusing on PPH in low-risk populations without apparent risk factors related to PPH. The PPH in these women, however, does not meet the expected low levels. There is thus still an urgent need to identify highly effective novel biomarkers for predicting PPH.
Prior to delivery, immune cells accumulate in the maternal reproductive system and at maternal-fetal interface through cytokine secretion, establishing an inflammatory environment (20–22). These cytokines play a pivotal role in the initiation of labor and their dysregulation may contribute to PPH. Jiang et al. reported significantly elevated levels of basic FGF, IL1α, IL1β, IL1ra, IL2Rα, IL16, IL18, M-CSF, MIP1α, β-NGF, TRAIL and SCF were associated with an increased risk of atonic PPH (23). Gallo et al. found significantly higher concentrations of IL16, IL6, IL12/IL23p40, MCP1 and IL1β in the PPH group compared to the control group (24). Both studies identified significant biomarkers including IL16 and IL1β associated with PPH. In this study, we observed notable levels of IL2Rα, TNFβ, MIP1β, IL9 and higher level of CTACK in atonic PPH group. The discrepancy between our study results and previous studies (23, 24) may be attributed to differences in the populations included and the timing of specimen collection: specimens collected by Jiang et al. were obtained in late third trimester (37–41 weeks), while those collected by Gallo et al. were within three days prior delivery. However, the samples in this study were collected during the latent phase of the first stage of labor, characterized by the presence of regular contractions. Cytokine concentrations undergo continuous changes throughout pregnancy and labor progression. Further research is needed to investigate the correlation between cytokine levels at different gestational time points and their association with PPH.
Hemogram and coagulation parameters have significant predictive value for PPH. A previous case-control study showed that individuals with a fibrinogen level below 2 g/L are significantly predisposed to severe bleeding (25). Another retrospective study identified PLT< 150×109/L and an increased APTT ratio as independent risk factors for PPH (26). SII has been proven to have prognostic and diagnostic value in various diseases including infection, tumor development, and cardiovascular disease, indicating its potential significance for assessing immune status and the inflammatory response (27–29). However, the relationship between SII and pregnancy-related outcomes remains unclear. Our findings suggest that prenatal Hb levels, Lymph% PLR, and LnSII showed certain predictive value for atonic PPH.
In contrast to the case for other pregnancy-related complications, the prediction of PPH is theoretically more accurate as parturition approaches. The present study explored the incidence of atonic PPH from a novel perspective, specifically investigating the correlation between maternal biomarkers and the incidence of PPH at the presence of regular uterine contraction. By using peripheral blood samples collected during the latent first stage after spontaneous labor, this study identified novel biomarkers for atonic PPH. Secondly, to address potential issues of multicollinearity compromising model robustness when solely using a logistic regression model, this study initially screened for factors showing intergroup differences and subsequently adding LASSO to logistic regression analysis. This study revealed low prenatal Hb, PLR, IL2Rα, and IL9 as factors independently predictive of atonic PPH. The predictive model based on these four factors exhibited favorable validation outcomes in a temporal validation cohort, emphasizing its clinical utility and suggesting its potential as a viable model for predicting atonic PPH.
The limitations of this study include a relatively small sample size and data derived from a single center, which may introduce selection bias. Future research should focus on larger sample sizes, multi-center data, and prospective trials to further identify and confirm risk factors for atonic PPH in the general population. This study did not include women who underwent cesarean section, since the onset of delivery is closely related to inflammatory responses and selective cesarean section is unrelated to this process. Additionally, owing to different immune characteristics between women undergoing spontaneous labor and induced labor (30), this study does not involve the population undergoing induced labor. The cohort data used in this study only include primiparous women because the labor characteristics of primiparous and multiparous women differ. Further studies should expand the demographic category. For both model A and model B, the AUC values obtained from prospective validation were higher than those from the training set, which may be attributable to changes in detection methods. In the training set, Bio-Plex Pro Human Cytokine 48-Plex Screening Panel was used to simultaneously determine the expression levels of 48 cytokines. However, targeted validation involving ELISA was performed on targeted cytokines in the prospective cohort. This study found that intergroup differences in cytokine levels detected by ELISA were more pronounced than those observed in the training set. In future research, our established predictive models should be validated using consistent testing methods.
Conclusion
In conclusion, our research findings suggested that several plasma cytokines are dysregulated during the latent phase of labor in “low-risk” women who later develop atonic PPH. By using LASSO and logistic regression models, we were able to accurately assess the risk of atonic PPH in prospective cohorts. This approach allows early identification of high-risk individuals among pregnant women diagnosed with a “low risk” of bleeding, thereby significantly reducing the incidence and mortality rates associated with PPH in vaginal deliveries.
Data availability statement
The original contributions presented in the study are included in the article/Supplementary Material, further inquiries can be directed to the corresponding author/s.
Ethics statement
The studies involving humans were approved by Ethics Committee of Tianjin Central Hospital of Gynecology Obstetrics. The studies were conducted in accordance with the local legislation and institutional requirements. The participants provided their written informed consent to participate in this study.
Author contributions
PZ: Formal Analysis, Methodology, Project administration, Validation, Writing – original draft. YJ: Conceptualization, Visualization, Writing – review & editing. HS: Investigation, Writing – review & editing. YF: Investigation, Writing – original draft. YL: Data curation, Resources, Software, Writing – review & editing. HG: Formal Analysis, Methodology, Writing – review & editing. YZ: Data curation, Visualization, Writing – review & editing. HC: Project administration, Supervision, Writing – review & editing. XC: Conceptualization, Funding acquisition, Resources, Supervision, Writing – review & editing.
Funding
The author(s) declare financial support was received for the research, authorship, and/or publication of this article. This research was supported by Grants from the National Key Research and Development Program of China (Grant No. 2021YFC2701500) and Tianjin Municipal Health Commission Project (Grant No. ZD2022).
Acknowledgments
The authors express their sincere appreciation to the medical professionals, including doctors, nurses, and staff members who contributed to this study.
Conflict of interest
The authors declare that the research was conducted in the absence of any commercial or financial relationships that could be construed as a potential conflict of interest.
Publisher’s note
All claims expressed in this article are solely those of the authors and do not necessarily represent those of their affiliated organizations, or those of the publisher, the editors and the reviewers. Any product that may be evaluated in this article, or claim that may be made by its manufacturer, is not guaranteed or endorsed by the publisher.
Supplementary material
The Supplementary Material for this article can be found online at: https://www.frontiersin.org/articles/10.3389/fimmu.2024.1416990/full#supplementary-material
Abbreviations
PPH, postpartum hemorrhage; FGR, fetal growth restriction; HDP, hypertensive disorders of pregnancy; GDM, gestational diabetes mellitus; IUFD, intrauterine fetal death; PSM, propensity score matching; IL-2 rα, interleukin−2Rα; IL-9, interleukin−9; TNF-β, tumor necrosis factor−β; MIP1β, macrophage inflammatory protein-1β; CTACK, cutaneous T cell-attracting chemokine; Hb, hemoglobin; WBC, white blood cell count; ANC, absolute neutrophil count; Neu%, proportion of neutrophils; Lymph%, proportion of lymphocytes; NLR, neutrophil to lymphocyte ratio; PLR, platelet to lymphocyte ratio; SII, systemic immune-inflammation index; LnSII, the natural logarithm of SII; LASSO, least absolute shrinkage and selection operator; SE, standard error; ROC, receiver operating characteristic; AUC, area under the ROC curve.
References
1. Bienstock JL, Eke AC, Hueppchen NA. Postpartum hemorrhage. N Engl J Med. (2021) 384:1635–45. doi: 10.1056/NEJMra1513247
2. Say L, Chou D, Gemmill A, Tuncalp O, Moller AB, Daniels J, et al. Global causes of maternal death: a WHO systematic analysis. Lancet Global Health. (2014) 2:e323–333. doi: 10.1016/S2214-109X(14)70227-X
3. Dilla AJ, Waters JH, Yazer MH. Clinical validation of risk stratification criteria for peripartum hemorrhage. Obstetrics Gynecol. (2013) 122:120–6. doi: 10.1097/AOG.0b013e3182941c78
4. Ruppel H, Liu VX, Gupta NR, Soltesz L, Escobar GJ. Validation of postpartum hemorrhage admission risk factor stratification in a large obstetrics population. Am J Perinatol. (2020) 38:1192–200. doi: 10.1055/s-0040-1712166
5. Escobar MF, Nassar AH, Theron G, Barnea ER, Nicholson W, Ramasauskaite D, et al. FIGO recommendations on the management of postpartum hemorrhage 2022. Int J Gynaecol Obstet. (2022) 157 Suppl 1:3–50. doi: 10.1002/ijgo.14116
6. Jarmund AH, Giskeødegård GF, Ryssdal M, Steinkjer B, Stokkeland LMT, Madssen TS, et al. Cytokine patterns in maternal serum from first trimester to term and beyond. Front Immunol. (2021) 12. doi: 10.3389/fimmu.2021.752660
7. Chen D, Wang W, Wu L, Liang L, Wang S, Cheng Y, et al. Sun C et al: Single-cell atlas of peripheral blood mononuclear cells from pregnant women. Clin Transl Med. (2022) 12:e821. doi: 10.1002/ctm2.821
8. Unal ER, Cierny JT, Roedner C, Newman R, Goetzl L. Maternal inflammation in spontaneous term labor. Am J Obstetrics Gynecol. (2011) 204:223.e221–223.e225. doi: 10.1016/j.ajog.2011.01.002
9. Kawashima A, Oba T, Yasuhara R, Sekiya B, Sekizawa A. Cytokine profiles in maternal serum are candidates for predicting an optimal timing for the delivery in early-onset fetal growth restriction. Prenatal Diagnosis. (2020) 40:728–37. doi: 10.1002/pd.5679
10. Stelzer IA, Ghaemi MS, Han X. Integrated trajectories of the maternal metabolome, proteome, and immunome predict labor onset. Sci Transl Med. (2021) 13:eabd9898. doi: 10.1126/scitranslmed.abd9898
11. Shynlova O, Lee Y-H, Srikhajon K, Lye SJ. Physiologic uterine inflammation and labor onset: integration of endocrine and mechanical signals. Reprod Sci. (2013) 20:154–67. doi: 10.1177/1933719112446084
12. Osman I. Leukocyte density and pro-inflammatory cytokine expression in human fetal membranes, decidua, cervix and myometrium before and during labour at term. Mol Hum Reprod. (2003) 9:41–5. doi: 10.1093/molehr/gag001
13. Ji K, Chen L, Wang X, Wen B, Yang F, Deng W, et al. Integrating single-cell RNA sequencing with spatial transcriptomics reveals an immune landscape of human myometrium during labour. Clin Trans Med. (2023) 13:e1234 . doi: 10.1002/ctm2.1234
14. Ivanisevic M, Segerer S, Rieger L, Kapp M, Dietl J, Kämmerer U, et al. Antigen-presenting cells in pregnant and non-pregnant human myometrium. Am J Reprod Immunol. (2010) 64:188–96. doi: 10.1111/j.1600-0897.2010.00858.x
15. Abramov Y, Ezra Y, Elchalal U, Ben-Shachar I, Fasouliotis SJ, Barak V. Markedly elevated levels of inflammatory cytokines in maternal serum and peritoneal washing during arrested labor. Acta Obstet Gynecol Scand. (2004) 83:358–63. doi: 10.1111/j.0001-6349.2004.00271.x
16. Vallely LH, Shalit A, Nguyen R, Althabe F, Pingray V, Bonet M, et al. WHO recommendations: intrapartum care for a positive childbirth experience. Geneva: World Health Organization (2018). Licence: CC BY-NC-SA 3.0 IGO.
17. Quantitative blood loss in obstetric hemorrhage: ACOG COMMITTEE OPINION, number 794. Obstet Gynecol. (2019) 134:e150–6. doi: 10.1097/AOG.0000000000003564
18. Neary C, Naheed S, McLernon DJ, Black M. Predicting risk of postpartum haemorrhage: a systematic review. BJOG. (2021) 128:46–53. doi: 10.1111/1471-0528.16379
19. Lagrew D, McNulty J, Sakowski C, Cape V, McCormick E, Morton CH. Improving health care response to obstetric hemorrhage, a california maternal quality care collaborative toolkit. (2022).
20. Thomson AJ, Telfer JF, Young A, Campbell S, Stewart CJ, Cameron IT, et al. Leukocytes infiltrate the myometrium during human parturition: further evidence that labour is an inflammatory process. Hum Reprod. (1999) 14:229–36. doi: 10.1093/humrep/14.1.229
21. Bardou M, Hadi T, Mace G, Pesant M, Debermont J, Barrichon M, et al. Systemic increase in human maternal circulating CD14+CD16– MCP-1+ monocytes as a marker of labor. Am J Obstetrics Gynecol. (2014) 210:70.e71–9. doi: 10.1016/j.ajog.2013.08.031
22. Yuan M, Jordan F, McInnes IB, Harnett MM, Norman JE. Leukocytes are primed in peripheral blood for activation during term and preterm labour. Mol Hum Reprod. (2009) 15:713–24. doi: 10.1093/molehr/gap054
23. Jiang H, Shi H, Chen L, Yang J, Yuan P, Wang W, et al. Is there a relationship between plasma, cytokine concentrations, and the subsequent risk of postpartum hemorrhage? Am J Obstet Gynecol. (2021) 226:835.e1-835.e17.doi: 10.1016/j.ajog.2021.12.021
24. Gallo DM, Romero R, Bosco M, Chaiworapongsa T, Gomez-Lopez N, Arenas-Hernandez M, et al. Maternal plasma cytokines and the subsequent risk of uterine atony and postpartum hemorrhage. J Perinatal Med. (2023) 51:219–32. doi: 10.1515/jpm-2022-0211
25. Dodge LE, Carterson AJ, Hacker MR, Golen TH, Pratt SD, Sudhof L, et al. Antepartum fibrinogen concentration as a predictor of bleeding complications. J Maternal-Fetal Neonatal Med. (2019) 34:3586–90. doi: 10.1080/14767058.2019.1688296
26. Salomon C, de Moreuil C, Hannigsberg J, Trémouilhac C, Drugmanne G, Gatineau F, et al. Haematological parameters associated with postpartum haemorrhage after vaginal delivery: Results from a French cohort study. J Gynecol Obstetrics Hum Reprod. (2021) 50:102168. doi: 10.1016/j.jogoh.2021.102168
27. Liu B, Wang J, Y-y L, Li K-p, Zhang Q. The association between systemic immune-inflammation index and rheumatoid arthritis: evidence from NHANES 1999–2018. Arthritis Res Ther. (2023) 25:34. doi: 10.1186/s13075-023-03018-6
28. Wang R-H, Wen W-X, Jiang Z-P, Du Z-P, Ma Z-H, Lu A-L, et al. The clinical value of neutrophil-to-lymphocyte ratio (NLR), systemic immune-inflammation index (SII), platelet-to-lymphocyte ratio (PLR) and systemic inflammation response index (SIRI) for predicting the occurrence and severity of pneumonia in patients with intracerebral hemorrhage. Front Immunol. (2023) 14. doi: 10.3389/fimmu.2023.1115031
29. Li J, Cao D, Huang Y, Xiong Q, Tan D, Liu L, et al. The prognostic and clinicopathological significance of systemic immune-inflammation index in bladder cancer. Front Immunol. (2022) 13. doi: 10.3389/fimmu.2022.865643
Keywords: atonic postpartum hemorrhage, cytokine, hemogram, coagulation, prediction, biomarker
Citation: Zhang P, Jia Y, Song H, Fan Y, Lv Y, Geng H, Zhao Y, Cui H and Chen X (2024) Novel biomarkers for prediction of atonic postpartum hemorrhage among ‘low-risk’ women in labor. Front. Immunol. 15:1416990. doi: 10.3389/fimmu.2024.1416990
Received: 13 April 2024; Accepted: 26 June 2024;
Published: 11 July 2024.
Edited by:
Adi Laurentiu Tarca, Wayne State University, United StatesReviewed by:
Zheng Liu, Virginia Commonwealth University, United StatesEunjung Jung, Inje University Busan Paik Hospital, Republic of Korea
Copyright © 2024 Zhang, Jia, Song, Fan, Lv, Geng, Zhao, Cui and Chen. This is an open-access article distributed under the terms of the Creative Commons Attribution License (CC BY). The use, distribution or reproduction in other forums is permitted, provided the original author(s) and the copyright owner(s) are credited and that the original publication in this journal is cited, in accordance with accepted academic practice. No use, distribution or reproduction is permitted which does not comply with these terms.
*Correspondence: Xu Chen, Y2hlbnh1MTk2MzAxQDE2My5jb20=