 Kendra Weston
 Janet E. Fulton2
 Jeb Owen
- 1Department of Entomology, Washington State University, Pullman, WA, United States
- 2Hy-Line International, Dallas Center, IA, United States
Natural antibodies are used to compare immune systems across taxa, to study wildlife disease ecology, and as selection markers in livestock breeding. These immunoglobulins are present prior to immune stimulation. They are described as having low antigen specificity or polyreactive binding and are measured by binding to self-antigens or novel exogenous proteins. Most studies use only one or two antigens to measure natural antibodies and ignore potential effects of antigen specificity in analyses. It remains unclear how different antigen-specific natural antibodies are related or how diversity among natural antibodies may affect analyses of these immunoglobulins. Using genetically distinct lines of chickens as a model system, we tested the hypotheses that (1) antigen-specific natural antibodies are independent of each other and (2) antigen specificity affects the comparison of natural antibodies among animals. We used blood cell agglutination and enzyme-linked immunosorbent assays to measure levels of natural antibodies binding to four antigens: (i) rabbit erythrocytes, (ii) keyhole limpet hemocyanin, (iii) phytohemagglutinin, or (iv) ovalbumin. We observed that levels of antigen specific natural antibodies were not correlated. There were significant differences in levels of natural antibodies among lines of chickens, indicating genetic variation for natural antibody production. However, line distinctions were not consistent among antigen specific natural antibodies. These data show that natural antibodies are a pool of relatively distinct immunoglobulins, and that antigen specificity may affect interpretation of natural antibody function and comparative immunology.
1 Introduction
Natural antibodies (NAbs) are a class of immunoglobulins present in blood for which the immune system has had no prior stimulation (1–5) and which can function in the innate immune response (6–8). These immunoglobulins are variously described as polyreactive or having low antigen specificity (8–10). Natural antibodies are commonly measured using antigens that animals have not previously encountered such as keyhole limpet hemocyanin (KLH) or self-antigens like ovalbumin (OVA) (11–13). The NAbs may be directly protective by neutralizing pathogens (14–16), and they may facilitate the adaptive immune response by supporting pathogen phagocytosis and antigen presentation (11, 17). Due to their defensive properties and their function as a bridge between the innate and adaptive compartments of the immune system, NAbs have been studied in the contexts of disease, ecology, evolution, and comparative immunology (15, 18–20). Experimental infections under laboratory conditions have shown that higher levels of NAbs are associated with lower infection intensities (21) and a higher probability of survival (1, 22). However, some NAbs appear inversely associated with higher survival probability (22). Studies of wildlife suggest that individuals with higher levels of NAbs have greater bactericidal capabilities (8, 18, 23, 24) and resistance to parasites (7, 25, 26). The NAbs appear to be correlated with other immunological factors (27–29) and vary among sexes (30), populations (31), life stages (32), food resources (33–35), and seasons (36). In animal agriculture, NAbs have been used as selection traits to enhance disease resistance (37–42). Finally, given that NAbs are thought to bridge innate and adaptive immune responses, they have been used to compare immune systems among different taxa (27, 28, 43, 44) and to explore tradeoffs in the evolution of immune systems (19, 30). Other than the mouse (Mus musculus), the chicken (Gallus gallus) is the most widely used animal model for the study of NAbs (1, 3, 6, 22, 27, 33, 39–42, 45–61). As early as 1923 natural antibodies were identified in chickens (53). Subsequently, NAbs have been linked to poultry survival (1, 45, 56) and pathogen resistance (39–41). The genetic basis for variation in NAbs has been explored using established genetic lines of poultry (6, 22, 40, 42, 47–49, 52, 55) and with modern genomics tools (62–66). The chicken has been a vital model for developing NAb assays used for wild bird species (25, 27, 28, 43). However, given the agricultural and economic importance of poultry, the primary application of NAb research on chickens has been in selective breeding for enhanced immune defense (39–42, 46, 49, 51, 58, 60).
Although some functional studies of NAbs are based on isolated B-1 cell lines in mice (18, 67–71), most studies of NAbs are based on measures of circulating immunoglobulins in serum or plasma (6, 18, 37, 38, 43). These measures are commonly done using one of two methods – (1) hemagglutination assay (HA) or (2) enzyme-linked immunosorbent assay (ELISA). Hemagglutination assays measure in vitro antibody binding and cross-linking of vertebrate red blood cells (72). In hemagglutination assays, antibodies bind to proteins on the surface of red blood cells, causing clumping (agglutination) of the red blood cells in a microtiter well (17, 72). The antibody titer is calculated based on a dilution series of sera or plasma incubated with a fixed concentration of red blood cells, and the experimenter determines the dilution point when agglutination fails to occur (3, 27). Hemagglutination assays are often employed in wildlife studies (23, 28, 30, 44) and are popular because they do not require special reagents or equipment (27). The ELISA uses a microtiter plate coated with a specific antigen and then filled and incubated with sera or plasma from the study animal. Antibodies in the sera/plasma that bind to the plate-affixed antigen can be quantified using a secondary antibody conjugated to a colorimetric enzyme or fluorescence marker detected by a spectrophotometer (17, 72, 73). The ELISA approach is frequently used in laboratory and livestock research (43, 74–76). Different antigens are used to measure NAbs with both methods. Hemagglutination assays may use blood cells from rabbits, sheep, chickens, or fish (27, 47–50, 77). Enzyme-linked immunosorbent assays may use antigens from bacteria (e.g., lipopolysaccharide), invertebrates (e.g., keyhole limpet hemocyanin), plants (e.g., phytohemagglutinin), or vertebrates (e.g., ovalbumin) (11, 51, 52).
These different methods measure NAbs binding to specific antigens, and it is unclear how these antigen-specific NAbs are related. Though NAbs are expected to be polyreactive (24, 78–81), studies of monoclonal NAbs reveal that NAbs do not bind equally well to all antigens. For example, Gunti et al. (8) showed that NAbs from a single B-1 clone exhibited wide variation in binding to different bacteria, including species from the same genus. Importantly, different NAbs can have unique (non-overlapping) ranges of antigen binding (82, 83). Baumgarth et al. (9, 84) argue that immunological defense by NAbs results from broad antigen reactivity of both individual NAbs and the natural antibody repertoire. These studies underscore that NAbs are not uniform and the NAb repertoire reflects a diverse pool of immunoglobulins with potentially unique but complimentary antigen specificities. Despite these insights, the majority of NAb studies are based on immunoglobulin measures using only one or two antigens (6, 19, 22, 27, 28, 30, 34, 42, 49, 51, 60, 74, 76, 85–97). This raises an important question – are NAbs measured with one antigen representative of the broader repertoire of NAbs? This is a vital question, given that many studies of NAbs infer immune function (14, 22, 27, 30, 76, 86, 91, 98), ecological relationships (25, 28, 34, 99), and evolution (19, 25, 42, 49, 97, 100) based on one or two NAb antigens. Additionally, the antigens used vary widely across studies (22, 27, 60, 89), which makes it difficult to synthesize results among different study systems.
To our knowledge, comparisons of circulating NAbs have not been reported in the literature. Here, we tested two related hypotheses regarding NAb specificity (1): Levels of antigen-specific NAbs are independent; (2) Antigen specificity affects comparison of natural antibodies among animals. We tested these hypotheses by measuring NAb levels among genetically distinct chicken breeds and selection lines, using different antigens with agglutination and ELISA methods. We discuss the potential importance of antigen specificity to the study of NAb function and comparative immunology.
2 Materials and methods
2.1 Poultry
Plasma was collected from female chickens in eight selection lines across three breeds: White Leghorn (WL), White Plymouth Rock (WPR), and Rhode Island Red (RIR). These three breeds are distinct, having been historically selected for different physical characteristics including feather color and eggshell color. Each was defined as a different breed over 100 years ago (101). The different lines within each breed have been separated from one another since the 1940s through artificial selection on egg production, body weight, and feed conversion efficiency (102). The Rhode Island Red breed is a cross of three breeds (Malay Game, Leghorn, and Asian native) originating in Europe around 100 B.C (103, 104). The Leghorn breed originated in Italy in 400 B.C. and are classified as egg layers (103, 104) and are the most commonly utilized breed for white egg shell production. They exhibit a range of plumage colors, with white being the most common (104). The White Plymouth Rock was one of the breeds used to develop the modern commercial meat (broiler) bird in the early part of the 20th century (104). The Rhode Island Red and Plymouth Rock breeds are used for commercial brown egg production. All birds used in this study were from elite egg layer lines, selected for generations for multiple egg production related traits. These are all pure lines, not commercial cross production birds. They were maintained at the breeding facilities of Hy-Line International. The housing was in single cages, under standard production conditions with feed and water provided ad libitum.
2.2 Plasma samples
Blood was collected from birds in each line at ten weeks of age, and plasma samples were separated from blood by centrifugation at 240 x g for three minutes. After collection, plasma samples were split into aliquots for the different assays, then stored at -20°C until use. Sample sizes ranged from 98–106 birds per line with eight lines total across three breeds (two for Rhode Island Red, four for White Leghorn, and two for White Plymouth Rock), with a total of 813 samples for the ELISA assays, and sample sizes ranged from 10–25 birds per line, with a total of 119 samples for the rabbit blood cell hemagglutination (HA) assay.
2.3 Agglutination assay
Measures of NAbs binding to rabbit red blood cells (anti-rRBC NAbs) were determined using the hemagglutination assay (HA) (27, 28). A 1% rabbit blood cell (RBC) suspension was prepared using rabbit whole blood in Alsever’s solution (catalog # RBA050, Hemostat Laboratories, Dixon, CA, USA). Briefly, RBCs in whole blood were washed four times with centrifugation at 241.5 x g for 5 min in phosphate-buffered saline (PBS, catalog# P3813, Sigma-Aldrich, St. Louis, MO, USA). Lysed red blood cells were removed with the supernatant after each wash. The washed cell concentration was measured using duplicate hematocrit capillary tubes following sample centrifugation at 0.004 x g for 1 min. Additional PBS was added to make a 1% red blood cell suspension with confirmation of the concentration via hematocrit. Each HA assay was done using a 96-well microtiter plate (CorningTM Clear Polystyrene 96-Well Microplates, catalog# 3795, Thermo Scientific, Rockford, IL, USA). Each row of wells tested plasma from a single bird, with 2x dilutions of the plasma from the first well (25 µl undiluted plasma) through the 11th well (1/1024 dilution of plasma in PBS; 25 µl total volume). Seven rows contained experimental samples (7 birds) and one row contained a positive control sample of pooled plasma. Column 12 wells contained 25µl PBS only, as a negative control. After plasma samples were distributed, 25µl of the 1% rabbit blood cell suspension were added to each well. The plates were sealed with Parafilm to prevent evaporation. Plates were placed on an orbital for 10 seconds and incubated in a 37°C water bath for 90 min. Plates were removed and placed at a 45-degree angle (on the long axis) for 20 min at room temperature to enhance the visualization of agglutination. We photographed and re-sealed each plate before incubation for an additional 70 minutes at a 45-degree angle at room temperature. We then photographed each plate again. Chicken samples were numerically coded and randomized across plates to avoid observer bias. The plates were scored blindly at the time of assay. The same researcher scored the photos of assays later to validate the original scores (27). Scores were recorded as the highest dilution (i.e., well number) at which agglutination occurred. Due to time constraints, we did not conduct HA assays on all plasma samples. A random subset of samples from each line of chicken breed was selected. The HA sample sizes matched or exceeded sample sizes reported in the literature for this assay (27, 28, 105–107). Sample sizes for the HA assay were Rhode Island Red (n=29), White Leghorn (n=59), and White Plymouth Rock (n=31) (Table 1).
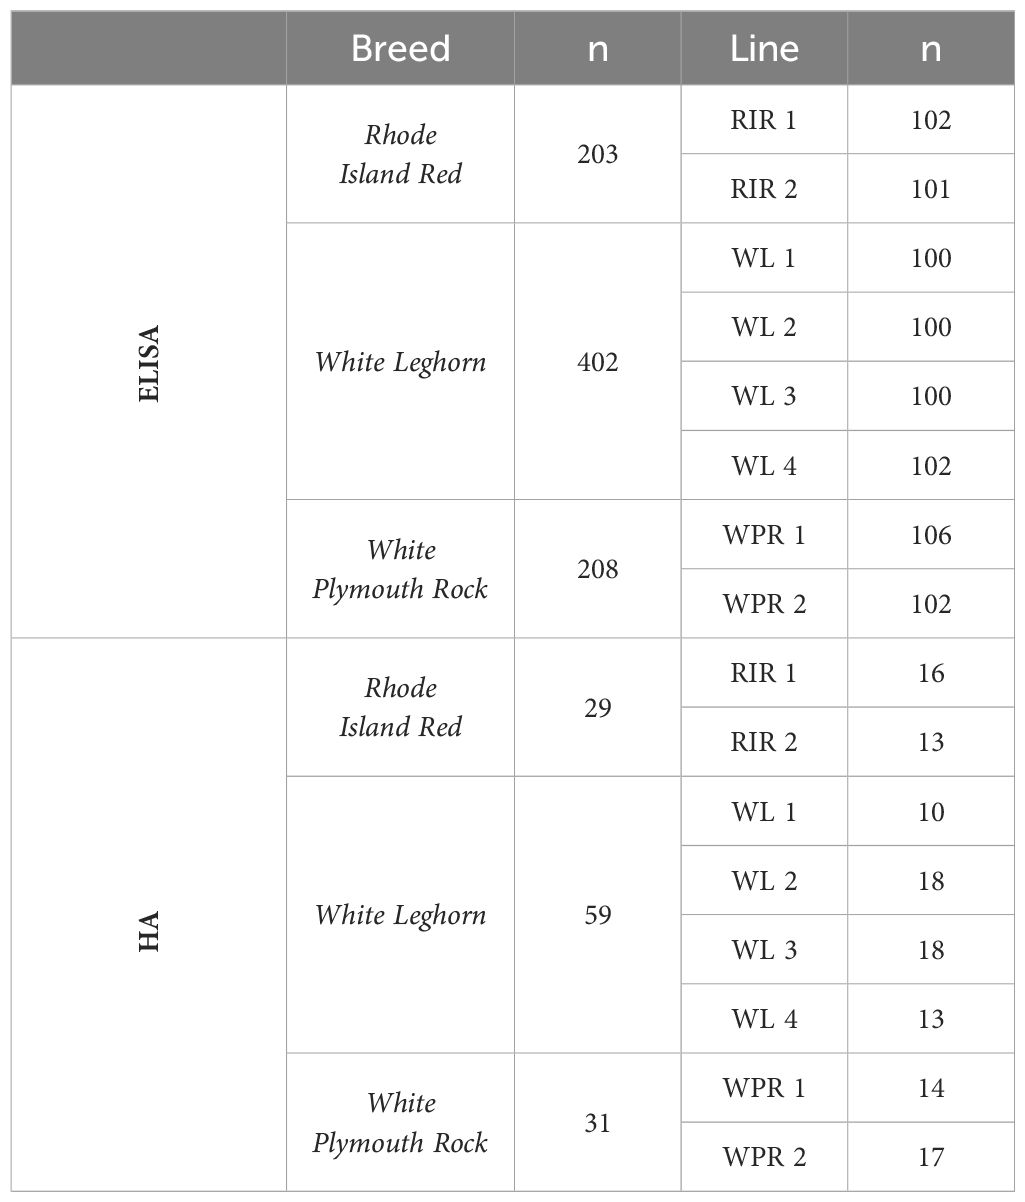
Table 1 Sample sizes (n) of three breeds (Rhode Island Red, White Leghorn, and White Plymouth Rock) consisting of eight lines (RIR 1, RIR 2, WL 1, WL 2, WL 3, WL 4, WPR 1, and WPR 2) for assays (ELISA and HA) used to measure natural antibodies.
2.4 Enzyme-Linked Immunosorbent Assay (ELISA)
We developed indirect ELISAs to quantify IgY NAbs binding to each of three antigens - keyhole limpet hemocyanin (KLH; Hemocyanin from Megathura crenulate (keyhole limpet), catalog # H7017–20MG, Sigma-Aldrich, St. Louis, MO, USA), phytohemagglutinin (PHA; Phytohemagglutinin-L, catalog # 11249738001, Sigma-Aldrich, St. Louis, MO, USA), and ovalbumin (OVA; Imject ™ Ovalbumin, catalog # 77120, Thermo Scientific, Rockford, IL, USA) using a single dilution approach (108–110). Each assay was optimized based on dilutions of antigen and plasma (i.e., checkerboard titration) with the following steps: (Step 1) 96-well clear microtiter plates (Immulon ® 4HBX Flat Bottom Microtiter® Plates, Thermo Scientific, Rockford, IL, USA) were coated with an antigen diluted in coating buffer (Carbonate-Bicarbonate Buffer, catalog # C3041–100CAP, Sigma-Aldrich, St. Louis, MO, USA), with 100µl of solution per well. Antigen concentrations ranged from 1x (stock solution) in row A to 1:2000 dilution in row H. The plate was incubated at room temperature on an orbital shaker for 1 hour. (Step 2) The plate was washed with Tris buffer (Tris Buffered Saline, with Tween ® 20, pH 8.0, catalog # T9039–10PAK, Sigma-Aldrich, St. Louis, MO, USA) three times. (Step 3) The wells were filled (300 µl/well) with blocking buffer (Pierce ™ Protein-Free Blocking Buffer, catalog # 37572, Thermo Scientific, Rockford, IL, USA) to cover any open binding surfaces on the plate. The plate was incubated at room temperature on an orbital shaker for 30 minutes. (Step 4) The plate was washed with Tris buffer three times. (Step 5) A pooled plasma sample was diluted in sample buffer (50 mM Tris buffered saline, pH 8.0, 1% BSA; Sigma Chemical # T6789; 10% Tween 20, Tween 20; Sigma Chemical P7949) and added to the plate (100µl/well) so that plasma concentrations ranged from 1x (undiluted) in column one to 1:2048 in column 12. The plate was incubated at room temperature on an orbital shaker for 1 hour. (Step 5) The plate was washed with Tris buffer three times. (Step 6) Detection antibody (anti-Chicken IgY – Fc Fragment Antibody with HRP conjugate; A30–104P, Bethyl Laboratories Inc., Texas, USA) was diluted in sample buffer 1:200,000 and added to all wells (100µl/well). The plate was covered with aluminum foil and incubated on an orbital shaker for 1 hour at room temperature. (Step 7) The plate was washed with Tris buffer three times. (Step 8) 100µl TMB (3,3’,5,5’-Tetramethylbenzidine Liquid Substrate System, catalog # T8665–1L, Sigma-Aldrich, St. Louis, MO, USA) were added to each well and the plate was incubated on an orbital shaker for 15 min. (Step 9) We added 100µl of stop solution (BioFX ® 450nm Liquid Nova-Stop Solution for TMB Microwell Substrates, NC1026538, Thermo Scientific, Rockford, IL, USA) to each well. (Step 10) The plate was scanned at 450 nm with a spectrophotometer (Imark™ Microplate reader, Bio-RAD, Hercules, CA, USA) to determine the optical density (OD) in each well. Optical density correlates with the amount of antibody bound to the substrate antigen. We confirmed that OD values decreased as antigen dilution increased and as plasma dilution increased. This validated antibody-antigen binding in the assay. We compared the OD curves for the plasma dilutions among the different antigen concentrations. We selected the antigen concentration that yielded an OD curve with the steepest slope across plasma dilutions, because this reflected the antigen concentration most sensitive to changes in antibody concentration. Once the optimal concentration was determined for each antigen, the selected concentration was used for all sample assays. The selected antigen concentrations were KLH (1:40 dilution), PHA (1:500 dilution), and OVA (1:20 dilution). All assays used plasma samples diluted 1:100 and each sample was analyzed in triplicate wells (100µl/well). In addition, all assays included a positive control sample of pooled plasma and a negative control of sample buffer only. The OD value of the negative control (buffer only) was subtracted from all sample wells, and we determined the coefficient of variation (CV) for the optical densities of triplicate wells for each sample. For samples with a CV <20%, we averaged the triplicate well OD values to use in statistical analyses. Samples with CV values >20% were excluded from analyses. Sample sizes for ELISAs were as follows: Rhode Island Red (n=203), White Leghorn (n=402), and White Plymouth Rock (n=208) (Table 1).
2.5 Statistical methods
All sample data were standardized against positive controls by calculating the ratio of the sample value (Si) to the value of the positive control (P) on the plate (xi = Si/P). This controlled any assay variation among different plates. We then normalized S/P values (xi) of each assay by scaling from 0 to 1 with the following formula: zi = (xi – min(x))/(max(x) - min(x)), where x = (x1,…,xn) and zi is the ith normalized data value. This was done to enable direct comparisons of assay results on a common scale. To analyze relationships between antigen-specific NAbs, we calculated Spearman’s correlation coefficients for each pairwise combination of NAb assay antigens with the psych package in R (111). We expected that any correlated NAbs would reflect cross-reactivity of polyreactive NAbs or tightly linked production of antigen-specific NAbs. Conversely, uncorrelated NAbs would indicate antigen-specific NAbs are independent. We compared NAb levels among chicken breeds and lines for each antigen-specific NAb using Generalized Linear Models (GLM) with stats package in R (112). The GLM models were NAbx level ~ Line + Breed, where NAbx represents the normalized assay values for antigen x. Post hoc pairwise comparisons were evaluated using the emmeans package (113). Significant effects of chicken line or breed on NAb levels indicate genetic variation for NAb expression. Statistical differences in NAb levels among lines and breeds were qualitatively compared among assay antigens, to determine if antigen specificity affects comparisons of NAbs among genetically distinct animals.
3 Results
3.1 Correlations among antigen-specific NAbs
The correlation coefficients of antigen-specific NAb levels ranged from 0.10 to 0.31, indicating that antigen-specific NAb levels were independent (Figure 1). As a result, antigen-specific NAbs were considered independent and unique subsets of the overall NAb repertoire.
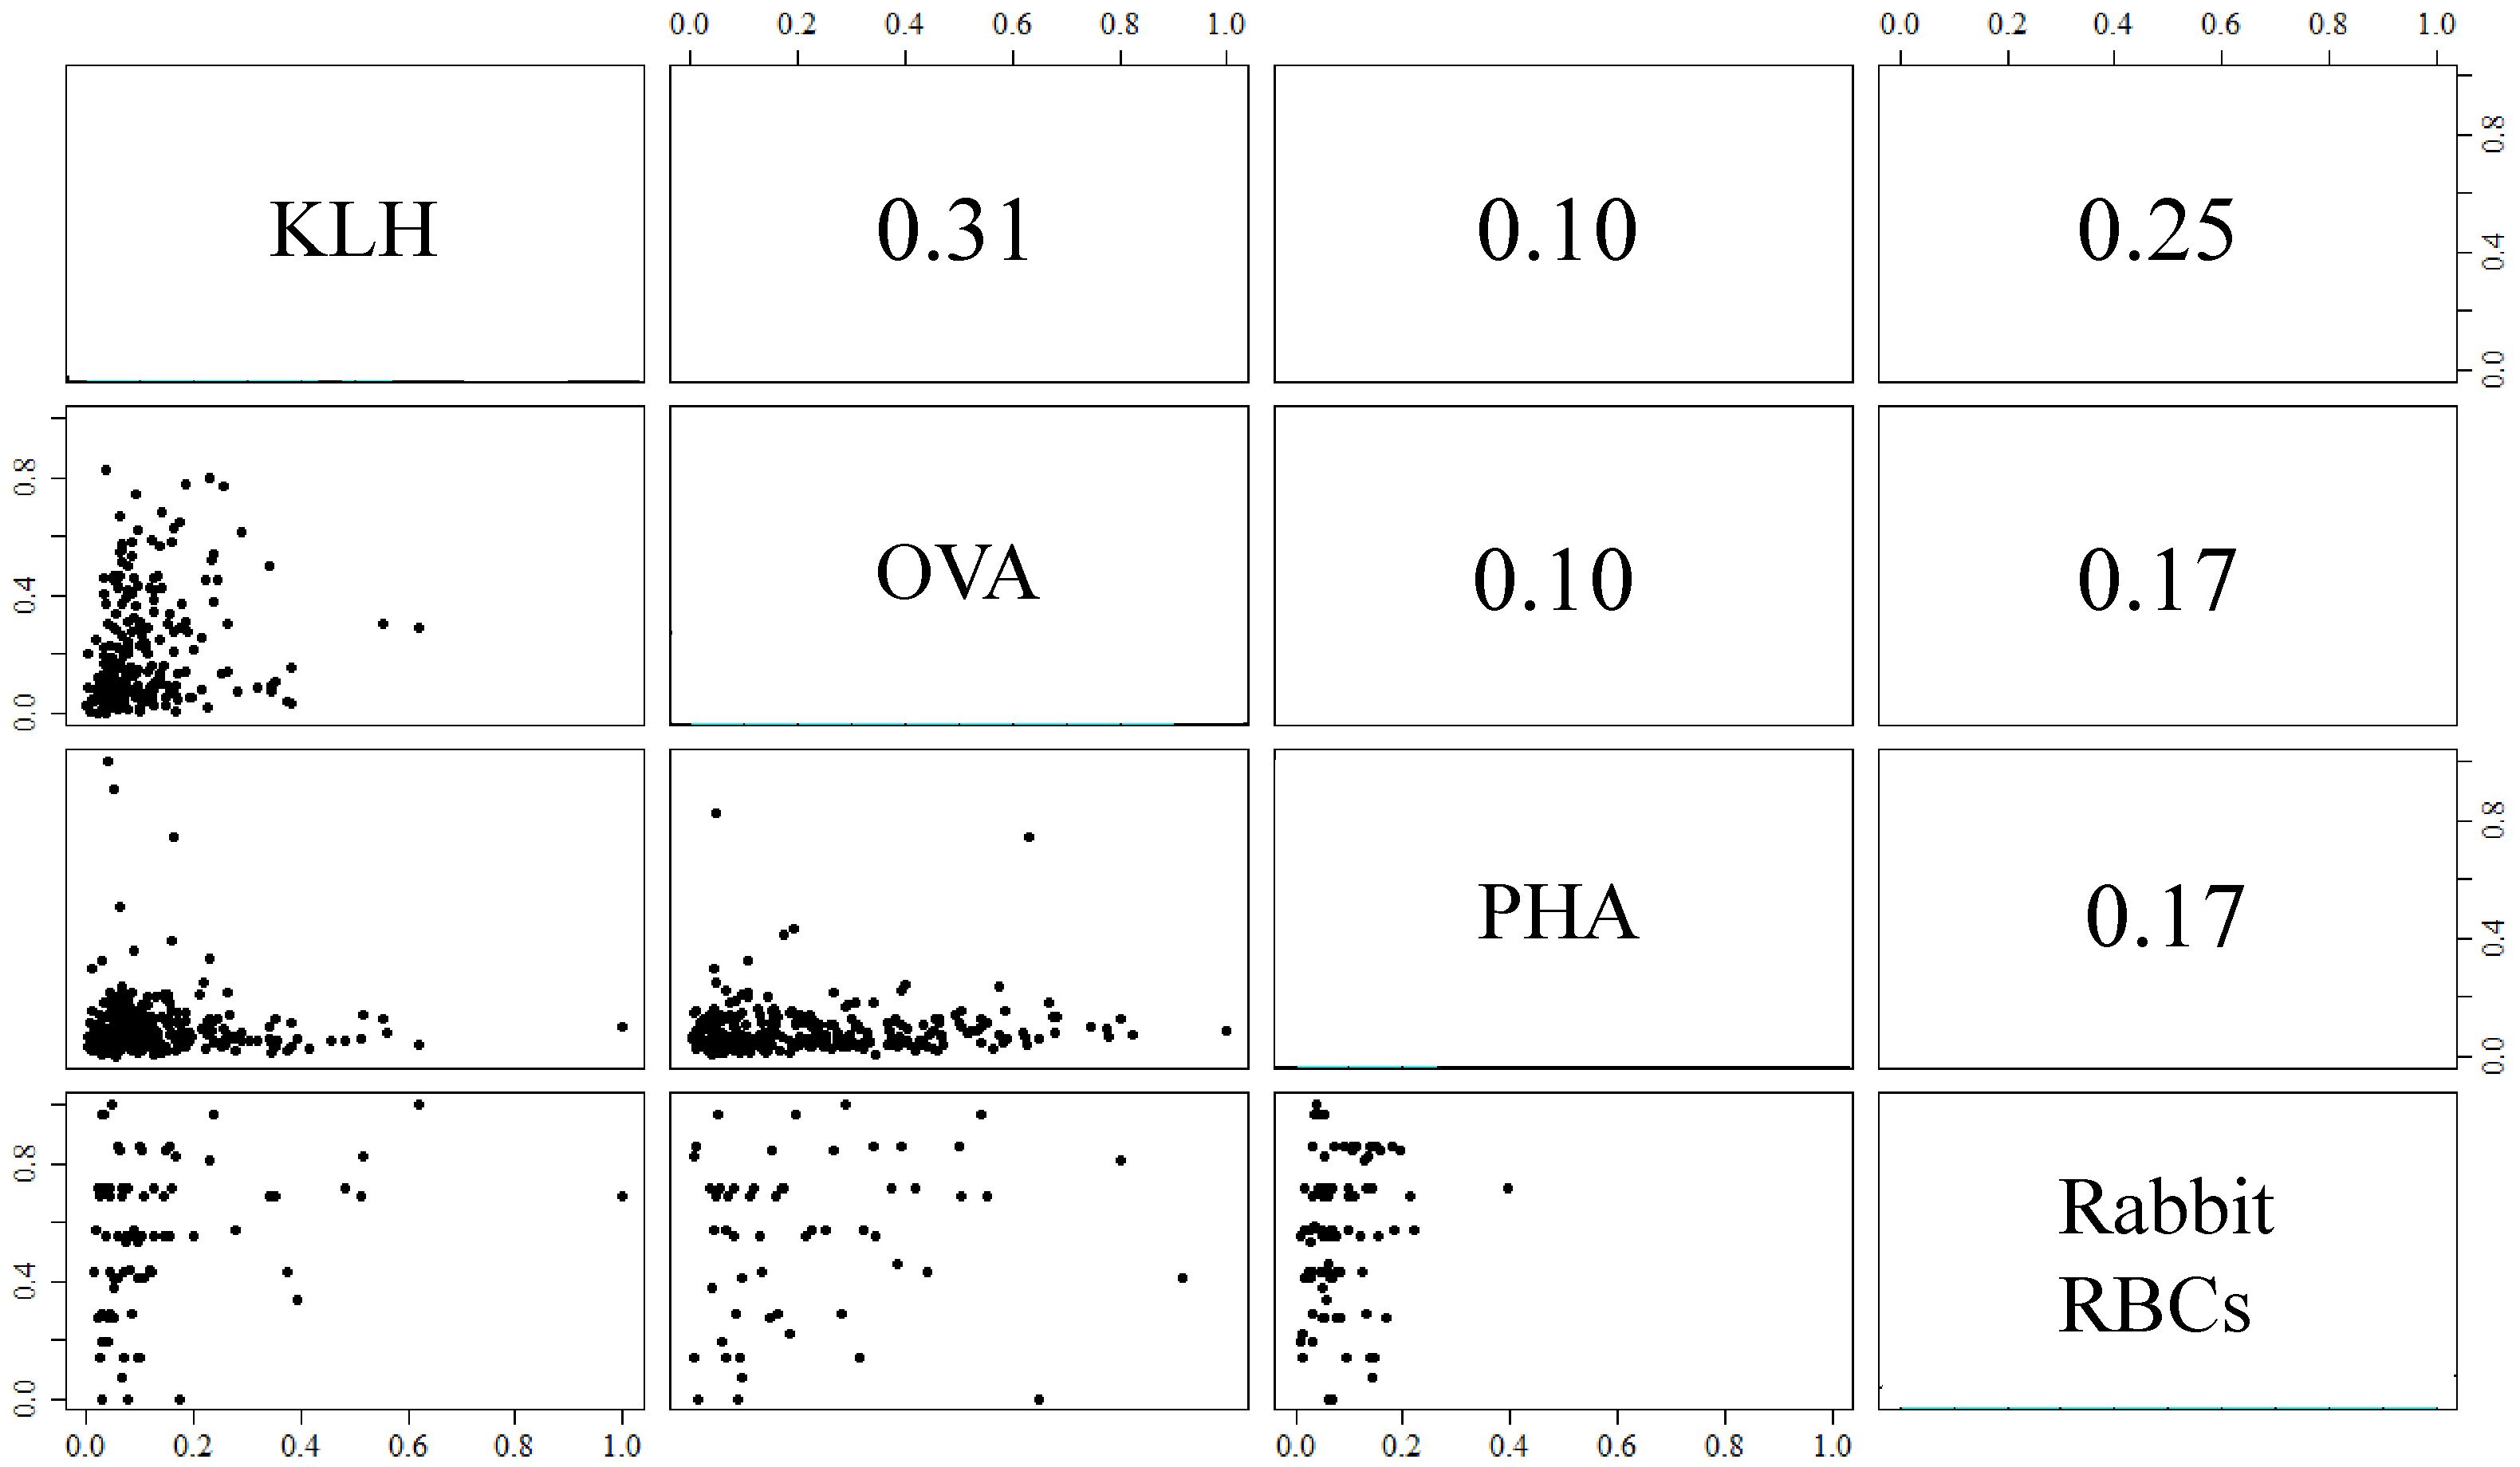
Figure 1 Pairwise correlations among levels of antigen-specific natural antibodies (NAbs) binding molecules ovalbumin (OVA), keyhole limpet hemocyanin (KLH), phytohemagglutinin (PHA), and rabbit red blood cells (RBCs). The NAb measures were normalized to a 0 to 1 scale for comparison. Antigen-specific NAb expression of individual birds is shown in scatter plots below the diagonal and Spearman’s correlation coefficients of NAb expression above the diagonal.
3.2 Agglutination assays of NAbs among breeds and lines
The genetic line of chickens affected anti-rRBC NAbs (GLM, t=2.56, p=0.01), but there was no effect of breed (GLM, t=1.30, p=0.20) (Figure 2). White Leghorn Line 3 had lower levels of anti-rRBC NAbs compared to line White Leghorn Line 4 (GLM, t=3.20, p=0.04), but no other pairwise line differences were observed.
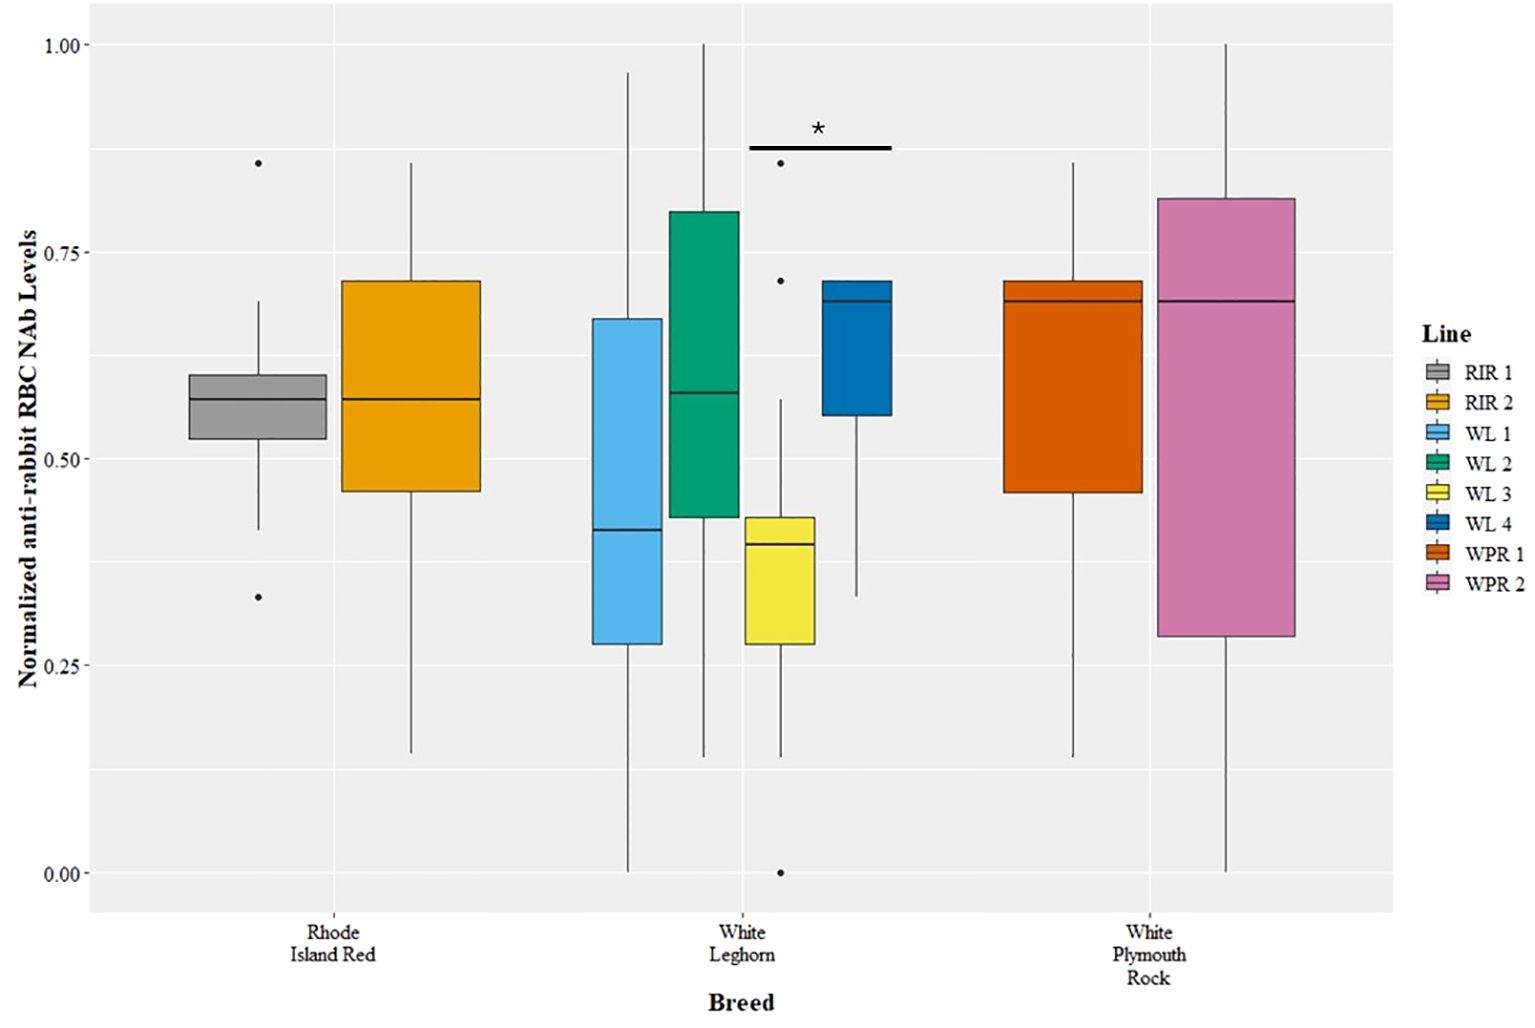
Figure 2 Levels of natural antibodies (NAb) binding rabbit red blood cells (rRBCs) were measured with hemagglutination assays. The anti-rRBC NAb levels were measured as the highest dilution of plasma that resulted in RBC agglutination. The anti-rRBC NAb levels were normalized to a 0 to 1 scale before comparison among breeds and lines. The NAb measures are shown for multiple breeds (x-axis) and lines (legend), with points representing outliers. There was a significant difference in anti-rRBC NAb level between lines WL3 and WL4 (post hoc, p < 0.05), but no differences among breeds.
3.3 ELISAs of NAbs among breeds and lines
The genetic line and breed of chicken affected levels of NAbs measured in all three ELISAs (Figure 3). Among the poultry lines there was a difference in expression of NAbs binding KLH (GLM, t=3.41, p=0.001), OVA (GLM, t=4.32, p<0.0001), and PHA (GLM, t=3.80, p=0.0002). Post hoc pairwise comparisons of lines revealed significant differences between 5 pairs of lines in the KLH assay, 17 pairs of lines in the OVA assay, and 5 pairs of lines in the PHA assay (Table 2). Among the poultry breeds, there was a difference in the expression of NAbs binding KLH (GLM, t=2.27, p=0.02) and OVA (GLM, t=8.20, p<0.001), but no difference in the expression of NAbs binding PHA (GLM, t=1.55, p=0.12). Post hoc pairwise comparisons of breeds revealed significant differences between 2 pairs of lines in the KLH assay, 3 pairs of lines in the OVA assay, and no pairs of lines in the PHA assay (Table 3).
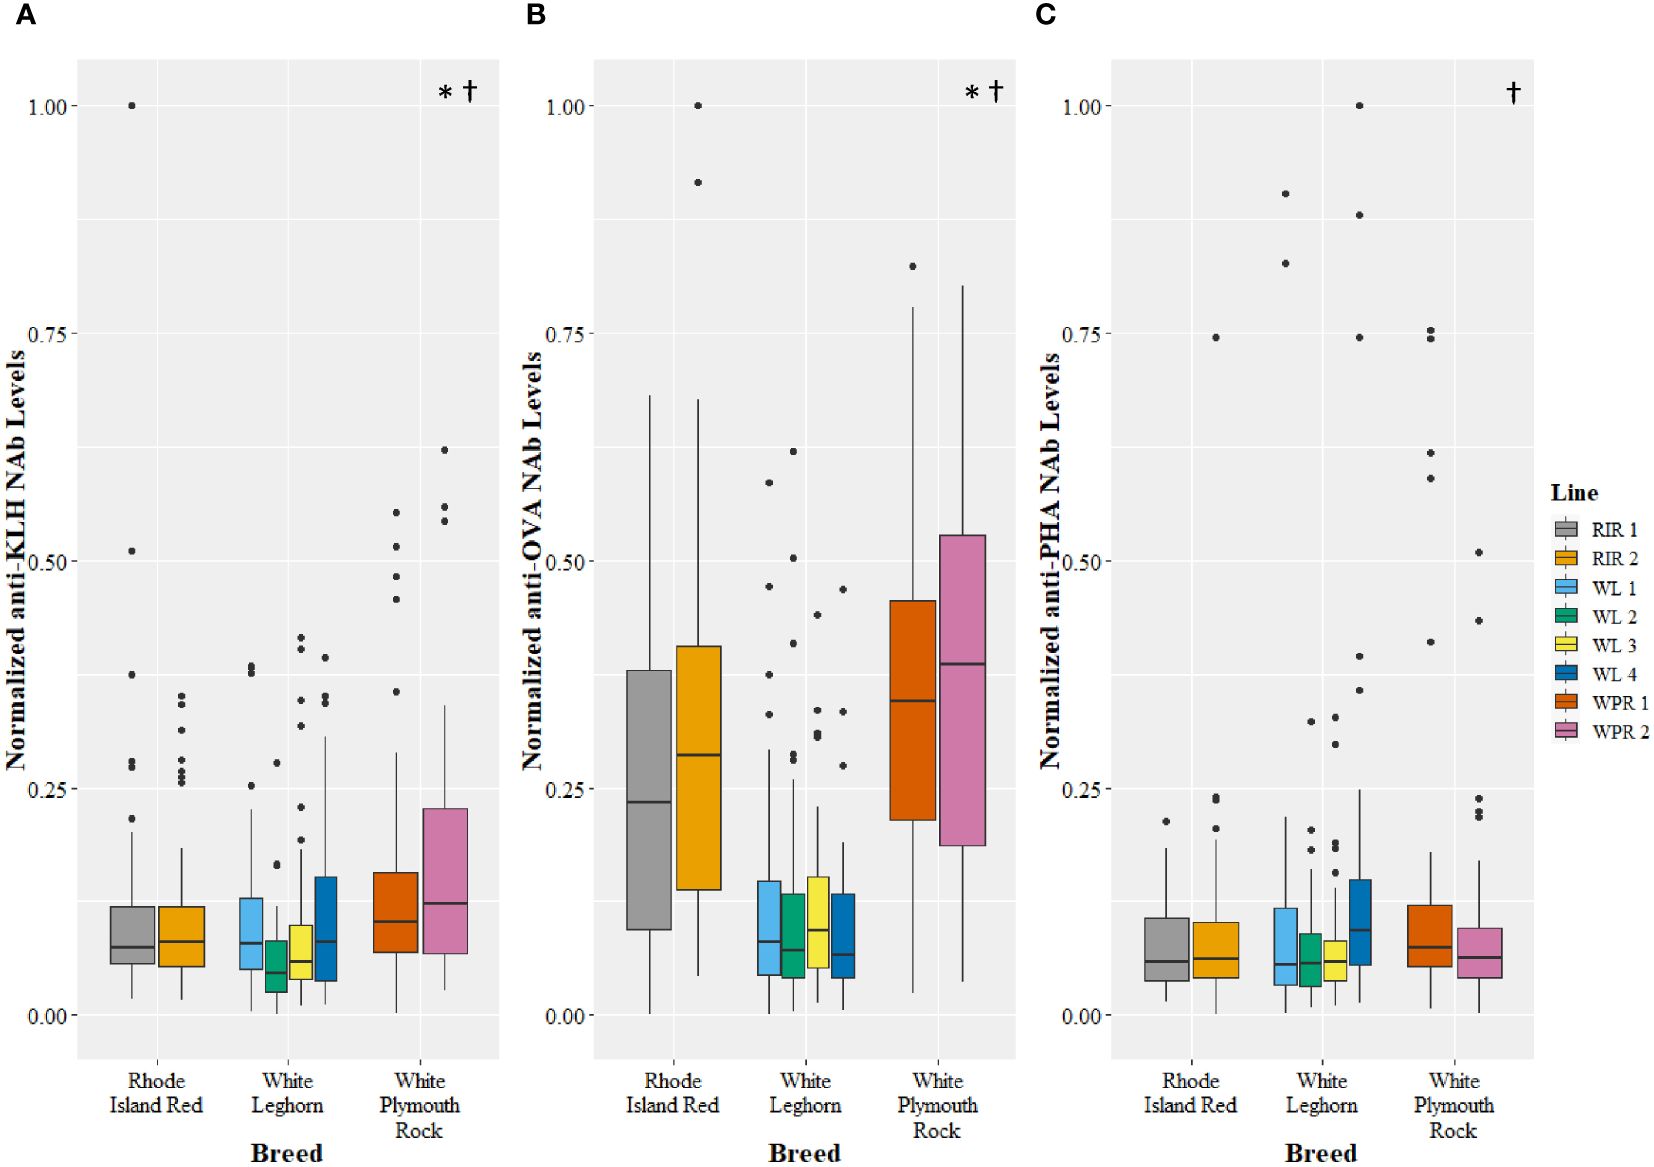
Figure 3 Levels of natural antibodies (NAb) binding keyhole limpet hemocyanin (KLH) (A), ovalbumin (OVA) (B), and phytohemagglutinin (PHA) (C) measured using enzyme-linked immunosorbent assays and recorded as optical density units with spectrophotometry. The optical density values were normalized to a 0 to 1 scale before comparison among breeds and lines. The antigen-specific NAb levels are shown for multiple breeds (x-axis) and lines (legend), with single points representing outliers. Symbols represent significant differences (p<0.05). The (*) symbol indicates a difference in NAb levels among breeds, and the (†) symbol indicates a difference in NAb levels among lines. See Tables 2, 3 for pairwise comparisons.
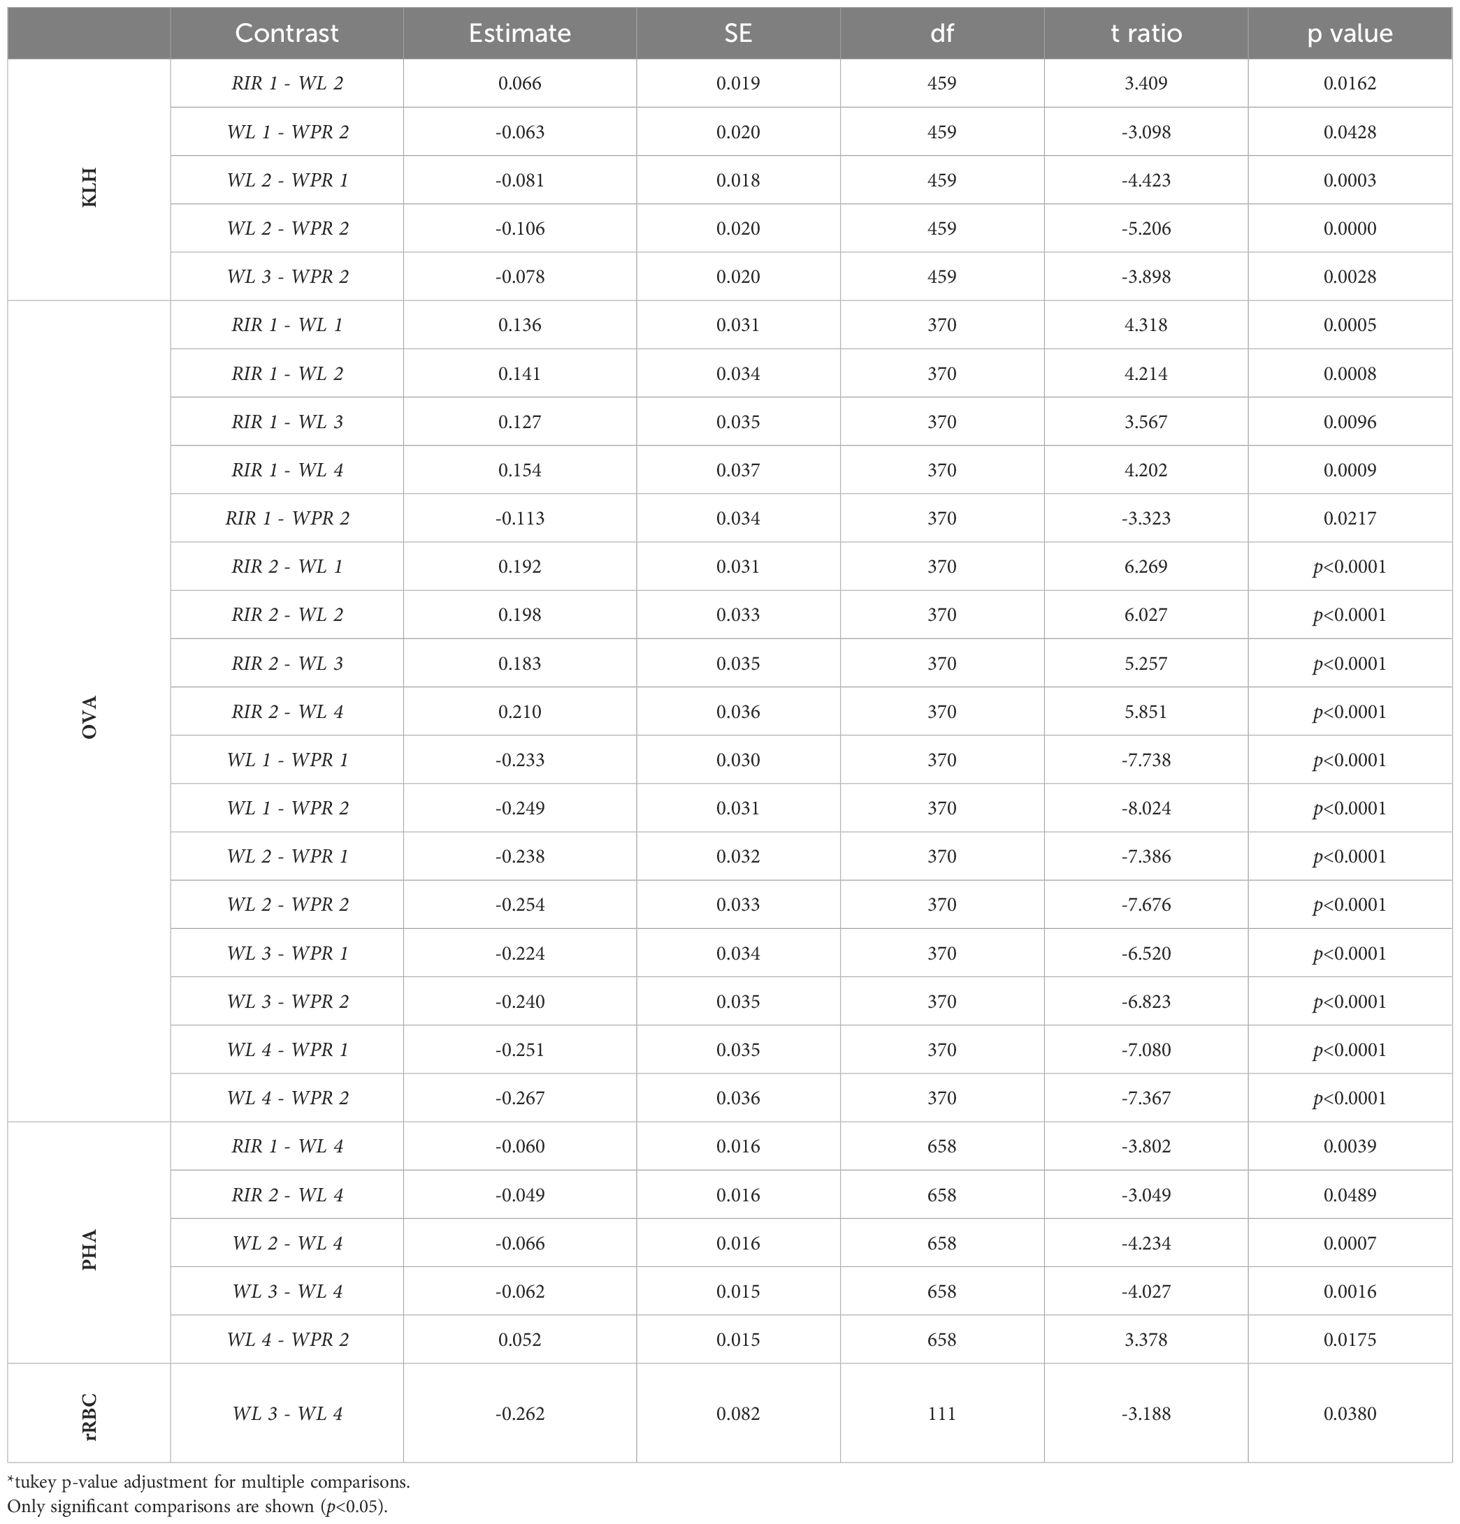
Table 2 Pairwise comparisons of NAbs binding KLH, OVA, PHA, and rRBCs among poultry lines (RIR 1, RIR 2, WL 1, WL 2, WL 3, WL 4, WPR 1, and WPR 2).
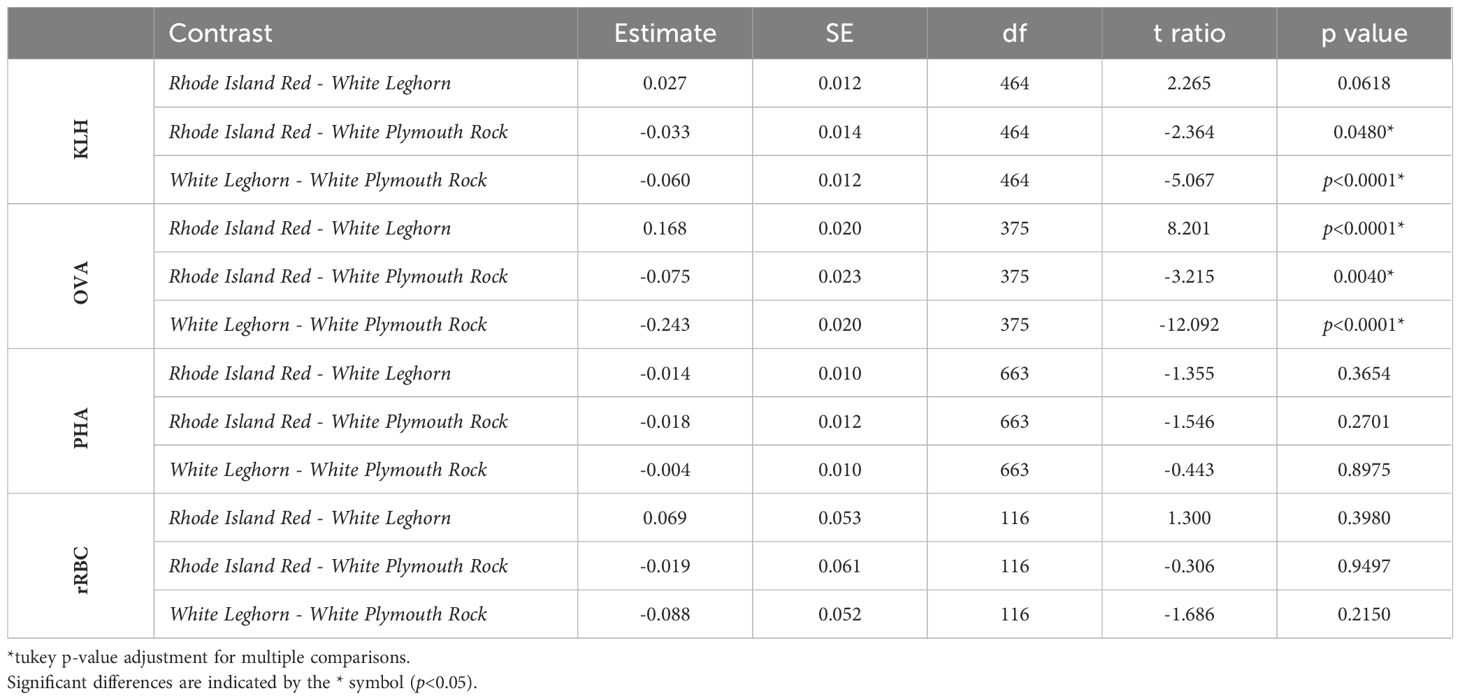
Table 3 Pairwise comparisons of NAbs binding KLH, OVA, PHA, and rRBCs among poultry breeds (Rhode Island Red, White Leghorn, and White Plymouth Rock).
4 Discussion
We compared natural antibody levels among different breeds and selected elite lines of poultry using two methods (i.e. ELISA and HA) to test the hypotheses that (1) antigen-specific NAbs are independent and (2) antigen specificity affects comparisons of NAbs among different animals. Our data supported both hypotheses. Correlations among antigen-specific NAbs were absent or weak, indicating that the measured NAbs did not have strongly overlapping antigen binding (i.e., similar polyreactivity), nor were they tightly linked (i.e. co-regulated). We observed significant differences in levels of antigen-specific NAbs among chicken breeds and lines, reinforcing the concept that NAbs are germline-encoded (6, 22, 40, 42, 48, 49, 52, 55). However, breed and line effects were not consistent among antigen-specific NAbs. For example, all three breeds differed in levels of anti-KLH and anti-OVA NAbs, but not anti-rRBC nor anti-PHA NAbs. Relative differences were not consistent among antigen-specific NAbs. For example, White Leghorn chickens had lower levels of anti-OVA NAbs compared to Rhode Island Red chickens, but levels of anti-KLH NAbs were similar between the two breeds. Levels of anti-OVA NAbs were different among all eight lines. In comparison, anti-KLH and -PHA NAbs were different among six lines, and anti-rRBCs NAbs differed among only two lines. These data show that subsets of NAbs have some degree of unique (non-overlapping) antigen specificity and are not tightly linked. Genetic differences among chickens affect levels of antigen-specific NAbs, but these genetic effects (i.e., breed and line differences) were not consistent among antigen-specific NAbs. These results raise important questions about the diversity of immunoglobulins in the NAb repertoire and the potential importance of antigen-specificity to NAb function and comparative immunology.
A hallmark of NAbs is polyreactivity (8, 9, 114) and binding to diverse antigens has been clearly demonstrated with studies using NAbs from monoclonal B-1 cells (7–9, 18, 24, 26). However, evidence in the literature illustrates that NAbs can have unique, non-overlapping ranges of antigen binding (8, 24) and structural diversity at the antigen binding site (114). Several reviews of NAbs have mentioned diversity of immunoglobulins in the NAb repertoire (11, 13) and this diversity is suggested to be essential to immune defense (9, 84). Despite this information, nearly all studies of NAbs are based on one or two antigens and the antigens used among studies are often different. Should we expect that measures of antigen-specific NAbs represent the broader NAb repertoire or reflect the activity of other natural antibodies? Evidence from the literature suggests that antigen-specific NAbs are not interchangeable.
In two notable studies, different red blood cells were used for hemagglutination assays of NAbs from the same animals. Bailey (53) observed that poultry sera agglutinated rabbit and rat red blood cells at a titer four times higher than the agglutination threshold for red blood cells from guinea pigs or frogs, and >20 times higher than the threshold for cells from sheep, turtle, or goat blood (53). Seto and Henderson (3) observed poultry sera agglutinated mouse red blood cells at a titer 1.5x higher than hamster red blood cells and 12x higher than blood cells from rabbits or sheep (3). The wide variation in NAb titers among different vertebrate red blood cells indicates that each assay measured a different antigen-specific natural antibody. This is perhaps unsurprising, given more recent analyses of the protein composition of red blood cells. Using quantitative mass spectrometry, Sae-Lee et al. (115) identified 1,944 distinct protein groups in human red blood cells, and Matei et al. (116) described multiple electrophoretic differences in red blood cell proteins among eight animal species, including sheep, rabbit, rat, and mouse. Molecular analyses of antigens used in NAb ELISAs also suggest significant structural diversity that could affect binding specificity. The KLH molecule, derived from the mollusk Megathura crenulate, is a ~390 kDa polypeptide with eight globular units (117). The OVA molecule, derived from egg white, is a 44.5 kDa glycoprotein with a tertiary structure (118, 119). Finally, a legume plant produces the PHA molecule, a 30.5 kDa glycoprotein with a quaternary structure (120). As with the agglutination assay, these molecular differences likely contribute to epitope variation among ELISAs. These antigen and epitope differences among NAb assays likely result in measurements of different subsets of NAbs (24, 70, 78, 121) which may affect analyses of NAbs relative to species differences, immune function, and ecology (27, 28, 30, 93).
Many studies have shown species and breed effects on levels of NAbs (6, 27, 28, 40, 42). However, to our knowledge, antigen specificity of NAbs has not been considered in comparative studies. Perhaps the best cited example of using NAbs as a comparative trait is Matson et al. (122). In that study, the authors compared levels of NAbs using agglutination assays with rabbit and trout red blood cells. Although the average NAb levels in the two assays were correlated (R2 = 0.62), there were cases where species effects were not identical for anti-rabbit and anti-trout RBC immunoglobulins. For example, the Chilean pintail (Anas georgica spinicauda) and white-winged wood duck (Cairina scutulata) had similar titers of NAbs binding rabbit red blood cells but dissimilar titers of NAbs binding trout red blood cells. In contrast, South Georgia pintail (Anas georgica georgica) and black-bellied tree duck (Dendrocygna autumnalis) had the opposite pattern (122). Other studies have reported variation in NAbs among chicken breeds (22, 55), but breed effects are not identical among NAb antigens (40). These inconsistencies among antigen-specific NAbs may reflect complexity in the genetic control of natural antibody diversity (62–65, 114).
Natural antibodies are considered important to innate immune defense (9, 11, 13), but it remains unclear if antigen specificity of NAbs affects defense. Monoclonal NAbs do not bind uniformly to all pathogens (8, 24) and they do not neutralize different pathogens equally in vitro (24). This suggests that antigen specificity could affect defenses provided by NAbs. Animal studies with chickens and pigs have reported positive (41, 123) or absent (1, 56) relationships between antigen-specific NAbs and survival. In pigeons, Owen et al. (21) observed that some antigen-specific NAbs were predictive of bird resistance to internal and external parasites, but other antigen-specific NAbs were not. In addition, the authors showed that pigeons with a more diverse repertoire of antigen-specific NAbs were more resistant to parasites (21). These various studies suggest that antigen-specific NAbs provide defense against a restricted range of parasites or pathogens, reinforcing the idea that immune defense from NAbs relies on a diverse repertoire of these immunoglobulins (9, 84).
The mechanism(s) of defense by NAbs are not entirely understood and remain an active area of investigation (1–6, 11, 14–17, 54, 100, 106, 107). Although NAbs are germline-encoded and produced prior to infection, evidence suggests that production of NAbs can increase following immune stimulation (52, 54, 68, 106, 106, 110, 111). However, increased production of NAbs appears to be antigen specific. Some antigen-specific NAbs increase with immune challenge, but others remain unchanged (27, 52, 54, 106, 112, 113). In addition, relationships between NAbs, adaptive antibodies, and other immune effectors vary depending on antigen specificity (49, 83). Matson et al. (122) measured 13 immunological parameters that included NAbs, complement proteins, antimicrobial activity, and leukocyte counts from 10 species of waterfowl. The authors used principal component analysis as a statistical approach to group correlated variables. The NAb and complement levels were measured using the hemagglutination-hemolysis assay that combines a measure of complement protein activity (blood cell lysis) with NAbs that mediate the binding of complement to the target blood cells (i.e., classical complement pathway) (21, 24, 77). As discussed above, Matson et al. (122) used trout and rabbit red blood cells in separate assays of the same samples. The lysis (complement) and antimicrobial measures grouped into different PCs based on antigen. One PC showed a positive correlation with trout cell lysis and killing of Staphylococcus aureus bacteria. In contrast, a different PC correlated positively with rabbit cell lysis but negatively with the killing of S. aureus. In this example, relationships between NAbs, complement, and bacteria killing changed depending on NAb antigen specificity (100). These studies strongly suggest that antigen-specificity of NAbs affects interactions with pathogens and the defenses provided by these immunoglobulins. Accurate and comprehensive understanding of NAbs and immune function requires consideration of antigen specificity.
The data reported here reveal that natural antibodies in poultry are composed of a diverse repertoire of immunoglobulins. Our data align with previous studies of NAbs in chickens that show both breed and selection line affect natural antibody levels (6, 22, 40, 42, 47–49, 52, 55). Selective breeding of poultry has revealed that some antigen-specific NAbs are associated with pathogen resistance (39–41) and survival (1, 56). However, the mechanism(s) of these effects are unknown. Natural antibodies may provide important immune defenses in chickens or serve as relevant markers for selection. In either case, identifying the effects of antigen specificity could reveal more targeted strategies for improving traits in these important livestock.
5 Conclusions
Natural antibodies are important components of the vertebrate immune system, and these molecules have proven valuable in studies of immune function, ecology, evolution, and livestock selection. These molecules are defined as polyreactive with low specificity (11, 13), but evidence from our studies and the literature reveal that antigen-specific NAbs are independent and have unique interactions with pathogens and parasites (8, 24). Thus, antigen-specific NAbs are not interchangeable. A comprehensive understanding of NAbs requires consideration for functional differences between antigen-specific NAbs and characterization of immunoglobulin diversity in the NAb repertoire. This leads to the question of how researchers should proceed with measurements of NAbs? Natural antibodies should be appreciated as a group of diverse immunoglobulins rather than treated as a singular effector (9, 84). Going forward, we recommend three approaches to the study of NAbs. The first is to reconcile the similarities and differences among antigen-specific NAbs (114). For example, by combining western blot analyses and affinity chromatography, researchers may be able to identify how antigen-specific NAbs are related (46, 51, 124, 125). Second, researchers could use a panel of antigens to measure the NAb repertoire (21), or design ELISAs that utilize several antigens at once (e.g., multiplex ELISA) (21, 126–128). These approaches would yield more complete measures of the NAb repertoire. Finally, as biochemical and genetic resources become available for non-model animal species, researchers should endeavor to determine the cellular and molecular characteristics of NAbs in different animal species.
Data availability statement
The raw data supporting the conclusions of this article will be made available by the authors, without undue reservation.
Ethics statement
The animal study was approved by WSU Institutional Animal Care and Use Committee. The study was conducted in accordance with the local legislation and institutional requirements.
Author contributions
KW: Data curation, Formal analysis, Investigation, Visualization, Writing – original draft, Writing – review & editing. JF: Resources, Writing – review & editing. JO: Conceptualization, Formal analysis, Funding acquisition, Investigation, Methodology, Project administration, Supervision, Validation, Visualization, Writing – review & editing.
Funding
The author(s) declare financial support was received for the research, authorship, and/or publication of this article. This work was funded by the United States Department of Agriculture, the National Institute of Food and Agriculture (award 2017–51106-27026), and the Carl H. Elling Endowment in the Washington State University School of Biological Sciences.
Acknowledgments
We would like to thank Hy-Line International for providing samples for this research.
Conflict of interest
The authors declare that the research was conducted in the absence of any commercial or financial relationships that could be construed as a potential conflict of interest.
The author(s) declared that they were an editorial board member of Frontiers, at the time of submission. This had no impact on the peer review process and the final decision.
Publisher’s note
All claims expressed in this article are solely those of the authors and do not necessarily represent those of their affiliated organizations, or those of the publisher, the editors and the reviewers. Any product that may be evaluated in this article, or claim that may be made by its manufacturer, is not guaranteed or endorsed by the publisher.
References
1. Sun Y, Parmentier HK, Frankena K, van der Poel JJ. Natural antibody isotypes as predictors of survival in laying hens. Poultry Sci. (2011) 90:2263–74. doi: 10.3382/ps.2011-01613
2. Rahyab AS, Alam A, Kapor A, Zhang M. Natural antibody - biochemistry and functions. Global J Biochem. (2011) 2:283–8. doi: 10.5114/ceji.2018.81354
3. Seto R, Henderson WG. Natural and immune hemagglutinin forming capacity of immature chickens. J Exp Zoology. (1968) 169:501–11. doi: 10.1002/jez.1401690412
4. Ochsenbein AF, Zinkernagel RM. Natural antibodies and complement link innate and acquired immunity. Immunol Today. (2000) 21:624–30. doi: 10.1016/S0167-5699(00)01754-0
5. Wieland WH, Orzáez D, Lammers A, Parmentier HK, Verstegen MWA, Schots A. A functional polymeric immunoglobulin receptor in chicken (Gallus gallus) indicates ancient role of secretory IgA in mucosal immunity. Biochem J. (2004) 380:669–76. doi: 10.1042/bj20040200
6. Van Der Klein SAS, Berghof TVL, Arts JAJ, Parmentier HK, van der Poel JJ, Bovenhuis H. Genetic relations between natural antibodies binding keyhole limpet hemocyanin and production traits in a purebred layer chicken line. Poultry Sci. (2015) 94:875–82. doi: 10.3382/ps/pev052
7. Smith FL, Baumgarth N. B-1 cell responses to infections. Curr Opin Immunol. (2019) 57:23–31. doi: 10.1016/j.coi.2018.12.001
8. Gunti S, Notkins AL. Polyreactive antibodies: function and quantification. J Infect Dis. (2015) 212:S42–6. doi: 10.1093/infdis/jiu512
9. Baumgarth N, Tung JW, Herzenberg LA. Inherent specificities in natural antibodies: a key to immune defense against pathogen invasion. Springer Semin Immun. (2005) 26:347–62. doi: 10.1007/s00281-004-0182-2
10. Roast MJ, Aranzamendi NH, Fan M, Teunissen N, Hall MD, Peters A. Fitness outcomes in relation to individual variation in constitutive innate immune function. Proc R Soc B. (2020) 287:20201997. doi: 10.1098/rspb.2020.1997
11. Reyneveld GI, Savelkoul HFJ, Parmentier HK. Current understanding of natural antibodies and exploring the possibilities of modulation using veterinary models. A review. Front Immunol. (2020) 11:1–19. doi: 10.3389/fimmu.2020.02139
12. Palma J, Tokarz-Deptuła B, Deptuła J, Deptuła W. Natural antibodies – facts known and unknown. cejoi. (2018) 43:466–75. doi: 10.5114/ceji.2018.81354
13. Holodick NE, Rodríguez-Zhurbenko N, Hernández AM. Defining natural antibodies. Front Immunol. (2017) 8:872. doi: 10.3389/fimmu.2017.00872
14. Grönwall C, Vas J, Silverman GJ. Protective roles of natural igM antibodies. Front Immun. (2012) 3. doi: 10.3389/fimmu.2012.00066
15. Panda S, Ding JL. Natural antibodies bridge innate and adaptive immunity. J Immunol. (2015) 194:13–20. doi: 10.4049/jimmunol.1400844
16. Maddur MS, Lacroix-Desmazes S, Dimitrov JD, Kazatchkine MD, Bayry J, Kaveri SV. Natural antibodies: from first-line defense against pathogens to perpetual immune homeostasis. Clinic Rev Allerg Immunol. (2020) 58:213–28. doi: 10.1007/s12016-019-08746-9
17. Murphy K, Weaver C. Janeway’s immunobiology. 9th edition. New York London: GS Garland Science, Taylor & Francis Group (2017).
18. Ochsenbein AF, Fehr T, Lutz C, Suter M, Brombacher F, Hengartner H, et al. Control of early viral and bacterial distribution and disease by natural antibodies. Science. (1999) 286:2156–9. doi: 10.1126/science.286.5447.2156
19. Minias P, Peng W-XV-H, Matson KD. Evolutionary trade-off between innate and acquired immune defences in birds. Front Zool. (2023) 20:32. doi: 10.1186/s12983-023-00511-1
20. Nwaogu CJ, Amar A, Nebel C, Isaksson C, Hegemann A, Sumasgutner P. Innate immune function and antioxidant capacity of nestlings of an African raptor covary with the level of urbanisation around breeding territories. J Anim Ecol. (2023) 92:124–41. doi: 10.1111/1365-2656.13837
21. Owen JP, Waite JL, Holden KZ, Clayton DH. Does antibody binding to diverse antigens predict future infection? Parasite Immunol. (2014) 36:573–84. doi: 10.1111/pim.12141
22. Star L, Frankena K, Kemp B, Nieuwland MGB, Parmentier HK. Natural humoral immune competence and survival in layers. Poultry Sci. (2007) 86:1090–9. doi: 10.1093/ps/86.6.1090
23. Dugovich BS, Peel MJ, Palmer AL, Zielke RA, Sikora AE, Beechler BR, et al. Detection of bacterial-reactive natural IgM antibodies in desert bighorn sheep populations. PloS One. (2017) 12:e0180415. doi: 10.1371/journal.pone.0180415
24. Zhou Z-H, Zhang Y, Hu Y-F, Wahl LM, Cisar JO, Notkins AL. The broad antibacterial activity of the natural antibody repertoire is due to polyreactive antibodies. Cell Host Microbe. (2007) 1:51–61. doi: 10.1016/j.chom.2007.01.002
25. Whiteman NK, Matson KD, Bollmer JL, Parker PG. Disease ecology in the Galápagos Hawk (Buteo galapagoensis): host genetic diversity, parasite load and natural antibodies. Proc R Soc B. (2006) 273:797–804. doi: 10.1098/rspb.2005.3396
26. Novaes E Brito RR, Dos Santos Toledo M, Labussiere GM, Dupin TV, De Campos Reis NF, Perez EC, et al. B-1 cell response in immunity against parasites. Parasitol Res. (2019) 118:1343–52. doi: 10.1007/s00436-019-06211-2
27. Matson KD, Ricklefs RE, Klasing KC. A hemolysis–hemagglutination assay for characterizing constitutive innate humoral immunity in wild and domestic birds. Dev Comp Immunol. (2005) 29:275–86. doi: 10.1016/j.dci.2004.07.006
28. Mendes L, Piersma T, Hasselquist D, Matson KD, Ricklefs RE. Variation in the innate and acquired arms of the immune system among five shorebird species. J Exp Biol. (2006) 209:284–91. doi: 10.1242/jeb.02015
29. MacColl E, Vanesky K, Buck JA, Dudek BM, Eagles-Smith CA, Heath JA, et al. Correlates of immune defenses in golden eagle nestlings. J Exp Zool. (2017) 327:243–53. doi: 10.1002/jez.2081
30. Bronikowski AM, Hedrick AR, Kutz GA, Holden KG, Reinke B, Iverson JB. Sex-specific innate immunity and ageing in long-lived fresh water turtles (Kinosternon flavescens: Kinosternidae). Immun Ageing. (2023) 20:11. doi: 10.1186/s12979-023-00335-x
31. Matson KD. Are there differences in immune function between continental and insular birds? Proc R Soc B. (2006) 273:2267–74. doi: 10.1098/rspb.2006.3590
32. Driessen MMG, Versteegh MA, Gerritsma YH, Tieleman BI, Pen I, Verhulst S. Effects of early-life conditions on innate immune function in adult zebra finches. J Exp Biol. (2021) 224:jeb242158. doi: 10.1242/jeb.242158
33. Hollemans MS, De Vries Reilingh G, De Vries S, Parmentier HK, Lammers A. Effects of early nutrition and sanitary conditions on antibody levels in early and later life of broiler chickens. Dev Comp Immunol. (2021) 117:103954. doi: 10.1016/j.dci.2020.103954
34. Driessen MMG, Versteegh MA, Gerritsma YH, Tieleman BI, Pen IR, Verhulst S. Effects of manipulated food availability and seasonality on innate immune function in a passerine. J Anim Ecol. (2022) 91:2400–11. doi: 10.1111/1365-2656.13822
35. Gethöffer F, Liebing J, Ronnenberg K, Curland N, Puff C, Wohlsein P, et al. The modulating effect of food composition on the immune system in growing ring-necked pheasants (Phasianus colchicus). PloS One. (2022) 17:e0277236. doi: 10.1371/journal.pone.0277236
36. Valdebenito JO, Halimubieke N, Lendvai Á.Z, Figuerola J, Eichhorn G, Székely T. Seasonal variation in sex-specific immunity in wild birds. Sci Rep. (2021) 11:1349. doi: 10.1038/s41598-020-80030-9
37. Chen Y, Tibbs-Cortes LE, Ashley C, Putz AM, Lim K-S, Dyck MK, et al. The genetic basis of natural antibody titers of young healthy pigs and relationships with disease resilience. BMC Genomics. (2020) 21:648. doi: 10.1186/s12864-020-06994-0
38. Tibbs LE, Ashley C, Putz AM, Lim K-S, Dyck MK, Fontin F, et al. Selection for increased natural antibody levels to improve disease resilience in pigs. Ames (Iowa: Iowa State University (2018). doi: 10.31274/ans_air-180814-285
39. Parmentier HK, Yousif Abuzeid S, De Vries Reilingh G, Nieuwland M, Graat AM. Immune responses and resistance to eimeria acervulina of chickens divergently selected for antibody responses to sheep red blood cells. Poultry Sci. (2001) 80:894–900. doi: 10.1093/ps/80.7.894
40. Minozzi G, Parmentier HK, Nieuwland MGB, Bed’hom B, Minvielle F, Gourichon D, et al. Antibody responses to keyhole limpet hemocyanin, lipopolysaccharide, and newcastle disease virus vaccine in F2 and backcrosses of white leghorn lines selected for two different immune response traits. Poultry Sci. (2007) 86:1316–22. doi: 10.1093/ps/86.7.1316
41. Berghof TVL, Matthijs MGR, Arts JAJ, Bovenhuis H, Dwars RM, van der Poel JJ, et al. Selective breeding for high natural antibody level increases resistance to avian pathogenic Escherichia coli (APEC) in chickens. Dev Comp Immunol. (2019) 93:45–57. doi: 10.1016/j.dci.2018.12.007
42. Bovenhuis H, Berghof TVL, Visker MHPW, Arts JAJ, Visscher J, van der Poel JJ, et al. Divergent selection for natural antibodies in poultry in the presence of a major gene. Genet Sel Evol. (2022) 54:24. doi: 10.1186/s12711-022-00715-9
43. Martínez J, Tomás G, Merino S, Arriero E, Moreno J. Detection of serum immunoglobulins in wild birds by direct ELISA: a methodological study to validate the technique in different species using antichicken antibodies: Detection of serum immunoglobulins. Funct Ecol. (2003) 17:700–6. doi: 10.1046/j.1365-2435.2003.00771.x
44. Matson KD, Tieleman BI, Klasing KC. Capture stress and the bactericidal competence of blood and plasma in five species of tropical birds. Physiol Biochem Zoology. (2006) 79:556–64. doi: 10.1086/501057
45. Star L, Nieuwland MGB, Kemp B, Parmentier HK. Effect of single or combined climatic and hygienic stress on natural and specific humoral immune competence in four layer lines. Poultry Sci. (2007) 86:1894–903. doi: 10.1093/ps/86.9.1894
46. Parmentier HK, Harms E, Lammers A, Nieuwland MGB. Age and genetic selection affect auto-immune profiles of chickens. Dev Comp Immunol. (2014) 47:205–14. doi: 10.1016/j.dci.2014.08.003
47. Baelmans R, Parmentier HK, Nieuwland MGB, Dorny P, Demey F, Berkvens D. Haemolytic Complement Activity and Humoral Immune Responses to Sheep Red Blood Cells in Indigenous Chickens and in Eight German Dahlem Red Chicken Lines with Different Combinations of Major Genes (dwarf, naked neck and frizzled) of Tropical Interest. Trop Anim Health Production. (2005) 37:173–86. doi: 10.1023/B:TROP.0000049274.28640.d7
48. Kuehn LA, Price SE, Honaker CF, Siegel PB. Antibody response of chickens to sheep red blood cells: crosses among divergently selected lines and relaxed sublines. Poultry Sci. (2006) 85:1338–41. doi: 10.1093/ps/85.8.1338
49. Wijga S, Parmentier HK, Nieuwland MGB, Bovenhuis H. Genetic parameters for levels of natural antibodies in chicken lines divergently selected for specific antibody response. Poultry Sci. (2009) 88:1805–10. doi: 10.3382/ps.2009-00064
50. Maghsoudi A, Vaziri E, Feizabadi M, Mehri M. Fifty years of sheep red blood cells to monitor humoral immunity in poultry: a scientometric evaluation. Poultry Sci. (2020) 99:4758–68. doi: 10.1016/j.psj.2020.06.058
51. De Jong BG, Lammers A, Oberendorf LAA, Nieuwland MGB, Savelkoul HFJ, Parmentier HK. Genetic and phenotypic selection affect natural (Auto-) antibody reactivity of chickens. PloS One. (2013) 8:e72276. doi: 10.1371/journal.pone.0072276
52. Bao M, Bovenhuis H, Nieuwland MGB, Parmentier HK, van der Poel JJ. Genetic parameters of IgM and IgG antibodies binding autoantigens in healthy chickens. Poultry Sci. (2016) 95:458–65. doi: 10.3382/ps/pev347
53. Bailey CE. A study of the normal and immune hemagglutinins of the domestic fowl with respect to their origin, specificity and identity*. Am J Epidemiol. (1923) 3:370–93. doi: 10.1093/oxfordjournals.aje.a118941
54. Neighbor NK, Skeeles JK, Beasley JN, Kreider DL. Use of an enzyme-linked immunosorbent assay to measure antibody levels in Turkey breeder hens, eggs, and progeny following natural infection or immunization with a commercial bordetella avium bacterin. Avian Dis. (1991) 35:315. doi: 10.2307/1591182
55. Sarrigeorgiou I, Stivarou T, Tsinti G, Patsias A, Fotou E, Moulasioti V, et al. Levels of circulating igM and igY natural antibodies in broiler chicks: association with genotype and farming systems. Biology. (2023) 12:304. doi: 10.3390/biology12020304
56. Haunshi S, Burramsetty AK, Kannaki TR, Rajkumar U. Survivability, immunity, growth and production traits in indigenous and White Leghorn breeds of chicken. Br Poultry Sci. (2019) 60:683–90. doi: 10.1080/00071668.2019.1639139
57. Berghof TVL, De Vries Reilingh G, Nieuwland MGB, Parmentier HK. Effect of aging and repeated intratracheal challenge on levels of cryptic and overt natural antibodies in poultry. Poultry Sci. (2010) 89:227–35. doi: 10.3382/ps.2009-00449
58. Parmentier HK, Lammers A, Hoekman JJ, Reilingh GDV, Zaanen ITA, Savelkoul HFJ. Different levels of natural antibodies in chickens divergently selected for specific antibody responses. Dev Comp Immunol. (2004) 28:39–49. doi: 10.1016/S0145-305X(03)00087-9
59. Bolek KJ, Klasing KC. The effects of vaccination with keyhole limpet hemocyanin or oral administration of Salmonella enterica serovar Enteritidis on the growth performance of immunoglobulin knockout chickens. Poultry Sci. (2019) 98:3504–13. doi: 10.3382/ps/pez172
60. Berghof TVL, Arts JAJ, Bovenhuis H, Lammers A, van der Poel JJ, Parmentier HK. Antigen-dependent effects of divergent selective breeding based on natural antibodies on specific humoral immune responses in chickens. Vaccine. (2018) 36:1444–52. doi: 10.1016/j.vaccine.2018.01.063
61. Živković I, Muhandes L, Petrušić V, Minić R, Dimitrijević. The effect of influenza vaccine immunization on natural antibodies. Arhiv za farmaciju. (2021) 71:207–23. doi: 10.5937/arhfarm71-31544
62. Berghof TVL, Visker MHPW, Arts JAJ, Parmentier HK, van der Poel JJ, Vereijken ALJ, et al. Genomic region containing toll-like receptor genes has a major impact on total igM antibodies including KLH-binding igM natural antibodies in chickens. Front Immunol. (2018) 8:1879. doi: 10.3389/fimmu.2017.01879
63. Siwek M, Buitenhuis B, Cornelissen S, Nieuwland M, Knol EF, Crooijmans R, et al. Detection of QTL for innate: Non-specific antibody levels binding LPS and LTA in two independent populations of laying hens. Dev Comp Immunol. (2006) 30:659–66. doi: 10.1016/j.dci.2005.09.004
64. Siwek M, Slawinska A, Rydzanicz M, Wesoly J, Fraszczak M, Suchocki T, et al. Identification of candidate genes and mutations in QTL regions for immune responses in chicken. Anim Genet. (2015) 46:247–54. doi: 10.1111/age.12280
65. Dorshorst BJ, Siegel PB, Ashwell CM. Genomic regions associated with antibody response to sheep red blood cells in the chicken. Anim Genet. (2011) 42:300–8. doi: 10.1111/j.1365-2052.2010.02146.x
66. Arango J, Wolc A, Owen J, Weston K, Fulton JE. Genetic variation in natural and induced antibody responses in layer chickens. Animals. (2024) 14:1623. doi: 10.3390/ani14111623
67. Wang X, Ye C, Lin X, Ma K, Xiao F, Dong L, et al. New insights into the significance of the BCR repertoire in B-1 cell development and function. Cell Mol Immunol. (2019) 16:772–3. doi: 10.1038/s41423-019-0249-6
68. Boes M, Esau C, Fischer MB, Schmidt T, Carroll M, Chen J. Enhanced B-1 cell development, but impaired igG antibody responses in mice deficient in secreted igM. J Immunol. (1998) 160:4776–87. doi: 10.4049/jimmunol.160.10.4776
69. Binder CJ, Silverman GJ. Natural antibodies and the autoimmunity of atherosclerosis. Springer Semin Immun. (2005) 26:385–404. doi: 10.1007/s00281-004-0185-z
70. Vale AM, Cavazzoni CB, Nobrega A, Schroeder HW. The global self-reactivity profile of the natural antibody repertoire is largely independent of germline DH sequence. Front Immunol. (2016) 7. doi: 10.3389/fimmu.2016.00296
71. Kubelkova K, Hudcovic T, Kozakova H, Pejchal J, Macela A. Early infection-induced natural antibody response. Sci Rep. (2021) 11, 1541. doi: 10.1038/s41598-021-81083-0
72. Owen JA, Punt J, Stranford SA, Jones PP. Kuby immunology. Seventh. New York, New York, USA: W.H. Freeman and Company (2009).
73. Graham DA, Mawhinney KA, McShane J, Connor TJ, Adair BM, Merza M. Standardization of enzyme-linked immunosorbent assays (ELISAs) for quantitative estimation of antibodies specific for infectious bovine rhinotracheitis virus, respiratory syncytial virus, parainfluenza-3 virus, and bovine viral diarrhea virus. J Vet Diagn Invest. (1997) 9:24–31. doi: 10.1177/104063879700900105
74. Zimmerman LM, Bowden RM, Vogel LA. Red-eared slider turtles lack response to immunization with keyhole limpet hemocyanin but have high levels of natural antibodies. ISRN Zoology. (2013) 2013:1–7. doi: 10.1155/2013/858941
75. Sharma N, Hunt PW, Hine BC, Sharma NK, Swick RA, Ruhnke I. Detection of Ascaridia galli infection in free-range laying hens. Veterinary Parasitol. (2018) 256:9–15. doi: 10.1016/j.vetpar.2018.04.009
76. Zerna G, Cameron TC, Toet H, Spithill TW, Beddoe T. Bovine Natural Antibody Relationships to Specific Antibodies and Fasciola hepatica Burdens after Experimental Infection and Vaccination with Glutathione S-Transferase. Veterinary Sci. (2022) 9:58. doi: 10.3390/vetsci9020058
77. Cushing JE, Sprague L. The agglutination of fish erythrocytes by normal human sera. Biol Bull. (1952) 103:328–35. doi: 10.2307/1538415
78. Logtenberg T. Properties of polyreactive natural antibodies to self and foreign antigens. J Clin Immunol. (1990) 10:137–40. doi: 10.1007/BF00917912
79. Engelmaier A, Arno Butterweck H, Weber A. Measurement of low avidity, polyreactive immunoglobulin G antibodies with increased sensitivity by using low ionic strength buffers. J Anal Tech Res. (2022) 04:71–88. doi: 10.26502/jatri
80. Zhou Z, Wild T, Xiong Y, Sylvers LH, Zhang Y, Zhang L, et al. Polyreactive antibodies plus complement enhance the phagocytosis of cells made apoptotic by UV-light or HIV. Sci Rep. (2013) 3:2271. doi: 10.1038/srep02271
81. Notkins AL. Polyreactivity of antibody molecules. Trends Immunol. (2004) 25:174–9. doi: 10.1016/j.it.2004.02.004
82. Binder CJ. Natural igM antibodies against oxidation-specific epitopes. J Clin Immunol. (2010) 30:56–60. doi: 10.1007/s10875-010-9396-3
83. Benatuil L, Kaye J, Rich RF, Fishman JA, Green WR, Iacomini J. The influence of natural antibody specificity on antigen immunogenicity. Eur J Immunol. (2005) 35:2638–47. doi: 10.1002/eji.200526146
84. Baumgarth N. Innate-like B cells and their rules of engagement. In: Katsikis PD, Schoenberger SP, Pulendran B, editors. Crossroads between innate and adaptive immunity IV, vol. 785 . Springer New York, New York, NY (2013). p. 57–66. Advances in Experimental Medicine and Biology.
85. Gudmundsdóttir S, Magnadóttir B, Björnsdóttir B, Árnadóttir H, Gudmundsdóttir BK. Specific and natural antibody response of cod juveniles vaccinated against Vibrio Anguillarum. Fish Shellfish Immunol. (2009) 26:619–24. doi: 10.1016/j.fsi.2008.09.017
86. Miyumo S, Wasike CB, Ilatsia ED, Bennewitz J, Chagunda MG. Genetic and non-genetic factors influencing KLH binding natural antibodies and specific antibody response to Newcastle disease in Kenyan chicken populations. J Anim Breed Genet. (2023) 140:106–20. doi: 10.1111/jbg.12738
87. Kachamakova NM, Irnazarow I, Parmentier HK, Savelkoul HFJ, Pilarczyk A, Wiegertjes GF. Genetic differences in natural antibody levels in common carp (Cyprinus carpio L.). Fish Shellfish Immunol. (2006) 21:404–13. doi: 10.1016/j.fsi.2006.01.005
88. Leclaire S, Czirják GÁ, Hammouda A, Gasparini J. Feather bacterial load shapes the trade-off between preening and immunity in pigeons. BMC Evol Biol. (2015) 15:60. doi: 10.1186/s12862-015-0338-9
89. Sandmeier FC, Tracy CR, Dupré S, Hunter K. A trade-off between natural and acquired antibody production in a reptile: implications for long-term resistance to disease. Biol Open. (2012) 1:1078–82. doi: 10.1242/bio.20122527
90. Silva TH, Celestino ML, Menta PR, Neves RC, Ballou MA, MaChado VS. Associations between circulating levels of natural antibodies, total serum immunoglobulins, and polymorphonuclear leukocyte function in early postpartum dairy cows. Veterinary Immunol Immunopathology. (2020) 222:110026. doi: 10.1016/j.vetimm.2020.110026
91. Ujvari B, Madsen T. Do natural antibodies compensate for humoral immunosenescence in tropical pythons?: Natural antibodies and immunosenescence in pythons. Funct Ecol. (2011) 25:813–7. doi: 10.1111/fec.2011.25.issue-4
92. Minozzi G, Parmentier HK, Mignon-Grasteau S, Nieuwland MG, Bed’hom B, Gourichon D, et al. Correlated effects of selection for immunity in White Leghorn chicken lines on natural antibodies and specific antibody responses to KLH and M. butyricum. BMC Genet. (2008) 9:5. doi: 10.1186/1471-2156-9-5
93. Racca AL, Eberhardt AT, Moreno PG, Baldi C, Beldomenico PM. Differences in natural antibody titres comparing free-ranging guanacos (Lama guanicoe) and capybaras (Hydrochoerus hydrochaeris). Veterinary J. (2014) 199:308–9. doi: 10.1016/j.tvjl.2013.10.036
94. Hangalapura BN, Nieuwland MGB, De Vries Reilingh G, Van Den Brand H, Kemp B, Parmentier HK. Durations of cold stress modulates overall immunity of chicken lines divergently selected for antibody responses. Poultry Sci. (2004) 83:765–75. doi: 10.1093/ps/83.5.765
95. Berghof TVL, van der Klein SAS, Arts JAJ, Parmentier HK, van der Poel JJ, Bovenhuis H. Genetic and non-genetic inheritance of natural antibodies binding keyhole limpet hemocyanin in a purebred layer chicken line. PloS One. (2015) 10:e0131088. doi: 10.1371/journal.pone.0131088
96. Sun Y, Ellen ED, Parmentier HK, van der Poel JJ. Genetic parameters of natural antibody isotypes and survival analysis in beak-trimmed and non-beak-trimmed crossbred laying hens. Poultry Sci. (2013) 92:2024–33. doi: 10.3382/ps.2013-03144
97. Adriaansen-Tennekes R, De VriesReilingh G, Nieuwland MGB, Parmentier HK, Savelkoul HFJ. Chicken lines divergently selected for antibody responses to sheep red blood cells show line-specific differences in sensitivity to immunomodulation by diet. Part I: Humoral parameters. Poultry Sci. (2009) 88:1869–78. doi: 10.3382/ps.2009-00159
98. Thompson-Crispi KA, Miglior F, Mallard BA. Genetic parameters for natural antibodies and associations with specific antibody and mastitis in Canadian Holsteins. J Dairy Sci. (2013) 96:3965–72. doi: 10.3168/jds.2012-5919
99. Ndithia HK, Matson KD, Muchai M, Tieleman BI. Immune function differs among tropical environments but is not downregulated during reproduction in three year-round breeding equatorial lark populations. Oecologia. (2021) 197:599–614. doi: 10.1007/s00442-021-05052-0
100. Madsen T, Ujvari B, Nandakumar KS, Hasselquist D, Holmdahl R. Do “infectious” prey select for high levels of natural antibodies in tropical pythons? Evol Ecol. (2007) 21:271–9. doi: 10.1007/s10682-006-9004-4
101. The American standard of perfection, illustrated. A complete description of all recognized varieties of fowls. Boston, Massachusetts, USA: The American Poultry Associaation (1921).
102. Leenstra F, Ten Napel J, Visscher J, Van Sambeek F. Layer breeding programmes in changing production environments: a historic perspective. World’s Poultry Sci J. (2016) 72:21–36. doi: 10.1017/S0043933915002743
104. Ashraf M. Poultry breeding and selection. In: Poultry production technology Faisalabad, Pakistan: University of Agriculture (2017). p. 28–41.
105. Versteegh MA, Helm B, Kleynhans E, Gwinner E, Tieleman I. Genetic and phenotypically flexible components of seasonal variation in immune function. J Exp Biol. (2014) 217(9):1510–8. doi: 10.1242/jeb.097105
106. Aastrup C, Hegemann A. Jackdaw nestlings rapidly increase innate immune function during the nestling phase but no evidence for a trade-off with growth. Dev Comp Immunol. (2021) 117:103967. doi: 10.1016/j.dci.2020.103967
107. Pardal S, Alves JA, Mota PG, Ramos JA. Dressed to impress: breeding plumage as a reliable signal of innate immunity. J Avian Biol. (2018) 49. doi: 10.1111/jav.01579
108. Kumar S, Kumar Y, Malhotra DV, Dhar S, Nichani AK. Standardisation and comparison of serial dilution and single dilution enzyme linked immunosorbent assay (ELISA) using different antigenic preparations of the Babesia (Theileria) equi parasite. Vet Res. (2003) 34:71–83. doi: 10.1051/vetres:2002055
109. Fialová L, Petráčková M, Kuchař O. Comparison of different enzyme-linked immunosorbent assay methods for avidity determination of antiphospholipid antibodies. J Clin Lab Anal. (2017) 31:e22121. doi: 10.1002/jcla.22121
110. Miura K, Orcutt AC, Muratova OV, Miller LH, Saul A, Long CA. Development and characterization of a standardized ELISA including a reference serum on each plate to detect antibodies induced by experimental malaria vaccines. Vaccine. (2008) 26:193–200. doi: 10.1016/j.vaccine.2007.10.064
111. Revelle W. psych: procedures for psychological, psychometric, and personality research. Evanston, Illinois: Northwestern University (2024).
113. Lenth RV, Bolker B, Buerkner P, Giné-Vázquez I, Herve M, Jung M, et al. emmeans: estimated marginal means, aka least-squares means. (2024).
114. Lecerf M, Lacombe RV, Dimitrov JD. Polyreactivity of antibodies from different B-cell subpopulations is determined by distinct sequence patterns of variable region. Front Immunol. (2023) 14:1266668. doi: 10.3389/fimmu.2023.1266668
115. Sae-Lee W, McCafferty CL, Verbeke EJ, Havugimana PC, Papoulas O, McWhite CD, et al. The protein organization of a red blood cell. Cell Rep. (2022) 40:111103. doi: 10.1016/j.celrep.2022.111103
116. Matei H, Frentescu L, Benga Gh. Comparative studies of the protein composition of red blood cell membranes from eight mammalian species. J Cell Mol Medi. (2000) 4:270–6. doi: 10.1111/j.1582-4934.2000.tb00126.x
117. Harris JR, Markl J. Keyhole limpet hemocyanin (KLH): a biomedical review. Micron. (1999) 30:597–623. doi: 10.1016/S0968-4328(99)00036-0
118. Da Silva M, Beauclercq S, Harichaux G, Labas V, Guyot N, Gautron J, et al. The family secrets of avian egg-specific ovalbumin and its related proteins Y and X. Biol Reprod. (2015) 93:1–7. doi: 10.1095/biolreprod.115.130856
119. Kanaka KK, Jeevan C, Chethan RR, Sagar NG, Prasad R, Kotresh P, et al. A review on ovalbumin gene in poultry. J Entomology Zoology Stud. (2018) 6:1497–503.
120. Baumgartner P, Raemaekers RJM, Durieux A, Gatehouse A, Davies H, Taylor M. Large-scale production, purification, and characterisation of recombinant Phaseolus vulgaris phytohemagglutinin E-form expressed in the methylotrophic yeast Pichia pastoris. Protein Expression Purification. (2002) 26:394–405. doi: 10.1016/S1046-5928(02)00555-7
121. Chen H-S, Hou S-C, Jian J-W, Goh K-S, Shen S-T, Lee Y-C, et al. Predominant structural configuration of natural antibody repertoires enables potent antibody responses against protein antigens. Sci Rep. (2015) 5:12411. doi: 10.1038/srep12411
122. Matson KD, Cohen AA, Klasing KC, Ricklefs RE, Scheuerlein A. No simple answers for ecological immunology: relationships among immune indices at the individual level break down at the species level in waterfowl. Proc R Soc B. (2006) 273:815–22. doi: 10.1098/rspb.2005.3376
123. Martin RK, Damle SR, Valentine YA, Zellner MP, James BN, Lownik JC, et al. B1 cell igE impedes mast cell-mediated enhancement of parasite expulsion through B2 igE blockade. Cell Rep. (2018) 22:1824–34. doi: 10.1016/j.celrep.2018.01.048
124. Vaillant AJ, Ferrer-Cosme B. Production of antibodies in egg whites of chickens. Curr J Appl Sci Technol. (2021) 40:17–22. doi: 10.9734/cjast/2021/v40i1531409
125. Ayyar BV, Arora S, Murphy C, O’Kennedy R. Affinity chromatography as a tool for antibody purification. Methods. (2012) 56:116–29. doi: 10.1016/j.ymeth.2011.10.007
126. Nussey DH, Watt KA, Clark A, Pilkington JG, Pemberton JM, Graham AL, et al. Multivariate immune defences and fitness in the wild: complex but ecologically important associations among plasma antibodies, health and survival. Proc R Soc B. (2014) 281:20132931. doi: 10.1098/rspb.2013.2931
127. Ionov S, Lee J. An immunoproteomic survey of the antibody landscape: insights and opportunities revealed by serological repertoire profiling. Front Immunol. (2022) 13:832533. doi: 10.3389/fimmu.2022.832533
Keywords: chickens, disease ecology, immunoglobulin, innate immunity, selection
Citation: Weston K, Fulton JE and Owen J (2024) Antigen specificity affects analysis of natural antibodies. Front. Immunol. 15:1448320. doi: 10.3389/fimmu.2024.1448320
Received: 13 June 2024; Accepted: 22 July 2024;
Published: 07 August 2024.
Edited by:
Rami A. Dalloul, University of Georgia, United StatesReviewed by:
Vikash Kumar, Central Inland Fisheries Research Institute (ICAR), IndiaChristi L. Swaggerty, Agricultural Research Service (USDA), United States
Copyright © 2024 Weston, Fulton and Owen. This is an open-access article distributed under the terms of the Creative Commons Attribution License (CC BY). The use, distribution or reproduction in other forums is permitted, provided the original author(s) and the copyright owner(s) are credited and that the original publication in this journal is cited, in accordance with accepted academic practice. No use, distribution or reproduction is permitted which does not comply with these terms.
*Correspondence: Jeb Owen, am93ZW5Ad3N1LmVkdQ==; Kendra Weston, a2VuZHJhLndlc3RvbkB3c3UuZWR1