 Silvia Pegoraro1
 Andrea Balduit1
 Alessandro Mangogna1
 Uday Kishore2,3
 Giuseppe Ricci1,4
 Chiara Agostinis1*
 Roberta Bulla5
- 1Institute for Maternal and Child Health, IRCCS Burlo Garofolo, Trieste, ;Italy
- 2Department of Veterinary Medicine, United Arab Emirates (U.E.A.) University, Al Ain, ;United Arab Emirates
- 3Zayed Centre for Health Sciences, U.E.A. University, Al Ain, ;United Arab Emirates
- 4Department of Medical, Surgical and Health Science, University of Trieste, Trieste, ;Italy
- 5Department of Life Sciences, University of Trieste, Trieste, ;Italy
Human C1q is a multifaceted complement protein whose functions range from activating the complement classical pathway to immunomodulation and promoting placental development and tumorigenesis. It is encoded by the C1QA, C1QB, and C1QC genes located on chromosome 1. C1q, unlike most complement components, has extrahepatic expression by a range of cells including macrophages, monocytes and immature dendritic cells. Its local synthesis under the conditions of inflammation and for the purpose of removal of altered self requires its strict transcriptional regulation. To delve into C1Q transcriptional regulation and unravel potential epigenetic influences, we conducted an in silico analysis utilizing a range of online tools and datasets. Co-expression analysis revealed tight coordination between C1QA, C1QB, and C1QC genes. Strikingly, distinct epigenetic patterns emerged across various cell types expressing or lacking these genes, with unique histone marks and DNA methylation status characterizing their regulatory landscape. Notably, the investigation extended to tumor contexts, unveiled potential epigenetic roles in malignancies. The cell type and tumor-specific histone modifications and chromatin accessibility patterns underscore the dynamic nature of epigenetic regulation of C1Q, providing crucial insights into the intricate mechanisms governing the expression of these immunologically significant genes. The findings provide a foundation for future investigations into targeted epigenetic modulation, offering insights into potential therapeutic avenues for immune-related disorders and cancer mediated via C1q.
Introduction
The complement system is a tightly regulated enzymatic cascade of over 50 plasma and membrane proteins, whose activation leads to the killing and clearance of pathogens through the formation of opsonins, anaphylatoxins, and the membrane attack complex. Complement activation can occur via the classical, lectin, and alternative pathways (1, 2). The classical pathway is mainly activated by the binding of C1q to IgG- and IgM-containing immune complexes, or a range non-self (pathogen) and altered self (β-amyloid peptide, prion protein) ligands (3, 4); the lectin pathway is activated when mannan-binding lectin recognizes non-self-carbohydrate structures (5). The alternative pathway is activated when C3 spontaneously undergoes hydrolysis to generate C3b, which then interacts with various proteins, lipids, and carbohydrates on the pathogen surface (6, 7). Activation of the classical or lectin pathway leads to the breakdown of C4 and C2, resulting in the formation of C3 convertase (C4b2b), which cleaves C3 to produce C3b. In the alternative pathway, hydrolysis of the internal thioester bond in C3 produces C3(H2O), which binds to factor B, leading to its cleavage by factor D into Bb. This generates C3(H2O) Bb.
C1q is the target recognition subcomponent of the classical pathway and serves as a fundamental bridge between innate and adaptive immunity. Human C1q is a structurally complex hexameric glycoprotein (460 kDa), which associates with the Ca2+-dependent C1r2–C1s2 tetramer to form the pentameric C1, the first component of the complement classical pathway (8, 9). The basic subunit of C1q is composed of an N-terminal collagen-like region and a C-terminal globular domain (gC1q). The gC1q is the ligand recognition domain and has a heterotrimeric structure composed of the C-terminal halves of the A (ghA), B (ghB), and C (ghC) chains (10). Being a charge pattern recognition molecule, C1q can bind a diverse range of self and non-self ligands via its gC1q domain and then trigger the classical pathway following binding to antigen-antibody complex (11). In addition, C1q also binds to membrane blebs of apoptotic cells, thus promoting efferocytosis. Impaired clearance of apoptotic cells occurring due to C1q deficiencies can prompt autoantibody production, as in systemic lupus erythematosus (12, 13).
The C1Q gene cluster is located on chromosome 1 within a genomic region of ∼25 kb; it consists of three individual genes (i.e., C1QA, C1QC, and C1QB) in the same strand orientation (+ strand), being around 4.6, 8.9, and 5.0 kb long, respectively. Each gene is composed of three exons, two of which contain the sequence that is translated into protein. Phylogenetic analysis uncovered that C1QA, C1QB, and C1QC may derive from duplication of a single copy of a potential ancestor identified as C1QB; moreover, the C1q family seems closely related to the EMILIN family (11, 14, 15). The human C1q domain containing (C1qDC) proteins are a large group of proteins, whose members have been mainly categorized into two sub-families based on their sequence homology: the larger sub-family includes the C1q-like and cerebellin-like subgroups, while the smaller is composed of EMILINs and multimerins (11, 16). Interestingly, 32 open reading frames encoding C1qDC proteins have been identified within the human genome (17). C1qDC proteins are pivotal signaling molecules that control inflammation, adaptive immunity, and energy balance, suggesting their potential exploration as therapeutics or targets in drug development (17).
Although the production of complement proteins is mostly in the liver, C1q is extrahepatically synthesized by tissue macrophages, immature dendritic cells (DCs), and other myeloid-derived cells (18–20). The evolutionary advantages and transcriptional mechanisms underlying C1q production by these potent phagocytes and antigen-presenting cells are still poorly understood. The extrahepatic synthesis of C1q is also associated with its complement-activation independent functions. Alternative roles of C1q concern its capability to promote angiogenesis and placental development (21, 22). It has been reported that C1q may act as a proangiogenic factor in several contexts, such as wound healing (23), placentation (24), and tumor progression (25), in addition to neural development, ageing, and autoimmunity (26).
Studies investigating C1Q transcriptional regulation have identified specific transcription factors capable of activating C1Q promoters. Interestingly, the transcription of the three genes is synchronized, with a 53-bp element as a regulatory region on C1QB promoter and two transcription factors bound to this region, namely PU.1 and IRF8 (27). PU-1 was also demonstrated to regulate decidual C1Q expression in pregnancy (28). In addition, the transcription factor, MafB, specifically expressed by monocytes and macrophages, binds to and activates the transcription of each C1Q gene (29). However, little is known regarding the mechanisms of modulation of C1Q expression, in particular, at the level of the tumor microenvironment (25, 30, 31).
Over the past decade, multi-omic technologies have undergone significant advancements enabling comprehensive characterization of gene expression profiles in various cells and tissues, physio-pathological conditions. These methodologies have been instrumental in elucidating intricate regulatory mechanisms governing gene expression, including epigenetic variations and protein expression dynamics. Epigenetics plays a pivotal role in establishing and maintaining cellular identity, responding dynamically to developmental cues and environmental stimuli, thereby orchestrating precise gene expression patterns that are unique to distinct cellular states (32, 33). Broadly categorized, epigenetic modifications encompass post-transcriptional histone alterations, DNA methylation, and regulatory non-coding RNA molecules. The regulatory role of histone acetylation, exemplified by H3K27ac (acetylation of lysine 27 on histone H3 protein subunit), is closely linked to transcriptional activation, whereas histone methylation exhibits a nuanced impact, capable of both activating (e.g., H3K4me1 and H3K4me3) and repressing (e.g., H3K27me3) transcription, depending on the specific histone site and the extent of methylation (34). Additionally, DNA methylation predominantly occurs at CpG dinucleotides within gene promoters, exerting transcriptional repression by recruiting repressive complexes to methylated promoters (35).
In the current study, we aimed to examine the transcriptional regulation of C1QA, C1QB, and C1QC, by exploiting publicly available tools and datasets. We particularly focused on the epigenetic dynamics underlying C1Q expression, and providing critical insights into the intriguing contribution of C1Q in the tumor microenvironment.
Methods
Zenbu gene expression analysis and FANTOM-CAT analysis
Human C1Q gene locus (comprising C1QA, C1QB, and C1QC) analysis was performed using Zenbu browser genomic data visualization tool from FANTOM5 project (https://fantom.gsc.riken.jp/zenbu/gLyphs/#config=FANTOM5_promoterome_hg38;loc=hg38). FANTOM5 project is established by FANTOM, an international research consortium, a part of the RIKEN research institute in Japan. Zenbu browser was used to visualize C1QA, C1QB, and C1QC genes, manually selecting specific tracks to show: chromosomal location, transcripts identified by Gencode, UCSC, and FANTOM6 CAT projects, transcription start site (TSS) usage and their expression in primary cells, cell lines, and tissues of the dataset (ALL libraries), retrieved by FANTOM5 CAGE project. A specific search was carried out by selecting the terms “monocyte and macrophage” and “endothelial progenitor cells”. FANTOM Cage-Associated Transcriptome (FANTOM-CAT) gene section was used to achieve sample ontology association and dynamic expression (https://fantom.gsc.riken.jp/cat/v1/#/genes). Using the FANTOM-CAT gene section browser, we retrieved the above individual information for C1QA, C1QB, and C1QC genes; then we compared the data for each gene with others to find similarities or differences.
Epigenome in silico analysis
Zenbu genome browser epigenome view from the FANTOM5 project (https://fantom.gsc.riken.jp/zenbu/gLyphs/index.html#config=znpe_pvEJZfn_jkf_a18rB;loc=hg19), and Ensembl genome browser (https://www.ensembl.org/index.html) were used to analyze the epigenomic state of C1Q gene locus, selecting data from specific histone modification. For both analyses, we first selected the C1Q gene locus, then searched for specific cell types of interest and sorted them out. Thus, we retrieved specific epigenomic data for these cell types, selecting the following markers: DNAse I and the histone modifications (i.e., H3K27ac, H3K4me3, H3K4me1, and H3K27me3 for Zenbu analysis; H3K27ac, H2K27me3, H3K4me1, H3K4me3, and H3K9me3 for Ensembl analysis).
For DNA methylation analysis on C1Q gene locus in normal cells and tissues, we used the UCSC genome browser (https://genome.ucsc.edu/) selecting the DNA methylation data from MethBase, a publicly available database as a track hub in the UCSC Genome Browser (https://smithlabresearch.org/software/methbase/). MethBase is a reference methylome database created from public Bisulfite sequencing datasets. Then, we retrieved methylome information about the cell types of our interest present in the dataset, using data from the methylation levels at individual sites and hypo- or hyper-methylated regions already identified by MethBase.
Epigenome and gene expression analysis in tumor samples
The Shiny Methylation Analysis Resource Tool (SMART; http://www.bioinfo-zs.com/smartapp/) (36) was used for the differential methylation analysis of C1QA, C1QB, and C1QC genes among different tumor types and corresponding normal tissues. The results are presented as aggregation box plots showing the mean of the beta-value of methylation of all the selected probes for each gene analyzed.
The correlation between methylation levels, expressed in beta-value, and gene expression of mRNA levels (Log2-scaled, TPM+1) was analyzed by Spearman correlation for any given set of The Cancer Genome Atlas (TCGA) through the SMART correlation function.
For correlation analysis between C1QA expression levels and the expression of gene signature composed by C1QB and C1QC, we used Gene Expression Profiling Interactive Analysis 2 (GEPIA2) database (http://gepia2.cancer-pku.cn/#index) (37) using TCGA normal samples and GTEx datasets. Spearman correlation coefficient was employed. The analysis of the expression profile of each C1Q gene in tumor vs normal samples was performed by GEPIA2 Expression Analysis tool. Kidney Renal Clear Cell Carcinoma (KIRC) tumor type (n = 523) was selected, and matched TCGA normal and GTEx data were used as normal samples (n = 100). The expression values were expressed in logTPM+1 (cut off=1), p-value (cut off=0.01).
Results
Integrated analysis of TSS usage and dynamic expression patterns reveals co-expression and functional association of human C1QA, C1QB, and C1QC genes
To investigate the human C1Q gene locus, we first used hCAGE expression data generated by the FANTOM5 Consortium. The FANTOM5 project profiles 1829 samples of a diverse range of cell types, including primary cells, cell lines, and tissues. It accurately maps promoter regions and epigenomic marks, and describes the transcriptional profile of protein-coding and long non-coding genes (38, 39). The Zenbu browser genomic data visualization tool from FANTOM-CAT (40, 41) provided us the transcriptional landscape and the dynamic expression profiles of human C1Q genes. Human C1q is encoded by three genes (i.e., C1QA, C1QB, and C1QC), which are close to one another (in A-C-B order) in sense orientation on chromosome 1, as shown in Figure 1. As natural antisense transcription is increasingly recognized as a relevant layer of gene expression regulation (42), we searched for antisense transcription within the C1Q gene locus. Since we did not find any transcript signal, we could exclude the presence of C1q gene expression regulation based on natural antisense transcripts. The proximity of C1QA, C1QB, and C1QC genomic location underscores a potential interplay in their expression regulation. Indeed, our analysis of TSS usage across various samples revealed a consistent and significant co-expression of the three genes (Figure 1; Supplementary Table 1). Utilizing extensively FANTOM-CAT data visualization in Zenbu, we identified a robust association of C1QA, C1QB, and C1QC gene expression with CD14+ endothelial progenitor cells (EPCs), monocytes, and macrophages (Figure 1; Table 1). Functional annotations unveiled a pronounced enrichment in the immune system ontology, specifically associated with hematopoietic cells, monocytes, and macrophages (Figure 1; Table 1), emphasizing their vital role in immune response regulation. Exploring the dynamic expression patterns, all three genes exhibited significant associations with the same sample series (i.e., aortic smooth muscle cell response to Fibroblast growth factor 2, macrophages response to influenza virus infection, and preadipocyte maturation). However, only C1QB expression showed an association for “Monocyte response upon treatment”. (Table 2). Moreover, we interrogated GTEx and TCGA dataset using GEPIA tool to analyze the correlation of C1QA, C1QB, and C1QC expression in normal samples. In both dataset, we observed a strong correlation between the expression of the three genes (Figures 2A, B).
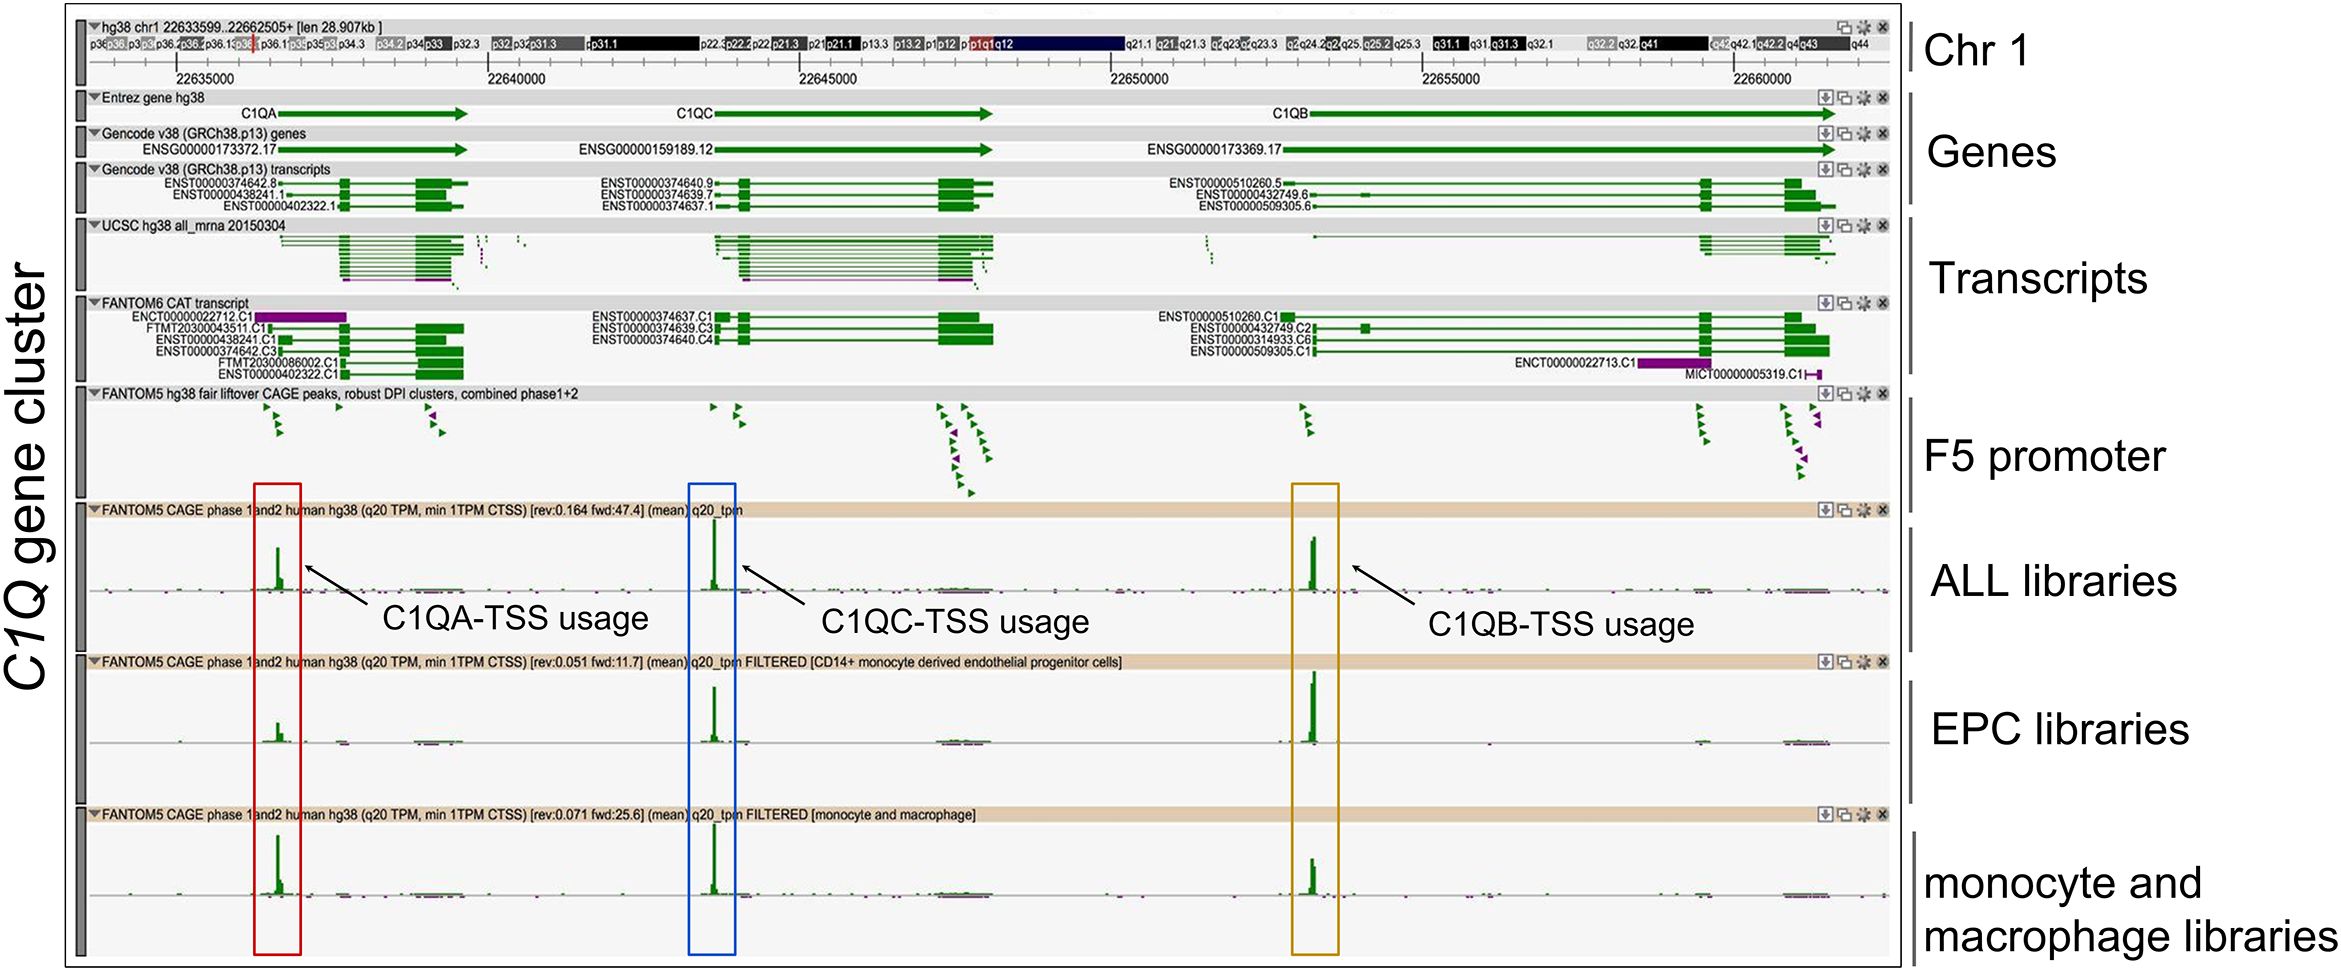
Figure 1. Fantom CAT analysis of C1Q gene cluster. Zenbu genome browser view of gene cluster for human C1Q. Genes and transcripts are color-coded according to their orientation in the genome (+ strand, green; – strand, purple). Upper panel reports from top to bottom: Genomic coordinates, Gencode Gene bodies and transcripts, annotated UCSC transcripts, and Robust FANTOM6-CAT transcripts, with exon (thick lines) and intron (thin lines) boundaries. FANTOM5 promoters (robust CAT clusters and robust DPI) are indicated as arrowheads. Expression profile visualized as quantitative histogram by FANTOM5 CAGE TSS (Transcription Start Sites) as the mean of rle (relative log expression) derived from ALL libraries (n = 1,829 samples), derived from EPC (CD14+ monocyte-derived Endothelial Progenitor Cells), and monocyte plus macrophage libraries, are shown. C1QA, C1QB, and C1QC TSS are highlighted by red, yellow, and blue boxes respectively.
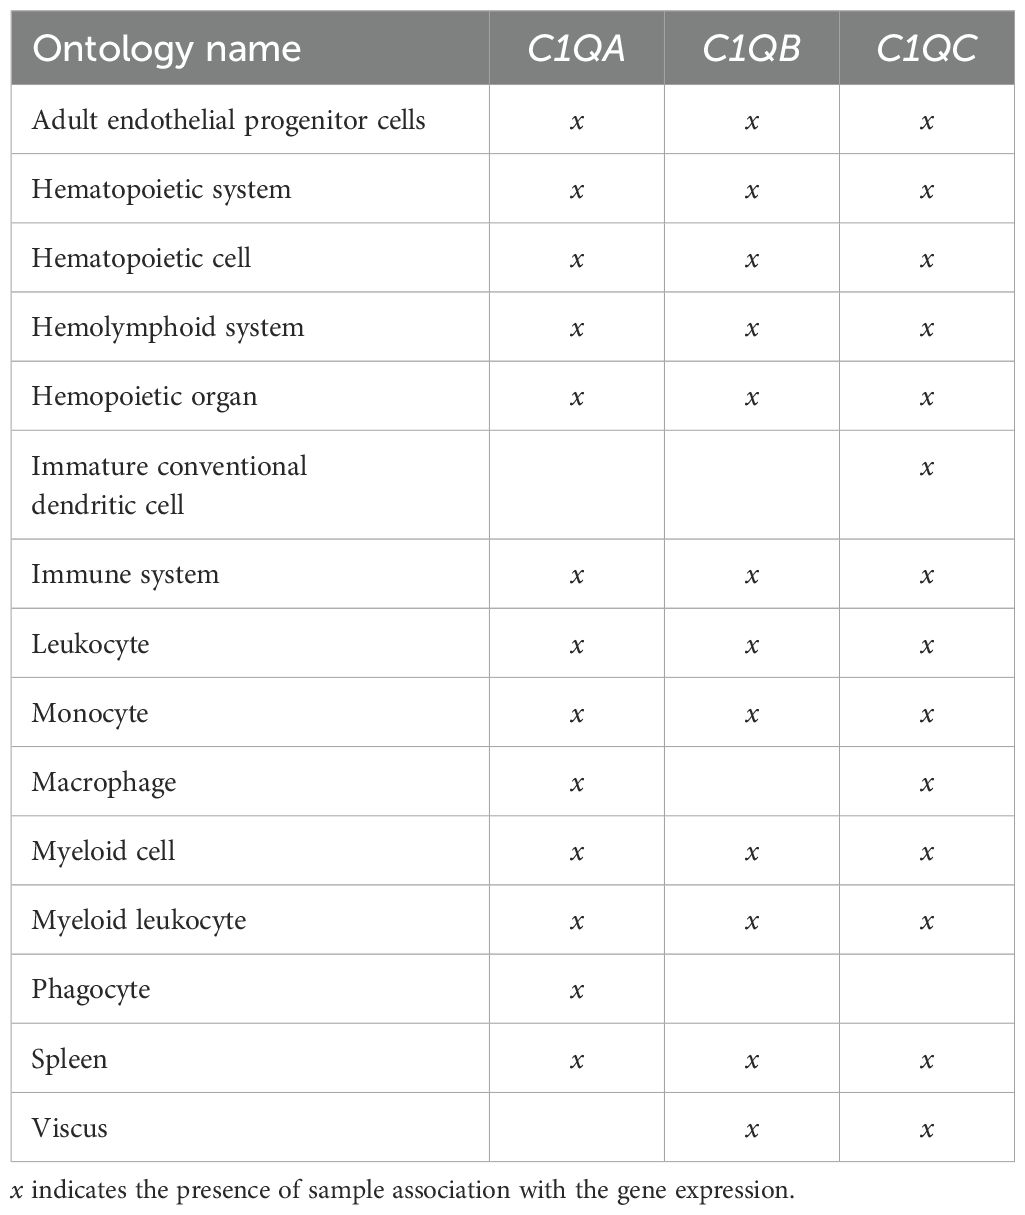
Table 1. Sample association of C1QA, C1QB, and C1QC genes.
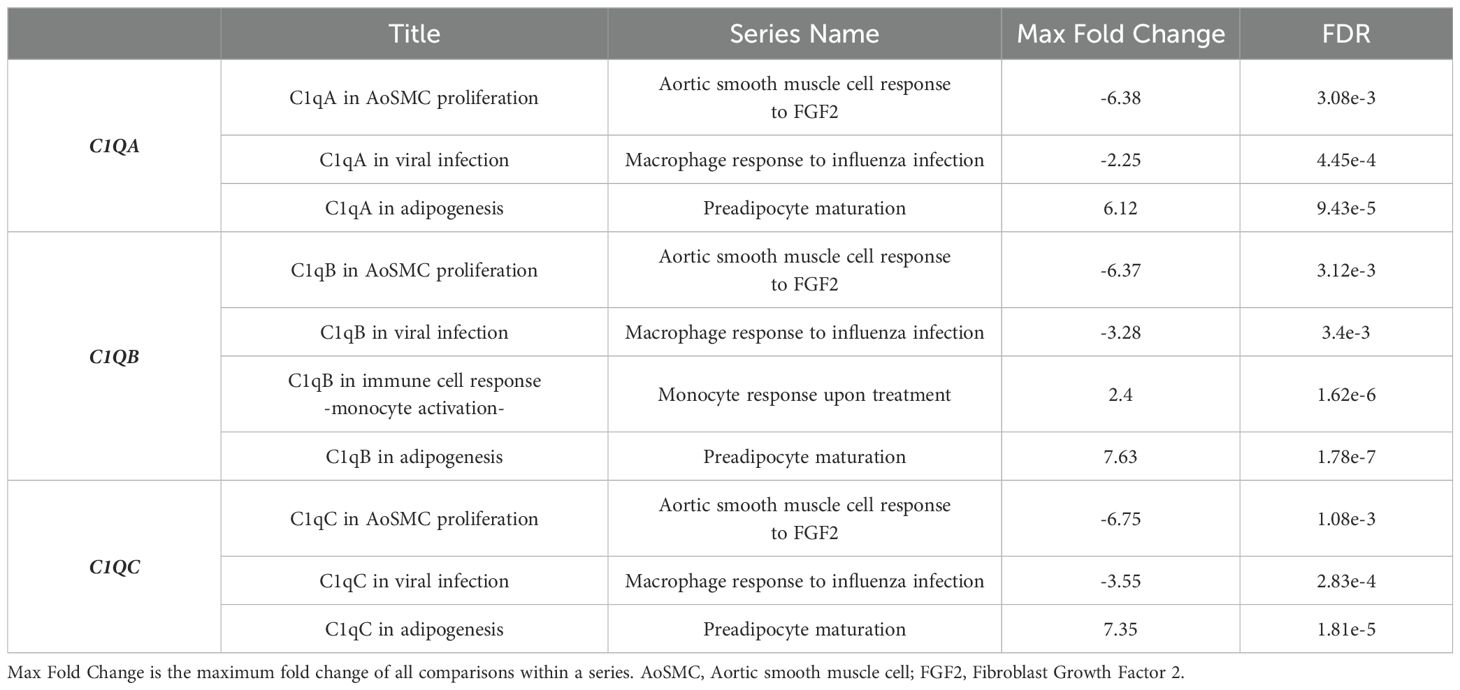
Table 2. Dynamic expression association of C1QA, C1QB, and C1QC genes, (FDR, False Discovery Rate).
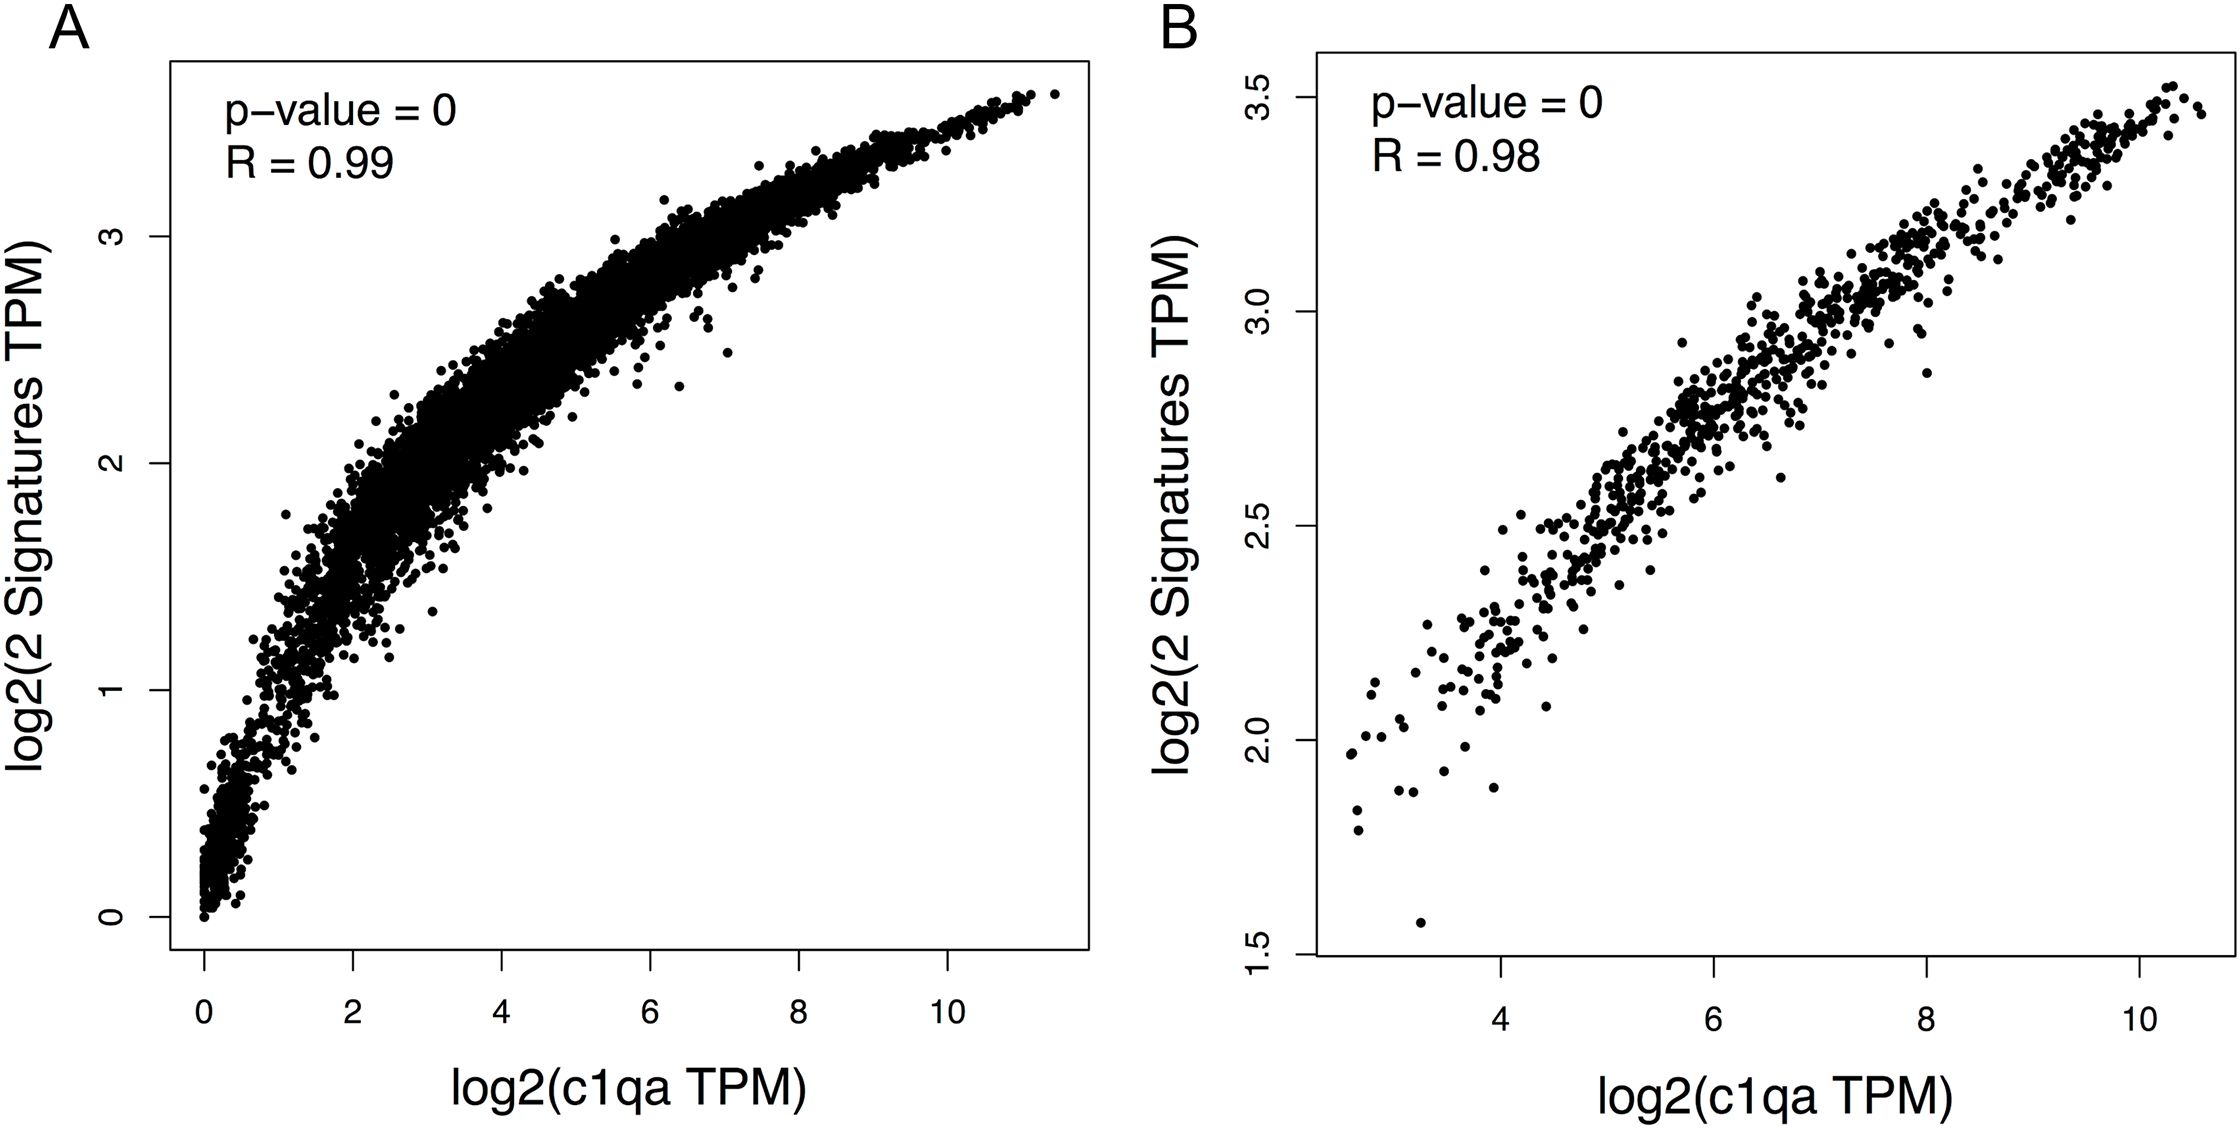
Figure 2. Correlation between C1QA, C1QB, and C1QC mRNA expression in normal tissue. Spearman correlation analysis of mRNA expression of C1QA vs C1QB and C1QC considered together was conducted using the GEPIA2 tool utilizing two distinct datasets, the GTEX data (A) or the TCGA data (B) of normal tissue from human samples. C1QA vs C1QB and C1QC were positively correlated in both dataset (P=0; R=0.99, A; P=0; R=0.99, B).
Epigenetic regulation of C1QA, C1QB, and C1QC gene expression across cell types
Epigenetic modifications, including DNA methylation and histone modifications exert a crucial role in regulating gene expression without altering DNA sequence itself. DNA methylation involve adding methyl groups to cytosine bases, typically at CpG sites. High levels of DNA methylation in gene promoters are usually associated with gene silencing by blocking accessibility to DNA or compacting chromatin. Histone modifications, like acetylation and methylation, affect chromatin structure. They can be added or removed by specific enzymes in response to cellular signaling, allowing for flexible and reversible regulation of gene expression (Figure 3A). Moreover, they can coordinate the expression of gene clusters that should be expressed simultaneously (43). The dynamic interplay between histone modifications and activating marks plays an important role in directing cell lineage determination towards distinct functional cell types (44). Thus, we performed a comprehensive bioinformatic analysis focused on unraveling potential epigenetic regulatory mechanisms governing the expression of C1QA, C1QB, and C1QC genes. We utilized the online database FANTOM-CAT Epigenome to explore the dynamics of DNA accessibility and histone modifications across various cell types. Thus, we examined the promoter region of C1QA, C1QB, and C1QC for key histone marks indicative of open chromatin and gene activation (H3K27ac, H3K4me3, and H3K4me1), and for the repressive mark H3K27me3 as a proxy for heterochromatin and gene silencing. Concurrently, DNase-seq analysis provided insights into chromatin accessibility (Figure 3B). Focusing on five cell types (i.e., blood CD14+ primary cells, blood CD34+ primary hematopoietic stem cells, blood monocyte CD14+, spleen, and HUVEC cells), we observed a distinct pattern of histone modifications (Figure 3C). HUVEC cells were included as a negative control for C1q synthesis (45, 46). Remarkably, blood CD14+ primary cells, blood monocyte CD14+, and spleen samples exhibited detectable levels of the histone marks associated to gene activation at the promoters of the three genes, while the repressive mark H3K27me3 displayed low levels, suggesting a permissive chromatin state in these cell types. Conversely, H3K27ac, H3K4me3, and H3K4me1 signals were notably absent or minimal in both CD34+ primary and HUVEC cells. This pattern coincided with elevated levels of the repressive mark H3K27me3, consistent with the non-expression of C1QA, C1QB, and C1QC in these cell types (Figure 3C). The DNase-seq data further supported these findings, revealing higher DNase activity in blood CD14+ primary cells, blood monocyte CD14+, and spleen.
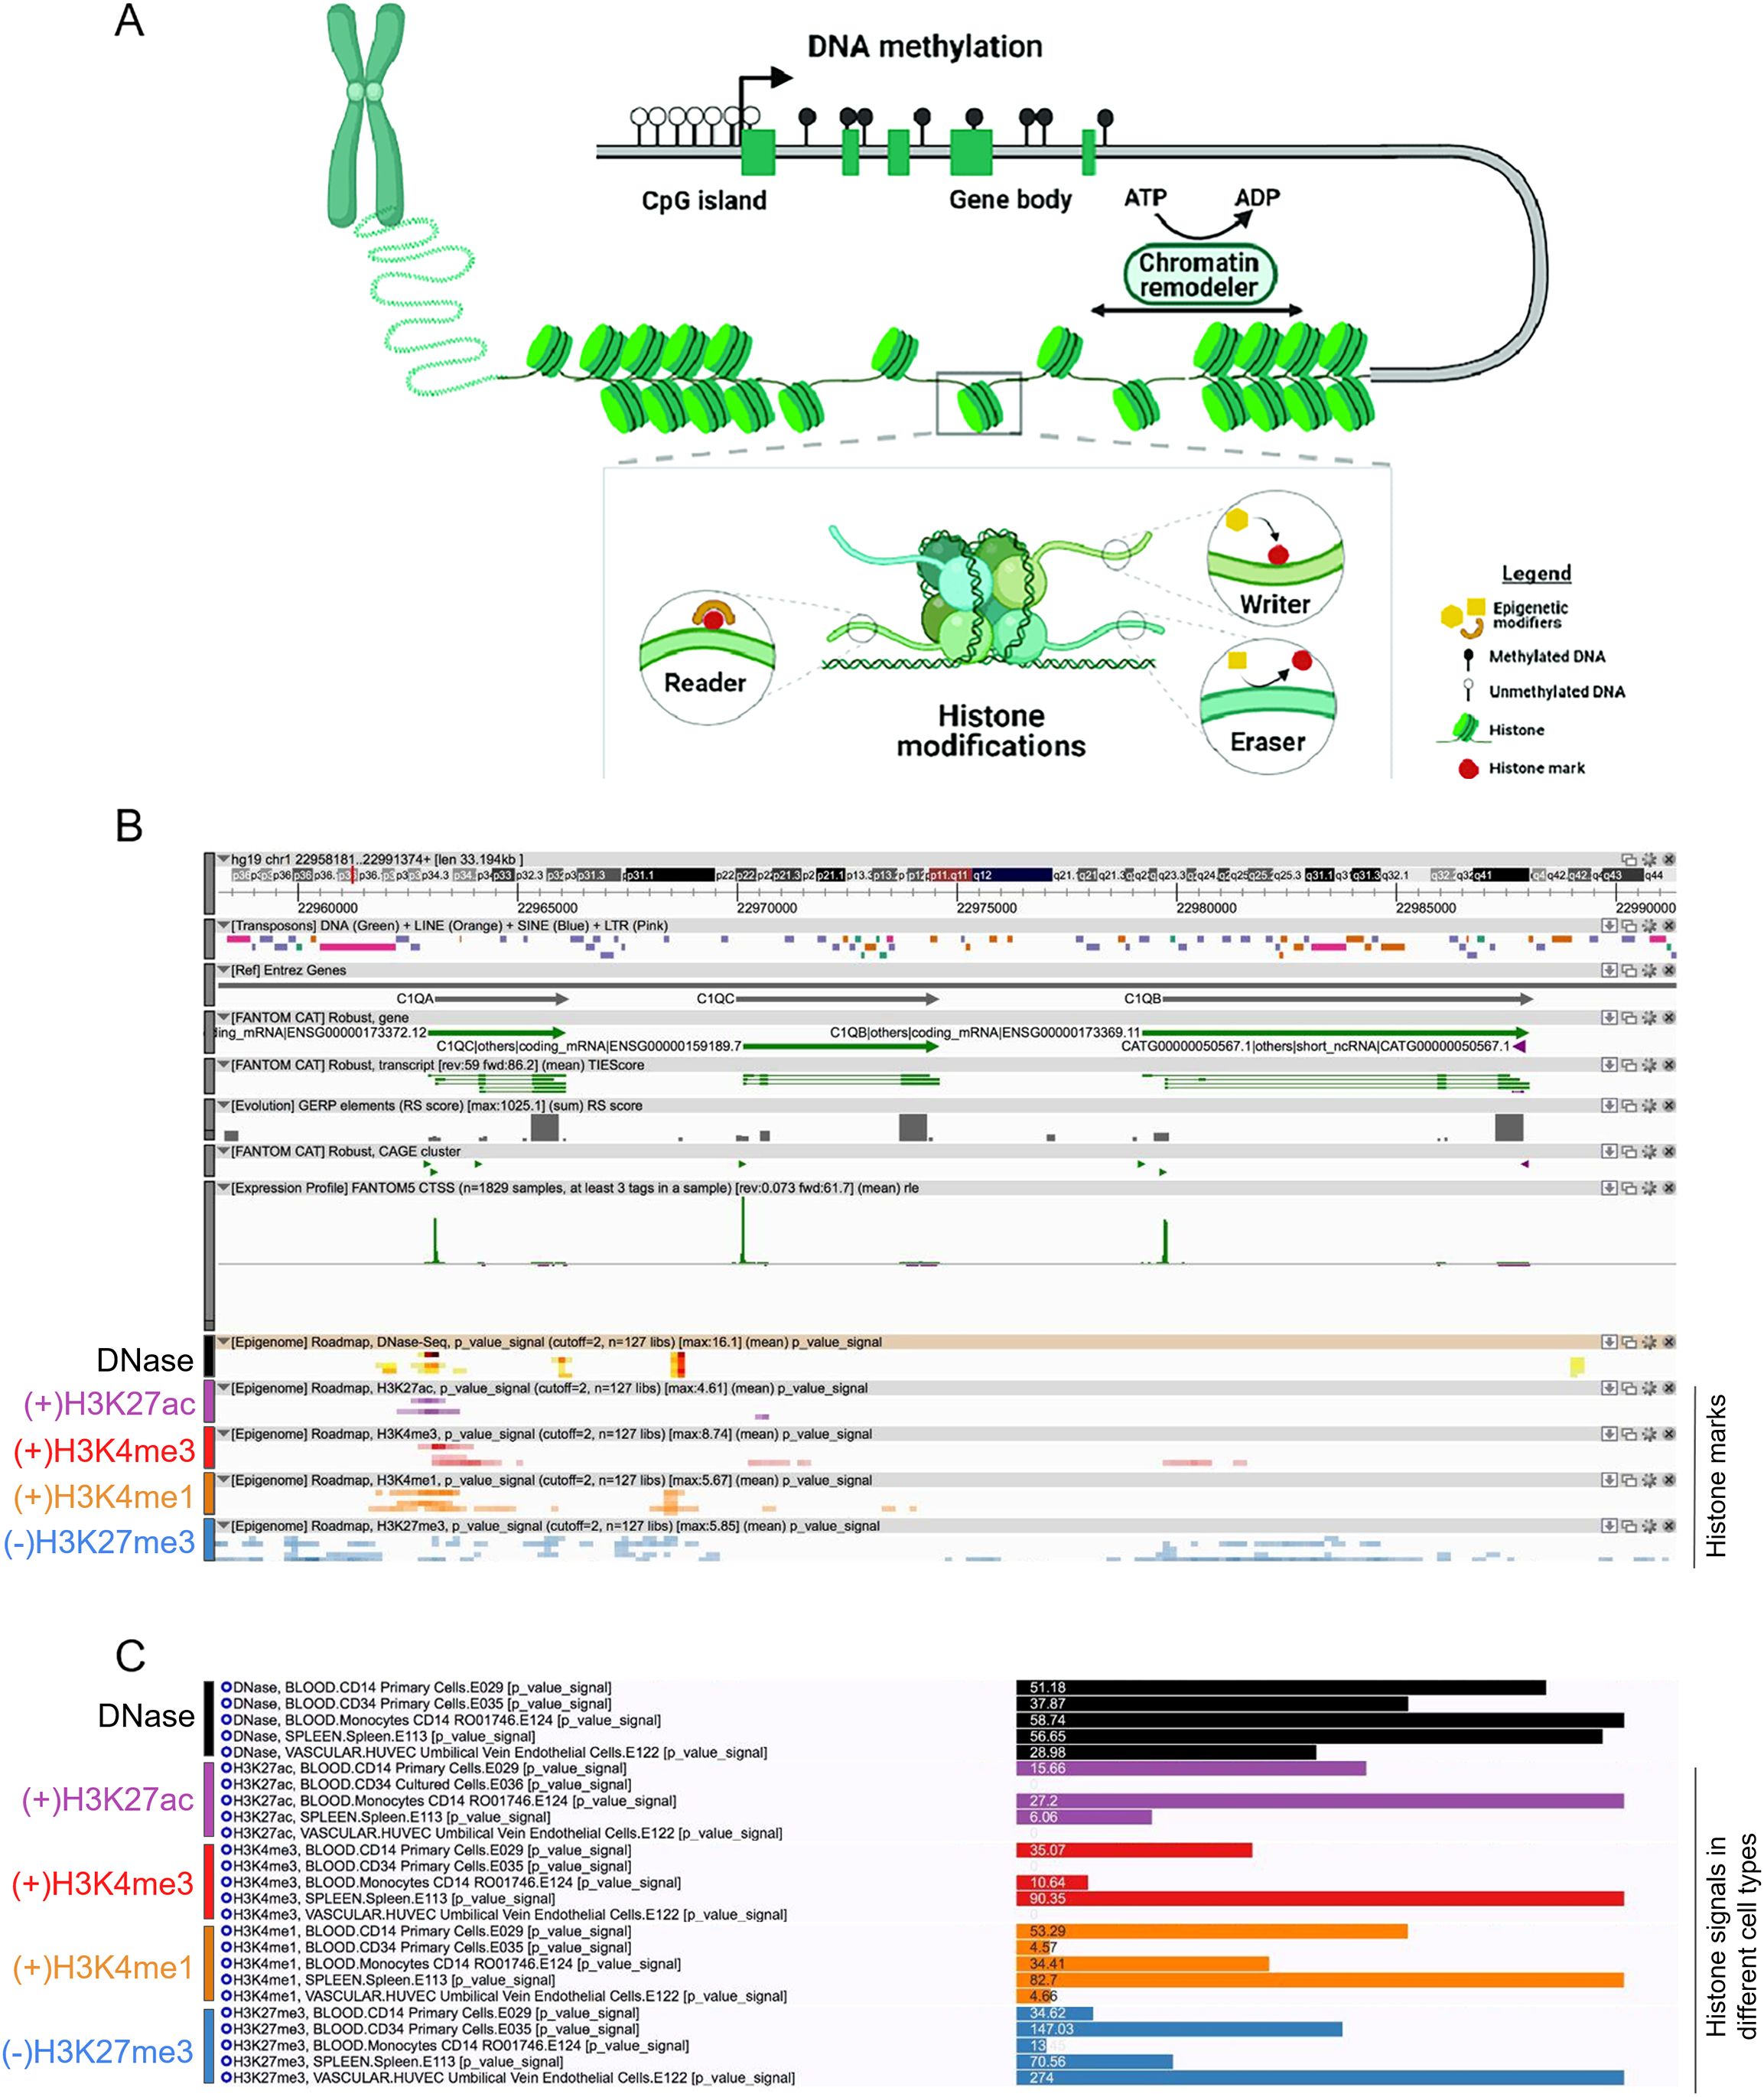
Figure 3. (A) Graphical abstract of schematic of the mechanisms of epigenetic regulation: DNA methylation and histone modification. (A) DNA methylation involves adding methyl groups to cytosine bases, typically at CpG sites. High levels of DNA methylation in gene promoters are usually associated with gene silencing by blocking accessibility to DNA or compacting chromatin. Histone modifications, like acetylation and methylation, affect chromatin structure. They can be added or removed by specific enzymes in response to cellular signaling, allowing for flexible and reversible regulation of gene expression (B, C) Fantom CAT epigenome analysis of C1Q gene cluster. Differential histone Chip-seq marks (B) and signals (C) was shown across different cell types on C1Q gene cluster from Fantom CAT. Data of DNAse I accessibility (open chromatin), H3K27ac, H3K3me3, and H3K4me1 (gene activation), and H3K27me3 (gene repression), were retrieved on C1Q genes.
Distinct epigenetic profiles of C1QA, C1QB, and C1QC genes in macrophages
In order to fully investigate the potential epigenetic regulation of C1QA, C1QB, and C1QC, we extended our analysis to incorporate data from Ensembl. a comprehensive genome browser, which offers high quality genomic analysis by integrating gene annotation, genome alignment, variants, and regulatory features (47). Specifically, we investigated the epigenetic status of macrophages, a well-known cell type for expressing C1Q genes. Our analysis encompasses DNAse I activity data, where available, as well as a broader spectrum of histone modifications, including H3K27ac, H2K27me3, H3K4me1, H3K4me3 (previously utilized above), and additionally, H3K9me3, a histone mark associated with gene silencing. Macrophages exhibited a distinctive epigenetic profile, characterized by a prominent presence of H3K27ac, H3K4me1, and H3K4me3, indicative of gene activation (Figure 4). This aligns seamlessly with known C1QA, C1QB, and C1QC expression patterns in macrophages. In addition, we scrutinized HUVEC cells, known for their low or absent expression of these genes (negative control). Consistent with their expression status, HUVEC cells exhibited a lack of activation histone marks for C1QA, C1QB, and C1QC (Figure 4). The inclusion of histone marks for gene silencing (i.e., H3K27me3 and H3K9me3) did not provide additional discriminatory information in the epigenetic regulation of C1QA, C1QB, and C1QC within macrophages and HUVEC cells. While the silencing patterns remained low and consistent across the samples, the unique activation signature in macrophages suggests a distinctive epigenetic landscape.
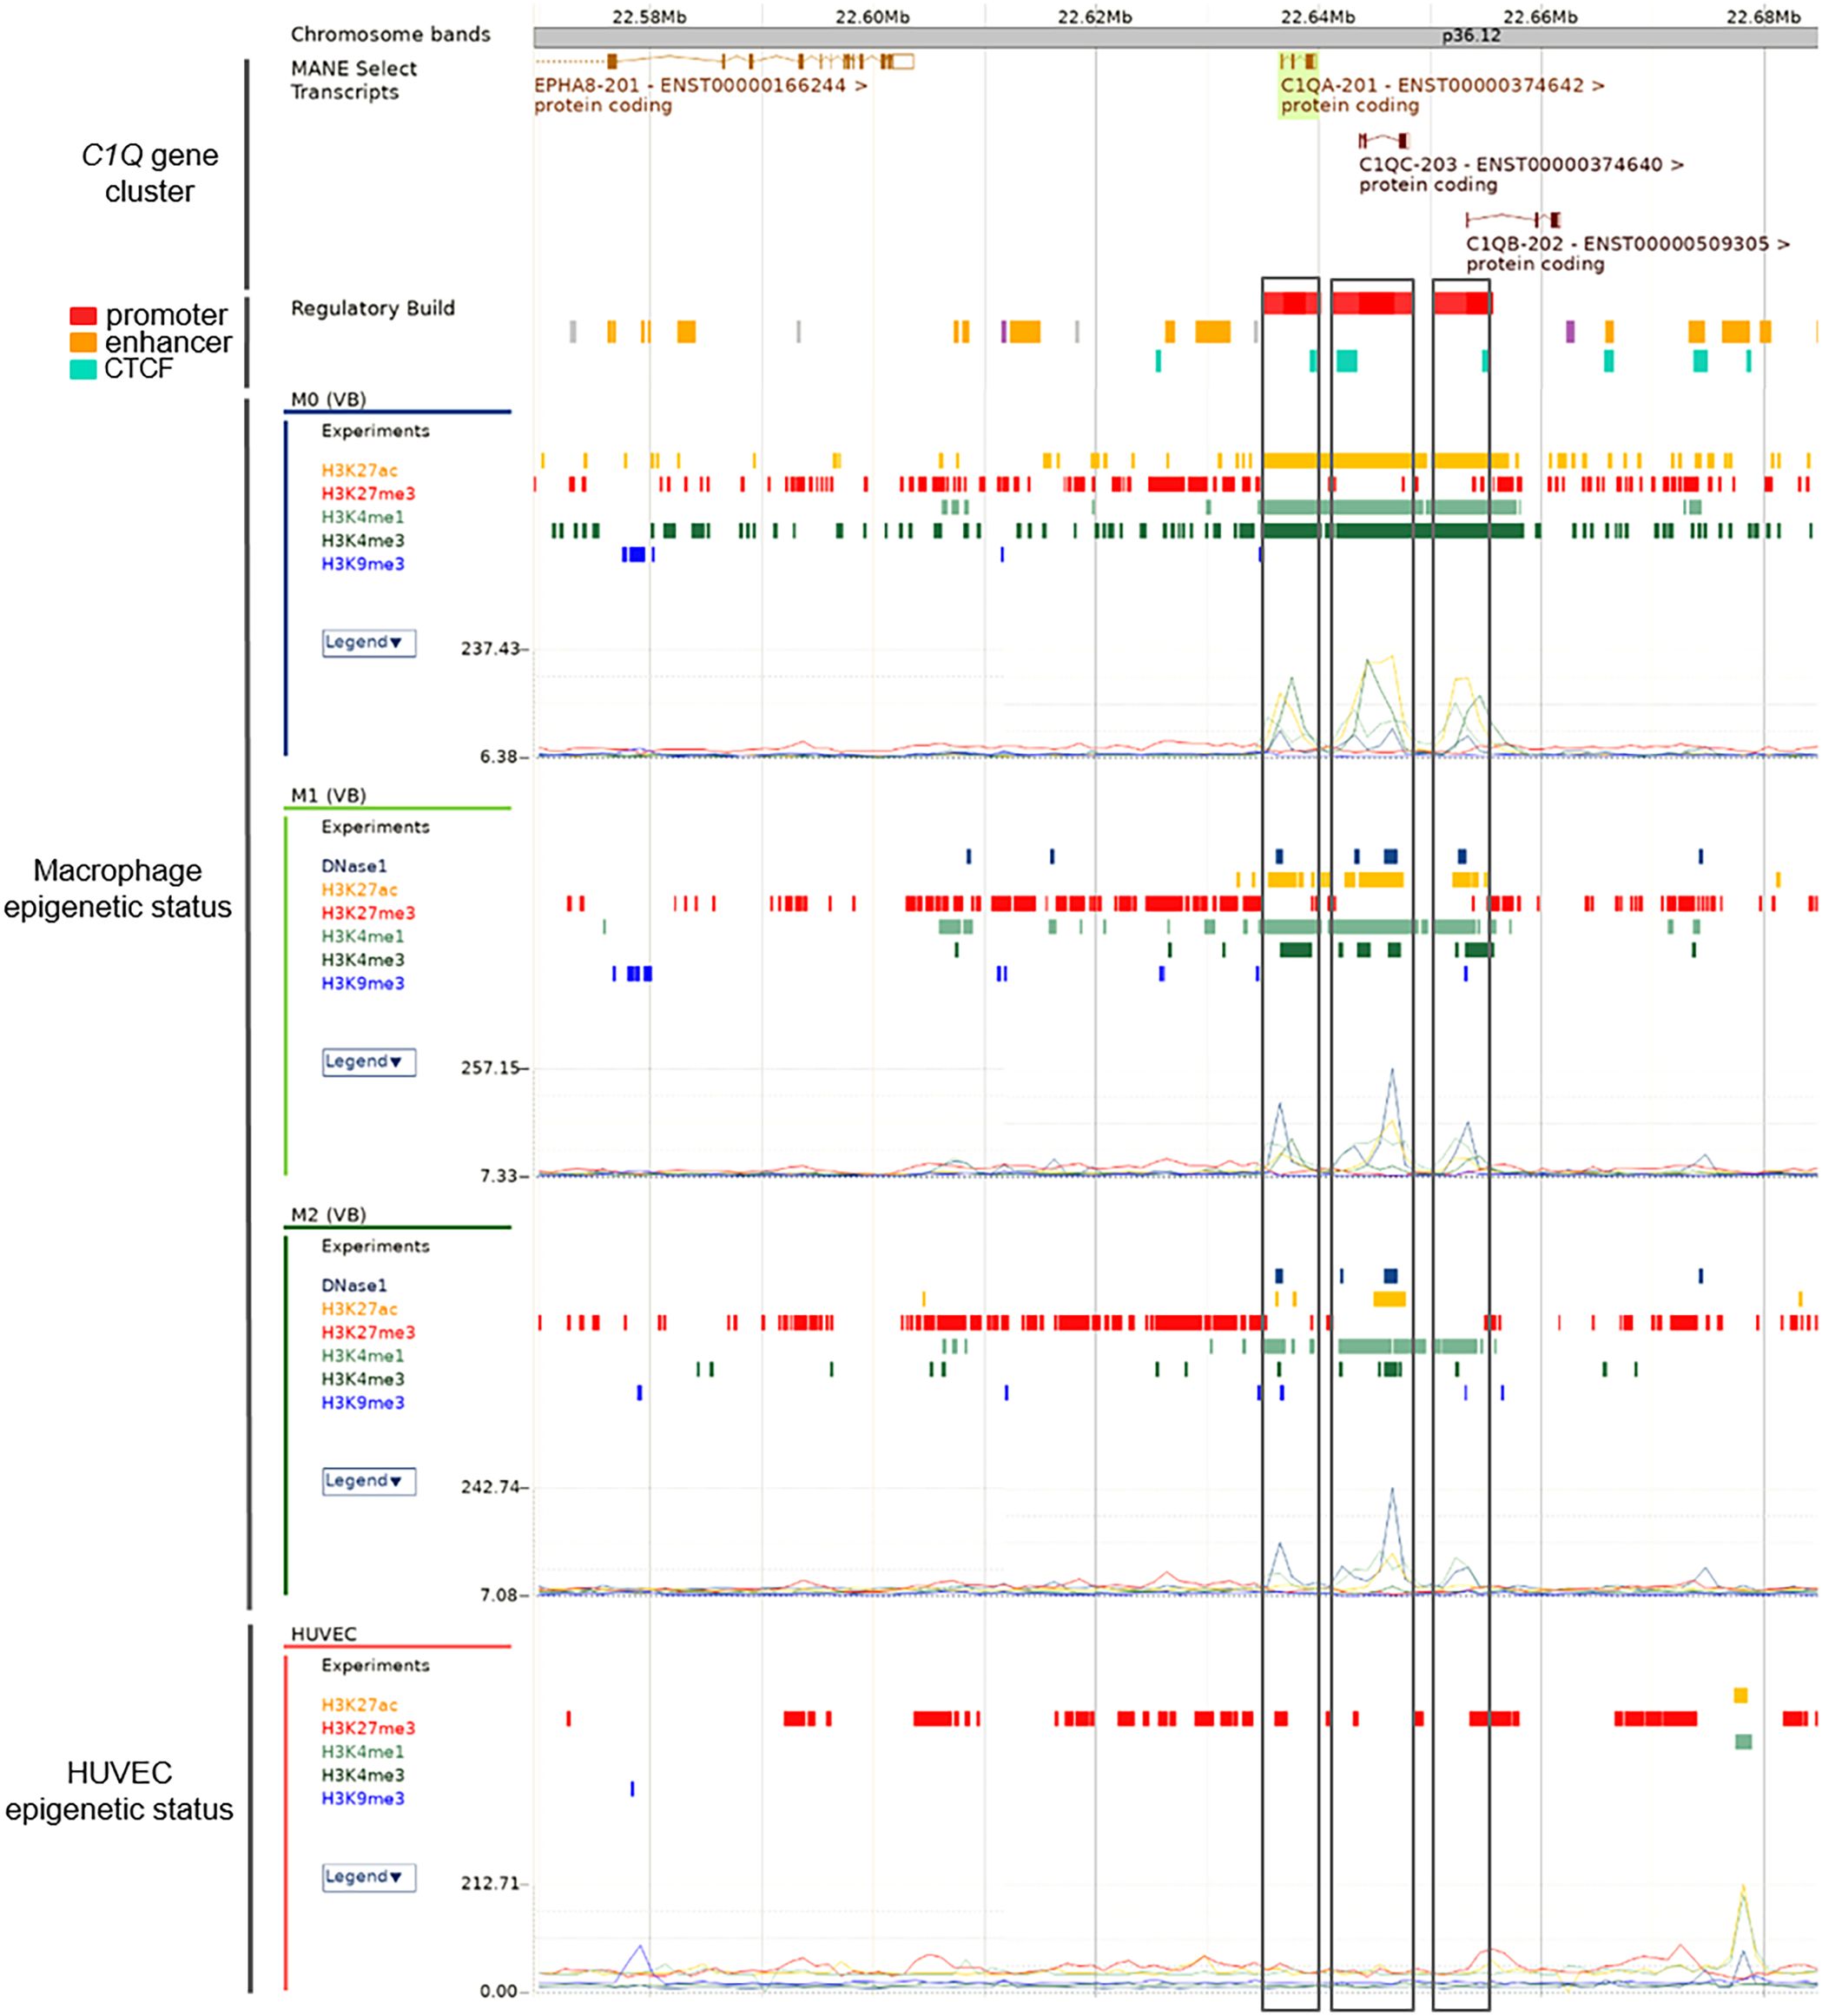
Figure 4. Ensembl histone mark analysis of C1Q gene cluster in macrophages. Differential histone Chip-seq marks on C1Q gene cluster was shown across M0, M1, and M2 macrophages, knowing to express C1Q, from Ensembl data. Promoter regions for each gene are presented as red bars and highlighted using boxes across plots of the methylation levels of H3K27ac, H2K27me3, H3K4me1, H3K4me3, and H3K9me3. HUVEC are shown as control of no C1Q genes expression. The signals from histone marks of transcriptional activation are present in macrophages but absent in HUVEC cells in accordance known C1Q genes expression in these cells.
DNA methylation profiles of C1QA, C1QB, and C1QC in macrophages
We also focused on assessing the DNA methylation levels of C1QA, C1QB, and C1QC using the UCSC-MethBase resource. Leveraging UCSC-MethBase, an extensive repository of DNA methylation data derived from next-generation whole-genome bisulfite sequencing, we analyzed the methylation status within the promoter regions of C1QA, C1QB, and C1QC in macrophages. It revealed pronounced hypomethylation across C1QA, C1QB, and C1QC promoter regions in macrophages (Figure 5). This observation aligns with the previously identified activation histone marks, suggesting a permissive chromatin state conducive to gene expression. Remarkably, the hypomethylated regions correspond with binding sites for diverse transcription factors, extending even upstream of the promoter region (Figure 5). This suggests a potential regulatory role for DNA methylation in the transcriptional control of these genes, introducing an additional layer of complexity to the epigenetic orchestration of C1QA, C1QB, and C1QC synchronized expression and their regulation.
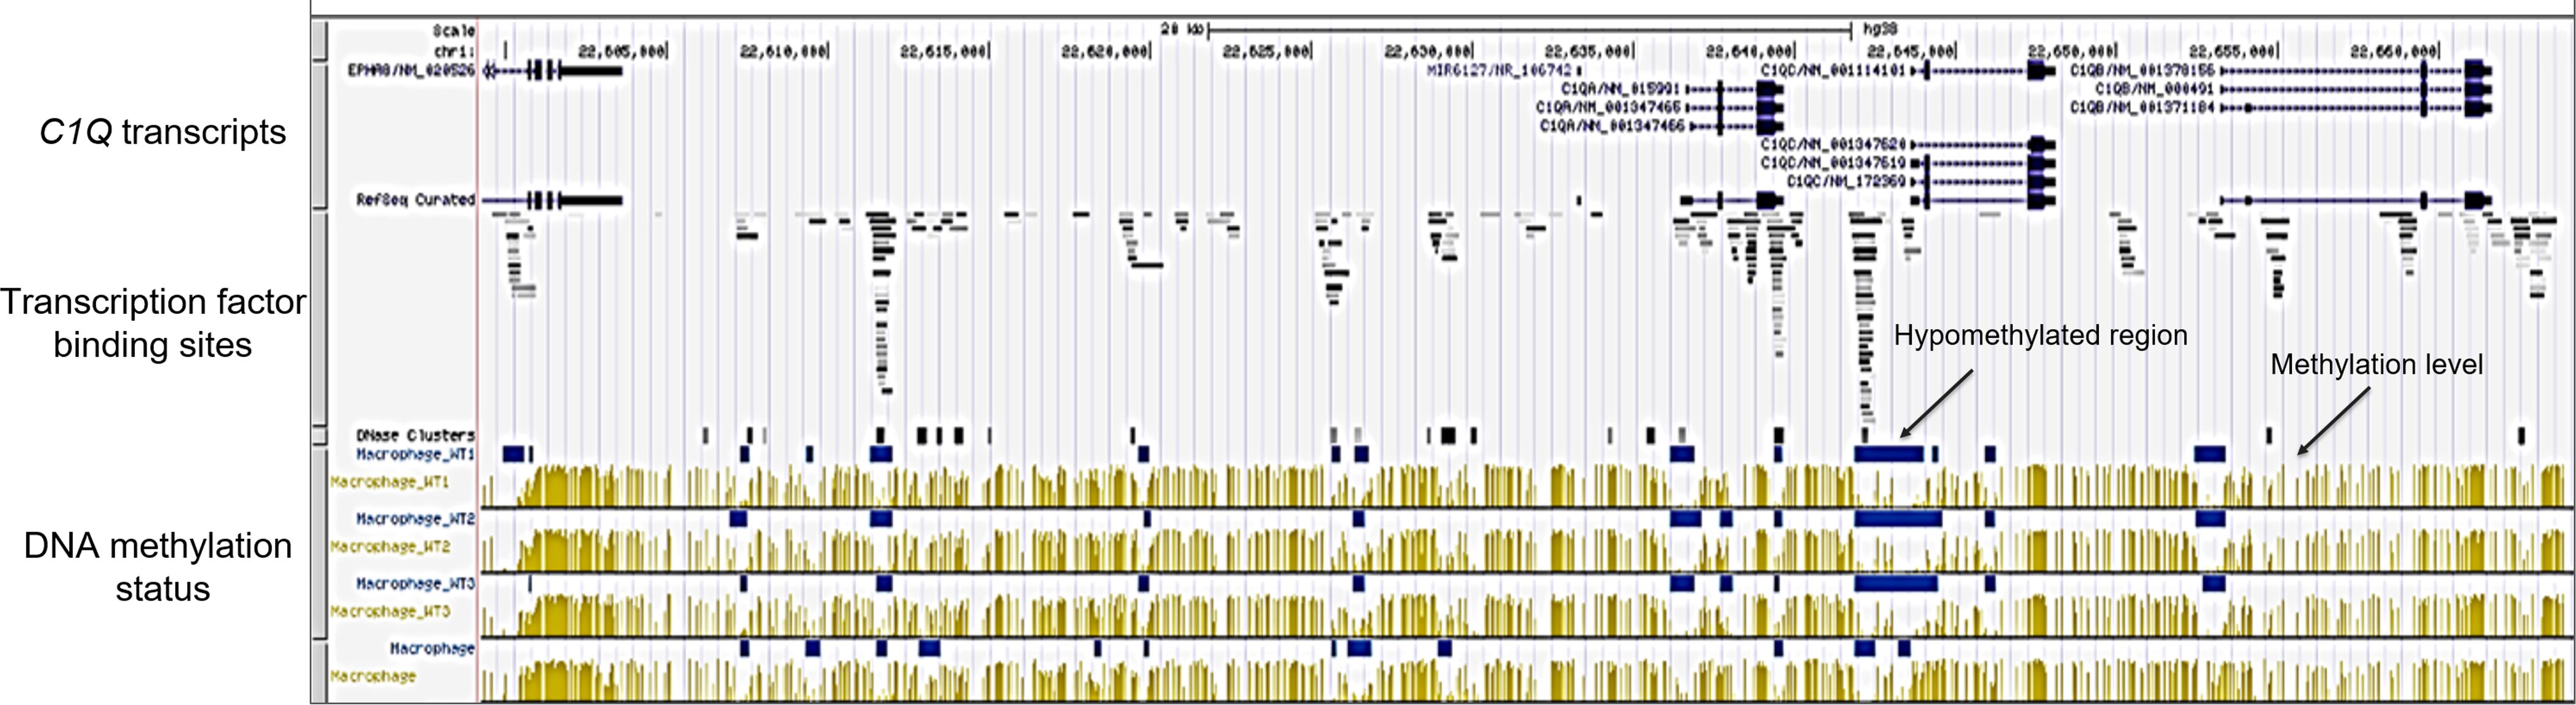
Figure 5. DNA methylation analysis of C1Q gene cluster. DNA methylation evaluation across macrophage samples on C1Q gene cluster was done using the methylome database MethBase on UCSC genome browser created from public BS-seq datasets. From top to bottom: chromosomal localization, C1QA, C1QB, and C1QC transcripts, localization of transcription factor binding site density, DNase clusters, methylation level at individual sites (in yellow) and hypomethylated regions (blues bars) for each of the four macrophage samples are shown. Hypomethylated regions are located in the promoter regions of C1QA, C1QB, and C1QC genes and overlap with transcription factor binding sites.
Epigenetic and transcriptional dynamics of C1QA, C1QB, and C1QC in tumors
Our investigation into the epigenetic profiles of C1QA, C1QB, and C1QC by UCSC-MethBase revealed compelling insights. Remarkably, regarding tumor samples, we observed a distinct pattern of DNA methylation in tumor compared to normal samples, while analyzing colon cancer samples. The data showed higher hypomethylation in colon tumor samples compared to their normal counterparts (Supplementary Figure 1). This observation is consistent with earlier evidence of elevated C1q expression levels in tumors (25, 48). Employing SMART App (Shiny Methylation Analysis Resource Tool), we conducted a systematic analysis of the DNA methylation levels, represented as beta-values, within the promoters of C1QA, C1QB, and C1QC across 34 tumor types, including 23 with available tumor and normal samples (Figure 6). Notably, our analysis revealed lower methylation levels in 10 tumors compared to normal samples across all three genes, extending our previous observations in colon cancer to other tumor types (Table 3). To elucidate the relationship between DNA methylation status and transcriptional activation, we explored the correlation between gene expression levels and DNA methylation status for C1QA, C1QB, and C1QC. Strikingly, a stronger correlation was observed for C1QB (17/33 samples) and C1QC (13/33), with a comparatively lower correlation for C1QA (7/33) (Table 4). Interestingly, the samples (n = 7) where C1QA expression correlated with methylation levels also exhibited concordant correlations for C1QB and C1QC. As an illustrative example, we focused on Kidney Renal Clear Cell Carcinoma (KIRC), a tumor setting where we previously delineated a pro-tumorigenic role for C1q (30). Our analysis unveiled lower methylation levels of C1QA, C1QB, and C1QC in tumor compared to normal samples (Figure 7A). Leveraging GEPIA2 for gene expression data extraction, we found elevated expression of all three genes in tumor versus normal samples (Figure 7B). Intriguingly, a negative correlation was consistently observed between the expression levels of C1QA, C1QB, and C1QC, and their methylation status (Figure 7C), suggesting that these genes could become actively transcribed as methylation levels decrease and chromatin opens up.
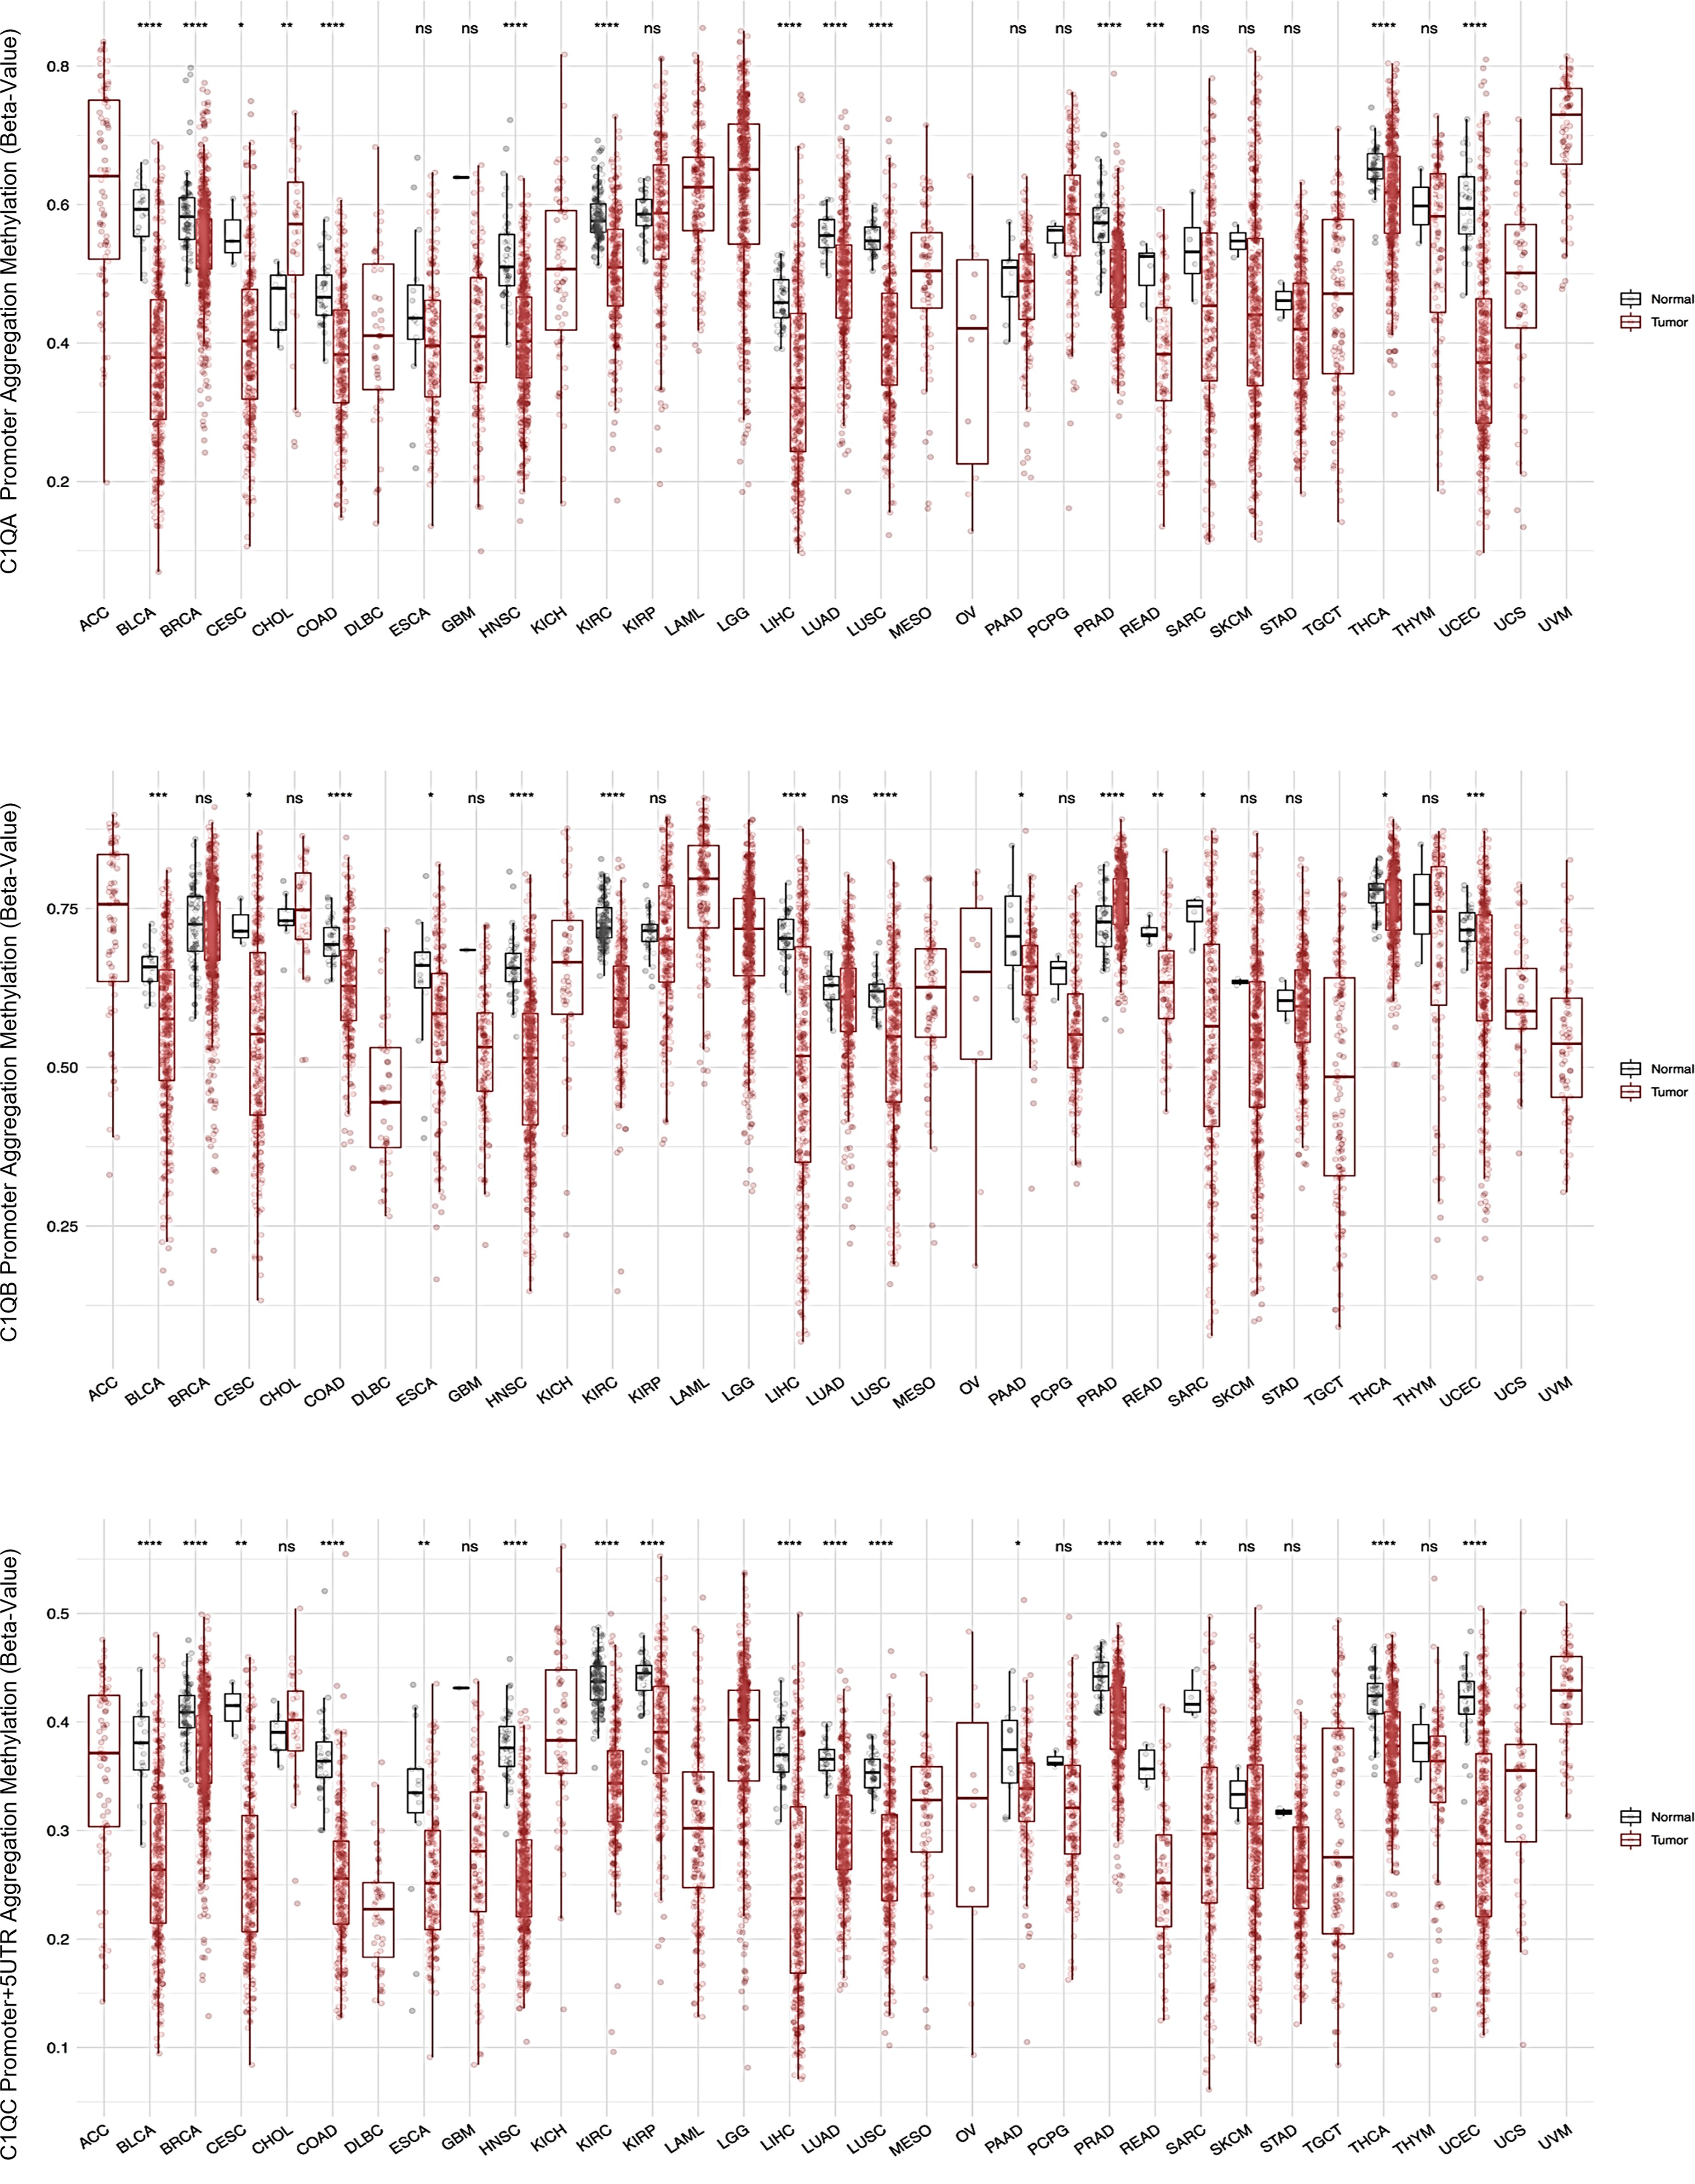
Figure 6. SMART analysis DNA methylation levels of C1Q gene cluster across different tumors and normal samples. Each of the three panel show respectively C1QA, C1QB, and C1QC CpG aggregated methylation across different types of tumors, evaluating the differential DNA methylation between paired tumor and normal samples, when both samples are present in the dataset. The data are presented as box plot of methylation level expressed as beta-value, in tumor sample in red and in normal sample in grey. The plots and p-values were produced using SMART tool. The sample name abbreviations are described in Table 4. ns, not significant. *p<0.05, **p<0.01, ***p<0.001 and ****p<0.0001.
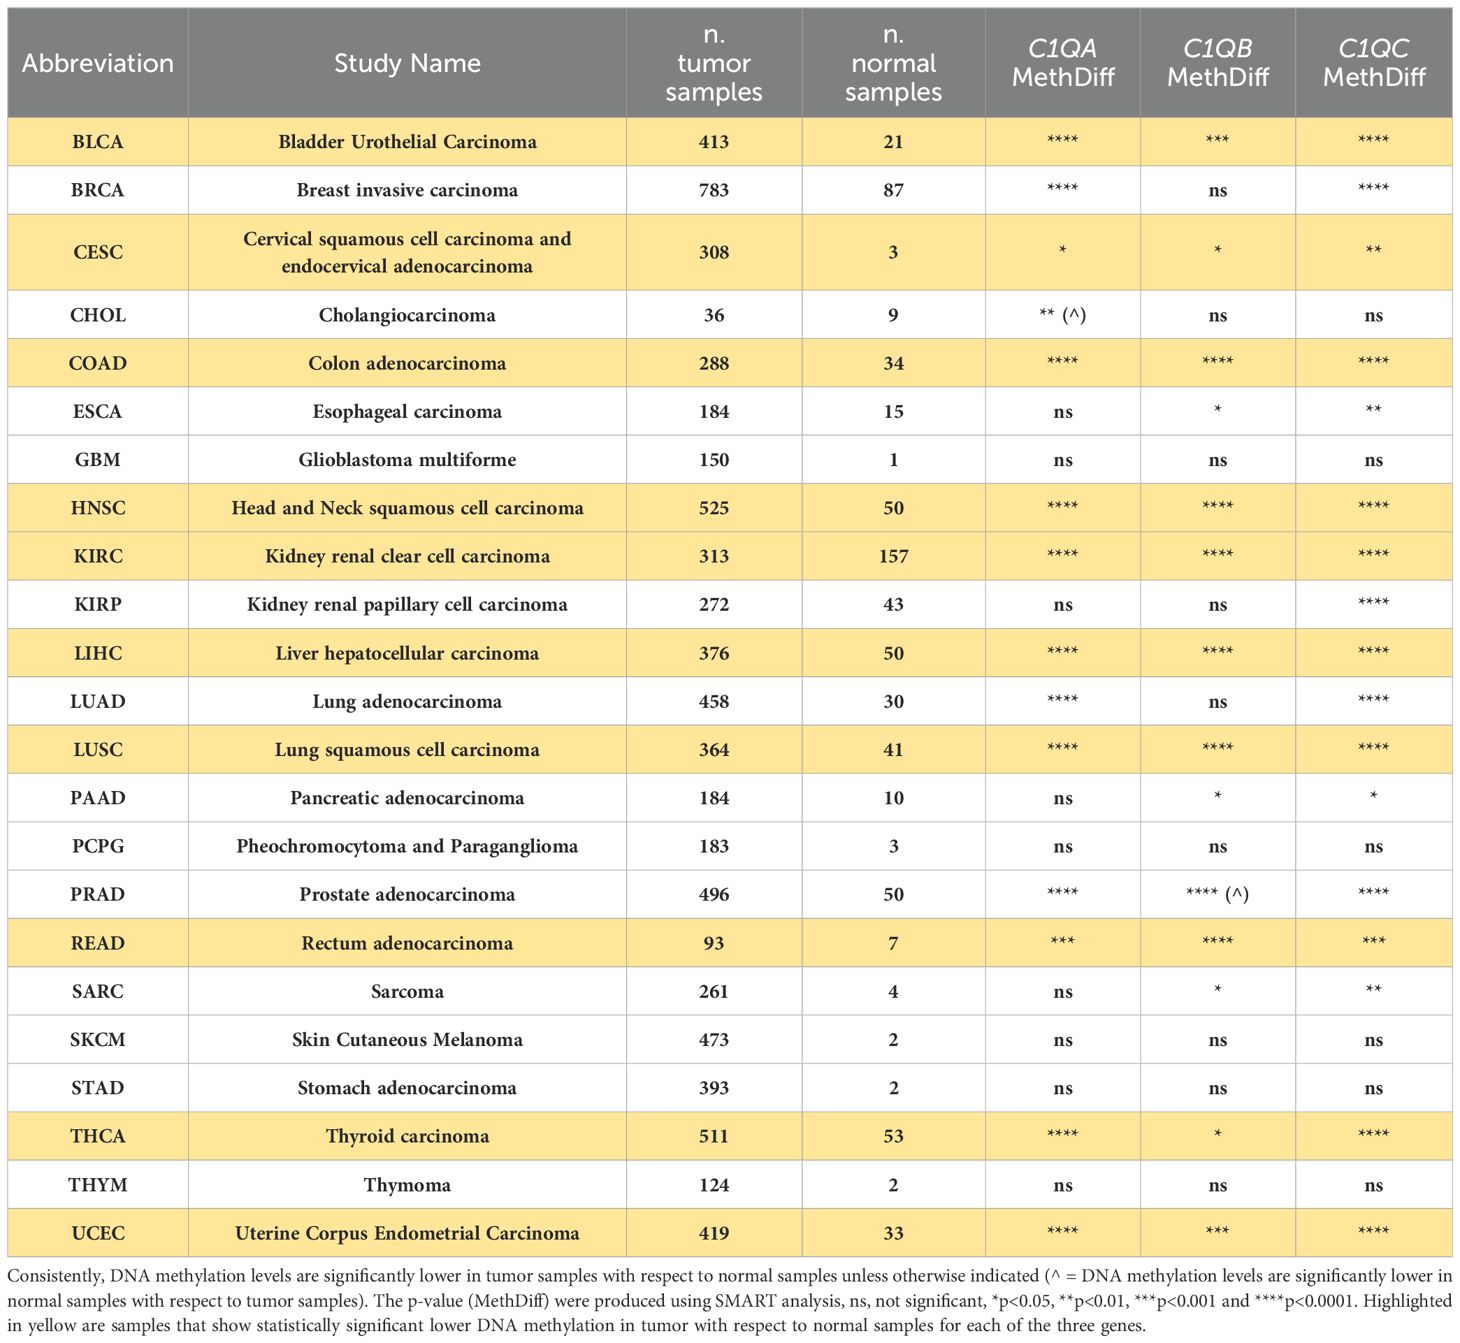
Table 3. Summary of differential DNA methylation levels in tumor and normal samples analyzed with SMART tool.
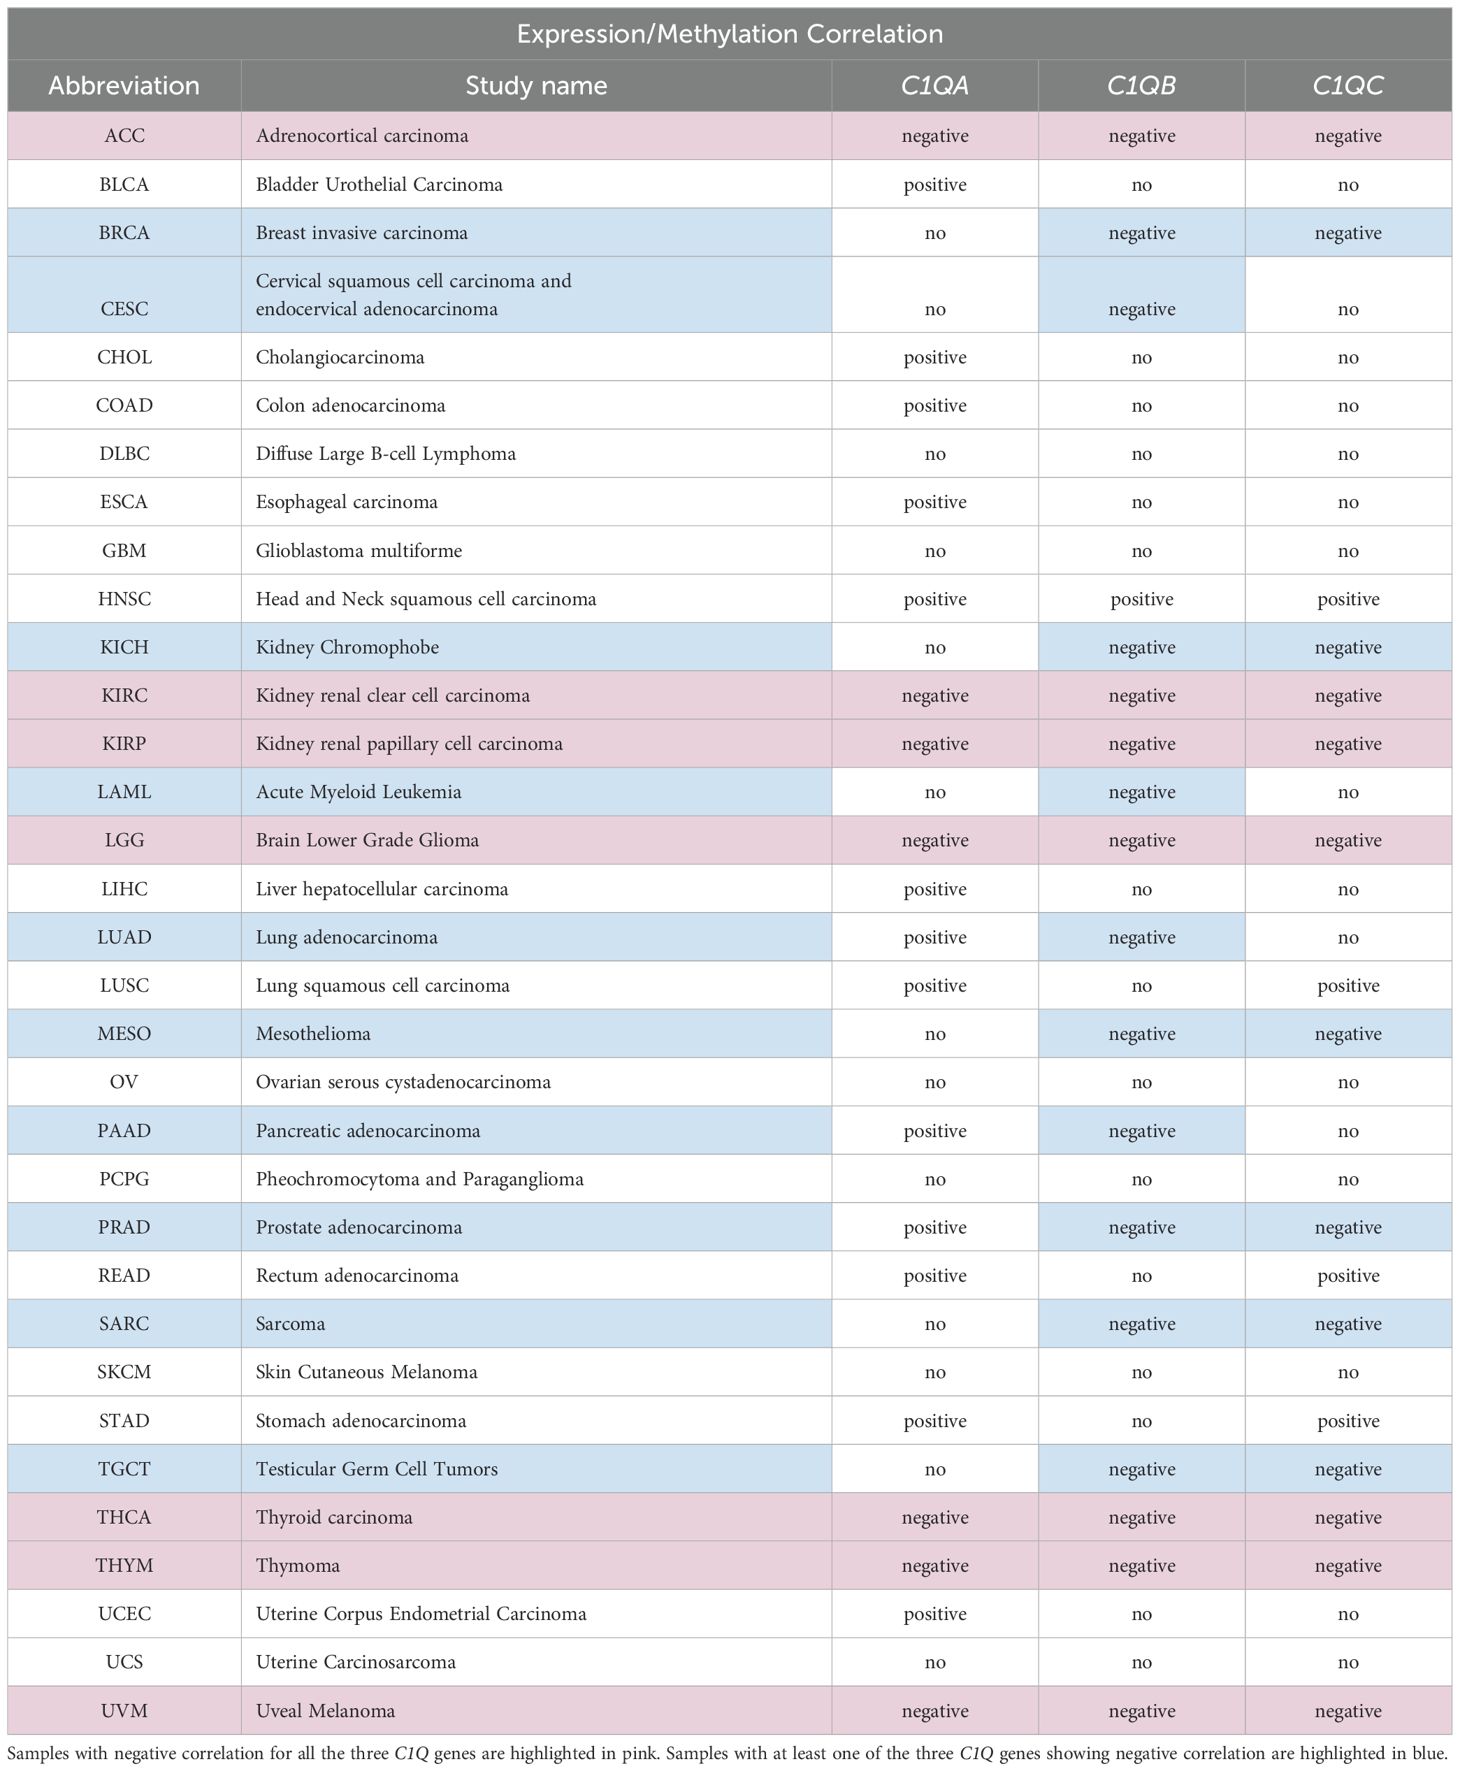
Table 4. Correlation analysis of DNA methylation and gene expression levels in different samples using SMART tool.
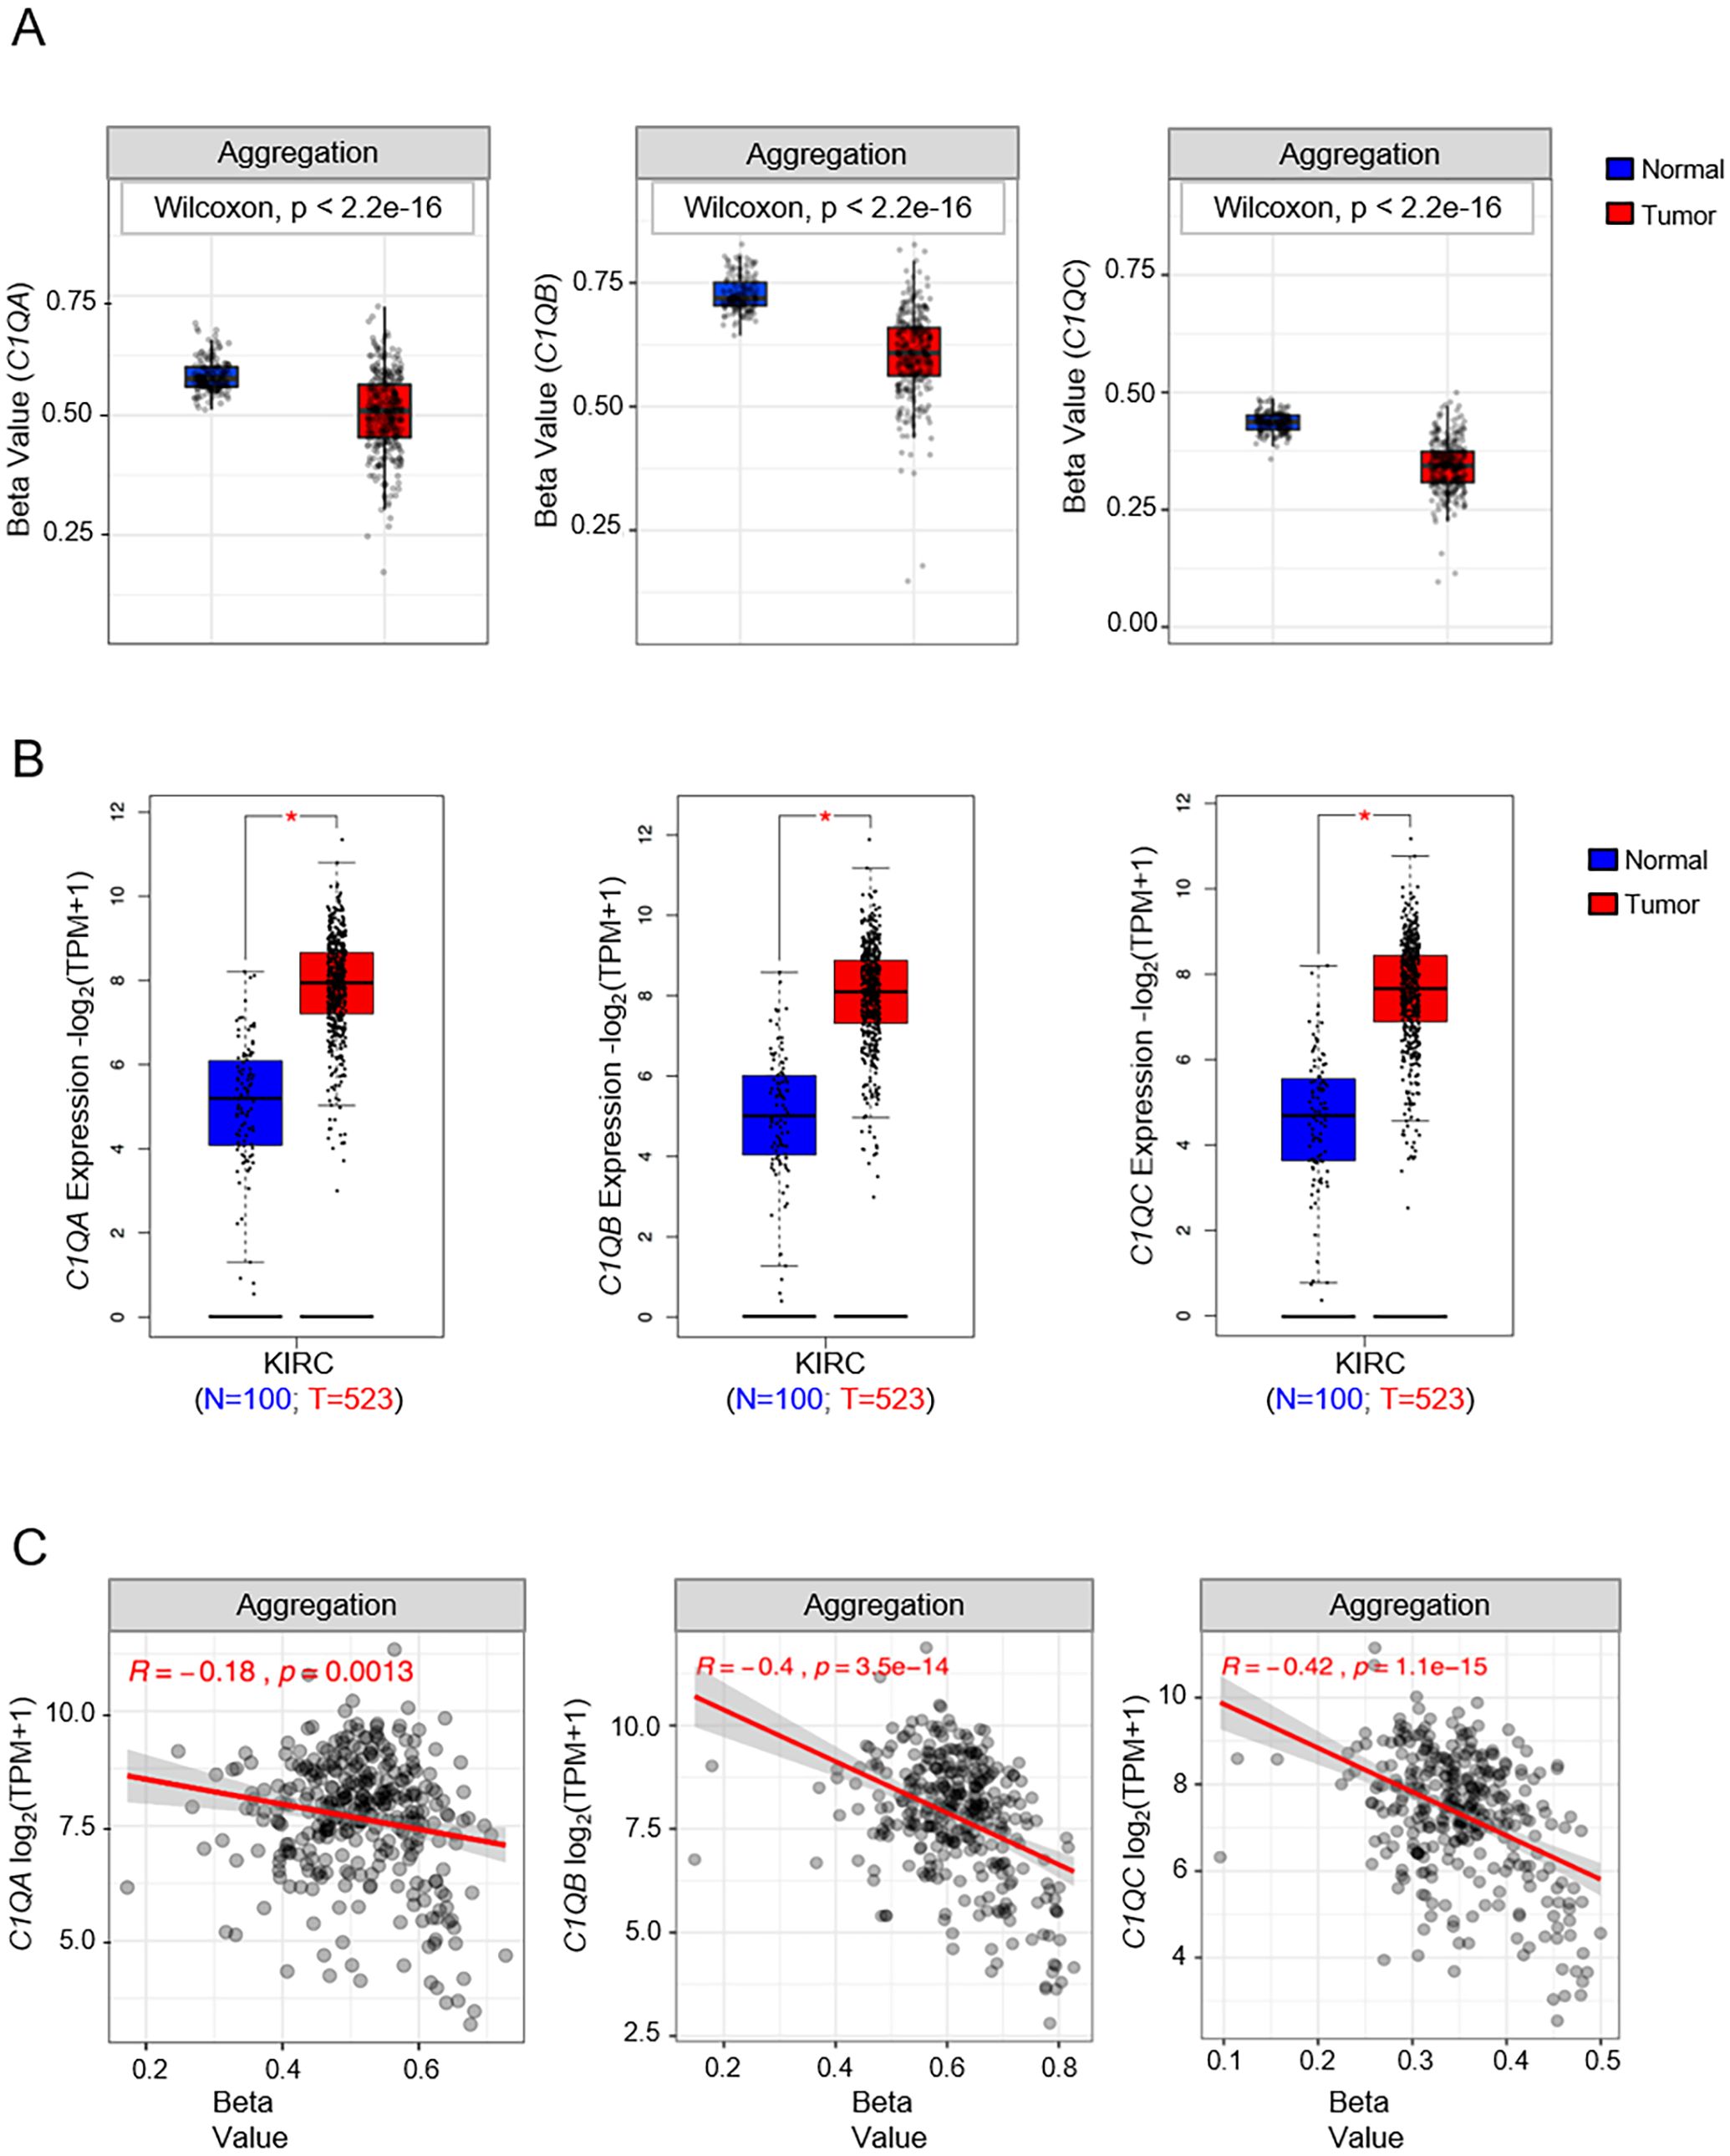
Figure 7. Analysis of DNA methylation and gene expression levels of C1QA, C1QB, and C1QC in KIRC (Kidney renal clear cell carcinoma). (A) SMART analysis of differentially DNA methylation levels expressed as beta-value in KIRC tumor (red box) and normal samples (blue box) for each of the C1Q genes. Number of tumor and normal samples are 313 and 157 respectively. (B) Differential gene expression analysis of C1QA, C1QB, and C1QC in KIRC tumor (red box) and normal samples (blue box) using GEPIA2. Number of samples used in the analysis are shown in the bottom on the plots. (C) SMART analysis of correlation between gene expression and DNA methylation levels expressed as beta-value in all KIRC samples (N=333). p-value and R (Pearson correlation coefficient) were calculated by tools used for the analysis. * p-value<0.01.
Discussion
The complement system plays a critical role in the immune response, bridging innate and adaptive immunity (1, 2). Among its components, C1q stands out as a key versatile molecule, initiating the classical pathway and participating in processes such as efferocytosis, differentiation, chemotaxis, aggregation, and adhesion (49). Understanding the regulation of C1q expression is crucial for elucidating its ambivalent roles in health and disease. Its expression at the tissue level plays an important role in physiological processes, such as trophoblast invasion during the first trimester of pregnancy (22) and synaptic pruning (50); at the same time, it plays pivotal roles in pathological processes, such as wound healing (23), tumor development (25, 48), autoimmune diseases, and endometriosis (51). Few studies on the transcriptional regulation of C1Q have been published: they identified specific transcription factors that can activate C1Q promoters such as PU.1. PU.1, an Ets-family transcription factor, is required for the development of hematopoietic myeloid lineage immune cells (52). The transcription factors PU.1 and IRF8 bind to a 53-bp element on C1QB promoter known to be a gene expression regulatory region (27). PU.1 influences C1Q expression in the decidua during placental development, and its presence is directly correlated with C1q synthesis (28). Additionally, the transcription factor, MafB, specifically expressed in monocytes and macrophages, binds to and activates the transcription of all three C1Q chain genes. C1Q is expressed at the microenvironment level in different types of gliomas with an ambivalent prognostic significance (30, 31, 53). Its crucial role has been widely demonstrated in mesothelioma, where in addition to directly promoting the proliferation and resistance of tumor cells (48), it modulates the metabolism of hyaluronic acid (54, 55). However, our understanding of how C1Q expression is modulated, particularly in the tumor microenvironment, remains limited.
Previous evidence revealed a synchronized transcription of C1Q genes (27). Our integrated analysis of TSS usage and expression patterns of the human C1Q genes (C1QA, C1QB, and C1QC) via Zenbu browser and FANTOM-CAT data highlighted a coordinated regulation and functional association across various cell types. This co-expression pattern, particularly prominent in immune-related cells (e.g., monocytes and macrophages), underscores the importance of C1q in immune regulation. Moreover, the functional annotation-based analysis confirmed C1q as one of the few non-liver-derived complement components whose major expression can be traced back to the bone marrow (56). Its expression in macrophages is also exemplified by recent identification of C1q+ macrophage populations in both healthy and tumor tissues (57). The evidence that, in certain cell populations, the expression of only one or two chains of C1q has been observed may not have a functional significance, but could be a spurious expression linked to the ancestral role of C1q as an acute phase molecule (24, 45).
Of interest is the association between C1QA, C1QB, and C1QC gene expression and CD14+ EPCs. We previously demonstrated the role of C1q in angiogenesis (21, 23), and its presence in several microenvironments characterized by active angiogenesis, such as decidua, endometriotic lesions, and tumors (22, 25, 51). These novel findings lead us to hypothesize that CD14+ EPCs could be the primary cells responsible for C1q synthesis in angiogenic regions.
Epigenetic modifications, including histone modifications and DNA methylation, play a central role in determining gene expression patterns. First, the analysis of histone modification patterns across different cell types revealed distinct epigenetic landscapes associated with C1Q expression. Specifically, permissive chromatin states characterized by activation histone marks are observed in cell types where C1Q is expressed (i.e., macrophages), while repressive marks dominate in non C1Q-expressing cell types (i.e., HUVEC cells). These findings suggest a direct link between chromatin state and transcriptional activity of C1Q genes. Moreover, examining DNA methylation profiles further elucidates the epigenetic regulation of C1Q expression. In fact, hypomethylation of the promoter regions in macrophages correlates with active transcription. The macrophage-specific activation signature further emphasizes the correlation between epigenetic marks and gene expression. In support of this evidence, the regulatory roles of histone and DNA modifications have recently emerged as crucial contributors to the monocyte and macrophage functions (58–60). The transition from monocyte to macrophage is marked by a specific gene expression profile, concomitant with extensive alterations in histone modification and chromatin accessibility (61). These findings underscore the indispensable involvement of epigenetic mechanisms in endowing macrophages with the capacity for phenotypic plasticity and functional versatility (62). Of interest, an epigenetic program is associated with monocyte-to-macrophage differentiation (61).
Previous reports have extensively emphasized a regulatory interdependence between C1q and microenvironment. Thus, C1q shapes the monocyte/macrophage/DC phenotype towards the development of a pro-efferocytic and anti-inflammatory phagocyte, creating an anti-inflammatory feed-forward loop (63), but also the microenvironment can influence C1q production. Unlike the monocyte-macrophage lineage, which constitutively produces C1q and modulates its expression in response to microenvironmental stimuli [e.g., the shift towards tumor-associated macrophages (TAMs)], some cells abruptly initiate or interrupt C1q production during their maturation process. Extravillous trophoblasts start expressing C1q during maturation and differentiation (24) via an active involvement of epigenetic dynamics in trophoblast biology (64). Conversely, the sustained production of active C1q by immature DCs is completely down-regulated upon DC maturation and differentiation in vitro (19). These findings strengthen our evidence of a fine regulation of C1Q expression in differentiation contexts.
We also aimed at shedding light on the ambivalent role of C1q in the tumor microenvironment. C1q has already been demonstrated to serve as a pro-tumorigenic factor in several tumor settings (25, 48, 54, 55, 65–67). In KIRC, infiltration by C1q-producing TAMs was associated with an immunosuppressed tumor microenvironment, characterized by high expression of immune-checkpoint molecules (PD-1, LAG-3, PD-L1, and PD-L2) (66, 68). Nevertheless, the prognostic impact of C1q is ambivalent and strictly dependent on the tumor type (30, 31, 51).
Interestingly, we found that tumor samples exhibit a distinct DNA methylation pattern compared to normal tissues, with decreased methylation associated with elevated C1Q expression, in accordance with previous studies (25, 65–67). Our observations suggest a potential role for epigenetic dysregulation in C1Q expression during tumorigenesis, and underscore the dynamic interconnection between DNA methylation and gene expression in C1QA, C1QB, and C1QC across various tumor types, shedding light on the intricate relationship between epigenetic modifications and the switching of transcriptional activation and deactivation processes. These findings not only substantiate the observed epigenetic patterns in macrophages but also emphasize the broader implications of DNA methylation in the transcriptional regulation of these immune response genes.
Conclusions
Overall, the comprehensive analysis of C1Q gene regulation sheds light on the intricate interplay between epigenetic mechanisms and transcriptional dynamics in modulating immune responses and disease processes. Further investigation into the epigenetic regulation of C1Q expression may offer new insights into the pathogenesis of immune-related disorders and cancer, providing potential therapeutic targets for intervention.
Data availability statement
The original contributions presented in the study are included in the article/Supplementary Material. Further inquiries can be directed to the corresponding author.
Author contributions
SP: Conceptualization, Data curation, Methodology, Resources, Writing – original draft. AB: Writing – review & editing, Data curation, Funding acquisition. AM: Conceptualization, Writing – review & editing. UK: Funding acquisition, Writing – review & editing. GR: Resources, Supervision, Writing – review & editing. CA: Data curation, Funding acquisition, Project administration, Supervision, Validation, Writing – original draft. RB: Conceptualization, Project administration, Supervision, Writing – review & editing.
Funding
The author(s) declare financial support was received for the research, authorship, and/or publication of this article. This work was supported by the Italian Ministry of Health, through the contribution given to the Institute for Maternal and Child Health IRCCS Burlo Garofolo- Trieste, Italy (RC 01/23 to CA and RC 03/23 to AB). UK acknowledges UAEU Start-up research grants 12F043.
Conflict of interest
The authors declare that the research was conducted in the absence of any commercial or financial relationships that could be construed as a potential conflict of interest.
The author(s) declared that they were an editorial board member of Frontiers, at the time of submission. This had no impact on the peer review process and the final decision.
Publisher’s note
All claims expressed in this article are solely those of the authors and do not necessarily represent those of their affiliated organizations, or those of the publisher, the editors and the reviewers. Any product that may be evaluated in this article, or claim that may be made by its manufacturer, is not guaranteed or endorsed by the publisher.
Supplementary material
The Supplementary Material for this article can be found online at: https://www.frontiersin.org/articles/10.3389/fimmu.2024.1498097/full#supplementary-material
References
1. Walport MJ. Complement. First of two parts. N Engl J Med. (2001) 344:1058–66. doi: 10.1056/NEJM200104053441406
2. Merle NS, Church SE, Fremeaux-Bacchi V, Roumenina LT. Complement system part I - molecular mechanisms of activation and regulation. Front Immunol. (2015) 6:262. doi: 10.3389/fimmu.2015.00262
3. Kishore U, Reid KB. C1q: structure, function, and receptors. Immunopharmacology. (2000) 49:159–70. doi: 10.1016/S0162-3109(00)80301-X
4. Sim RB, Kishore U, Villiers CL, Marche PN, Mitchell DA. C1q binding and complement activation by prions and amyloids. Immunobiology. (2007) 212:355–62. doi: 10.1016/j.imbio.2007.04.001
5. Turner MW. The role of mannose-binding lectin in health and disease. Mol Immunol. (2003) 40:423–9. doi: 10.1016/S0161-5890(03)00155-X
6. Tan LA, Yu B, Sim FC, Kishore U, Sim RB. Complement activation by phospholipids: the interplay of factor H and C1q. Protein Cell. (2010) 1:1033–49. doi: 10.1007/s13238-010-0125-8
7. Pangburn MK. Initiation of the alternative pathway of complement and the history of "tickover. Immunol Rev. (2023) 313:64–70. doi: 10.1111/imr.v313.1
8. Calcott MA, Müller-Eberhard HJ. C1q protein of human complement. Biochemistry. (1972) 11:3443–50. doi: 10.1021/bi00768a018
10. Kishore U, Ghai R, Greenhough TJ, Shrive AK, Bonifati DM, Gadjeva MG, et al. Structural and functional anatomy of the globular domain of complement protein C1q. Immunol Lett. (2004) 95:113–28. doi: 10.1016/j.imlet.2004.06.015
11. Ghai R, Waters P, Roumenina LT, Gadjeva M, Kojouharova MS, Reid KB, et al. C1q and its growing family. Immunobiology. (2007) 212:253–66. doi: 10.1016/j.imbio.2006.11.001
12. Lu JH, Teh BK, Wang L, Wang YN, Tan YS, Lai MC, et al. The classical and regulatory functions of C1q in immunity and autoimmunity. Cell Mol Immunol. (2008) 5:9–21. doi: 10.1038/cmi.2008.2
13. Botto M, Dell'Agnola C, Bygrave AE, Thompson EM, Cook HT, Petry F, et al. Homozygous C1q deficiency causes glomerulonephritis associated with multiple apoptotic bodies. Nat Genet. (1998) 19:56–9. doi: 10.1038/ng0598-56
14. Hu YL, Pan XM, Xiang LX, Shao JZ. Characterization of C1q in teleosts: insight into the molecular and functional evolution of C1q family and classical pathway. J Biol Chem. (2010) 285:28777–86. doi: 10.1074/jbc.M110.131318
15. Kishore U, Gaboriaud C, Waters P, Shrive AK, Greenhough TJ, Reid KB, et al. C1q and tumor necrosis factor superfamily: modularity and versatility. Trends Immunol. (2004) 25:551–61. doi: 10.1016/j.it.2004.08.006
16. Carland TM, Gerwick L. The C1q domain containing proteins: Where do they come from and what do they do? Dev Comp Immunol. (2010) 34:785–90. doi: 10.1016/j.dci.2010.02.014
17. Tom Tang Y, Hu T, Arterburn M, Boyle B, Bright JM, Palencia S, et al. The complete complement of C1q-domain-containing proteins in Homo sapiens. Genomics. (2005) 86:100–11. doi: 10.1016/j.ygeno.2005.03.001
18. Müller W, Hanauske-Abel H, Loos M. Biosynthesis of the first component of complement by human and Guinea pig peritoneal macrophages: evidence for an independent production of the C1 subunits. J Immunol. (1978) 121:1578–84. doi: 10.4049/jimmunol.121.4.1578
19. Castellano G, Woltman AM, Nauta AJ, Roos A, Trouw LA, Seelen MA, et al. Maturation of dendritic cells abrogates C1q production in vivo and in vitro. Blood. (2004) 103:3813–20. doi: 10.1182/blood-2003-09-3046
20. van Schaarenburg RA, Suurmond J, Habets KL, Brouwer MC, Wouters D, Kurreeman FA, et al. The production and secretion of complement component C1q by human mast cells. Mol Immunol. (2016) 78:164–70. doi: 10.1016/j.molimm.2016.09.001
21. Spazzapan M, Pegoraro S, Agostinis C, Bulla R. The role of complement component C1q in angiogenesis C1q protein structure. Explor Immunol. (2023) 3:574–89. doi: 10.37349/ei
22. Agostinis C, Mangogna A, Balduit A, Kishore U, Bulla R. A non-redundant role of complement protein C1q in normal and adverse pregnancy. Explor Immunol. (2022) 2:622–36. doi: 10.37349/ei
23. Bossi F, Tripodo C, Rizzi L, Bulla R, Agostinis C, Guarnotta C, et al. C1q as a unique player in angiogenesis with therapeutic implication in wound healing. Proc Natl Acad Sci U S A. (2014) 111:4209–14. doi: 10.1073/pnas.1311968111
24. Agostinis C, Bulla R, Tripodo C, Gismondi A, Stabile H, Bossi F, et al. An alternative role of C1q in cell migration and tissue remodeling: contribution to trophoblast invasion and placental development. J Immunol. (2010) 185:4420–9. doi: 10.4049/jimmunol.0903215
25. Bulla R, Tripodo C, Rami D, Ling GS, Agostinis C, Guarnotta C, et al. C1q acts in the tumour microenvironment as a cancer-promoting factor independently of complement activation. Nat Commun. (2016) 7:10346. doi: 10.1038/ncomms10346
26. Kouser L, Madhukaran SP, Shastri A, Saraon A, Ferluga J, Al-Mozaini M, et al. Emerging and novel functions of complement protein C1q. Front Immunol. (2015) 6:317. doi: 10.3389/fimmu.2015.00317
27. Chen G, Tan CS, Teh BK, Lu J. Molecular mechanisms for synchronized transcription of three complement C1q subunit genes in dendritic cells and macrophages. J Biol Chem. (2011) 286:34941–50. doi: 10.1074/jbc.M111.286427
28. Madhukaran SP, Kishore U, Jamil K, Teo BH, Choolani M, Lu J. Transcriptional factor PU.1 regulates decidual C1q expression in early pregnancy in human. Front Immunol. (2015) 6:53. doi: 10.3389/fimmu.2015.00053
29. Tran MTN, Hamada M, Jeon H, Shiraishi R, Asano K, Hattori M, et al. MafB is a critical regulator of complement component C1q. Nat Commun. (2017) 8:1700. doi: 10.1038/s41467-017-01711-0
30. Mangogna A, Agostinis C, Bonazza D, Belmonte B, Zacchi P, Zito G, et al. Is the complement protein C1q a pro- or anti-tumorigenic factor? Bioinformatics analysis involving human carcinomas. Front Immunol. (2019) 10:865. doi: 10.3389/fimmu.2019.00865
31. Mangogna A, Belmonte B, Agostinis C, Zacchi P, Iacopino DG, Martorana A, et al. Prognostic implications of the complement protein C1q in gliomas. Front Immunol. (2019) 10:2366. doi: 10.3389/fimmu.2019.02366
32. Heintzman ND, Hon GC, Hawkins RD, Kheradpour P, Stark A, Harp LF, et al. Histone modifications at human enhancers reflect global cell-type-specific gene expression. Nature. (2009) 459:108–12. doi: 10.1038/nature07829
33. Thurman RE, Rynes E, Humbert R, Vierstra J, Maurano MT, Haugen E, et al. The accessible chromatin landscape of the human genome. Nature. (2012) 489:75–82. doi: 10.1038/nature11232
34. Barski A, Cuddapah S, Cui K, Roh TY, Schones DE, Wang Z, et al. High-resolution profiling of histone methylations in the human genome. Cell. (2007) 129:823–37. doi: 10.1016/j.cell.2007.05.009
35. Gilbert N, Thomson I, Boyle S, Allan J, Ramsahoye B, Bickmore WA. DNA methylation affects nuclear organization, histone modifications, and linker histone binding but not chromatin compaction. J Cell Biol. (2007) 177:401–11. doi: 10.1083/jcb.200607133
36. Li Y, Ge D, Lu C. The SMART App: an interactive web application for comprehensive DNA methylation analysis and visualization. Epigenet Chromatin. (2019) 12:71. doi: 10.1186/s13072-019-0316-3
37. Tang Z, Kang B, Li C, Chen T, Zhang Z. GEPIA2: an enhanced web server for large-scale expression profiling and interactive analysis. Nucleic Acids Res. (2019) 47:W556–W60. doi: 10.1093/nar/gkz430
38. Andersson R, Gebhard C, Miguel-Escalada I, Hoof I, Bornholdt J, Boyd M, et al. An atlas of active enhancers across human cell types and tissues. Nature. (2014) 507:455–61. doi: 10.1038/nature12787
39. Forrest AR, Kawaji H, Rehli M, Baillie JK, de Hoon MJ, Haberle V, et al. A promoter-level mammalian expression atlas. Nature. (2014) 507:462–70. doi: 10.1038/nature13182
40. Severin J, Lizio M, Harshbarger J, Kawaji H, Daub CO, Hayashizaki Y, et al. Interactive visualization and analysis of large-scale sequencing datasets using ZENBU. Nat Biotechnol. (2014) 32:217–9. doi: 10.1038/nbt.2840
41. Lizio M, Harshbarger J, Shimoji H, Severin J, Kasukawa T, Sahin S, et al. Gateways to the FANTOM5 promoter level mammalian expression atlas. Genome Biol. (2015) 16:22. doi: 10.1186/s13059-014-0560-6
42. Katayama S, Tomaru Y, Kasukawa T, Waki K, Nakanishi M, Nakamura M, et al. Antisense transcription in the mammalian transcriptome. Science. (2005) 309:1564–6. doi: 10.1126/science.1112009
43. Sproul D, Gilbert N, Bickmore WA. The role of chromatin structure in regulating the expression of clustered genes. Nat Rev Genet. (2005) 6:775–81. doi: 10.1038/nrg1688
44. Shim WJ, Sinniah E, Xu J, Vitrinel B, Alexanian M, Andreoletti G, et al. Conserved epigenetic regulatory logic infers genes governing cell identity. Cell Syst. (2020) 11:625–39.e13. doi: 10.1016/j.cels.2020.11.001
45. Bulla R, Agostinis C, Bossi F, Rizzi L, Debeus A, Tripodo C, et al. Decidual endothelial cells express surface-bound C1q as a molecular bridge between endovascular trophoblast and decidual endothelium. Mol Immunol. (2008) 45:2629–40. doi: 10.1016/j.molimm.2007.12.025
46. Klegeris A, Bissonnette CJ, Dorovini-Zis K, McGeer PL. Expression of complement messenger RNAs by human endothelial cells. Brain Res. (2000) 871:1–6. doi: 10.1016/S0006-8993(00)02253-8
47. Martin FJ, Amode MR, Aneja A, Austine-Orimoloye O, Azov Andrey G, Barnes I, et al. Ensembl 2023. Nucleic Acids Res. (2022) 51:D933–D41. doi: 10.1093/nar/gkac958
48. Agostinis C, Vidergar R, Belmonte B, Mangogna A, Amadio L, Geri P, et al. Complement protein C1q binds to hyaluronic acid in the Malignant pleural mesothelioma microenvironment and promotes tumor growth. Front Immunol. (2017) 8:1559. doi: 10.3389/fimmu.2017.01559
49. Nayak A, Ferluga J, Tsolaki AG, Kishore U. The non-classical functions of the classical complement pathway recognition subcomponent C1q. Immunol Lett. (2010) 131:139–50. doi: 10.1016/j.imlet.2010.03.012
50. Perry VH, O'Connor V. C1q: the perfect complement for a synaptic feast? Nat Rev Neurosci. (2008) 9:807–11. doi: 10.1038/nrn2394
51. Agostinis C, Toffoli M, Zito G, Balduit A, Pegoraro S, Spazzapan M, et al. Proangiogenic properties of complement protein C1q can contribute to endometriosis. Front Immunol. (2024) 15:1405597. doi: 10.3389/fimmu.2024.1405597
52. Iwasaki H, Somoza C, Shigematsu H, Duprez EA, Iwasaki-Arai J, Mizuno S, et al. Distinctive and indispensable roles of PU.1 in maintenance of hematopoietic stem cells and their differentiation. Blood. (2005) 106:1590–600. doi: 10.1182/blood-2005-03-0860
53. van de Bovenkamp FS, Dijkstra DJ, van Kooten C, Gelderman KA, Trouw LA. Circulating C1q levels in health and disease, more than just a biomarker. Mol Immunol. (2021) 140:206–16. doi: 10.1016/j.molimm.2021.10.010
54. Vidergar R, Balduit A, Zacchi P, Agostinis C, Mangogna A, Belmonte B, et al. C1q-HA matrix regulates the local synthesis of hyaluronan in Malignant pleural mesothelioma by modulating HAS3 expression. Cancers (Basel). (2021) 13. doi: 10.3390/cancers13030416
55. Balduit A, Vidergar R, Zacchi P, Mangogna A, Agostinis C, Grandolfo M, et al. Complement protein C1q stimulates hyaluronic acid degradation. Front Immunol. (2023) 14:1151194. doi: 10.3389/fimmu.2023.1151194
56. Petry F, Botto M, Holtappels R, Walport MJ, Loos M. Reconstitution of the complement function in C1q-deficient (C1qa-/-) mice with wild-type bone marrow cells. J Immunol. (2001) 167:4033–7. doi: 10.4049/jimmunol.167.7.4033
57. Revel M, Sautès-Fridman C, Fridman WH, Roumenina LT. C1q+ macrophages: passengers or drivers of cancer progression. Trends Cancer. (2022) 8:517–26. doi: 10.1016/j.trecan.2022.02.006
58. Ishii M, Wen H, Corsa CA, Liu T, Coelho AL, Allen RM, et al. Epigenetic regulation of the alternatively activated macrophage phenotype. Blood. (2009) 114:3244–54. doi: 10.1182/blood-2009-04-217620
59. Takeuch O, Akira S. Epigenetic control of macrophage polarization. Eur J Immunol. (2011) 41:2490–3. doi: 10.1002/eji.201141792
60. Adams D, Altucci L, Antonarakis SE, Ballesteros J, Beck S, Bird A, et al. BLUEPRINT to decode the epigenetic signature written in blood. Nat Biotechnol. (2012) 30:224–6. doi: 10.1038/nbt.2153
61. Saeed S, Quintin J, Kerstens HH, Rao NA, Aghajanirefah A, Matarese F, et al. Epigenetic programming of monocyte-to-macrophage differentiation and trained innate immunity. Science. (2014) 345:1251086. doi: 10.1126/science.1251086
62. Chen S, Yang J, Wei Y, Wei X. Epigenetic regulation of macrophages: from homeostasis maintenance to host defense. Cell Mol Immunol. (2020) 17:36–49. doi: 10.1038/s41423-019-0315-0
63. Korb LC, Ahearn JM. C1q binds directly and specifically to surface blebs of apoptotic human keratinocytes: complement deficiency and systemic lupus erythematosus revisited. J Immunol. (1997) 158:4525–8. doi: 10.4049/jimmunol.158.10.4525
64. Choudhury J, Pandey D, Chaturvedi PK, Gupta S. Epigenetic regulation of epithelial to mesenchymal transition: a trophoblast perspective. Mol Hum Reprod. (2022) 28. doi: 10.1093/molehr/gaac013
65. Lee JH, Poudel B, Ki HH, Nepali S, Lee YM, Shin JS, et al. Complement C1q stimulates the progression of hepatocellular tumor through the activation of discoidin domain receptor 1. Sci Rep. (2018) 8:4908. doi: 10.1038/s41598-018-23240-6
66. Roumenina LT, Daugan MV, Noe R, Petitprez F, Vano YA, Sanchez-Salas R, et al. Tumor cells hijack macrophage-produced complement C1q to promote tumor growth. Cancer Immunol Res. (2019) 7:1091–105. doi: 10.1158/2326-6066.CIR-18-0891
67. Yang J, Lin P, Yang M, Liu W, Fu X, Liu D, et al. Integrated genomic and transcriptomic analysis reveals unique characteristics of hepatic metastases and pro-metastatic role of complement C1q in pancreatic ductal adenocarcinoma. Genome Biol. (2021) 22:4. doi: 10.1186/s13059-020-02222-w
Keywords: epigenetic regulation, C1Q, in silico analysis, C1QA, C1QB, C1QC
Citation: Pegoraro S, Balduit A, Mangogna A, Kishore U, Ricci G, Agostinis C and Bulla R (2024) Epigenetic regulation of complement C1Q gene expression. Front. Immunol. 15:1498097. doi: 10.3389/fimmu.2024.1498097
Received: 18 September 2024; Accepted: 04 November 2024;
Published: 03 December 2024.
Edited by:
Jagadeesh Bayry, Indian Institute of Technology Palakkad, IndiaReviewed by:
Rohit Ghai, Academy of Sciences of the Czech Republic (ASCR), CzechiaUmakhanth Venkatraman Girija, De Montfort University, United Kingdom
Copyright © 2024 Pegoraro, Balduit, Mangogna, Kishore, Ricci, Agostinis and Bulla. This is an open-access article distributed under the terms of the Creative Commons Attribution License (CC BY). The use, distribution or reproduction in other forums is permitted, provided the original author(s) and the copyright owner(s) are credited and that the original publication in this journal is cited, in accordance with accepted academic practice. No use, distribution or reproduction is permitted which does not comply with these terms.
*Correspondence: Chiara Agostinis, Y2Fnb3N0aW5pc0B1bml0cy5pdA==