 Aïcha Kante1,2
 Mathieu F. Chevalier2Damien Sène1,2Jeanne Chauffier1,2Stéphane Mouly1,3
 Benjamin Glenn Chousterman4,5Fériel Azibani5Benjamin Terrier6,7Théo Pezel5,8Cloé Comarmond1,2*
- 1Department of Internal Medicine, Lariboisière Hospital, Assistance Publique - Hôpitaux de Paris (AP-HP), Université Paris Cité, Paris, France
- 2INSERM UMR-S 976, Institut de Recherche Saint-Louis, Université Paris Cité, Paris, France
- 3INSERM UMR-S 1144, Université Paris Cité, Paris, France
- 4Department of Anesthesiology and Intensive Care, Lariboisière Hospital, Assistance Publique - Hôpitaux de Paris (AP-HP), Paris, France
- 5INSERM UMR-S 942 MASCOT - Université Paris Cité, Paris, France
- 6Department of Internal Medicine, Cochin Hospital, Assistance Publique - Hôpitaux de Paris (AP-HP), Université Paris Cité, Paris, France
- 7INSERM, U970, PARCC, Université de Paris Cité, Paris, France
- 8Department of Cardiology, Lariboisière Hospital, Université Paris Cité, Paris, France
Auto-immune and inflammatory diseases are heterogenous in their clinical manifestations and prognosis, even among individuals presenting with the same pathology. Understanding the immunological alterations involved in their pathogenesis provides valuable insights in different clinical phenotypes and treatment responses. Immunophenotyping could lead to significant improvements in diagnosis, monitoring, initial treatment decisions and follow-up in autoimmune and inflammatory diseases. Mass cytometry provides measurement of over 40 simultaneous cellular parameters at single-cell resolution, and therefore holds immense potential to evaluate complex cellular systems and for high-dimensional single-cell analysis. The high dimensionality of mass cytometry provides better coverage of immune populations dynamics, with sufficient power to identify rare cell types compared to flow cytometry. In this comprehensive review, we explore how mass cytometry findings contributed in the past decade to a deeper understanding of the cellular actors involved in systemic auto-immune and auto-inflammatory diseases with their respective therapeutic and prognostic impact. We also delve into the bioinformatical approaches applied to mass cytometry to analyze the high volumes of data generated, as well as the impact of the use of complementary single cell RNA sequencing, and their spatial modalities. Our analysis highlights the fact that mass cytometry captures major information on cell populations providing insights on the complex pathogenesis of autoimmune diseases. Future research designs could include mass cytometry findings in association to other -omics to stratify patients in adequate therapeutic arms and provide advancements in personalized therapies in the field of auto-immune and inflammatory diseases.
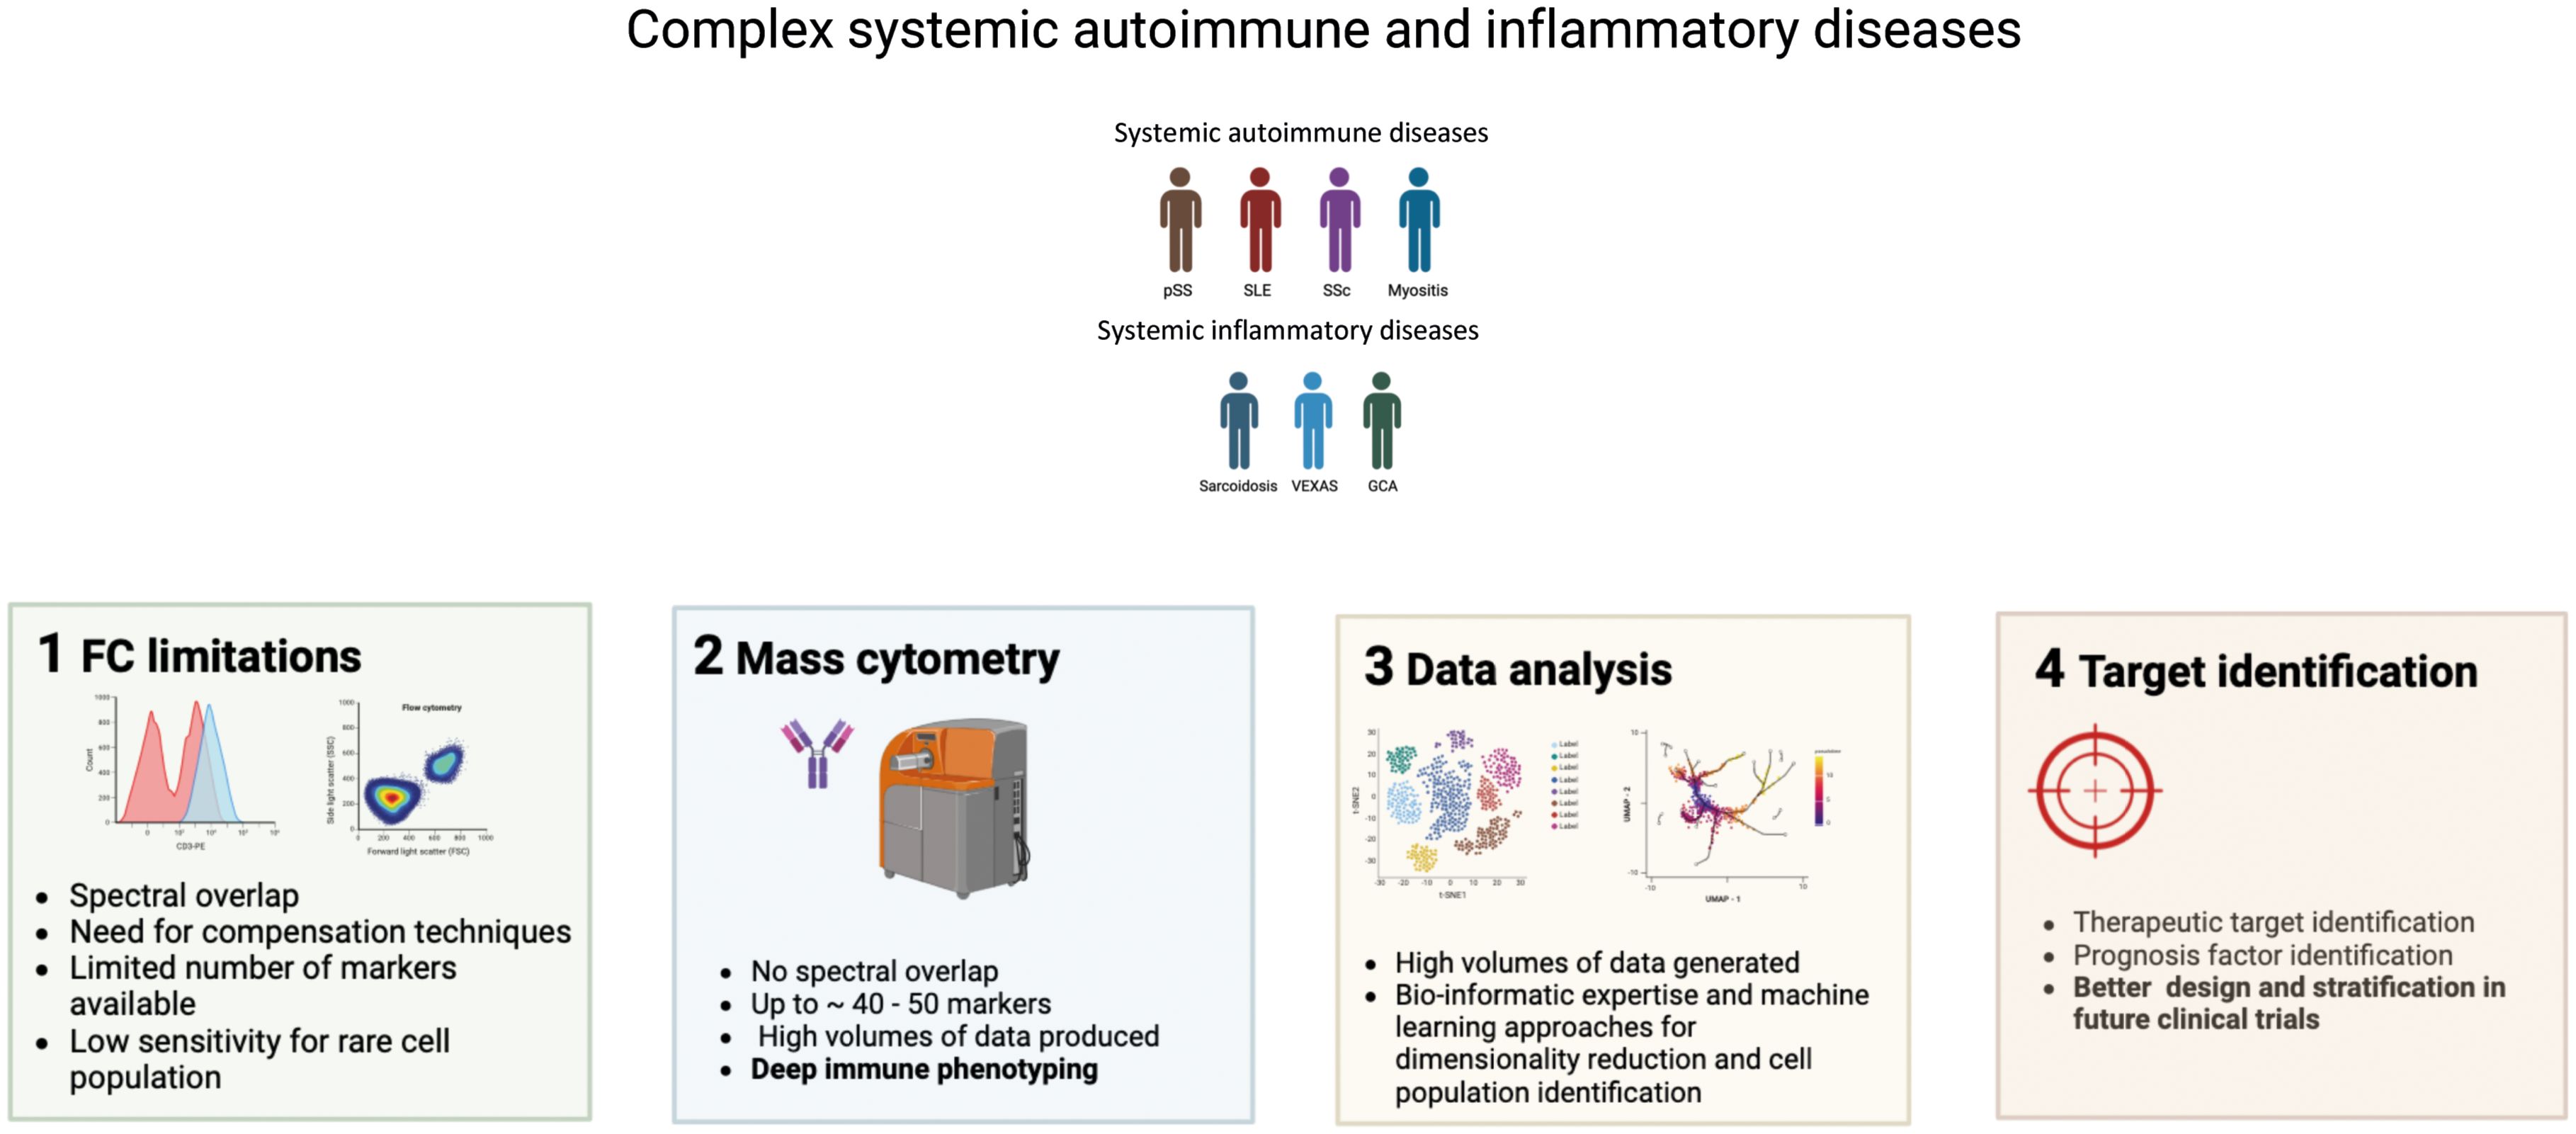
Graphical Abstract. Interest of using mass cytometry for systemic autoimmune and inflammatory diseases immunophenotyping.
Highlights
● Mass cytometry has revolutionized immunophenotyping, especially for complex and simultaneous characterization of diverse immune subsets involved in autoimmunity.
● The interpretation of mass cytometry findings is complex due to the high volume of data generated and requires bioinformatical approaches including machine learning.
● Mass cytometry contributes to reveal the heterogeneity present in autoimmune and inflammatory diseases, uncovering targets with therapeutic and prognostic impact.
Introduction
Auto-immune and inflammatory diseases are heterogenous in their clinical manifestations and prognosis, including between individuals presenting with the same disease. Advances in single-cell technologies are revolutionizing the field of immunology, revealing an underappreciated complexity of immune cell subsets, types, with different phenotypes and function. Understanding the immunological alterations involved in the pathogenesis of autoimmune and autoinflammatory provides valuable insights into the different clinical presentations and treatment responses in these conditions. Single-cell technologies, in particular mass cytometry, have potential to lead to significant improvements in diagnosis, monitoring, initial treatment decisions and/or follow-up in autoimmune and inflammatory diseases. Flow cytometry is known as a key tool to study immune system actors’ implications in various pathological conditions. However, the use of flow cytometry remains highly susceptible to variations with technological limitations regarding sample preparation, and a limited number of usable markers due to spectral overlap, autofluorescence, and instrument constraints (1). As a result, flow cytometry requires large sample sizes (multiple tubes with different antibody panels) for coverage of diverse immune subsets.
Mass cytometry is an -omic approach which embodies the fusion of two technologies: mass spectrometry and flow cytometry. This approach uses elemental mass spectrometry to detect metal-conjugated antibodies that are bound intracellularly or extracellularly to antigens of interest on single cells (2). In mass cytometry (or cytometry by Time of Flight, CyTOF) and Imaging Mass Cytometry (IMC), the fluorescent labels are replaced with heavy metal ions. These heavy metal ions are not normally present in biological specimens and produce very distinctive mass peaks when detected, which allows for more markers to be measured in a single analysis using mass cytometry. By incorporating a large number of parameters into single stains, both CyTOF and IMC significantly increase the ability to evaluate complex immunological data from limited sample sizes to better understand biological systems, response to therapy and disease signatures (3, 4).
CyTOF has the potential to help characterize immune cell signatures and subtypes linked to clinical outcomes, treatment responses, response to vaccines and disease relapse prediction with high resolution. Mass cytometry provides measurement of over 40 simultaneous cellular parameters at single-cell resolution, and therefore has great potential to evaluate complex cellular systems and for high-dimensional single-cell analysis. Mass cytometry has led to the discovery of disease-associated immunological dysregulations in different fields such as cancer and autoimmunity. The identification of functional changes could guide subsequent therapy and ultimately predict therapeutic outcomes and could be applied to an array of diseases. Both CyTOF and IMC have potential for translational clinical application. In the context of breast cancer, the identification of multiplex spatial cellular relationships in a large cohort of breast tumor samples has helped improve histopathological classification. Single cell pathology groups assessed using IMC were superior to standard histopathological grading criteria based on hormone receptor and human epidermal growth factor 2 expression to predict clinical outcomes (5).
During mass cytometry-generated data analysis, machine learning (ML) algorithms are implemented to detect predicting patterns and immune signatures. Specifically, supervised, and unsupervised ML algorithms are widely used for data hierarchical clustering and identification of differentially abundant clusters.
The level of evidence for mass cytometry is recent but has seen an exponential rise in publications for revealing many facets of cellular behavior from a single experiment.
In this review, we explore how mass cytometry has contributed in the past fourteen years to a deeper understanding of the immune cell profiles and heterogeneity present in systemic autoimmune and inflammatory diseases, with their respective therapeutic and prognostic impact. We also discuss how RNA-seq and single-cell RNA seq (scRNA-seq) are being applied to study immune cell subsets in the blood, target organs and tissue-resident cells. Our objectives are: i/to summarize how CyTOF, a high-dimensional single-cell tool, allows the identification of complex cellular features in patients with immune mediated systemic diseases, in mirror with other single cell analyses ii/to provide insights on the complex pathological mechanisms of autoimmune diseases and their correlation with disease activity and clinical improvement, as well as the discovery of cellular signatures with diagnostic and therapeutic potential across various systemic autoimmune diseases. iii/We also provide insights on the ML techniques applied to mass cytometry for the analysis of the high volumes of data generated.
Computational analysis
Mass cytometry is a multiparametric technology that helps depict an exhaustive immune phenotype. The vast amount of data generated helps gain better insight into immune polarization, cellular differentiation and intracellular signaling in various pathological conditions. The analysis of large volumes of generated data is impossible manually and necessitates the application machine learning algorithms which help discard the subjective aspect of manual gating used in conventional flow cytometry. The main algorithms used in the articles presented in this review include Spanning-tree Progression Analysis of Density-normalized Events (SPADE), self-organizing maps (FlowSOM), cluster identification, and characterization and regression (CITRUS). T distributed stochastic neighbor embedding (t-SNE) and uniform manifold approximation and projection (UMAP) were the two main algorithms used for dimensionality reduction.
The SPADE computational approach is a hierarchical clustering algorithm developed in 2011 (6). The workflow involves a first step of downsampling the data to reduce computational cost, followed by agglomerative clustering of cells based on their phenotypes. This tool helps represent different cell subsets in the form on minimal spanning trees (MSTs), which are a visual representation of clusters’ phenotypical resemblance. MSTs are built in a way that the sum of the weights of the branches is minimal, allowing the nodes to be connected to the ones they are the most similar to (6). One main limitation of the SPADE algorithm involves the slowness of execution, especially when involving larger datasets.
FlowSOM is an algorithm based on the generation of self-organizing maps (SOMs) using an unsupervised approach and a specific type of neural network. The analytical workflow involves 4 different steps, starting with reading the data and building SOMs, followed by building an MST and performing metaclustering. The generation of groups of clusters – metaclusters - help annotate the behavior of specific cell populations and better visualization. Cluster nodes, like in SPADE algorithm, are represented as an MST. The execution time however is faster when compared to SPADE (7).
CITRUS is a machine learning algorithm also widely used to assess cell clusters. It also uses a system based on the hierarchization of cells according to phenotypical resemblance. Statistical relevance is automatically assessed; however, statistical relevance as p-values must be calculated using a different system. Data can be visualized using radial hierarchy trees, in which two parent clusters give “birth” to clusters who represent subsets of the parent cluster (8).
ViSNE is a tool dedicated to CyTOF data analysis, that permits dimension reduction using the t-distributed stochastic neighbor embedding (t-SNE) algorithm. The result is a two-dimensional plot with a display of cells according to their phenotypical resemblance. PhenoGraph also uses the t-SNE algorithm, but contrary to ViSNE, stratifies every event into subpopulations (cell clusters) (9).
Imaging mass cytometry is an advanced tool to assess the immune phenotype in the context of various diseases, with an additional spatial element and the possibility of visualizing direct cell-cell interactions. However, direct comparisons between CyTOF performed on PBMC and IMC performed on tissue remains technically challenging, in part due to the difference in the type of cells analyzed (PBMCs or whole blood with CyTOF, vs formalin-fixed, paraffin embedded tissues in IMC). IMC also presents a somewhat lower dimensionality owing to the lower number of antibodies useable in a single staining protocol. Furthermore, bioinformatical expertise is also needed to assess to quantify and assess the behavior of various cell clusters. Cell segmentation is usually performed using pre-trained deep-learning algorithms based on neural networks, like the Mesmer algorithm developed by Greenwald et al. (10).
Methods
A systematic search on Medline databases from January 2010 to March 2024 was carried out to summarize the results of published studies on mass cytometry and IMC features of autoimmune diseases.
Different combinations of the following terms were used: “mass cytometry”, “CyTOF”, “imaging mass cytometry”, AND “autoimmunity”, “autoimmune disease”, “connective tissue diseases”, “lupus”, “Sjögren syndrome”, “systemic sclerosis”, “myositis”, “sarcoidosis”, “vasculitis”, “VEXAS syndrome”.
Systemic autoimmune diseases
Systemic autoimmune diseases are characterized by their complexity and a high number of immunological actors involved in their physiopathology. Mass cytometry has helped identify clusters of cells associated with diseases and prognosis (Table 1 and Figure 1).
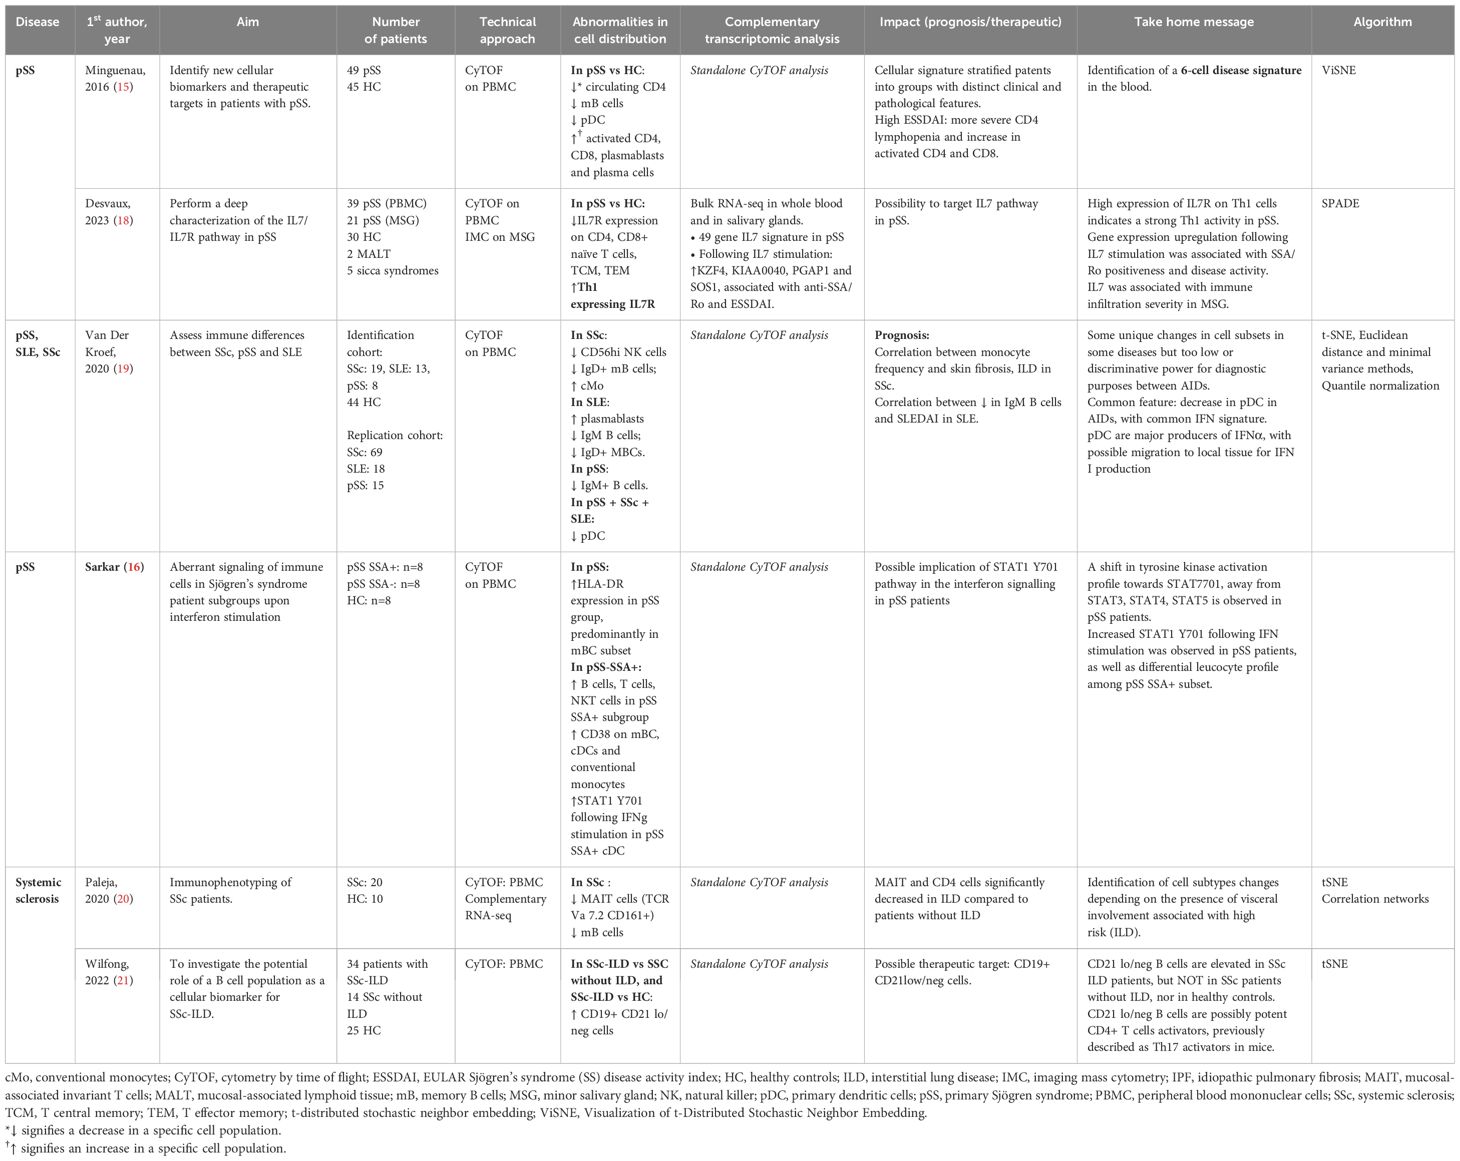
Table 1. Mass cytometry in Sjögren syndrome and systemic sclerosis.
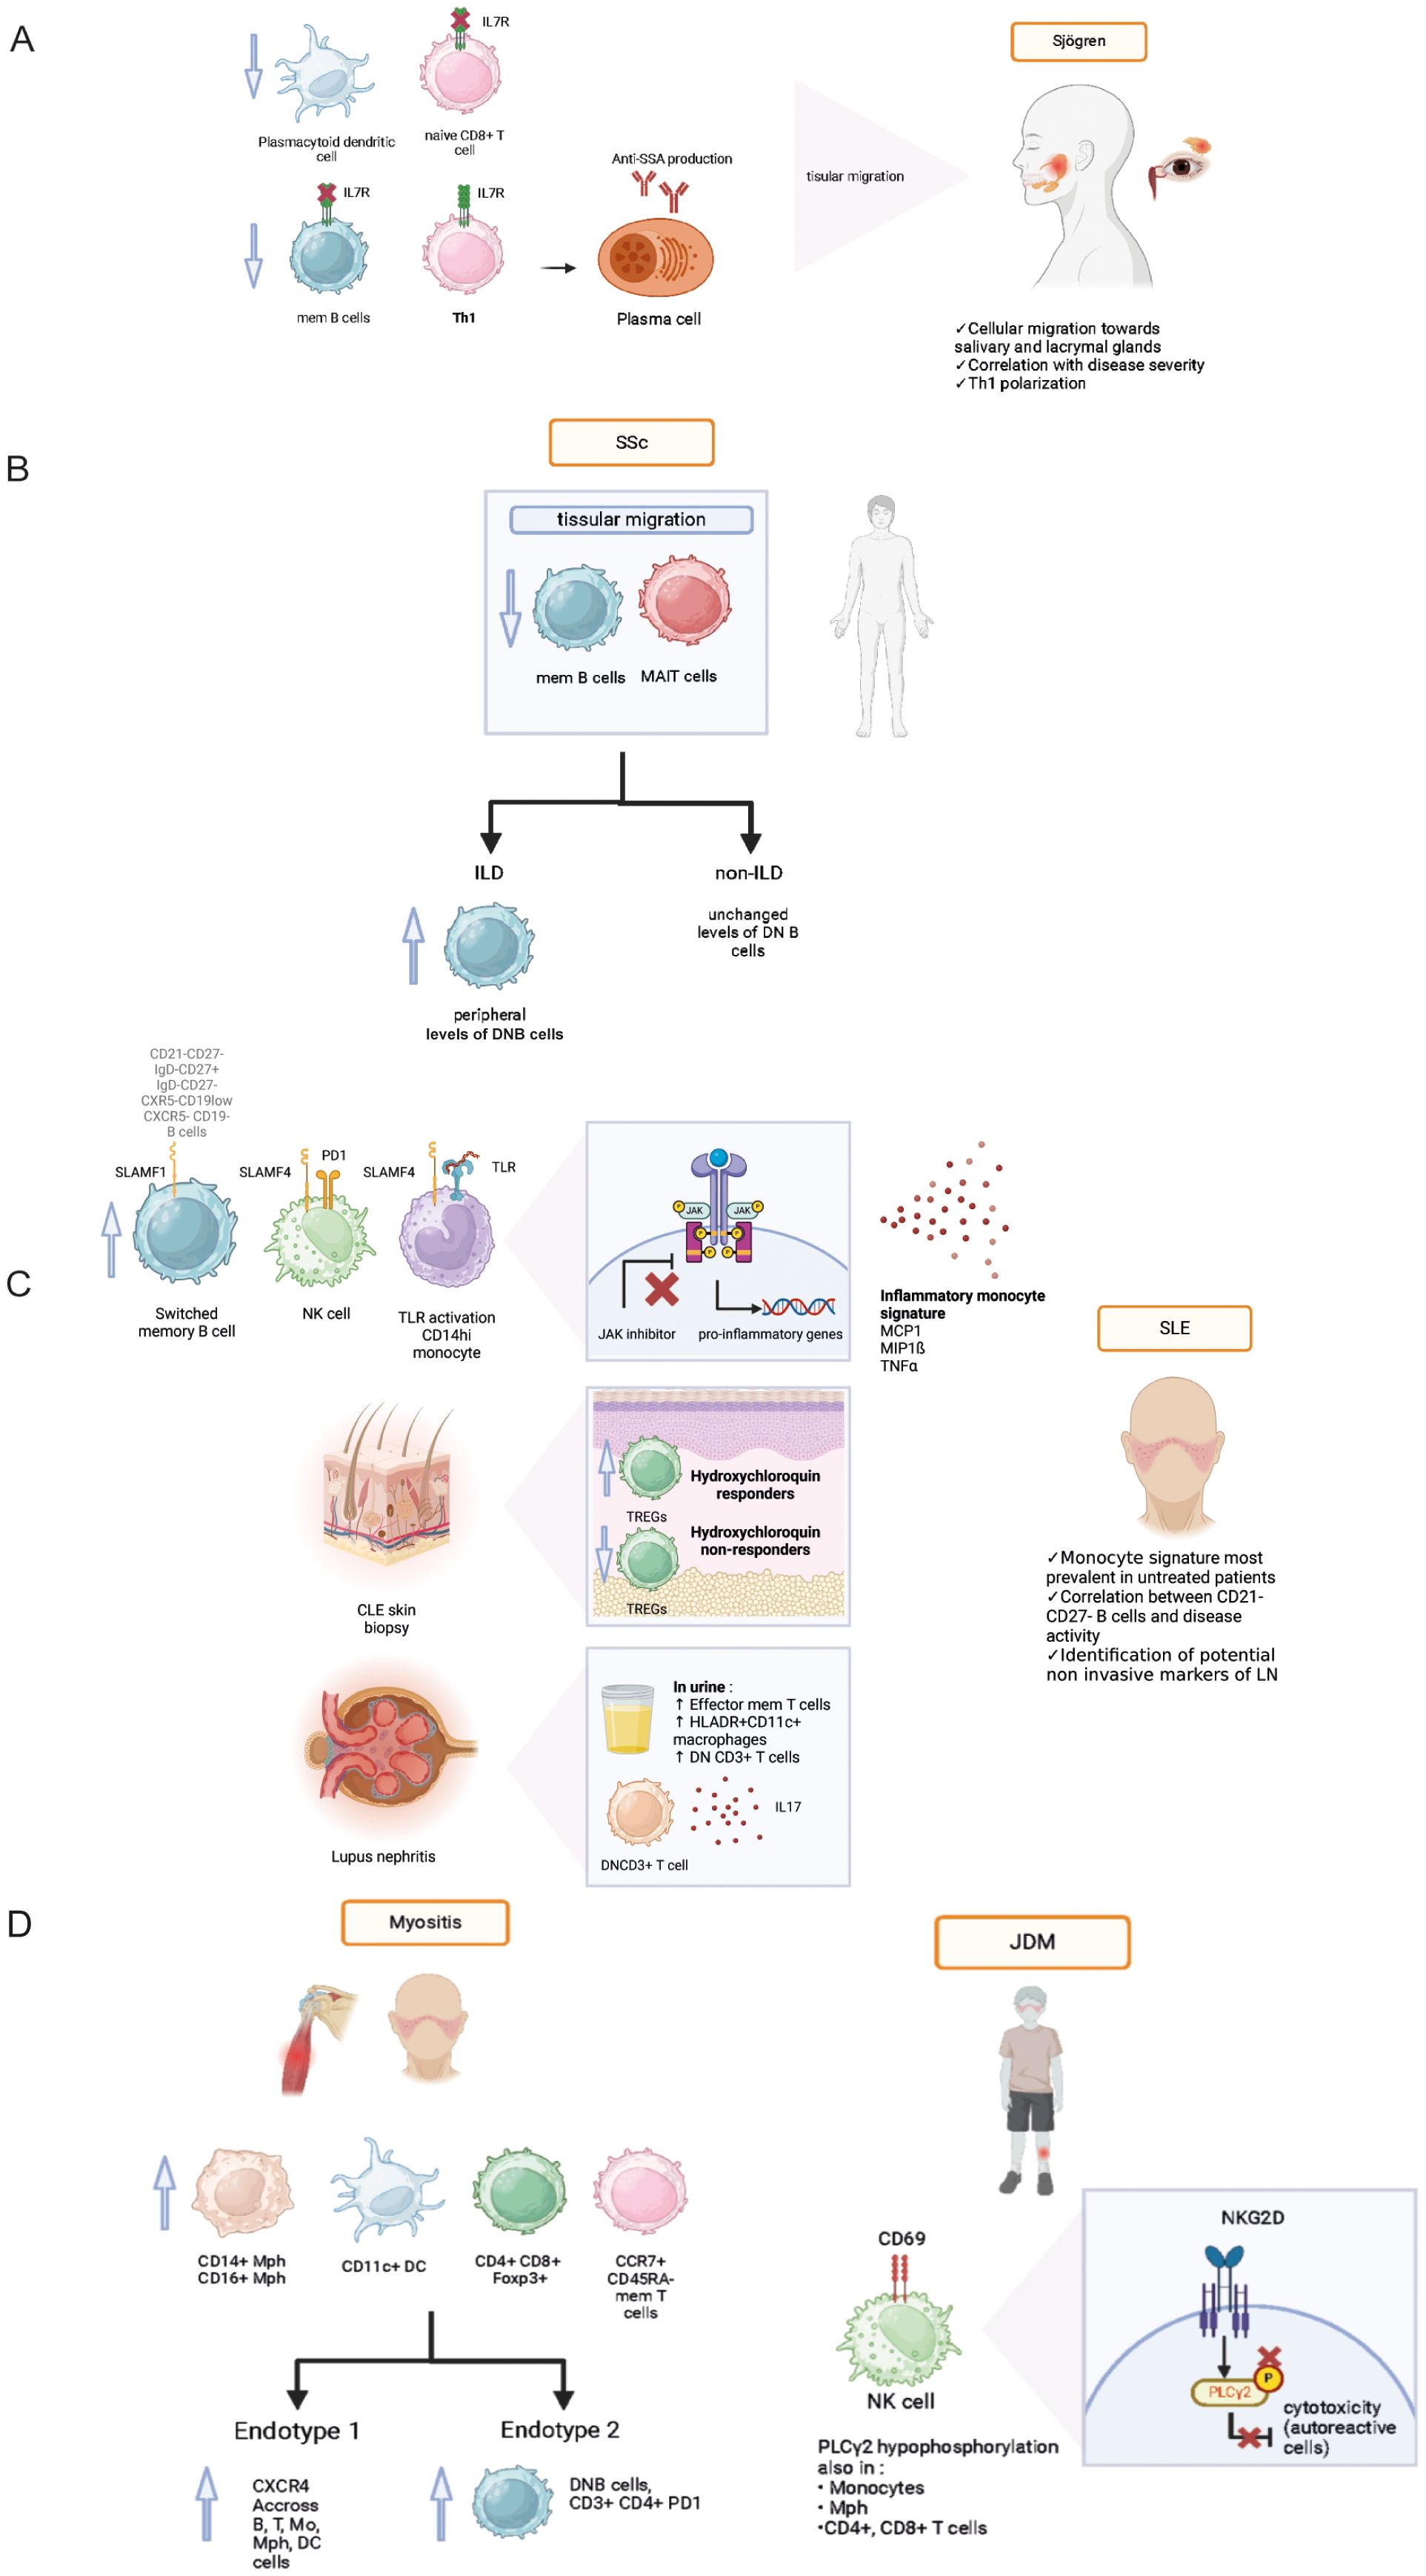
Figure 1. Pathophysiological data acquired from mass cytometry analyses in various systemic autoimmune diseases: Sjögren syndrome (A), Systemic sclerosis (B), Systemic lupus erythematosus (C), Idiopathic inflammatory myopathies and juvenile dermatomyositis (D). Th1, T helper 1, IL7R, IL7 receptor; SLAMF, signaling lymphocytic activation molecule family; SLE, systemic lupus erythematosus; SLEDAI, systemic lupus erythematosus disease activity index, PD1, programmed death cell 1; TLR, toll-like receptor; JDM, juvenile dermatomyositis; NKG2D, Natural killer group 2D; mem T cell, memory T cell; mem B cell, memory B cell; Mph, macrophage; DC, dendritic cell; DN B, double negative B cell; MAIT, mucosal-associated invariant T cell; CXCR4, C-X-C chemokine receptor type 4; ILD, interstitial lung disease.
Primary Sjögren syndrome (pSS)
Primary Sjögren’s syndrome (pSS) is a systemic autoimmune disease, characterized by mononuclear cell infiltrates in the salivary and lacrimal glands, leading to glandular atrophy and dryness. Patient heterogeneity and lack of knowledge regarding its pathogenesis makes pSS a difficult disease to manage, and explains in part the absence of validated treatment. Moreover, symptom burden and immunomodulatory medication do not correlate with pSS end-organ or laboratory abnormalities (11, 12). Robust ML methods exist to stratify pSS patients based on five common symptoms associated with the disease (13). Symptom-based stratification of pSS patients revealed distinct pathobiological endotypes with different responses to immunomodulatory treatments (14). Heterogeneity is a major obstacle to develop effective treatments for pSS patients, motivating authors to perform an extensive landscape of the immune cells involved in pSS physiopathology using mass cytometry. Mingueneau et al. identified a 6-cell disease signature defined by decreased numbers of memory B lymphocytes, plasmacytoid dendritic cells (pDCs) numbers, increased representation of activated CD4+, CD8+ T cells and plasmablasts (Table 1). The cellular signature helped separate the cohort into groups with distinct clinical and pathological features. Patients with higher EULAR Sjögren syndrome disease activity indexes (ESSDAI) were associated with a higher proportion of activated CD4+ and CD8+, and more pronounced CD4+ lymphopenia (15).
Sarkar et al. showed that IFNα2b stimulation results in an increased signaling through phosphorylated signal transducer and activator of transcription protein 1 (pSTAT1), a major actor involved in cytokine production. This pSTAT1 production was observed in most cell types of pSS patients compared to controls. IFNγ stimulation resulted in significantly increased pSTAT1 induction in conventional DCs, classical and non-classical monocytes in the pSS patients (16), highlighting a high sensitivity to inflammatory stimuli. Most of the observed differences were more pronounced in the SSA+ subgroup, suggesting that these patients may benefit from therapies targeting these pathways (Table 1).
IL-7 cytokine is involved in B and T cell lymphopoiesis and T cell maturation. The increased expression of its receptor in epithelial tissue could participate to chronic inflammation and subsequent symptoms. Studies had previously shown increased IL-7 levels, associated high EULAR Sjogren syndrome disease activity index (17). Desvaux et al. further investigated the role IL-7/IL-7R pathway in pSS patients (18) using a multimodal approach. Initially performing bulk RNA-seq, they highlighted the IL7 axis activation at the transcriptomic level in the whole blood of pSS patients as well as salivary glands. Performing mass cytometry helped confirm IL7/IL7R axis implication in relevant circulating and target-organ cell populations. IL-7R was mainly found on epithelial cells, CD4+ and CD8+ T cells, switched memory B cells, double negative (DNB, CD21- CD27-) B cells and M1 macrophages (Figure 1A). The authors found a higher expression of IL7-R at the surface of T helper 1 (Th1) cells, confirming the role of Th1-polarized immunity in pSS. Anti-IL-7R targeted therapy could be an interesting therapeutic approach in pSS patients with a high IL-7 axis involvement (Table 1).
Systemic sclerosis (SSc)
Systemic sclerosis is a heterogeneous autoimmune disease associating fibrosis, inflammation, and microvascular disease. Before the onset of skin fibrosis and other organ involvement, patient with Raynaud’s phenomenon and positivity for SSc-specific autoantibodies and/or typical nailfold capillaroscopy abnormalities are considered early SSc patients. Van der Kroef et al. demonstrated that increased frequency of intermediate and non-classical monocytes was specific for early and definite SSc (19).
Paleja et al. used a CyTOF panel composed of cell surface and intracellular markers to comprehensively characterize peripheral immune cell composition in SSc patients and healthy controls (HC) (20). Unsupervised clustering revealed disease-specific alterations in PBMCs from SSc patients with a decrease in memory B cell and a concomitant increase in naive B cells, and significant reduction of mucosal associated innate T lymphocytes (MAIT cells) and DN (CD4−CD8−) T cells in SSc patients (Figure 1B). Correlation analysis of mass cytometry data revealed an inverse correlation between programmed death cell 1 (PD-1) expression and the frequency of MAIT cells in SSc patients compared to healthy controls. In this study, the combination of high-dimensionality data identified cell subsets reminiscent of functionally adapted, exhausted T cells in response to chronic stimulation (Table 1).
Interstitial lung disease (ILD) is a major cause of mortality and morbidity in SSc, primarily due to associated pulmonary hypertension and subsequent right ventricle dysfunction. Wilfong et al. (21) identified the presence of DNB CD21-/low cells who were elevated in SSc patients presenting with ILD compared to SSc controls, and could thus serve as a potential biomarker.
Systemic lupus erythematosus (SLE)
SLE is an auto-immune disease that affects multiple organs with an unpredictable course, and can lead to irreversible visceral damage when untreated. Current diagnostic strategic methods are insufficient to predict the severity and course of the disease, the occurrence of a flare and treatment response. Identifying early-stage SLE presents a challenge as initial symptoms are often non-specific and autoantibody production alone is not sufficient to establish diagnosis. Sasaki et al. (22) identified several cell populations expanded during early-stage SLE: antibody secreting plasmablasts, helper T cells (Tph), and T follicular helper (Tfh) cells were identified as potential biomarkers for early SLE. These populations could potentially serve as biomarkers and early therapeutic targets (Figure 1C).
Evidence points toward a polarization of the immune phenotype depending on disease activity. A deeper understanding of SLE physiopathology can help identify prognosis factors. Increased levels of DN B cells were described in the context of SLE (23). In a pediatric cohort of childhood onset SLE (cSLE), Baxter et al. (24) revealed the expansion of an extrafollicular B cell and T peripheral helper (Tph) population, as well as a correlation between the presence of cytokine producing B cells and disease activity. In this study of new-onset cSLE, the authors conducted a complementary bulk RNA-seq analysis, which validated previously published findings of an increased peripheral plasmablast signature and a type I IFN signature. The strength of this integrated approach relied on its use of the same patient cohort, allowing for a direct comparison to abnormalities observed using mass cytometry. Additionally, a novel population of plasmablast-like CXCR5- CD19low cells was identified in a cohort of adult patients affected with chronic SLE using mass cytometry (25). Following these findings, using a targeted RNA-seq approach performed on FC-sorted B cells, the authors identified the expression of transcription factors involved in plasma cell and plasmablasts survival (IRF4, PRDM1, XBP1, EZH2). Other cell populations were associated with SLE. Kajihara et al. (26) identified 5 clusters based on the proliferative activity of 5 immune cell populations: conventional monocytes (cMo), CD8+ effector memory T cells, CXCR5- non-B cells, CXCR5- DN B cells and plasma cells, with varying associated disease activity index score (SLEDAI).
SLE also presents therapeutic challenges. To this day, only one targeted biotherapy has been validated: Belimumab, an anti-BAFF monoclonal antibody targeting the cytokine essential for B cell homeostasis. The results of Ramskold et al. showed B cell subset alterations in responders versus non-responders following Belimumab administration in SLE patients (27). The authors suggested that evaluation of B cell counts might be useful prior to initiation of Belimumab treatment, as high baseline B cell counts were associated with unfavorable outcome. In another study, Belimumab was also found to have an impact on T cell populations with an increase in circulating anti-inflammatory regulatory T cells (TREGs) compared to untreated SLE patients (Figure 1C) (28).
Interferon and Janus kinase (JAK) – STAT pathways have been previously associated with SLE physiopathology in conventional cytometry and transcriptomic studies. Yiu et al. showed that high interferon signature leads to increased STAT1/3/5 phosphorylation in peripheral blood circulating mononuclear cells (PBMCs) from SLE patients studied using single cell mass cytometry. Patients were divided into interferon (IFN) high and IFN-low groups based on their transcriptomic profiles. IFN-high patients displayed higher proportions of circulating B and NK cells, and cytokine stimulation was associated with higher activation of STAT1/3/5 intracellular pathways. In another study, O’Gorman et al. (29) identified the presence of a specific monocytic signature (MCP-1+, MIP-1ß, TNFα) in a population of untreated SLE patients stimulated with TLR (toll-like receptor) agonists. The signature was also identified in a population of pediatric SLE patients, and was suppressed by JAK inhibitor treatment (30). These findings provide further support for the development of JAK inhibitor therapies in the context of SLE (31).
New potential targeted therapies were identified following deep immune phenotyping using mass cytometry. Humbel et al. (32) unveiled an increased expression of molecules belonging to the signaling lymphocytic activation family (SLAMF) on memory B cells, monocytes, NK cells and Tfh in SLE compared to other auto-immune diseases (Figure 1C). Targeting SLAMF in SLE with elotozumab, an anti-SLAMF7 antibody, restored NK cytotoxic cell functions in SLE patients, priming them to kill antibody-secreting plasma cells in vitro, making NK cells a target of interest in SLE management (33). Rincon-Arevalo et al. showed an increased frequency of CD11c+ B cells carrying CD21- CD27- phenotype in SLE patients (34). In addition, the authors found other markers of B cells activation such as reduced CD21, and increased expression of activation (CD69, CD86), proliferation (Ki67), survival (CD137) and co-inhibitory (PD1, PDL1) markers (Table 2).
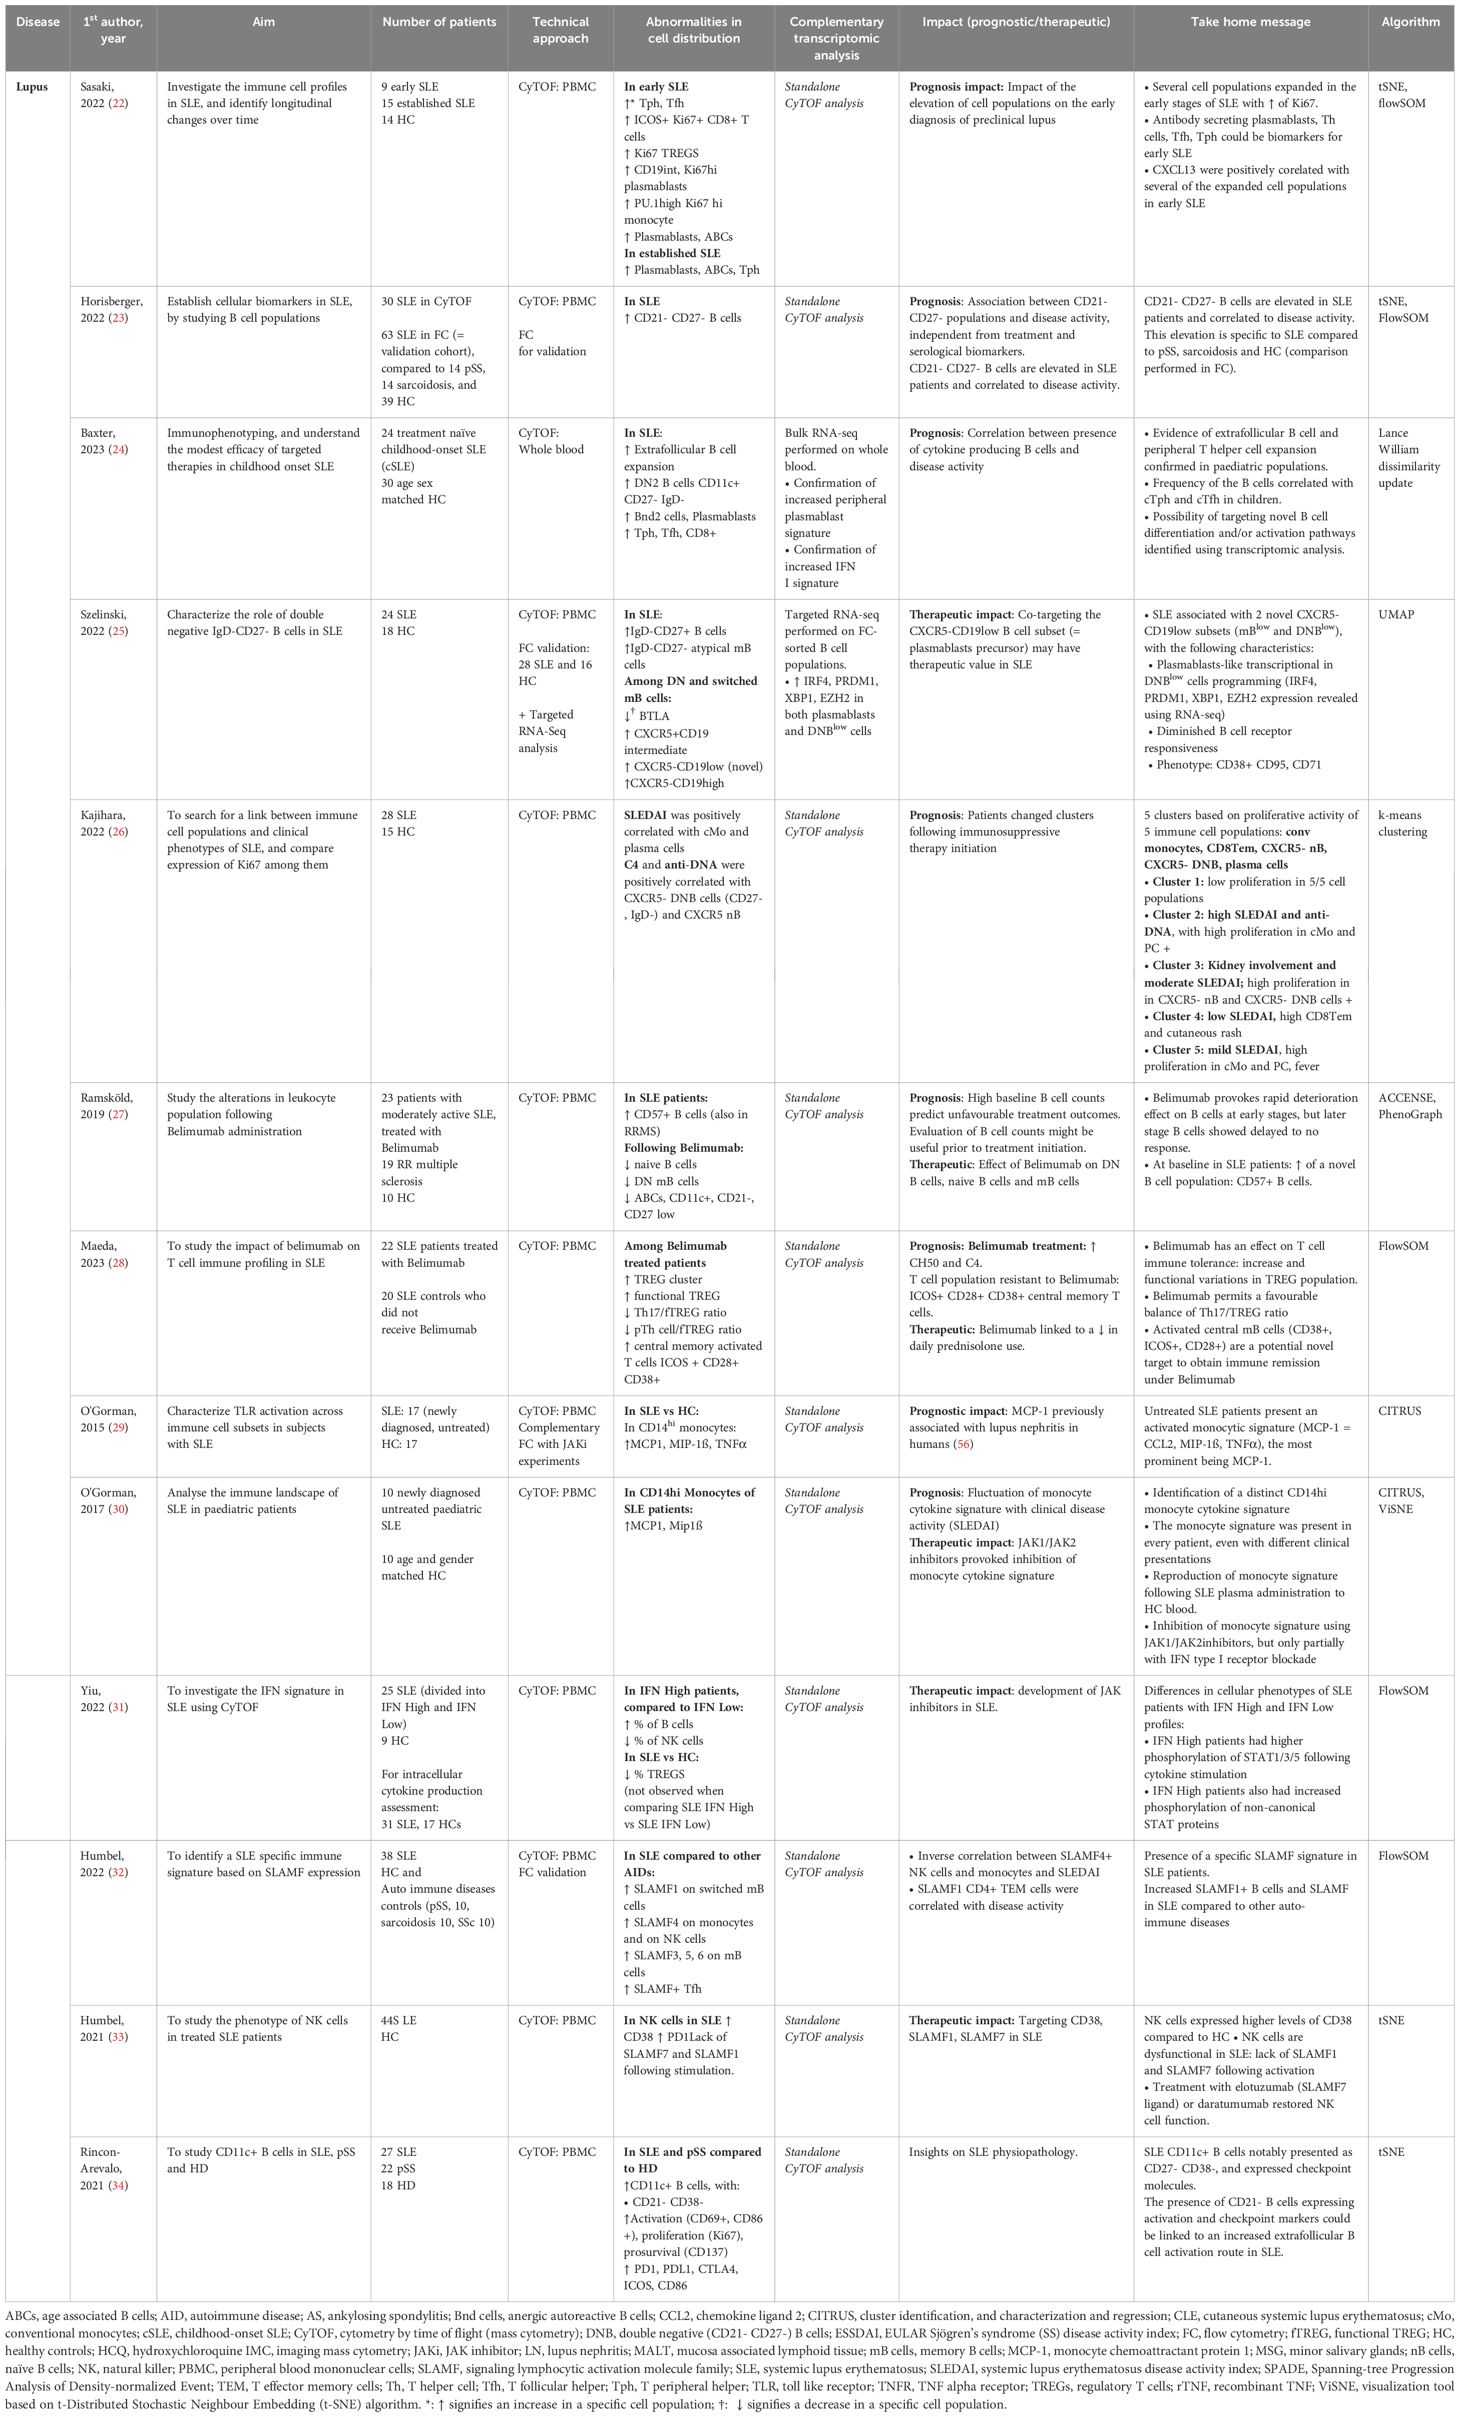
Table 2. Mass cytometry in lupus: PBMC and whole blood analysis.
Cutaneous SLE (CLE) is a frequent manifestation with various degrees of associated comorbidity, and a multifactorial physiopathology which involves environmental factors. Anti-malarials represent the first line treatment but response is unpredictable. Patel et al. (35) compared skin biopsies performed on CLE patients using IMC, stratifying patients according to anti-malarial treatment response. Non-responders displayed a pro-inflammatory profile with diminished levels of TREGs and increased expression of pSTAT3 in CD7+ cells, whereas responders had increased levels of anti-inflammatory γ∂T cells (Table 3). These results suggest that non-responders with low TREGs count may respond to low dose IL2 stimulation, whereas non-responders with increased pSTAT3 could probably respond better to JAK inhibitors.
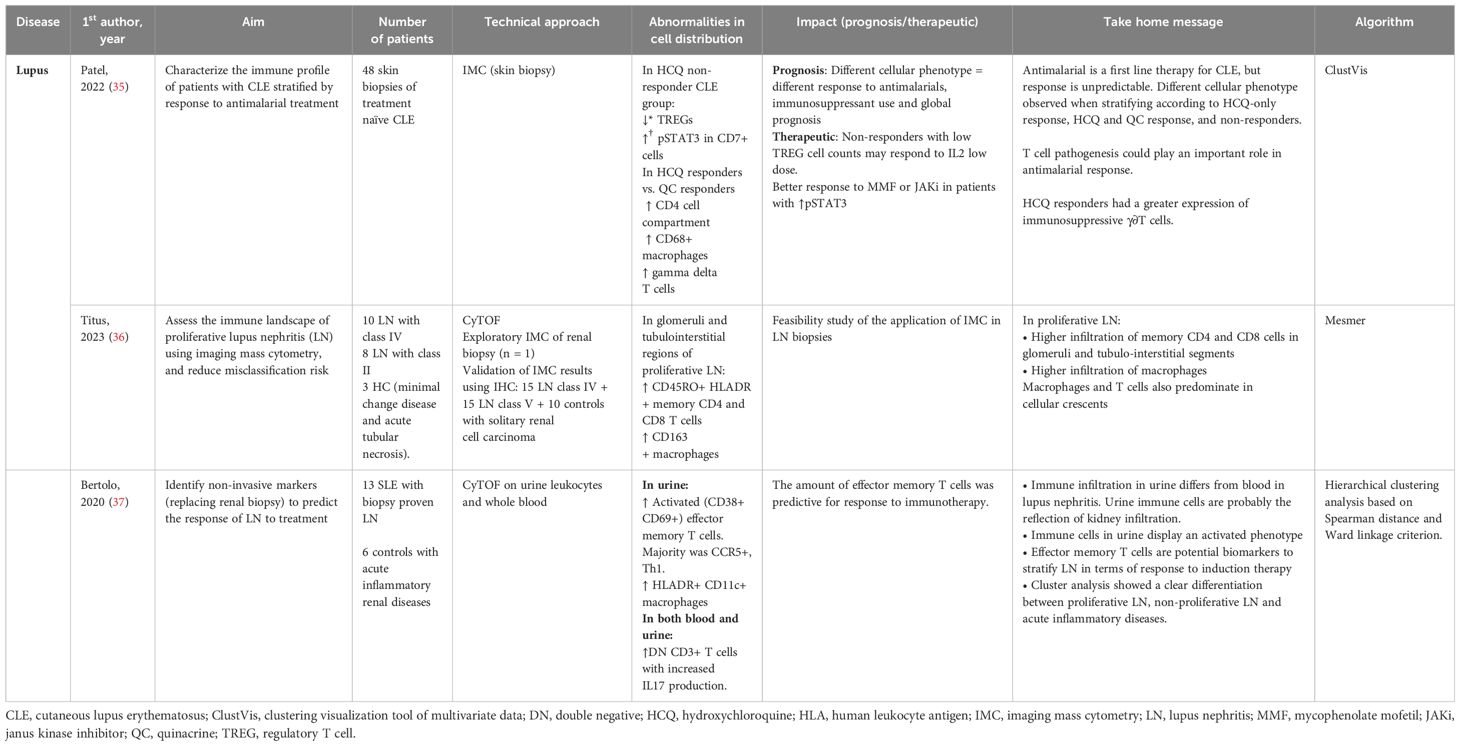
Table 3. Lupus tissue analyses.
Lupus nephritis (LN) can affect up to 50% of SLE patients and is associated with high comorbidity, and risk of chronic kidney disease. Kidney biopsy is an invasive procedure and remains the gold standard for LN diagnosis. Titus et al. studied renal biopsies of proliferative LN compared to acute tubular necrosis controls using IMC. The authors identified an infiltration by CD45RO+ HLADR+ memory CD4+ and CD8+ T cells, associated with CD163+ macrophages (36). Bertolo et al. (37) studied urinary leukocytes using mass cytometry to identify non-invasive biomarkers, and revealed a link between the amount of activated effector memory T cells (Tem) and LN response to immunotherapy (Figure 1C).
Despite new comprehensive autoantibody data with novel longitudinal clustering technique in SLE patients predictive of outcome, no integrative approach including immune ML analysis with mass cytometry has been performed to better predict long-term disease activity, organ involvement, treatment requirements and mortality risk.
Idiopathic inflammatory myositis (IIM)
IIM, also known as myositis, are a group of diverse auto-immune connective tissue diseases presenting with striated muscle inflammation and varying associated clinical manifestations, treatment response and prognosis. In an exploratory analysis, Patel et al. (38) compared dermatomyositis (DM) skin biopsies to healthy controls. The analysis revealed an increased pro-inflammatory infiltrate made of CD14+ CD16+ macrophages, CD11c+ myeloid dendritic cells (mDCs), CD4+ and CD8+ T cells, and CCR7+ CD45RA- memory T cells (Figure 1D).
Different subsets of IIM can exhibit very similar clinical presentations. Anti-synthetase syndrome (ASyS) and dermatomyositis (DM) are two entities of IIM which can present with very similar skin lesions, potentially complicating the diagnosis process. In a following analysis, Patel et al. (39)· compared DM-like skin lesions in ASyS patients to skin biopsy samples obtained from DM patients using IMC (Table 4). Both DM and ASyS immune infiltrates presented with many overlapping features, but also some disease specific differences. Notably, the authors found a higher infiltration of myeloid cells associated with DM and a higher proportion of macrophages presenting with phosphorylated stimulators of interferon genes (pSTING+) in ASyS patients, with an elevated production of IFNß, TNF, and IL17. An innate immune signature was also unveiled when comparing JDM (juvenile dermatomyositis) skin biopsies to cutaneous lupus, (CLE), with an elevated expression of CD68+ and CD14+ macrophages. IMC analysis also revealed increased cell-cell interactions involving endothelial cells, highlighting the vascular pathology involved in the physiopathology of DM (40). Another study performed on JDM revealed a defect in PLCγ2 phosphorylation, resulting in NK cells dysfunction resulting in decreased cell cytotoxicity and correlating to disease activity (41).
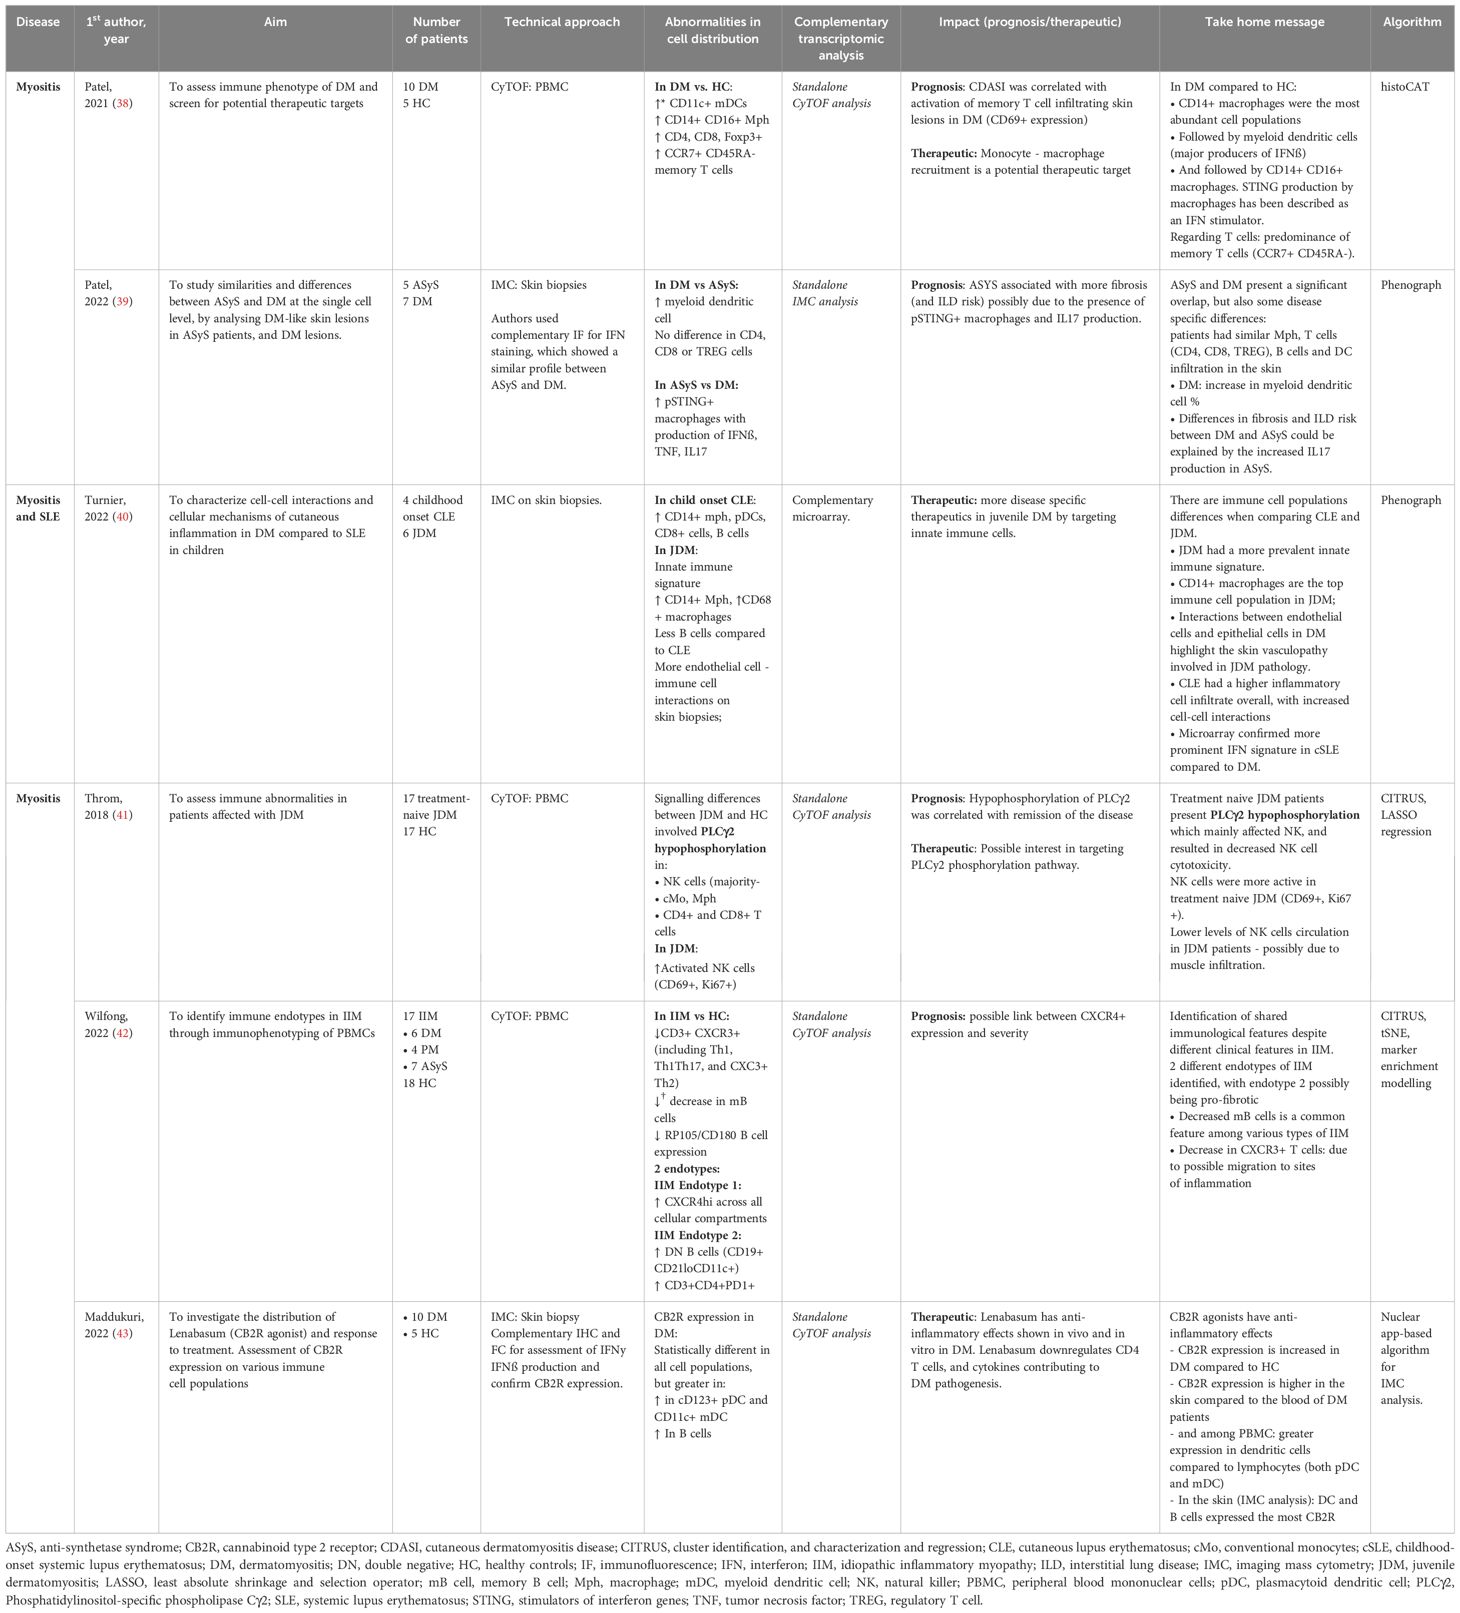
Table 4. Mass cytometry in inflammatory idiopathic myositis.
PBMC analysis performed by Wilfong et al. (42) on blood samples obtained from IIM patients revealed distinct endotypes characterized by different immune cell populations. A particular endotype was rich in DN2 B cells, which were associated with anti-RNP antibody positivity and could hint a pro-fibrotic phenotype.
Systemic treatments in DM, especially in the case of antimalarial resistance, present with numerous side effects. Lenabasum, a non-immunosuppressive cannabinoid type 2 receptor (CB2R) reverse agonist with no psychoactive effect, is currently being investigated as an alternative. IMC has shown a higher CB2R expression in the skin of DM patients, more specifically among DC and B cells, making them a potential target for the drug with sufficient cutaneous tropism (43).
Systemic vasculitis and inflammatory diseases
Systemic inflammatory diseases and vasculitis are also associated with sustained and chronic inflammation. Mass cytometry findings have helped identify cellular signature in the blood, bronchoalveolar fluid and tissue analysis (Table 5 and Figure 2).
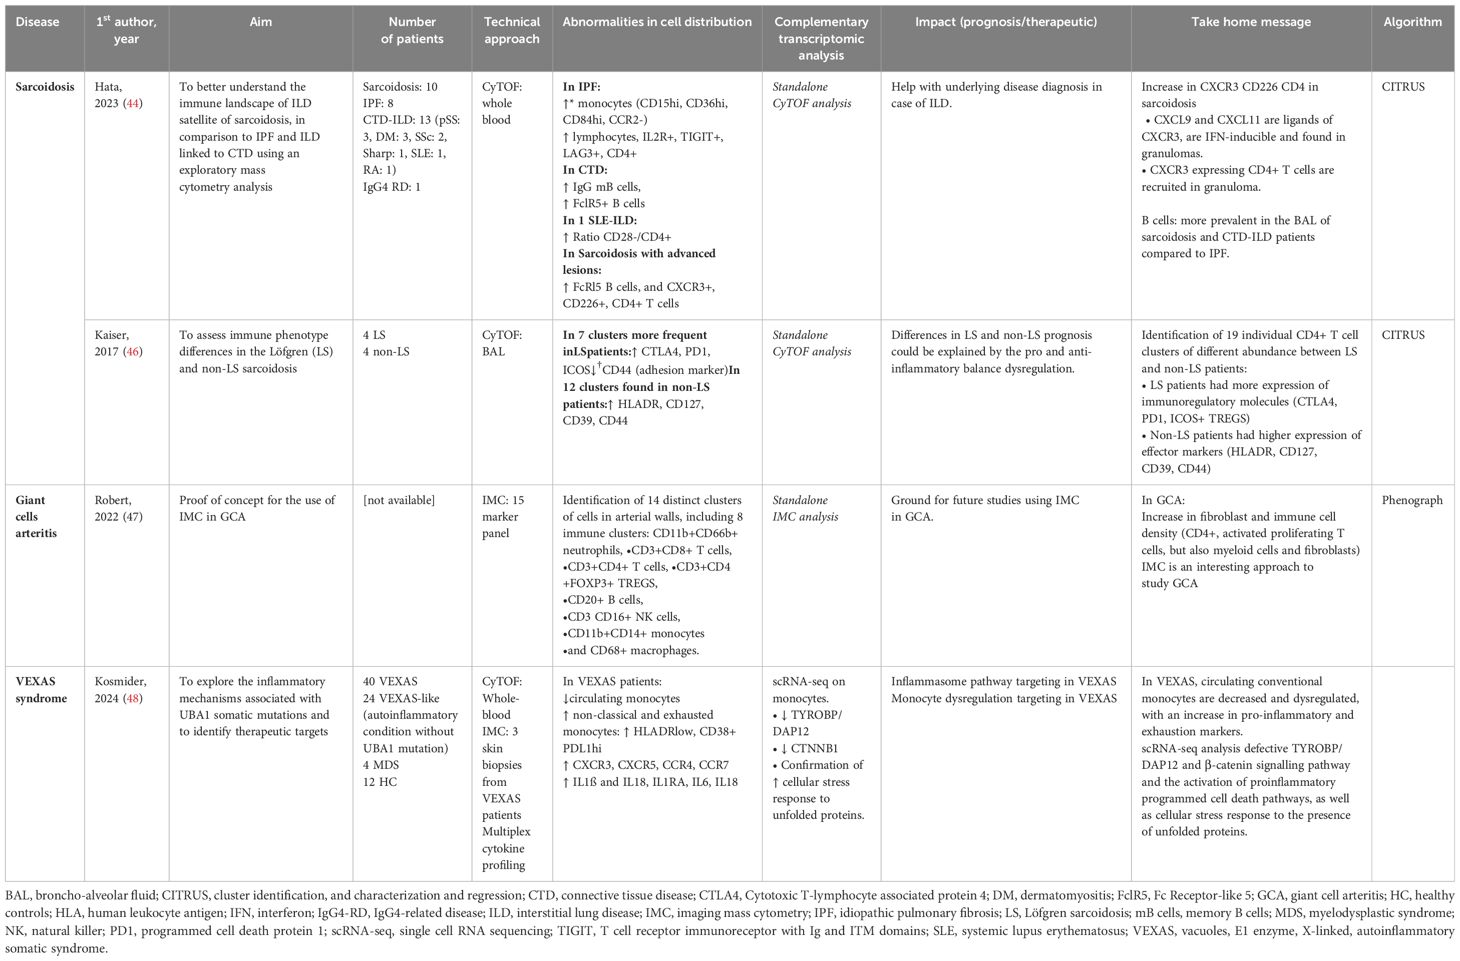
Table 5. Mass cytometry in systemic inflammatory diseases.
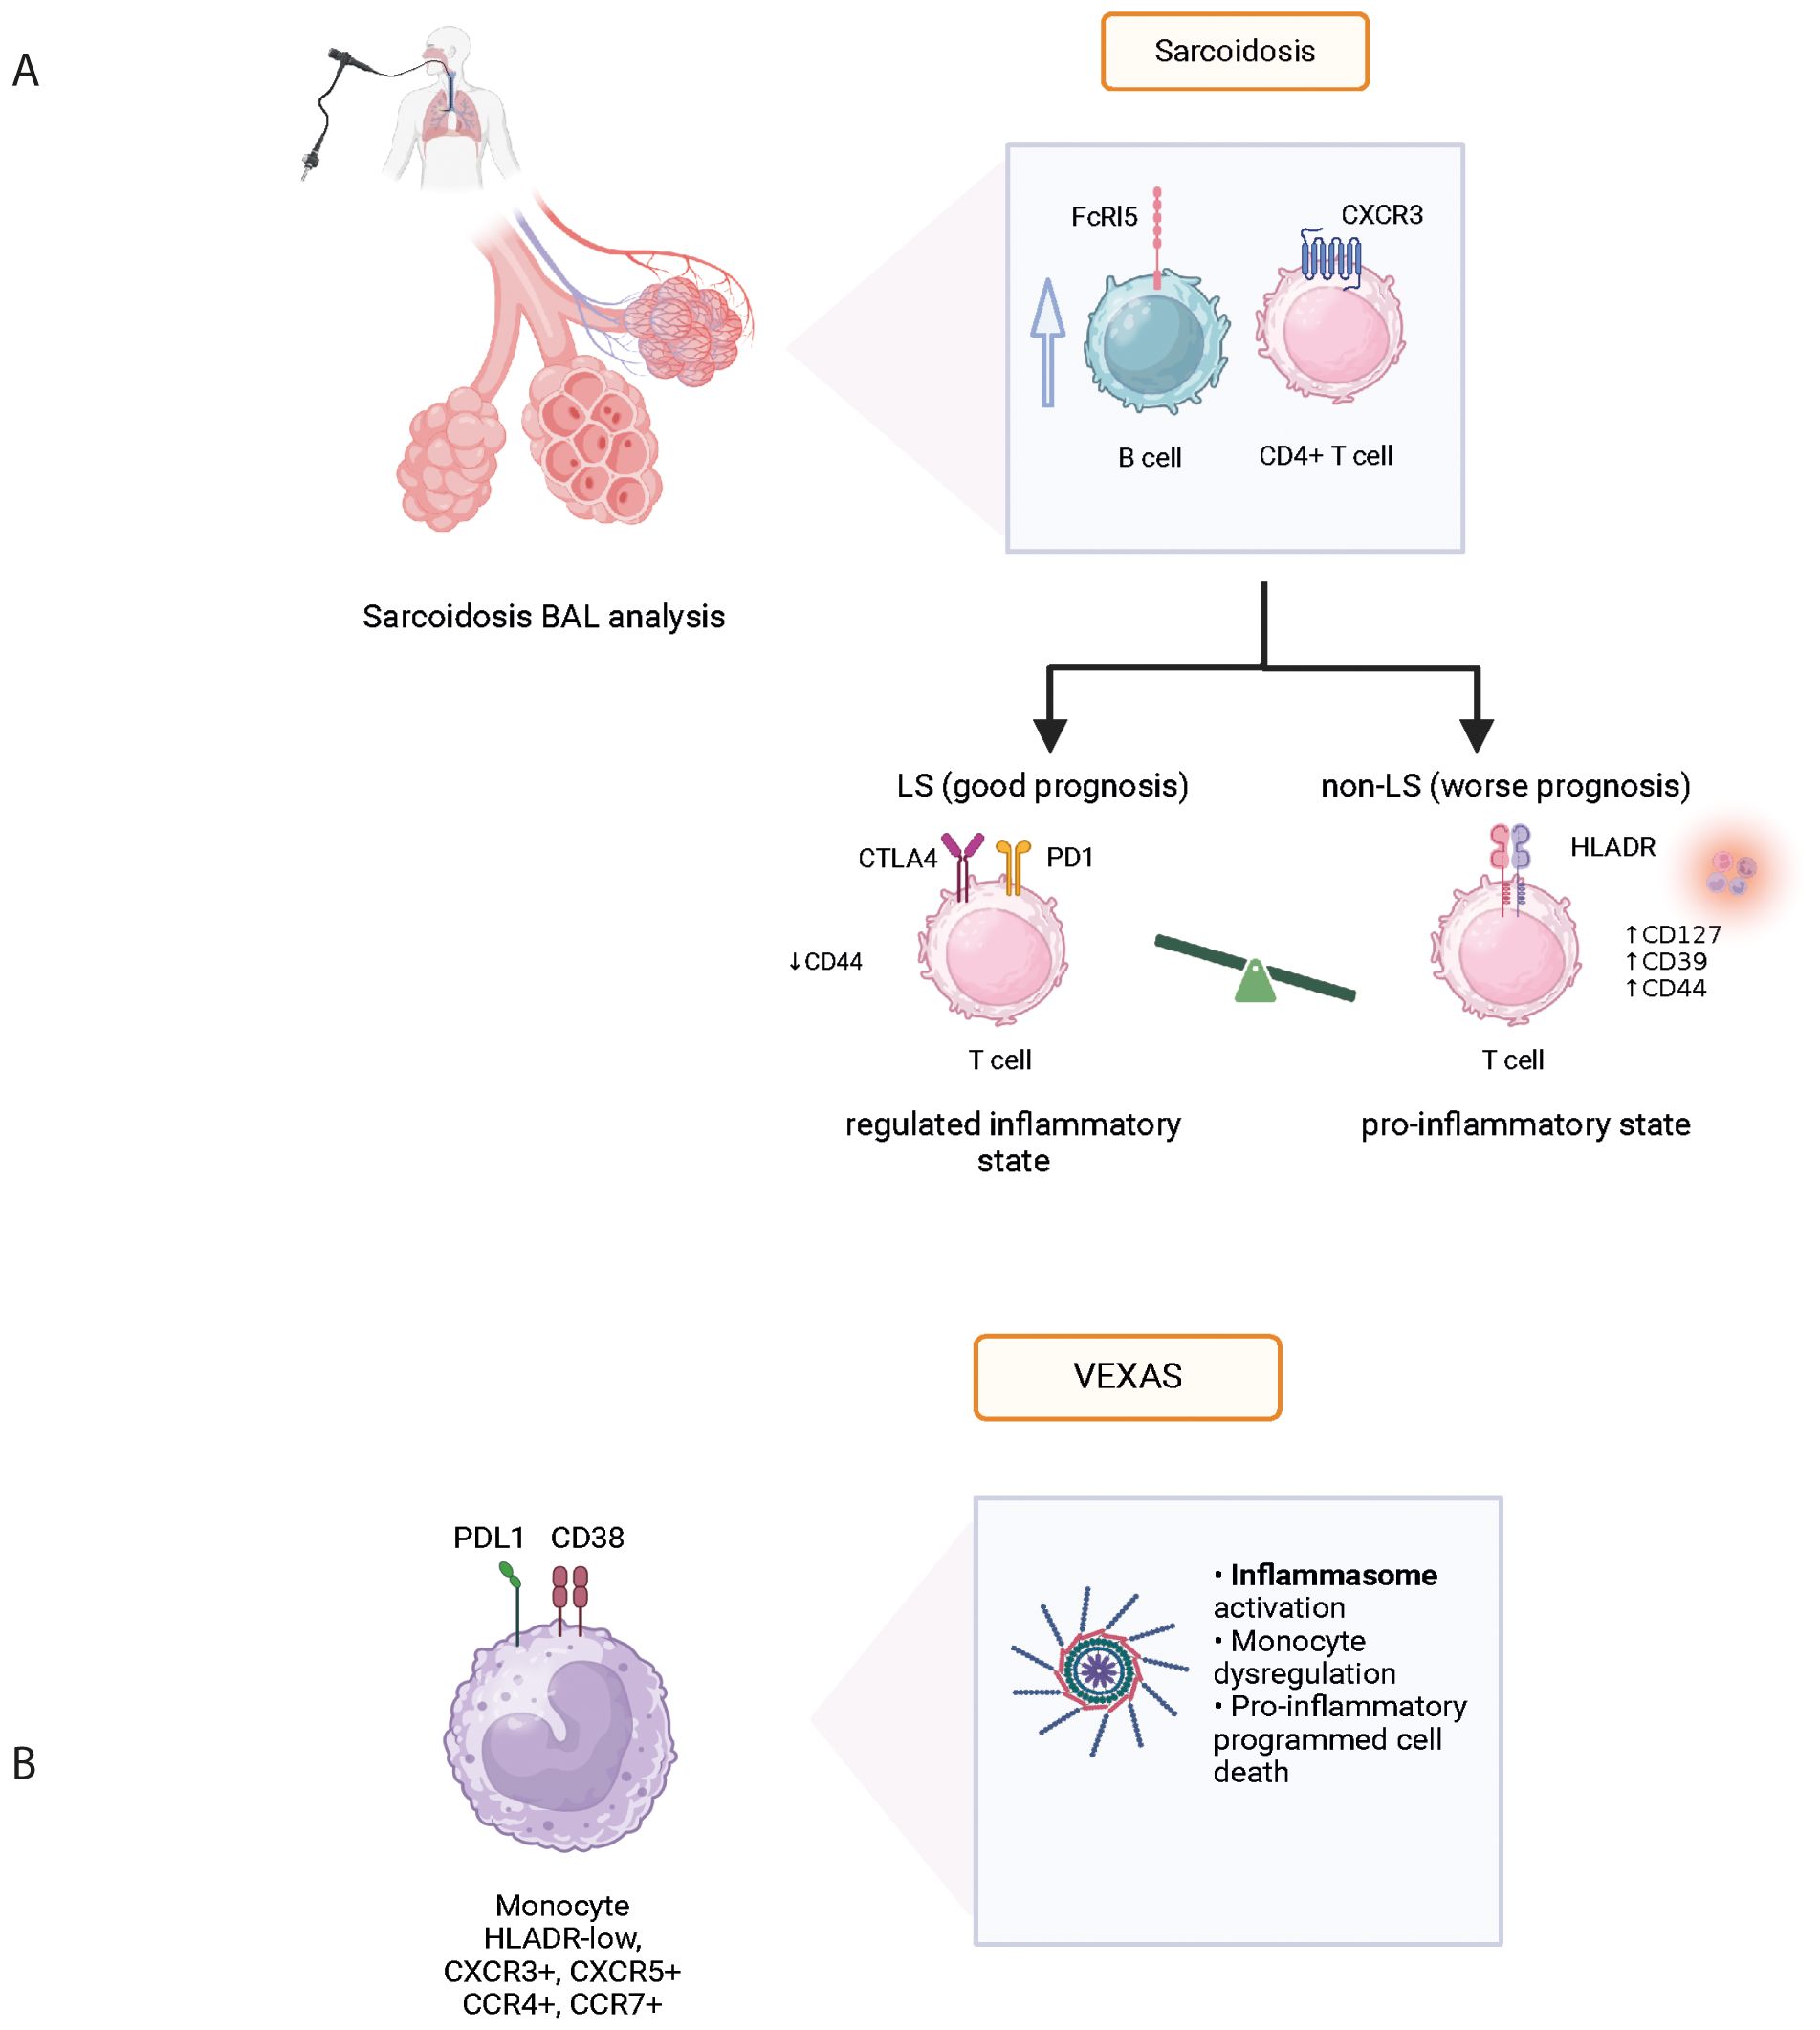
Figure 2. Physiopathological data acquired from mass cytometry in various systemic autoinflammatory diseases: Sarcoidosis (A) and VEXAS (B). BAL, bronchoalveolar lavage; FcRl5, Fc Receptor-like 5; CXCR3, C-X-C chemokine receptor 3; CTLA4, cytotoxic T-lymphocyte associated protein 4; VEXAS, vacuoles, E1 enzyme, X-linked, auto-inflammatory, somatic syndrome.
Sarcoidosis
Sarcoidosis is an inflammatory disease of unknown etiology associated with granuloma formation and multi-organ manifestations. Using mass cytometry analysis of immune cell subsets in bronchoalveolar lavage fluid (BALF), the analysis of T and B cells revealed increased levels of CXCR3+ CD226+ CD4+ T cells and the presence of FCRL5+ B cells in sarcoidosis patients with advanced lung lesions (Figure 2A). Comparison with idiopathic pulmonary fibrosis (IPF) and connective tissue disease associated interstitial lung disease (ILD) confirmed this activation profile to be unique (44). Interestingly however, despite different histopathological presentations between sarcoidosis and pulmonary tuberculosis, authors found no significantly different gene expression profile when performing spatial transcriptomic analysis of the lung granuloma from patients presenting these conditions (45). Although pulmonary manifestations are very common in sarcoidosis and often contribute to comorbidity, disease phenotype can differ greatly between individuals. Löfgren syndrome (LS) stands out with a notably favorable prognosis and distinct clinical presentation including erythema nodosum and/or ankle arthritis. In their study, Kaiser et al. (46) performed mass cytometry on BALF which revealed a higher expression of anti-inflammatory molecules CTLA-4, PD1, and ICOS-mediated TREG activation in LS compared to other forms of sarcoidosis (Table 5). This finding provides insights into the varying prognosis observed between LS and non-LS forms of sarcoidosis.
Large vessel vasculitis (LVV)
Using highly multiplexed imaging mass cytometry, a comprehensive analysis of cell lineages involved in giant cell arteritis (GCA) pathogenesis has been performed (47). They show an in-situ signature in GCA identified by unbiased cell clustering (Table 5). A hierarchical clustering based on cell type abundance analysis identified two distinct cluster communities in GCA patients: one made of lymphocytes, neutrophils and endothelial cells, and one made of myeloid cells, vascular smooth muscle cells, pericytes, fibroblasts and myofibroblasts. A link with clinical presentation and therapeutic response has yet to be established.
VEXAS syndrome
VEXAS (Vacuole, E1 enzyme, X-linked, autoinflammatory, somatic) syndrome has been associated with various clinical manifestations including fever, neutrophilic cutaneous lesions, arthralgias, pulmonary inflammation, chondritis, and vasculitis. These manifestations are related to the recruitment and accumulation of inflammatory and innate immune cells in targeted tissues. In a recent prospective cohort of VEXAS patients, Kosmider et al. used an integrative approach based on clinical and biological data, in-depth phenotypical analysis of whole blood immune cells, cytokine profiling, single-cell RNA sequencing, and tissue imaging by mass cytometry on skin biopsies, to explore the inflammatory mechanisms associated with UBA1 somatic mutations in VEXAS patients and to identify therapeutic targets (48). Dimensionality reduction analysis revealed significant differences in the repartition of monocyte subsets in VEXAS patients with a decrease in circulating monocytes, primarily involving intermediate (CD14+ CD16+) and nonclassical (CD14lo CD16+) monocytes, but with high expression of CXCR3, CXCR5, CCR4 and CCR7 (Figure 2B). Using an integrative approach with complementary scRNA-seq, the authors were able to identify molecular pathways involved in monocyte dysregulation at the single cell level including TYROBP/DAP12, a pathway involved in myeloid cell function, and CTNNB1, involved in cellular homeostasis. In addition, the authors used a combination of markers in IMC to determine the anatomical localization of inflammatory cells within target tissues from VEXAS patients. They demonstrated that CD16+ CD163+ monocytes and proinflammatory M1 macrophages were abundantly present in skin lesions, expressing granzyme B which could be associated with pathogenicity in macrophage functions (Table 5). These results demonstrate that UBA1-mutated inflammatory monocytes aberrantly expressing chemokine receptors could be attracted into target tissues and promote local inflammation, contributing to the clinical presentation.
Discussion
Auto-immune and inflammatory diseases are extremely complex in nature and involve a high number of actors of the immune system. Most of the CyTOF analyses mentioned in this review were exploratory in nature, derived from studies conducted on highly selected populations with limited sample sizes. Conventional flow cytometry, despite its limitations, has provided great pathophysiological insights regarding the mentioned pathologies. However, the high dimensionality of mass cytometry provides better coverage of immune population dynamics, with sufficient power to identify rare cell types compared to flow cytometry. Though the results of the studies mentioned throughout this review are purely descriptive and have yet to translate into real-life practice, CyTOF has the power to help to identify therapeutic targets, as well as cell populations associated with refractory status as well as prognostic factors. In combination with other high throughput -omic strategies, CyTOF has the potential to help stratify future trials with the administration of targeted treatments based on immune cell phenotype. Early discrimination of patients likely to respond well to a given therapeutic option from patients unlikely to benefit, could contribute to more personalized and tailored therapeutic schemes.
CyTOF characteristics
CyTOF is a recently introduced high-dimensional technology which enables the use of a high number of markers, due to the absence of overlap and autofluorescence. The volume of data generated by the analysis of marker expression in millions of cells can increase significantly; however, within the realm of mass cytometry, the array of markers remains finite, typically capped at a maximum of 50. While data analysis is based on an unsupervised approach, there is always a need for scientists to develop a CyTOF panel based on their initial hypotheses on which cellular actors are implicated in the different physiological processes. Such hypotheses often stem from previously reported literature based on lower dimensional technologies, such as conventional flow cytometry. CyTOF analysis, even when performed on small cohorts, generates a high amount of data, with interpretation requiring strong bioinformatics expertise. Required skills include data cleaning, normalization, dimensionality reduction, and statistical analysis as well as means to ensure data integrity and security. To handle such wealth of generated data with a robust workflow, a multidisciplinary team involving clinicians, biologists, and biostatisticians is often required. Moreover, available algorithms must be employed with care and distance, favoring the most appropriate modeling strategy associated with the least bias considering the experimental design.
CyTOF findings sometimes require confirmation using lower dimensional techniques such as flow cytometry on validation cohorts. CyTOF differs from conventional flow cytometry, mainly due to its destructive nature: after nebulization and cell atomization, cells cannot be sorted for further analysis, thus limiting their use for direct complementary explorations. There is a great interest however, in combining CyTOF with other omics technologies in the context of autoimmune diseases, in a multiscale approach to cell biology entitled “Systems Immunology” with great granularity.
CyTOF analysis can be performed on whole blood samples, PBMCs, biological fluids (including saliva, bronchial alveolar fluid, and urine), suspension of cells obtained from tissues, and whole tissue biopsies. Performing CyTOF on non-blood samples presents with a few challenges, including the smaller number of cells available due to a lower concentration and a lower sample volume, as well as the varying difficulty to access such samples. Moreover, the analysis requires fluid- or tissue-specific protocols designed to ensure the elimination of cellular debris (often abundant in broncho-alveolar mucus for instance), while ensuring the preservation of rare cell populations.
CyTOF and single-cell transcriptomics
Mass cytometry has emerged as a key tool to profile multiple parameters of the immune system and allows the identification, quantification, and phenotypical characterization of a wide range of immune cell subsets simultaneously. Mass cytometry also has the potential to help assess cellular response to immunotherapy in the context of autoimmune diseases. B-cell depleting therapies have been extensively used and studied in the context of systemic diseases, however several patients do not respond well and drug-free remission is rarely observed residual disease is frequent. More recently, CAR-T cells have been studied in refractory SLE patients. CyTOF studies in the context of this novel treatment have the potential assess the cytotoxicity and cytokine release following CAR-T cell therapy.
Other -omic strategies, including genomics and transcriptomics, have led to a better understanding of the genotype and phenotype of cells. The primary difference compared to CyTOF is the lack of accounting for post-translational changes in proteins at the cellular level, including phosphorylation, which are often a better representation of changes in the context of biological function. Proteins are also often the therapeutic targets of treatment. ScRNA-seq, a technique not restricted to a 40-markers predetermined panel, represents a more unbiased approach thus allowing for a broad range of cellular populations. The two single cell approaches were directly compared in a study performed to study the tumor microenvironment of gastric cancer (49). In this study, CyTOF displayed better performance for clear identification of distinct cell subsets whereas scRNA-seq detected cellular populations not included in the CyTOF panel. The complementarity of these two approaches had potential to better assess the tumor microenvironment of gastric cancer. In another study, performed on synovial cells obtained from rheumatoid arthritis patients, the authors first performed a scRNA-seq analysis on previously sorted fibroblasts, monocytes, B and T cells, leading to the identification of 16 scRNA-seq clusters (50). In a unified approach, they then performed CyTOF which identified 32 clusters, all related to the previously described scRNA-seq clusters, indicative of additional heterogeneity, better assessed with protein levels expression. Additionally, when stratifying patients depending on the level of synovial leukocyte infiltration (leukocyte-rich vs. leukocyte-poor), the significantly differentially abundant clusters were the ones assessed using CyTOF and thus linked to protein expression. We represent the respective limitations and advantages of single cell RNAseq and CyTOF in Figure 3. While scRNA-seq enables the assessment of thousands of genes with the possibility of performing whole transcriptome analysis, it is at the cost of sparse data. Mass cytometry measures the expression of 40 pre-selected markers on hundreds of thousands of cells, an approach which does not allow the identification of cell populations not included within the panel.
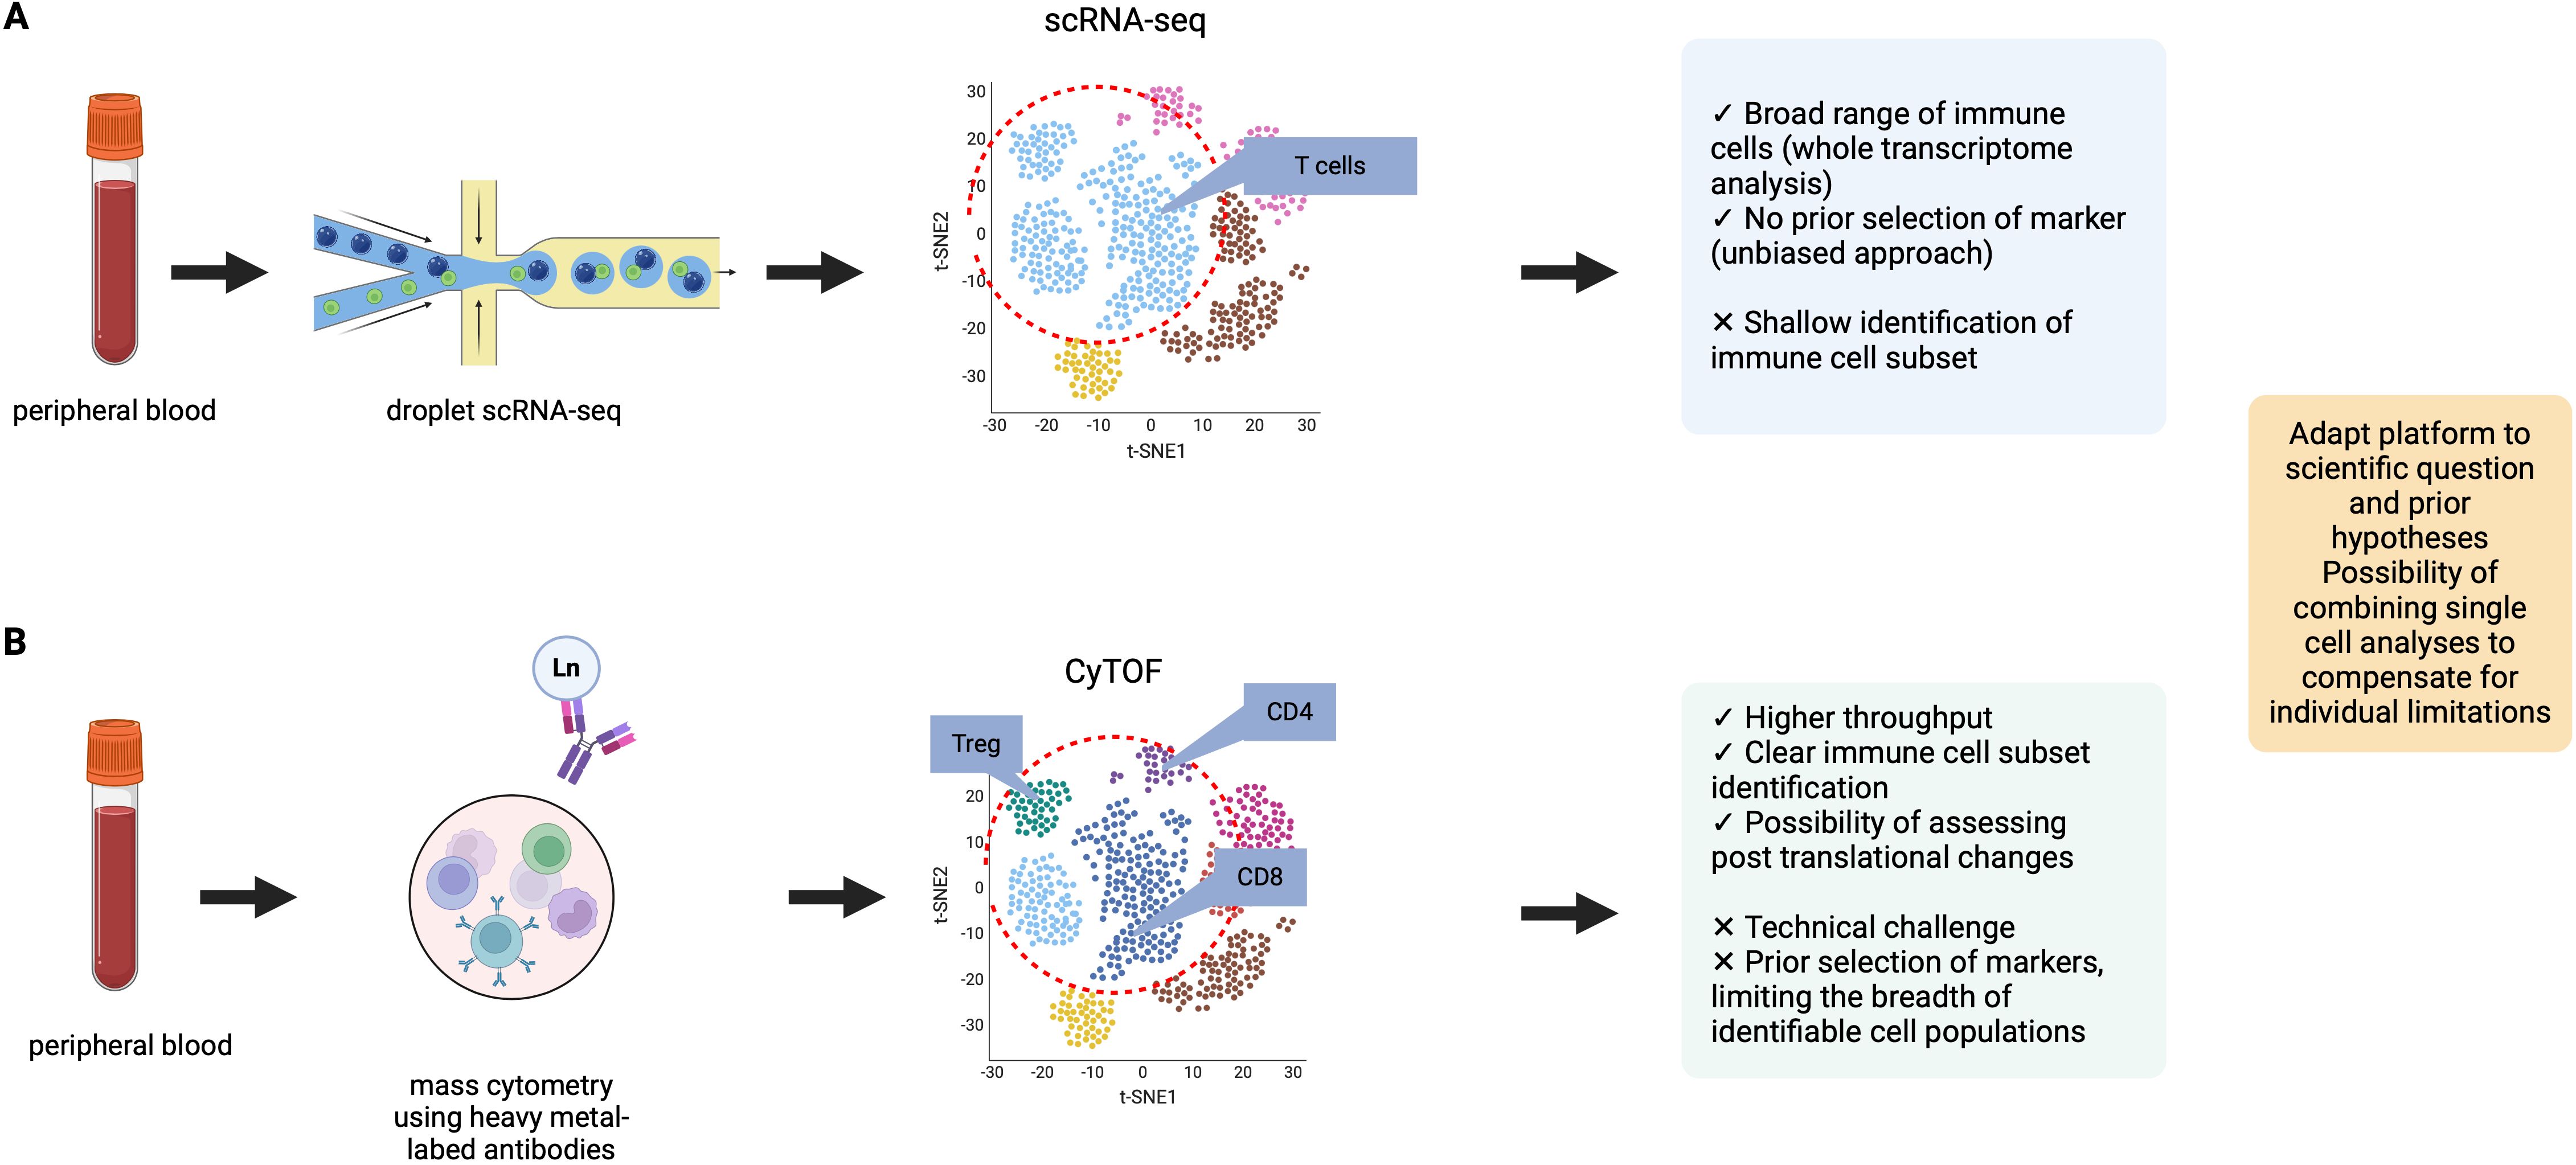
Figure 3. Comparison of two single-cell analysis modalities: CyTOF and scRNA-seq. Data were adapted from Kashima et al. (49) (A) Representation of data obtained from droplet scRNA-seq. scRNA-seq allows for the analysis of a broad range of immune cell populations, in an unbiased approach with no required panel design. (B) Representation of data obtained from mass cytometry analysis. Mass cytometry can perform analysis at the protein level, with clear immune cell population identification (for example: clear definition of T cell subsets). In the example provided, the t-SNE representation of CyTOF data shows more heterogeneity in cell cluster identification. Advantages and limitations of both single-cell approaches are presented.
Combining single-cell data obtained at the transcriptome level, and cellular protein expression level using mass cytometry has the potential to help overcome limitations linked to each individual approach. A systems approach to immunological biology, combining the multiscale study of the immune phenotypes in various diseases using multiple -omic technologies while addressing their respective limitations, could enhance our understanding of biological processes in the context of autoimmune and autoinflammatory systemic diseases.
Single-cell spatial multi-omics
Comparative tissue analysis using imaging mass cytometry are a valuable tool for gaining a better understanding of the physiopathology of auto-immune diseases, including immune cell infiltration and tissue-specific signaling. The existence of a gradient between blood and tissue infiltration of immune cells can be an exploratory evidence of cell migration. Such findings can be validated using more widely available techniques such as immunohistochemistry on a selected number of markers.
Spatial transcriptomics, in contrast, enables transcriptome-wide profiling from tissue sections. While resolution recent technological advances have significantly improved spatial resolution (51), most platforms remain at a “supra-cellular” resolution ranging from 40 – 100 µm (52), compared to the subcellular resolution of IMC (53). IMC provides an understanding of the heterogeneity of protein expression among different cell subsets, with the ability to study post-translational and -transcriptional modifications under specific pathological conditions while retaining spatial information. This makes IMC invaluable for functional protein analyses using pre-established antibody panels. IMC has helped to contribute uniquely to the understanding of immune disease, especially to establish the impact of spatial interactions with the possibility of studying in detail target-organs. In the context of CLE, Patel et al. were able to assess cell-cell interactions and avoidances using neighborhood analysis (35). The presence of these cellular interactions had direct clinical impact, as within patients who did not respond to hydroxychloroquine, γ∂ T cells did not interact with CD8+ T cells, interacted less with CD4+ T cells and cDCs, but displayed an increased interaction with CD14+CD16+ macrophages and endothelium, indicating infiltration.
Spatial transcriptomics provides significantly broader information due to its ability to generate genome-wide transcriptomic data. This unbiased approach is unrestricted by pre-defined ~40-antigen panels, making it well-suited for exploratory analyses and the identification of novel biomarkers. In a recent IMC study performed the skin lesions of SSc patients, authors identified additional subpopulations of fibroblasts with altered proportion in SSc skin compared to previous reports in the literature, including Thy1+; ADAM12high; PU.1high fibroblasts, ADAM12+;GLI1+ fibroblasts and TFAMhigh fibroblasts (54). While these specific fibroblast subsets were previously unreported, a previous spatial transcriptomic study had revealed the compartmentalization of fibrotic processes in the skin of SSc patients, as well as the underlying involvement of the Hippo gene pathway in pro-fibrotic myofibroblast differentiation, and endothelial to mesenchymal differentiation (55).
While IMC requires time-consuming data acquisition and analyzes fewer cells per sample, spatial transcriptomics processes larger areas of tissue and profiles a higher number of cells per section. Ultimately, these complementary technologies cater to distinct research goals: IMC for detailed protein phenotypic studies and spatial transcriptomics for high-throughput transcriptomic exploration. IMC and spatial transcriptomics can work synergistically to provide complimentary insights on cell phenotype at the protein and the mRNA level respectively.
Conclusion
The identification of biomarkers able to stratify patients into clinically relevant groups is a major research interest in autoimmune and inflammatory diseases. Future studies could include mass cytometry findings, combined to other omic strategies, to stratify patients in therapeutic trials to provide advancements in personalized therapies in the field of auto-immune and inflammatory diseases. Moreover, CyTOF brings the opportunity to explore refractory status in systemic diseases, thus offering the opportunity for precision medicine. One obstacle limiting the widespread adoption of CyTOF is its high associated cost, though decreasing time and expense needed to generate datasets have helped create both exciting opportunities and great challenges for scientists.
Author contributions
AK: Conceptualization, Investigation, Methodology, Project administration, Writing – original draft, Writing – review & editing. MC: Writing – review & editing. DS: Writing – review & editing. JC: Writing – review & editing. SM: Writing – review & editing. BC: Writing – review & editing. FA: Writing – review & editing. BT: Writing – review & editing. TP: Conceptualization, Methodology, Writing – review & editing. CC: Conceptualization, Methodology, Writing – review & editing.
Funding
The author(s) declare that financial support was received for the research, authorship, and/or publication of this article. AK was supported by a grant from Société Nationale Française de Médecine Interne (2023). JC was supported by grant from Société Nationale Française de Médecine Interne (2022) and grant from Groupe Pasteur Mutualité (Villa M).
Acknowledgments
Figures were created using www.biorender.com.
Conflict of interest
The authors declare that the research was conducted in the absence of any commercial or financial relationships that could be construed as a potential conflict of interest.
Generative AI statement
The author(s) declare that no Generative AI was used in the creation of this manuscript.
Publisher’s note
All claims expressed in this article are solely those of the authors and do not necessarily represent those of their affiliated organizations, or those of the publisher, the editors and the reviewers. Any product that may be evaluated in this article, or claim that may be made by its manufacturer, is not guaranteed or endorsed by the publisher.
References
1. Hulspas R, O’Gorman MRG, Wood BL, Gratama JW, Sutherland DR. Considerations for the control of background fluorescence in clinical flow cytometry. Cytometry Part B Clin. (2009) 76B:355−64. doi: 10.1002/cyto.b.v76b:6
2. Spitzer MH, Nolan GP. Mass cytometry: single cells, many features. Cell. (2016) 165:780−91. doi: 10.1016/j.cell.2016.04.019
3. Baharlou H, Canete NP, Cunningham AL, Harman AN, Patrick E. Mass cytometry imaging for the study of human diseases—Applications and data analysis strategies. Front Immunol 14 nov. (2019) 10:2657. doi: 10.3389/fimmu.2019.02657
4. Nair N, Mei HE, Chen SY, Hale M, Nolan GP, Maecker HT, et al. Mass cytometry as a platform for the discovery of cellular biomarkers to guide effective rheumatic disease therapy. Arthritis Res Ther. (2015) 17:127. doi: 10.1186/s13075-015-0644-z
5. Jackson HW, Fischer JR, Zanotelli VRT, Ali HR, Mechera R, Soysal SD, et al. The single-cell pathology landscape of breast cancer. Nature. (2020) 578:615−20. doi: 10.1038/s41586-019-1876-x
6. Qiu P, Simonds EF, Bendall SC, Gibbs KD, Bruggner RV, Linderman MD, et al. Extracting a cellular hierarchy from high-dimensional cytometry data with SPADE. Nat Biotechnol. (2011) 29:886−91. doi: 10.1038/nbt.1991
7. Van Gassen S, Callebaut B, Van Helden MJ, Lambrecht BN, Demeester P, Dhaene T, et al. FlowSOM: Using self-organizing maps for visualization and interpretation of cytometry data. Cytometry Part A. (2015) 87:636−45. doi: 10.1002/cyto.a.22625
8. Chester C, Maecker HT. Algorithmic tools for mining high-dimensional cytometry data. J Immunol. (2015) 195:773−9. doi: 10.4049/jimmunol.1500633
9. Kimball AK, Oko LM, Bullock BL, Nemenoff RA, van Dyk LF, Clambey ET. A beginner’s guide to analyzing and visualizing mass cytometry data. J Immunol. (2018) 200:3−22. doi: 10.4049/jimmunol.1701494
10. Greenwald NF, Miller G, Moen E, Kong A, Kagel A, Dougherty T, et al. Whole-cell segmentation of tissue images with human-level performance using large-scale data annotation and deep learning. Nat Biotechnol. (2022) 40:555−65. doi: 10.1038/s41587-021-01094-0
11. McCoy SS, Woodham M, Bartels CM, Saldanha IJ, Bunya VY, Maerz N, et al. Symptom-based cluster analysis categorizes sjögren’s disease subtypes: an international cohort study highlighting disease severity and treatment discordance. Arthritis Rheumatol. (2022) 74:1569−79. doi: 10.1002/art.42238
12. Tarn JR, Howard-Tripp N, Lendrem DW, Mariette X, Saraux A, Devauchelle-Pensec V, et al. Symptom-based stratification of patients with primary Sjögren’s syndrome: multi-dimensional characterisation of international observational cohorts and reanalyses of randomised clinical trials. Lancet Rheumatol. (2019) 1:e85−94. doi: 10.1016/S2665-9913(19)30042-6
13. Danieli MG, Brunetto S, Gammeri L, Palmeri D, Claudi I, Shoenfeld Y, et al. Machine learning application in autoimmune diseases: State of art and future prospectives. Autoimmun Rev. (2023) 23:103496. doi: 10.1016/j.autrev.2023.103496
14. Nguyen Y, Nocturne G, Henry J, Ng WF, Belkhir R, Desmoulins F, et al. Identification of distinct subgroups of Sjögren’s disease by cluster analysis based on clinical and biological manifestations: data from the cross-sectional Paris-Saclay and the prospective ASSESS cohorts. Lancet Rheumatol. (2024) 6(4):e216–25. doi: 10.1016/S2665-9913(23)00340-5
15. Mingueneau M, Boudaoud S, Haskett S, Reynolds TL, Nocturne G, Norton E, et al. Cytometry by time-of-flight immunophenotyping identifies a blood Sjögren’s signature correlating with disease activity and glandular inflammation. J Allergy Clin Immunol. (2016) 137:1809–1821.e12. doi: 10.1016/j.jaci.2016.01.024
16. Sarkar I, Davies R, Aarebrot AK, Solberg SM, Petrovic A, Joshi AM, et al. Aberrant signaling of immune cells in Sjögren’s syndrome patient subgroups upon interferon stimulation. Front Immunol. (2022) 13:854183. doi: 10.3389/fimmu.2022.854183
17. Katsifis GE, Rekka S, Moutsopoulos NM, Pillemer S, Wahl SM. Systemic and local interleukin-17 and linked cytokines associated with sjögren’s syndrome immunopathogenesis. Am J Pathol. (2009) 175:1167−77. doi: 10.2353/ajpath.2009.090319
18. Desvaux E, Hemon P, Soret P, Le Dantec C, Chatzis L, Cornec D, et al. High-content multimodal analysis supports the IL-7/IL-7 receptor axis as a relevant therapeutic target in primary Sjögren’s syndrome. J Autoimmun. (2023) 149:103147. doi: 10.2139/ssrn.4478197
19. van der Kroef M, van den Hoogen LL, Mertens JS, Blokland SLM, Haskett S, Devaprasad A, et al. Cytometry by time of flight identifies distinct signatures in patients with systemic sclerosis, systemic lupus erythematosus and Sjögrens syndrome. Eur J Immunol. (2020) 50:119−29. doi: 10.1002/eji.201948129
20. Paleja B, Low AHL, Kumar P, Saidin S, Lajam A, Nur Hazirah S, et al. Systemic sclerosis perturbs the architecture of the immunome. Front Immunol. (2020) 11:1602. doi: 10.3389/fimmu.2020.01602
21. Wilfong EM, Vowell KN, Bunn KE, Rizzi E, Annapureddy N, Dudenhofer RB, et al. CD19 + CD21lo/neg cells are increased in systemic sclerosis-associated interstitial lung disease. Clin Exp Med. (2022) 22:209−20. doi: 10.1007/s10238-021-00745-5
22. Sasaki T, Bracero S, Keegan J, Chen L, Cao Y, Stevens E, et al. Longitudinal immune cell profiling in patients with early systemic lupus erythematosus. Arthritis Rheumatol. (2022) 74:1808−21. doi: 10.1002/art.v74.11
23. Horisberger A, Humbel M, Fluder N, Bellanger F, Fenwick C, Ribi C, et al. Measurement of circulating CD21–CD27– B lymphocytes in SLE patients is associated with disease activity independently of conventional serological biomarkers. Sci Rep. (2022) 12:9189. doi: 10.1038/s41598-022-12775-4
24. Baxter RM, Wang CS, Garcia-Perez JE, Kong DS, Coleman BM, Larchenko V, et al. Expansion of extrafollicular B and T cell subsets in childhood-onset systemic lupus erythematosus. Front Immunol. (2023) 14:1208282. doi: 10.3389/fimmu.2023.1208282
25. Szelinski F, Stefanski AL, Schrezenmeier E, Rincon-Arevalo H, Wiedemann A, Reiter K, et al. Plasmablast-like phenotype among antigen-experienced CXCR5–CD19low B cells in systemic lupus erythematosus. Arthritis Rheumatol. (2022) 74:1556−68. doi: 10.1002/art.42157
26. Kajihara A, Morita T, Kato Y, Konaka H, Murakami T, Yamaguchi Y, et al. The proliferative activity levels of each immune cell population evaluated by mass cytometry are linked to the clinical phenotypes of systemic lupus erythematosus. Int Immunol. (2022) 35:27−41. doi: 10.1093/intimm/dxac042
27. Ramsköld D, Parodis I, Lakshmikanth T, Sippl N, Khademi M, Chen Y, et al. B cell alterations during BAFF inhibition with belimumab in SLE. EBioMedicine. (2019) 40:517−27. doi: 10.1016/j.ebiom.2018.12.035
28. Maeda S, Hashimoto H, Maeda T, Tamechika SY, Isogai S, Naniwa T, et al. High-dimensional analysis of T-cell profiling variations following belimumab treatment in systemic lupus erythematosus. Lupus Sci Med. (2023) 10:e000976. doi: 10.1136/lupus-2023-000976
29. O’Gorman WE, Hsieh EWY, Savig ES, Gherardini PF, Hernandez JD, Hansmann L, et al. Single-cell systems-level analysis of human Toll-like receptor activation defines a chemokine signature in patients with systemic lupus erythematosus. J Allergy Clin Immunol. (2015) 136:1326−36. doi: 10.1016/j.jaci.2015.04.008
30. O’Gorman WE, Kong DS, Balboni IM, Rudra P, Bolen CR, Ghosh D, et al. Mass cytometry identifies a distinct monocyte cytokine signature shared by clinically heterogeneous pediatric SLE patients. J Autoimmun. (2017) 81:74−89. doi: 10.1016/j.jaut.2017.03.010
31. Yiu G, Rasmussen TK, Tsai BL, Diep VK, Haddon DJ, Tsoi J, et al. High interferon signature leads to increased STAT1/3/5 phosphorylation in PBMCs from SLE patients by single cell mass cytometry. Front Immunol. (2022) 13:833636. doi: 10.3389/fimmu.2022.833636
32. Humbel M, Bellanger F, Horisberger A, Suffiotti M, Fluder N, Makhmutova M, et al. SLAMF receptor expression identifies an immune signature that characterizes systemic lupus erythematosus. Front Immunol. (2022) 13:843059. doi: 10.3389/fimmu.2022.843059
33. Humbel M, Bellanger F, Fluder N, Horisberger A, Suffiotti M, Fenwick C, et al. Restoration of NK cell cytotoxic function with elotuzumab and daratumumab promotes elimination of circulating plasma cells in patients with SLE. Front Immunol. (2021) 12:645478. doi: 10.3389/fimmu.2021.645478
34. Rincon-Arevalo H, Wiedemann A, Stefanski AL, Lettau M, Szelinski F, Fuchs S, et al. Deep phenotyping of CD11c+ B cells in systemic autoimmunity and controls. Front Immunol. (2021) 12:635615. doi: 10.3389/fimmu.2021.635615
35. Patel J, Vazquez T, Chin F, Keyes E, Yan D, Diaz D, et al. Multidimensional immune profiling of cutaneous lupus erythematosus in vivo stratified by patient response to antimalarials. Arthritis Rheumatol. (2022) 74:1687−98. doi: 10.1002/art.v74.10
36. Louis Sam Titus ASC, Tan Y, Tran P, Lindblom J, Ivbievbiokun M, Xu Y, et al. Molecular architecture of proliferative lupus nephritis as elucidated using 50-plex imaging mass cytometry proteomics. Clin Immunol. (2023) 254:109713. doi: 10.1016/j.clim.2023.109713
37. Bertolo M, Baumgart S, Durek P, Peddinghaus A, Mei H, Rose T, et al. Deep phenotyping of urinary leukocytes by mass cytometry reveals a leukocyte signature for early and non-invasive prediction of response to treatment in active lupus nephritis. Front Immunol 24 mars. (2020) 11:256. doi: 10.3389/fimmu.2020.00256
38. Patel J, Maddukuri S, Li Y, Bax C, Werth VP. Highly multiplexed mass cytometry identifies the immunophenotype in the skin of dermatomyositis. J Invest Dermatol. (2021) 141:2151−60. doi: 10.1016/j.jid.2021.02.748
39. Patel J, Ravishankar A, Maddukuri S, Vazquez T, Grinnell M, Werth VP. Identification of similarities between skin lesions in patients with antisynthetase syndrome and skin lesions in patients with dermatomyositis by highly multiplexed imaging mass cytometry. Arthritis Rheumatol. (2022) 74:882−91. doi: 10.1002/art.42050
40. Turnier JL, Yee CM, Madison JA, Rizvi SM, Berthier CC, Wen F, et al. Imaging mass cytometry reveals predominant innate immune signature and endothelial–immune cell interaction in juvenile myositis compared to lupus skin. Arthritis Rheumatol. (2022) 74:2024−31. doi: 10.1002/art.v74.12
41. Throm AA, Alinger JB, Pingel JT, Daugherty AL, Pachman LM, French AR. Dysregulated NK cell PLCγ2 signaling and activity in juvenile dermatomyositis. JCI Insight. (2018) 3:e123236. doi: 10.1172/jci.insight.123236
42. Wilfong EM, Bartkowiak T, Vowell KN, Westlake CS, Irish JM, Kendall PL, et al. High-dimensional analysis reveals distinct endotypes in patients with idiopathic inflammatory myopathies. Front Immunol. (2022) 13:756018. doi: 10.3389/fimmu.2022.756018
43. Maddukuri S, Patel J, Diaz DA, Chen KL, Wysocka M, Bax C, et al. Cannabinoid type 2 receptor (CB2R) distribution in dermatomyositis skin and peripheral blood mononuclear cells (PBMCs) and in vivo effects of LenabasumTM. Arthritis Res Ther. (2022) 24:12. doi: 10.1186/s13075-021-02665-x
44. Hata K, Yanagihara T, Matsubara K, Kunimura K, Suzuki K, Tsubouchi K, et al. Mass cytometry identifies characteristic immune cell subsets in bronchoalveolar lavage fluid from interstitial lung diseases. Front Immunol. (2023) 14:1145814. doi: 10.3389/fimmu.2023.1145814
45. Carow B, Muliadi V, Skålén K, Yokota C, Kathamuthu GR, Setiabudiawan TP, et al. Immune mapping of human tuberculosis and sarcoidosis lung granulomas. Front Immunol. (2024) 14:1332733. doi: 10.3389/fimmu.2023.1332733
46. Kaiser Y, Lakshmikanth T, Chen Y, Mikes J, Eklund A, Brodin P, et al. Mass cytometry identifies distinct lung CD4+ T cell patterns in löfgren’s syndrome and non-löfgren’s syndrome sarcoidosis. Front Immunol. (2017) 8:1130. doi: 10.3389/fimmu.2017.01130
47. Robert M, Chépeaux LA, Glasson Y, Dumé AS, Sannier A, Papo T, et al. Comprehensive analysis of cell lineages involved in giant cell arteritis pathogenesis using highly multiplexed imaging mass cytometry. Autoimmun Rev. (2023) 22:103216. doi: 10.1016/j.autrev.2022.103216
48. Kosmider O, Possémé C, Templé M, Corneau A, Carbone F, Duroyon E, et al. VEXAS syndrome is characterized by inflammasome activation and monocyte dysregulation. Nat Commun. (2024) 15:910. doi: 10.1038/s41467-024-44811-4
49. Kashima Y, Togashi Y, Fukuoka S, Kamada T, Irie T, Suzuki A, et al. Potentiality of multiple modalities for single-cell analyses to evaluate the tumor microenvironment in clinical specimens. Sci Rep 11 janv. (2021) 11:341. doi: 10.1038/s41598-020-79385-w
50. Accelerating Medicines Partnership Rheumatoid Arthritis and Systemic Lupus Erythematosus (AMP RA/SLE) Consortium, Zhang F, Wei K, Slowikowski K, Fonseka CY, Rao DA, et al. Defining inflammatory cell states in rheumatoid arthritis joint synovial tissues by integrating single-cell transcriptomics and mass cytometry. Nat Immunol. (2019) 20:928−42. doi: 10.1038/s41590-019-0378-1
51. Cho CS, Xi J, Si Y, Park SR, Hsu JE, Kim M, et al. Microscopic examination of spatial transcriptome using Seq-Scope. Cell. (2021) 184:3559–3572.e22. doi: 10.1016/j.cell.2021.05.010
52. Bergenstråhle J, Larsson L, Lundeberg J. Seamless integration of image and molecular analysis for spatial transcriptomics workflows. BMC Genomics. (2020) 21:482. doi: 10.1186/s12864-020-06832-3
53. Elaldi R, Hemon P, Petti L, Cosson E, Desrues B, Sudaka A, et al. High dimensional imaging mass cytometry panel to visualize the tumor immune microenvironment contexture. Front Immunol 16 avr. (2021) 12:666233. doi: 10.3389/fimmu.2021.666233
54. Rius Rigau A, Liang M, Devakumar V, Neelagar R, Matei AE, Györfi AH, et al. Imaging mass cytometry-based characterisation of fibroblast subsets and their cellular niches in systemic sclerosis. Ann Rheum Dis. (2024). doi: 10.1136/ard-2024-226336
55. Ma F, Tsou PS, Gharaee-Kermani M, Plazyo O, Xing X, Kirma J, et al. Systems-based identification of the Hippo pathway for promoting fibrotic mesenchymal differentiation in systemic sclerosis. Nat Commun. (2024) 15:210. doi: 10.1038/s41467-023-44645-6
Keywords: mass cytometry, CyTOF, imaging mass cytometry, systemic autoimmune diseases, systemic inflammatory diseases, single-cell, scRNA seq
Citation: Kante A, Chevalier MF, Sène D, Chauffier J, Mouly S, Chousterman BG, Azibani F, Terrier B, Pezel T and Comarmond C (2025) Mass cytometry: exploring the immune landscape of systemic autoimmune and inflammatory diseases in the past fourteen years. Front. Immunol. 15:1509782. doi: 10.3389/fimmu.2024.1509782
Received: 11 October 2024; Accepted: 18 December 2024;
Published: 17 January 2025.
Edited by:
Luca Quartuccio, University of Udine, ItalyReviewed by:
Helen Marie McGuire, The University of Sydney, AustraliaShiang-Jong Tzeng, National Taiwan University, Taiwan
Copyright © 2025 Kante, Chevalier, Sène, Chauffier, Mouly, Chousterman, Azibani, Terrier, Pezel and Comarmond. This is an open-access article distributed under the terms of the Creative Commons Attribution License (CC BY). The use, distribution or reproduction in other forums is permitted, provided the original author(s) and the copyright owner(s) are credited and that the original publication in this journal is cited, in accordance with accepted academic practice. No use, distribution or reproduction is permitted which does not comply with these terms.
*Correspondence: Cloé Comarmond, Y2hsb2UuY29tYXJtb25kb3J0b2xpQGFwaHAuZnI=