 Ziyuan Li
 Jing Wu2†
 Shenrui Guo
 Weiwei Cheng
 Hui Wang
 Ling Li
 Yafu Yin
- 1Department of Nuclear Medicine, Xinhua Hospital Affiliated To Shanghai Jiao Tong University School of Medicine, Shanghai, China
- 2Department of Pediatric Neurology, Xinhua Hospital Affiliated To Shanghai Jiao Tong University School of Medicine, Shanghai, China
Purpose: The metabolic pattern in autoimmune encephalitis (AE) has been frequently reported. Through this semi-quantitative analysis, we aim to explore a practical diagnostic model based on positron emission tomography (PET) for timely diagnosis of pediatric AE with high accuracy. Moreover, we aim to identify factors that affect the prognosis of pediatric AE and explore the utility of PET as a prognostic biomarker.
Method: Data were collected from 93 AE patients and 67 non-AE patients (age range: 1-18 years old). Semi-quantitative parameters of 18F-FDG PET imaging were evaluated, including the score of cortical lesion extent and the ratios of lesion-to-basal ganglia and thalamus. The Clinical Assessment Scale in Autoimmune Encephalitis (CASE) was used to rate the disease severity and long-term outcome. Multivariate statistical analysis was used to establish a diagnostic model and analyze predictors.
Results: The diagnostic model includes three PET parameters. The sensitivity, specificity, and accuracy of the model are 91.4%, 85.1%, and 88.8%, respectively. Participants were followed up for a median of 34 months. Logistic regression analysis indicated that male, initial CASE score >4.5,memory dysfunction, and the ratio of the maximum SUV of the lesion to thalamus (SUVRmaxL/T) < 0.577 are independent factors associated with poor prognosis in AE. We established a prognostic model through these predictors.
Conclusion: 18F-FDG PET plays a vital role in the diagnosis and prognosis of AE. The PET-based diagnostic model has higher specificity and accuracy than visual analysis. The prognostic model is a useful predictive tool for the long-term prognosis of children with AE.
Highlights
● Question: How to diagnose and predict the prognosis of autoimmune encephalitis in children through PET?
● Pertinent findings: Through the semi-quantitative analysis of PET, a diagnostic and prognostic model including several semi-quantitative indexes was established.
● Implications for patents care: The two models can help the early diagnosis and prognosis of childhood autoimmune encephalitis, respectively
1 Introduction
Autoimmune encephalitis (AE) is a group of central nervous system (CNS) inflammatory disorders mediated by autoimmune mechanisms. It primarily affects children and young adults (1), with a rate of 11.6 per 100,000 children (2). Timely and accurate diagnosis and early initiation of immunotherapy are critical for children with AE, for which delayed treatment results in poor outcomes (3). However, misdiagnosis of AE is not uncommon in many institutions, including specialized centers (4). It has been highlighted that a broad differential diagnosis should be considered in AE diagnosis (4, 5). The exclusion of alternative disorders is crucial for the AE diagnostic criteria (6, 7).
PET has a unique value in the diagnosis of AE (8). Clinical approaches to the diagnosis of AE in pediatric patients recommend considering PET if available and/or if required based on initial investigation (2). We have reported typical findings of 18F-FDG PET/CT in children with AE in a prospective study (9). This time, we attempted to conduct a semi-quantitative analysis of FDG PET in the differential diagnosis of pediatric AE.
Studies to identify prognostic biomarkers of AE are needed. PET can be used as a prognostic test (10). There have been several studies of PET in adult AE outcomes, but most of them have been limited to specific antibodies (11, 12). Pediatric AE often differs from adult-onset AE in symptoms and ultimate prognosis (13). The prognosis of pediatric AE remains to be further investigated. Here, we performed a retrospective study to seek prognostic biomarkers for pediatric AE and explore the validity of PET in AE prognosis.
2 Methods
2.1 Patients selection
This retrospective analysis was conducted from an observational prospective study (Clinical Trials.gov. NCT02969213). The patients who met the following criteria were included (1): who were suspected of AE and younger than 18 years old, older than 1 year old; (2) FDG PET imaging was performed from May 14, 2019, to August 30, 2022, in Xinhua Hospital affiliated to Shanghai Jiao Tong University School of Medicine. Exclusion criteria were listed: (1) who were with other neuropsychiatric disorders; (2) others that could affect the semi-quantitative analysis of FDG PET imaging. According to the criteria mentioned in our previous report (9), the children diagnosed with AE were included in the AE group. Children who were ultimately not diagnosed with AE were included in the non-AE group.
2.2 Clinical and paraclinical data
Clinical and paraclinical information was recorded by searching the electronic medical records. The scale, named the Clinical Assessment Scale for Autoimmune Encephalitis (CASE), was used to rate the severity of AE. CASE scores were assessed at admission for all patients. The CASE includes nine symptoms: seizures, memory dysfunction, psychiatric symptoms, consciousness, language problems, dyskinesia/dystonia, gait instability and ataxia, brainstem dysfunction, and weakness. Each item should be scored from 0 to 3 according to the severity of symptoms, with a total maximum score of 27 (33). The nine variables included in the CASE were obtained through medical records at admission.
2.3 Clinical follow-up
The follow-up period from discharge until follow-up comprised at least 12 months for all AE patients. CASE scores to assess long-term outcomes were obtained by telephone follow-up. AE patients with follow-up data were divided into two groups according to their CASE scores at follow-up. Referring to the grouping criteria in a previous article (14), we classified patients with CASE scores of 0-4 at follow-up into the good outcome group and those with scores greater than 4 into the poor outcome group.
2.4 Brain 18F−FDG PET/CT imaging
18F-FDG PET scanning was acquired using a Siemens Biograph mCT-64 scanner (Erlangen, Germany). All patients fasted for at least 4 hours and rested in a quiet, dim room before injection. 18F-FDG was intravenously injected at a dose of 3.7MBq/kg. A 10-minute brain PET/CT scan was performed about 50 minutes after injection.
2.5 Imaging analysis
Two nuclear medicine doctors with extensive experience in brain FDG PET/CT imaging visually evaluated all PET/CT images. In case of disagreement, a third senior physician made the judgment. The criteria for FDG PET/CT diagnosis of AE: large lobar hypometabolism with or without focal hypermetabolism found on PET/CT was defined as AE. Large lobar hypometabolism means extensive decreased glucose metabolism in more than one lobe or one lobe with bilateral involvement. We recorded the metabolic alterations of cortical lesions, the basal ganglia, and the thalamus.
2.6 Semi-quantitative analysis
Firstly, a score of cortical lesion extent was used to reflect the extent of cortical lesion: one point was recorded for a lesion that involved either lobe unilaterally. The total score was eight. Secondly, we measured the standard uptake value (SUV) of the most significant hypometabolic lesion, the basal ganglia and thalamus. If there was no significant hypometabolic lesion, the SUV of the parietal cortex was measured instead. Using Siemens TrueD software from Germany, the ROI was delineated with a threshold of 40% SUVmax, and the cortical lesion was delineated within a range of approximately 200 mm2. For the basal ganglia and thalamus, manually draw circular 3D ROIs of appropriate diameter in the corresponding areas of the PET image cross-section. Software automatically measures SUVs of ROI. We took the average of SUVs of the basal ganglia and thalamus on both sides. Lastly, metabolic ratios, including lesion to basal ganglia and lesion to thalamus, were constructed separately by SUVmax, SUVmean, and SUVmin. SUVRmaxL/B and SUVRmaxL/T stand for the ratio of the maximum SUV of the lesion to the basal ganglia and the lesion to the thalamus. SUVRmeanL/B and SUVRmeanL/T stand for the ratio of the mean SUV of the lesion to the basal ganglia and the lesion to the thalamus. SUVRminL/B and SUVRminL/T mean the ratio of the minimum SUV of the lesion to the basal ganglia and the lesion to the thalamus.
2.7 Statistical analysis
SPSS 26.0 software (IBM Corp.) and Prism 9 (GraphPad software) were used for statistical analyses. The Shapiro-Wilk test was used to determine whether the data distribution for continuous variables was normal. Continuous variables were compared using the t-test or the non-parametric Mann-Whitney U-test. Categorical variables were analyzed by Chi-squared tests and Fisher’s exact tests. Multivariate binary logistic regression analysis was employed to construct the diagnostic models and derive factors associated with long-term outcomes. Receiver-operating characteristic curves (ROC) were used to calculate cut-off values and assess the discrimination ability of semi-quantitative parameters and diagnostic models. A two-tailed p-value less than 0.05 (p < 0.05) was considered statistically significant.
3 Results
3.1 Clinical and paraclinical characteristics
In total, 160 patients met the inclusion criteria, of which 93 patients were diagnosed with AE and 67 with non-AE. The baseline demographic, clinical and paraclinical data were shown in Table 1. Of the AE patients, 30 were antibody-positive. 10 patients had NMDAR antibodies(1 in serum,8 in CSF,1 in serum and CSF). 5 patients had GQ1b antibodies in serum. Other antibodies positive in serum included Ri(2),MOG(2), Amphiphysin(2),CASPR2(1),Ma2(1),Recoverin(1),AMPAR1(1), Hu combined with Amphiphysin(1), NMDAR combined with mGluR5(2) and SOX1 combined with GQ1b(1). 1 patient had DPPX antibody positive in CSF. Final diagnoses in the non-AE group included viral encephalitis, epilepsy, developmental delay, narcolepsy, etc. None of the children showed specific features of AE on MRI.
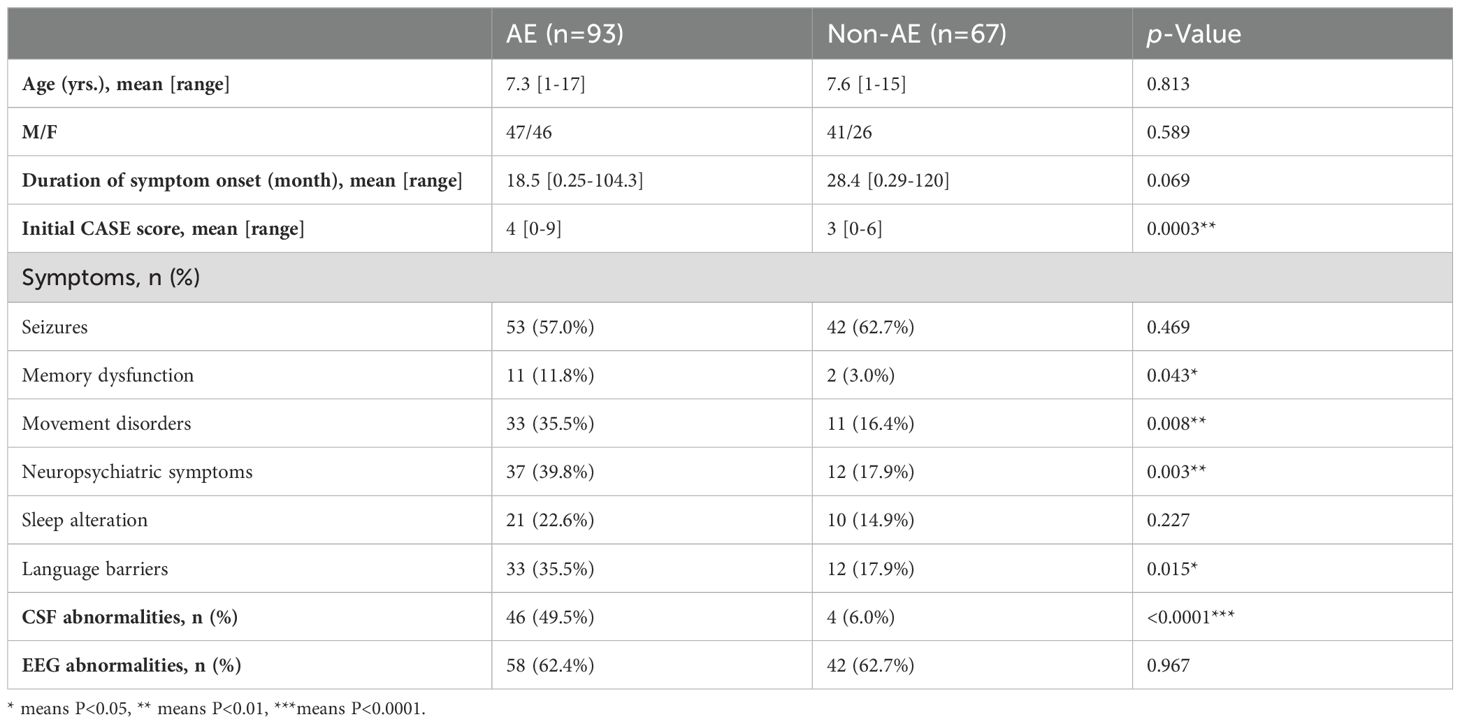
Table 1. Demographic, clinical and paraclinical characteristics.
3.2 Diagnostic performance by visual analysis
According to the criteria for FDG PET/CT diagnosis of AE, 129 patients were diagnosed as AE, of which 89 were truly AE. Four AE patients were misdiagnosed as non-AE. 40 non-AE patients were misdiagnosed as AE. The sensitivity, specificity, and accuracy of visual diagnosis were 95.7% (89/93), 40.3% (27/67), and 72.5% (116/160), respectively. The sensitivity of visual diagnosis is good, but the specificity is low.
3.3 AE diagnostic model based on FDG-PET
The cortical lesions in the AE group were more extensive than those in the non-AE group. The score of cortical lesion extent in the AE group was significantly higher (Figure 1). At the optimal cut-off of 2.5, sensitivity was 90.3%, specificity was 71.6% and AUC was 0.810.
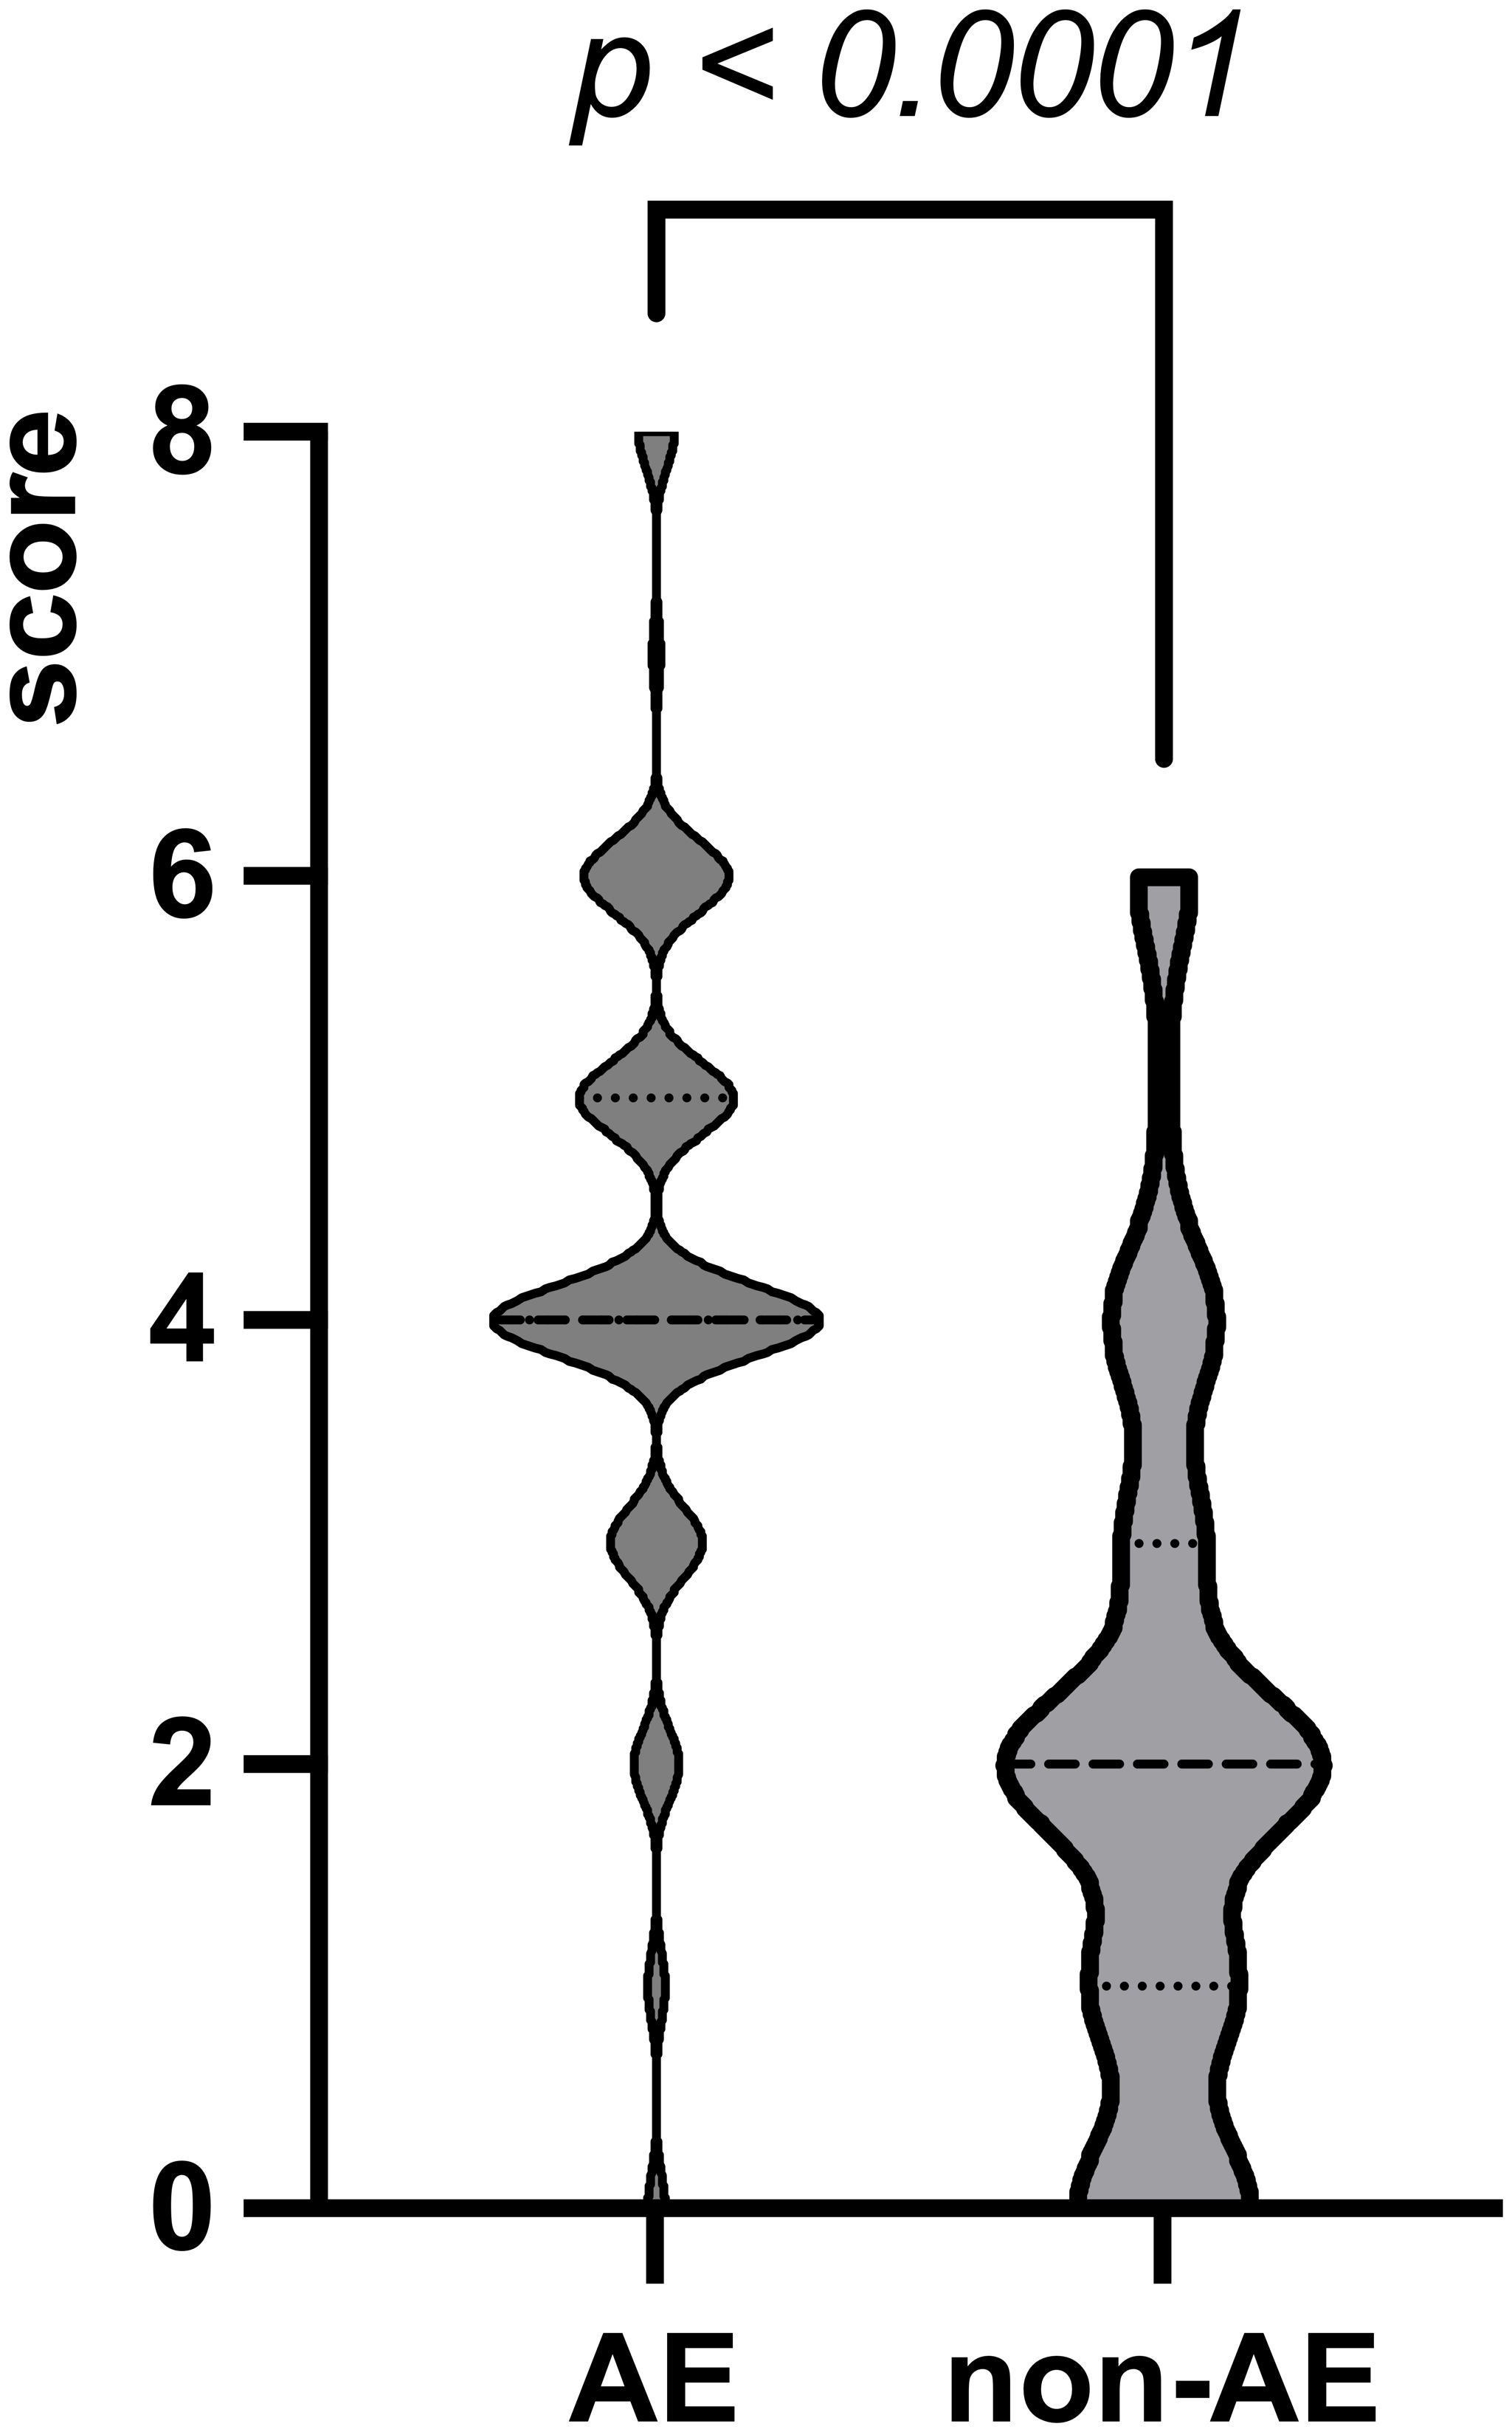
Figure 1. The score of cortical lesion extent. The max, mean, and min values in the AE group are 8, 4, and 0, respectively. The max, mean, and min values in the non-AE group are 6, 2, and 0, respectively.
There were also significant differences in metabolic changes between the two groups. Figure 2 shows typical PET images of AE and non-AE. The AE group showed a higher proportion of hypometabolism in the cortex and hypermetabolism in the basal ganglia and thalamus (Table 2). We constructed metabolic ratios using SUVs of cortical lesions, basal ganglia, and thalamus and figured out whether these ratios could be used to distinguish AE from non-AE. The diagnostic performance of these ratios is presented in Table 3.
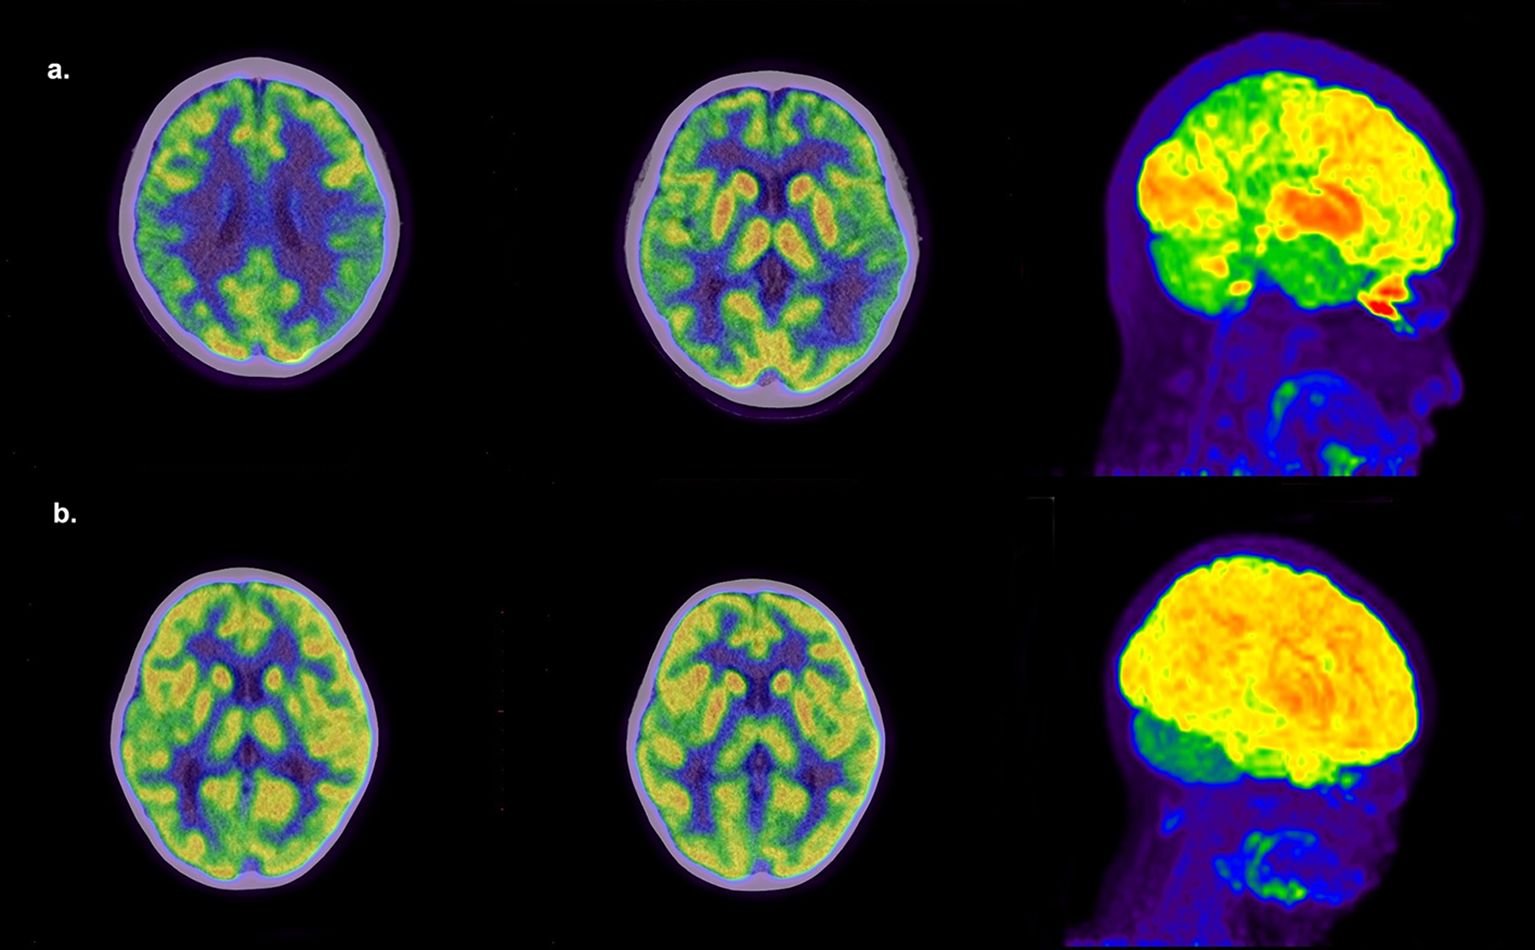
Figure 2. Representative PET images. (a) An 11-year-old girl with AE had a 1-week history of seizures. 18F-FDG PET/CT shows extensive hypometabolism in bilateral frontal, parietal, and temporal lobes and hypermetabolism in the basal ganglia and thalamus. (b) A 3-year-old girl with a 2-year history of seizures and developmental delay was finally diagnosed with intractable epilepsy. 18F-FDG PET/CT shows hypometabolism in the right temporal lobe and right thalamus.
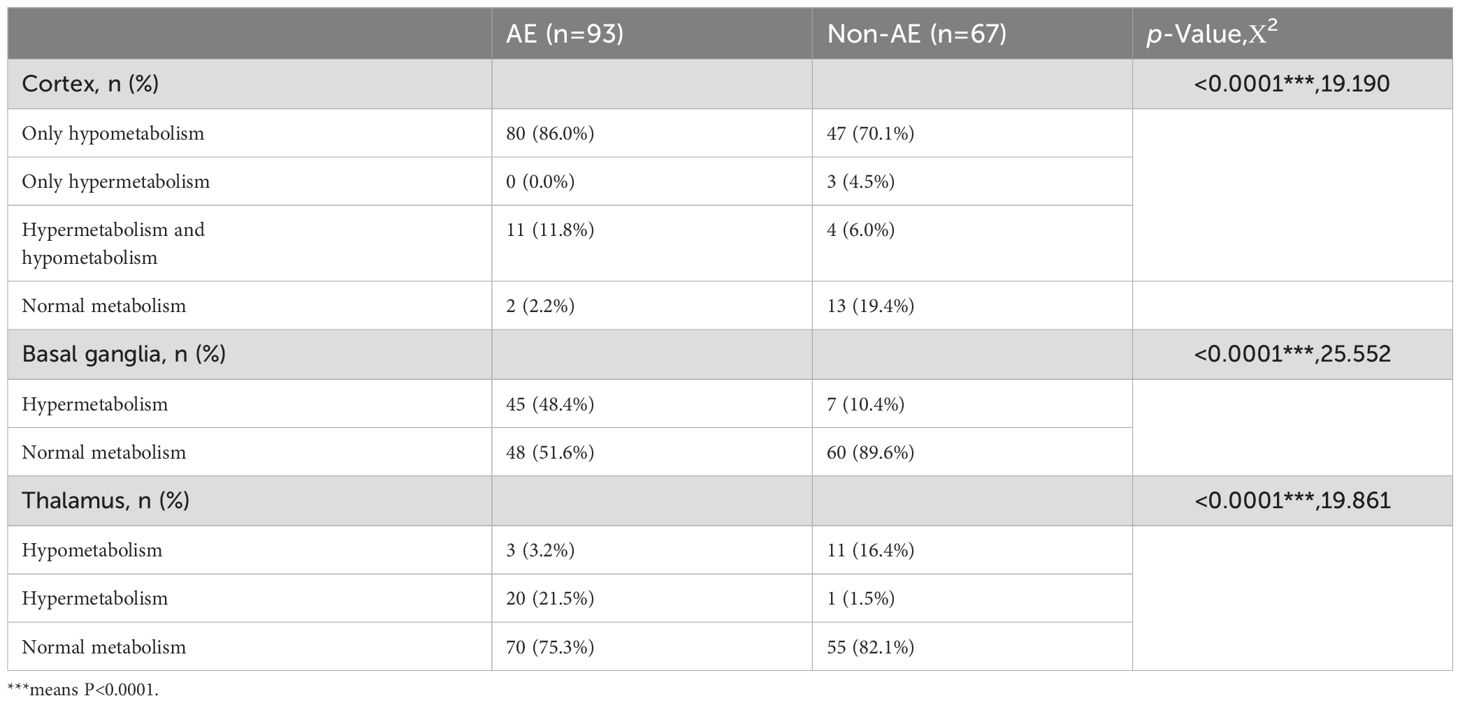
Table 2. Metabolic alteration in two groups.
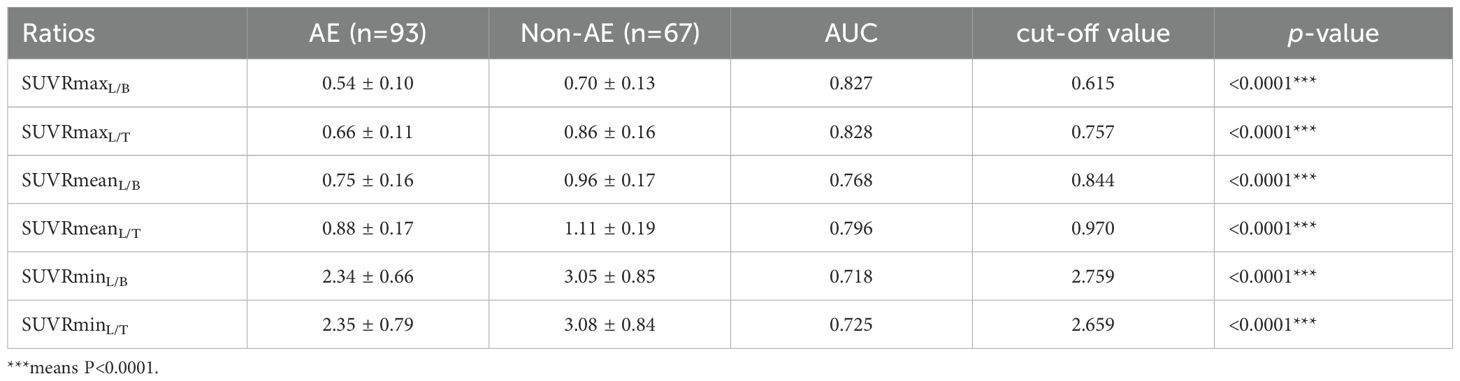
Table 3. Diagnostic performances of ratios.
Five parameters, score of cortical lesion extent, SUVRmaxL/B, SUVRmaxL/T, SUVRmeanL/B, and SUVRmeanL/T, showed a higher AUC between the two groups. Therefore, we finally select these 5 parameters for further analysis. Before multivariate logistic regression analysis, all continuous variables were converted to binary variables according to their respective cut-off values (Supplementary Table 1). Three parameters were selected by logistic regression to establish a diagnostic model to distinguish between AE and non-AE.
Multivariate regression analysis demonstrated that the combination of the score of cortical lesion extent (p < 0.0001), SUVRmaxL/B (p = 0.007), and SUVRmaxL/T (p = 0.001) were independently correlated with AE. An associated diagnostic model for AE was constructed as follows . The ROC curve confirmed that the diagnostic model could markedly distinguish AE from non-AE. The sensitivity, specificity, accuracy, and AUC value were 91.4%, 85.1%, 88.8%, and 0.912, respectively(Figure 3).
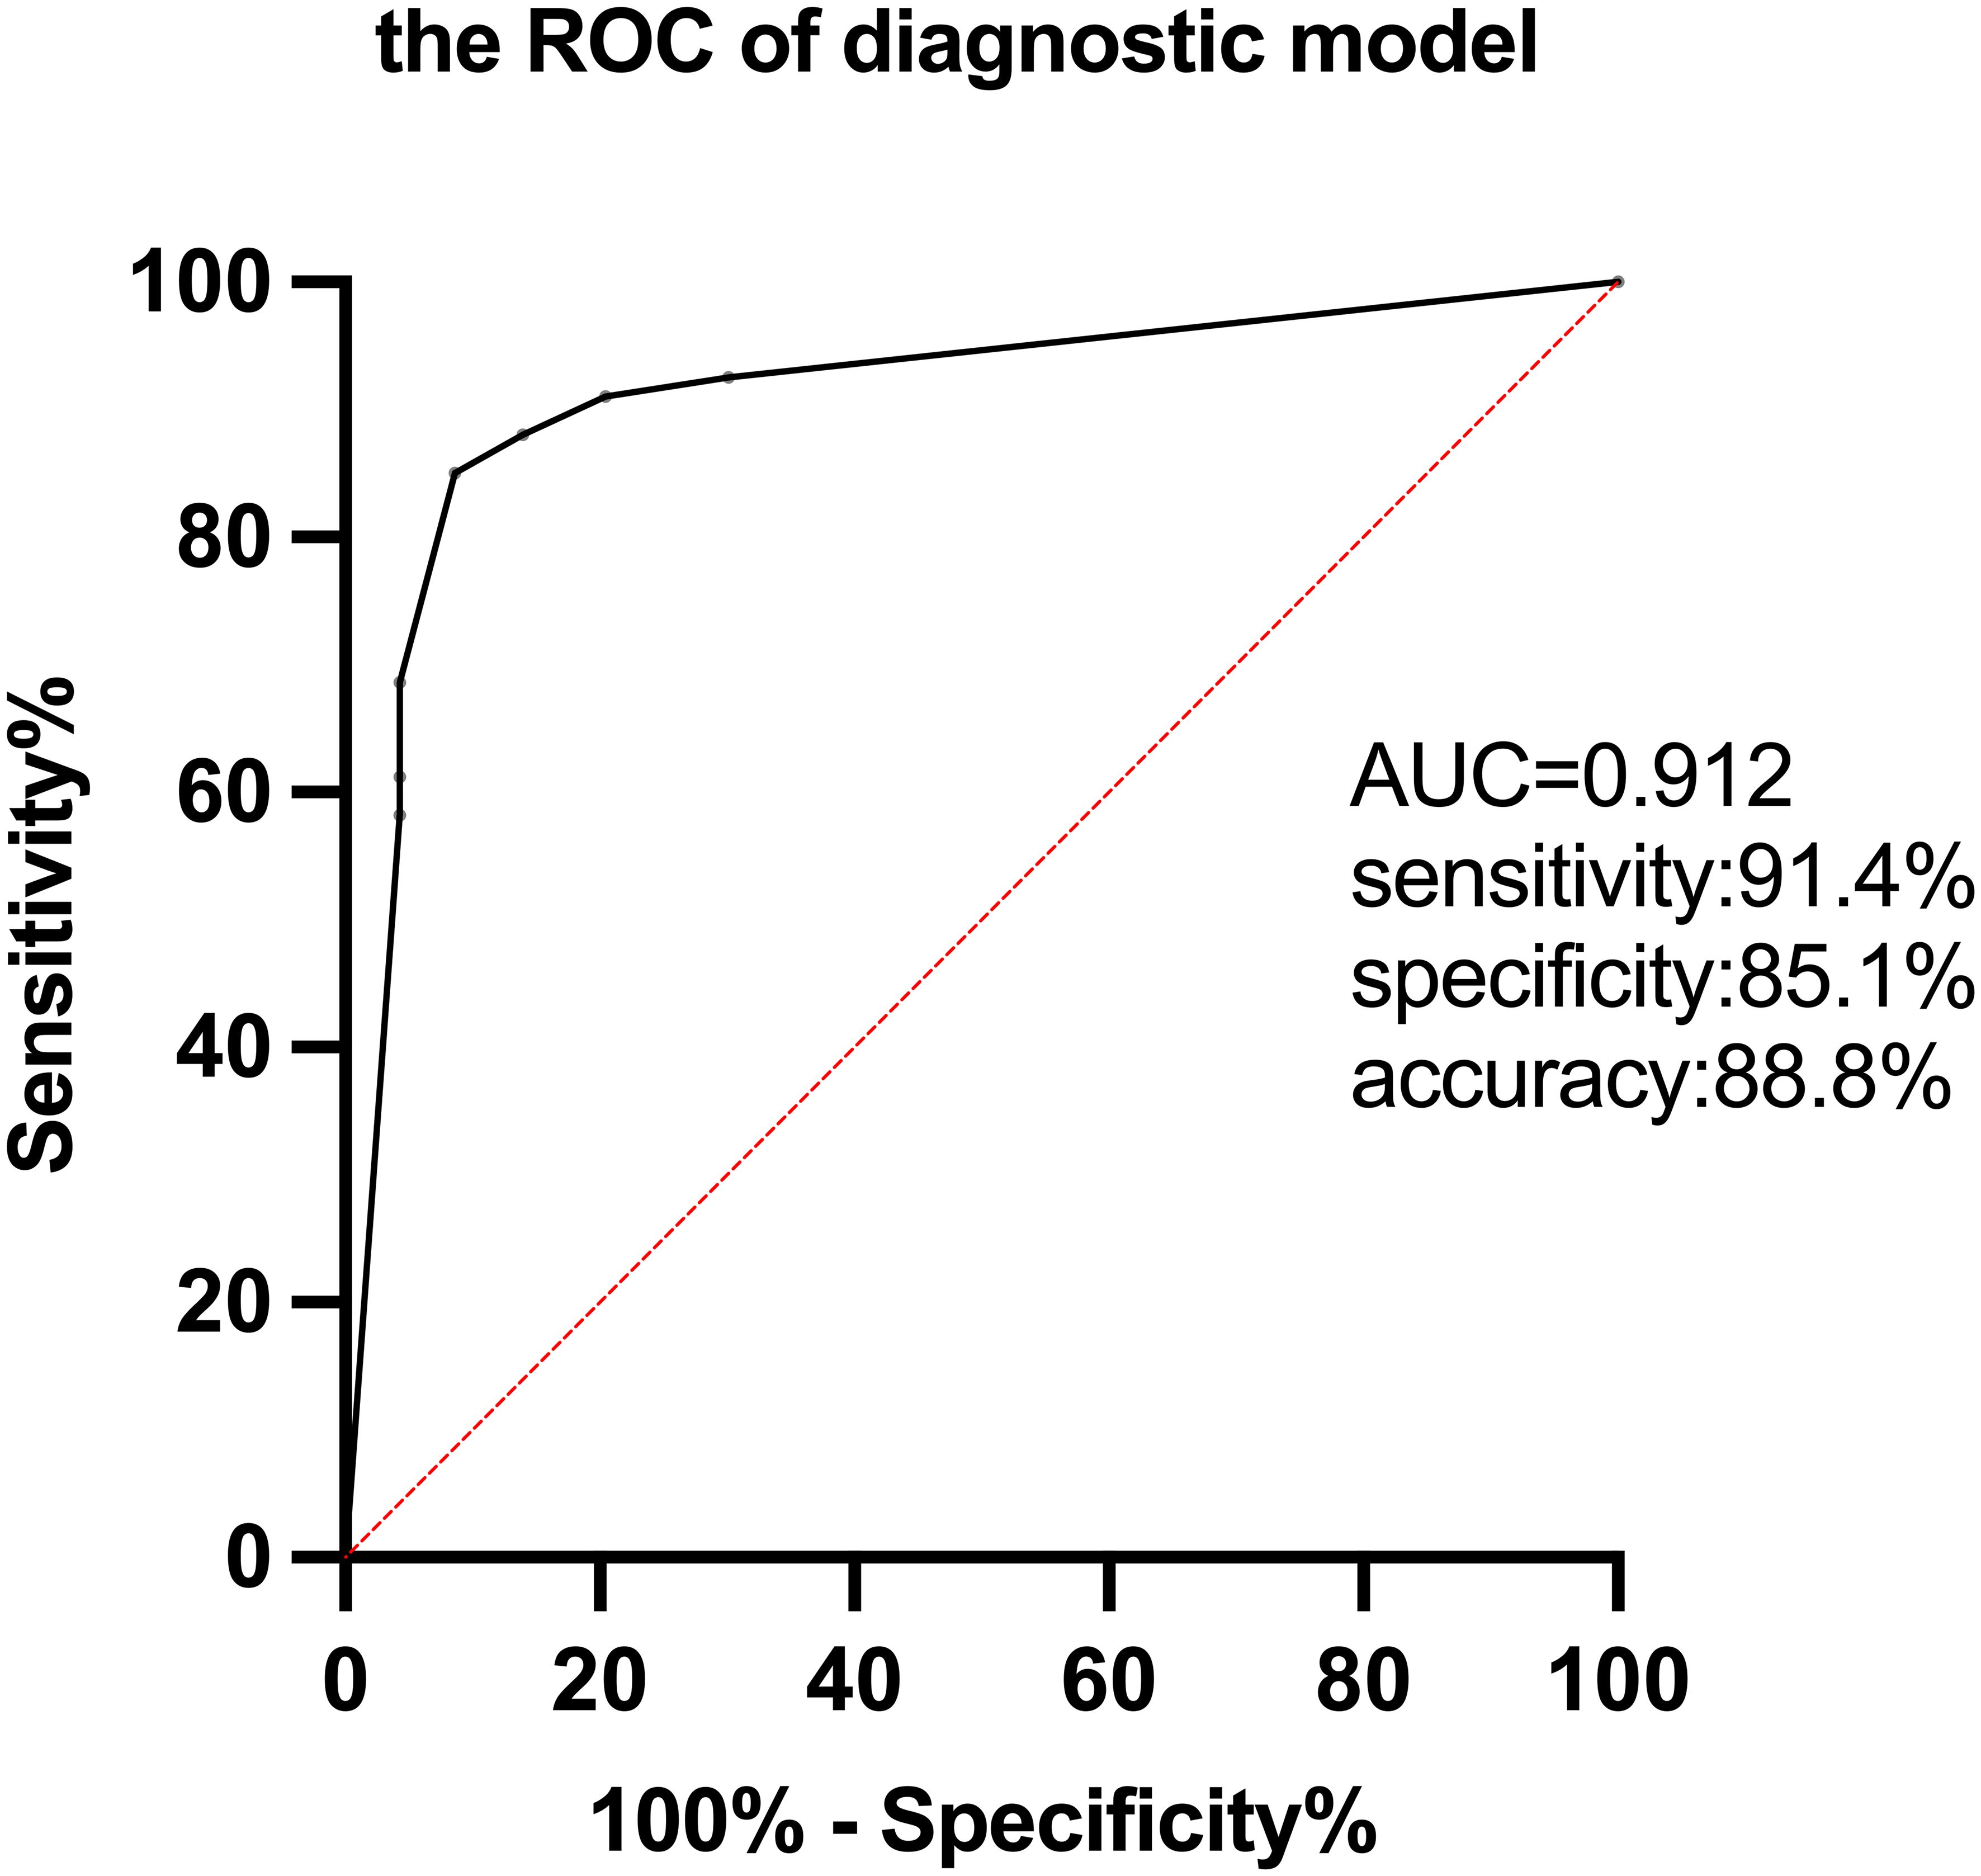
Figure 3. The ROC of the diagnostic model for AE based on FDG-PET semi-quantitative parameters.
3.4 Long-term outcomes of AE patients
Follow-up data were available for 83 AE patients with a median follow-up duration of 34 (12-51) months, with no significant differences between the poor outcome group and the good outcome group regarding follow-up duration. Patients with follow-up CASE score >4 (n=11) were divided into the poor outcome group, and the rest (n=72) were divided into the good outcome group. Figure 4 shows PET images of two patients from the good and poor outcome groups. Three metabolic ratios tended to be significantly lower in the poor outcome group (p<0.05) (Figure 5), and their cut-off values were calculated by ROC analysis. The clinical and paraclinical data between the two groups were compared by univariate analysis (Table 4). Univariate analysis indicated that there were significant differences between the good and poor outcome groups in sex, initial CASE>4.5, memory dysfunction and three metabolic ratios (SUVRmaxL/B, SUVRmaxL/T, SUVRmeanL/B).
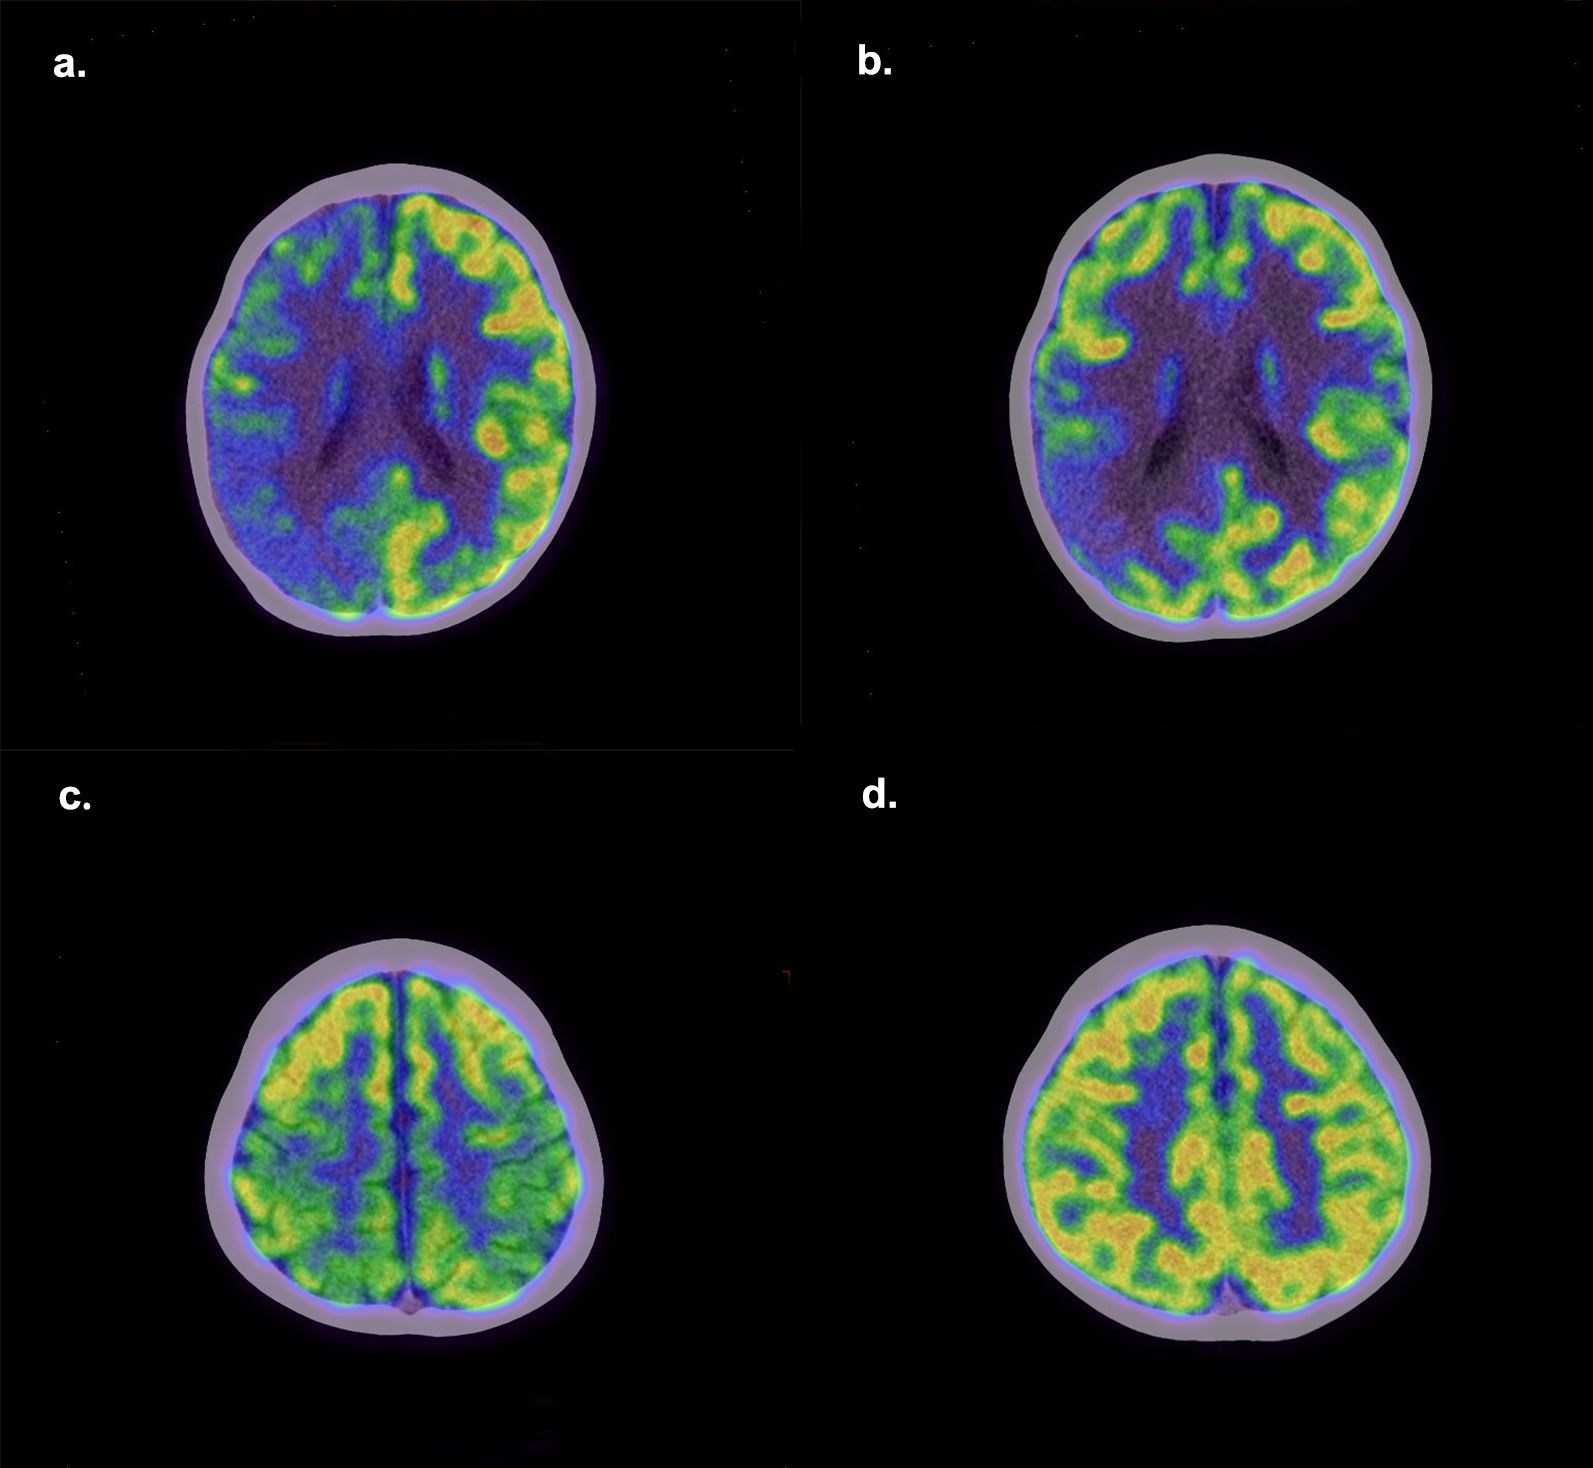
Figure 4. Representative PET images of patients with poor and good outcomes. Upper: A boy with AE had poor epilepsy control. His initial CASE score was 5, and three years after discharge, his CASE score remained 5. (a) The first 18F-FDG PET shows hypometabolism in the right cerebral cortex. (b) One year later, the second 18F-FDG PET shows there is still a seriously hypometabolic region in the right parietal lobe. Bottom: A boy had a 1-year history of gait instability and a 1-month history of severe language problems. Two years later, his language function has returned to normal, but gait in stability still exists. His CASE score has changed from 5 to 1. (c) The first 18F-FDG PET shows hypometabolism in bilateral parietal lobes. (d) Three months later, the second 18F-FDG PET shows the metabolism in the parietal lobe has recovered to normal.
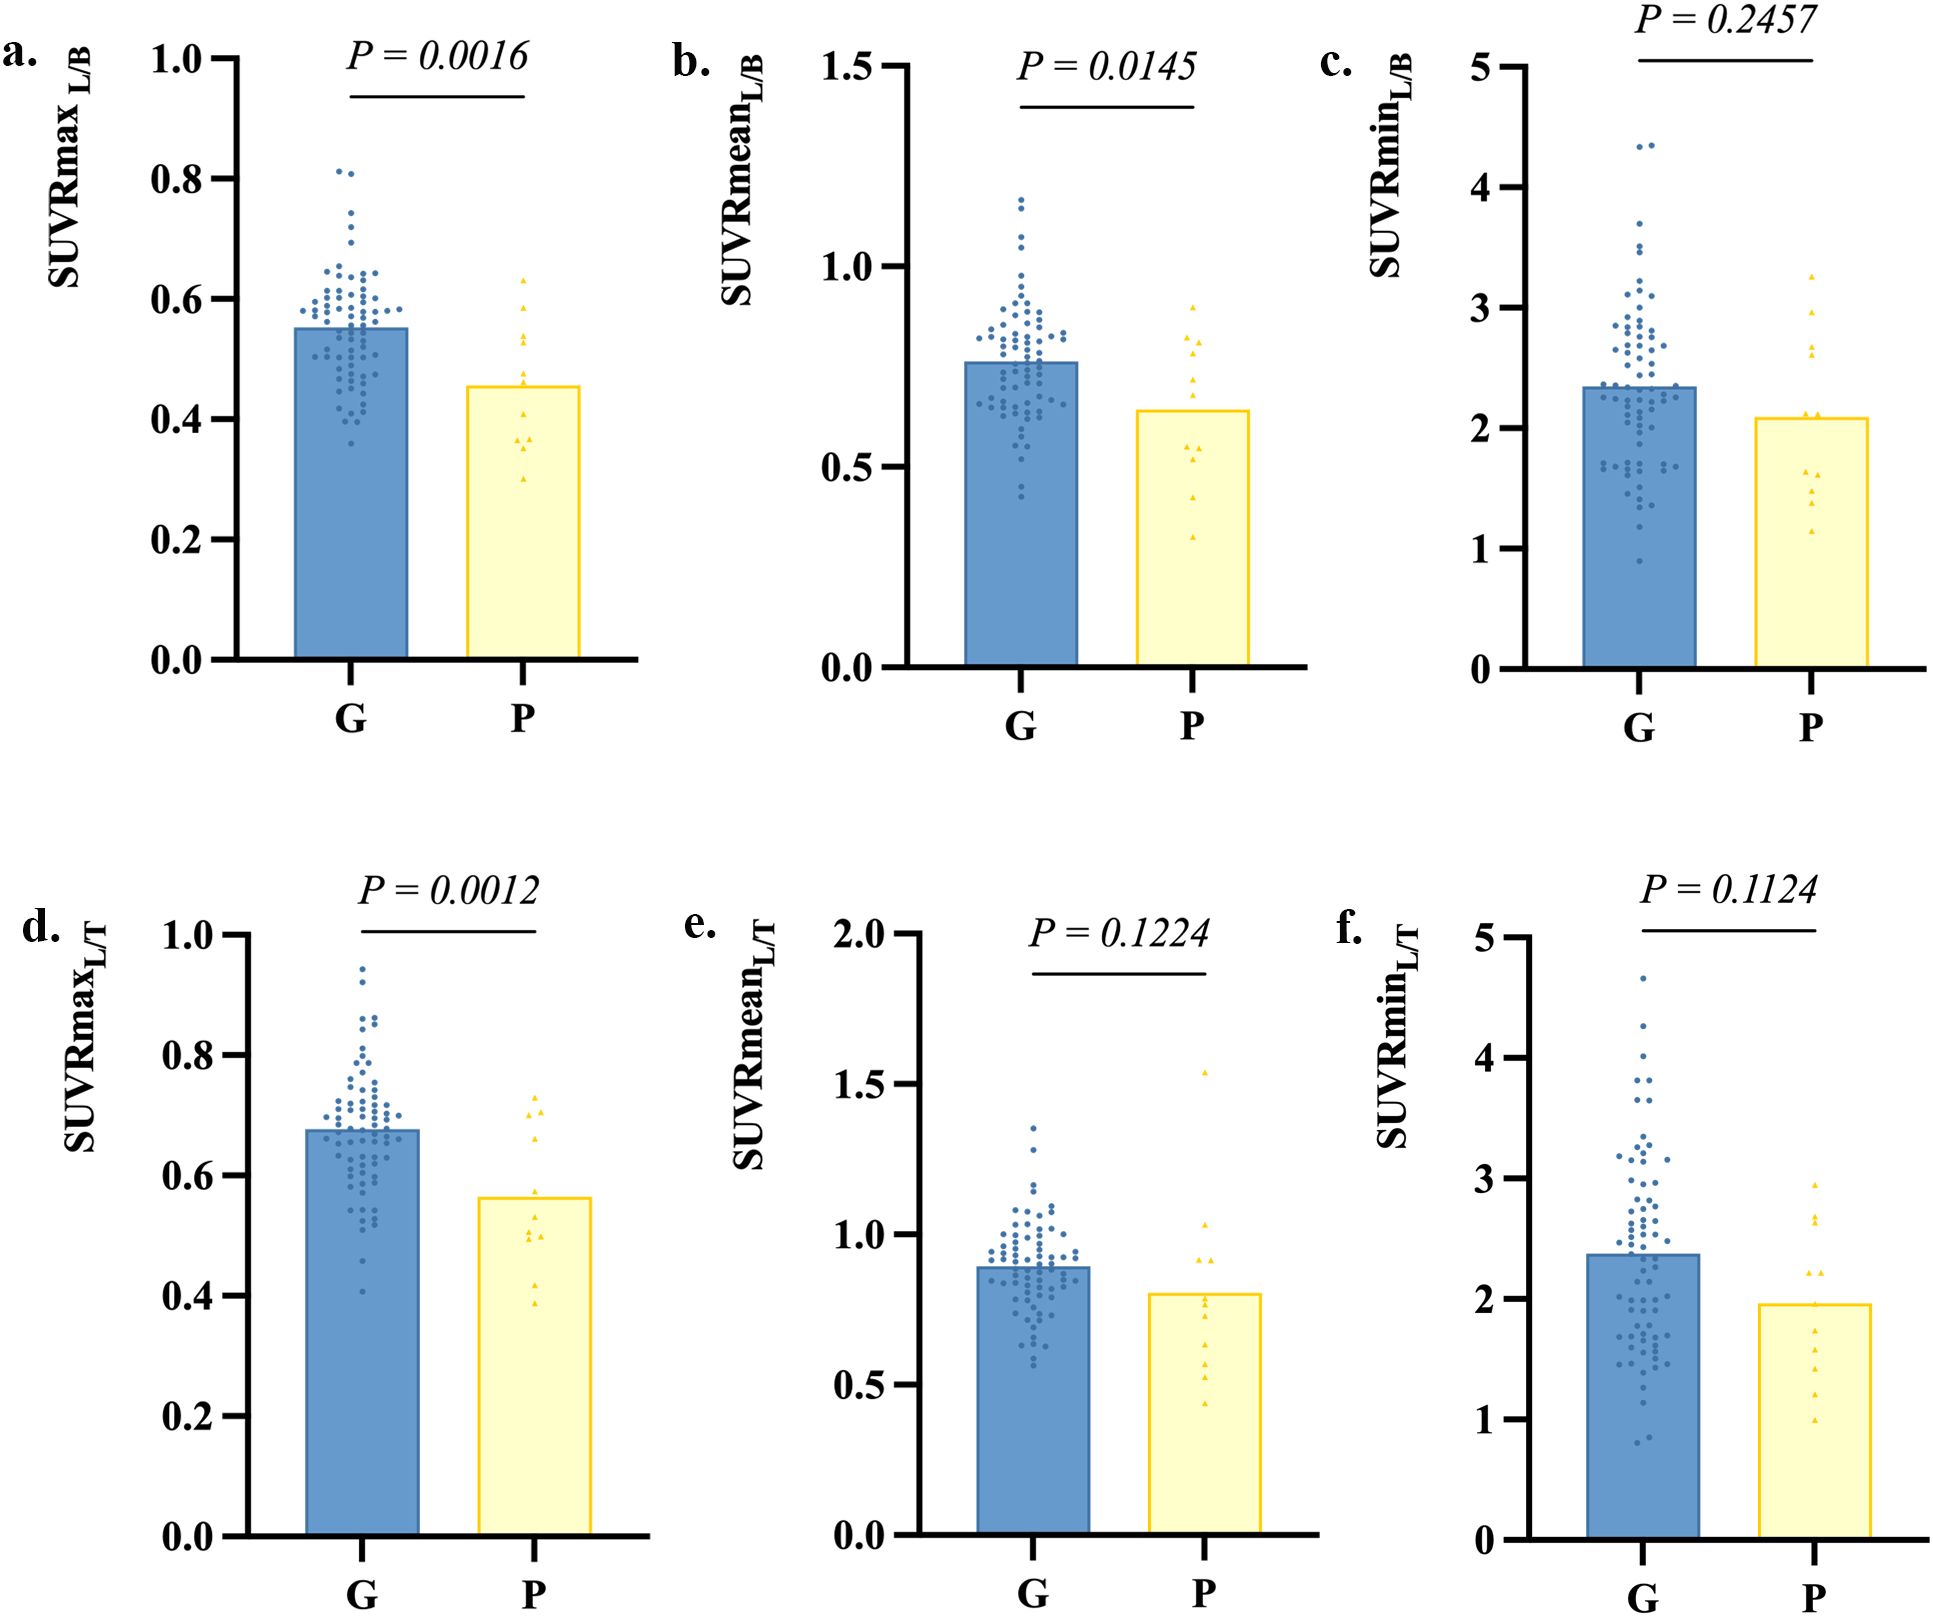
Figure 5. Metabolic ratios in the good outcome group and poor outcome group. G, the good outcome group; P, the poor outcome group.
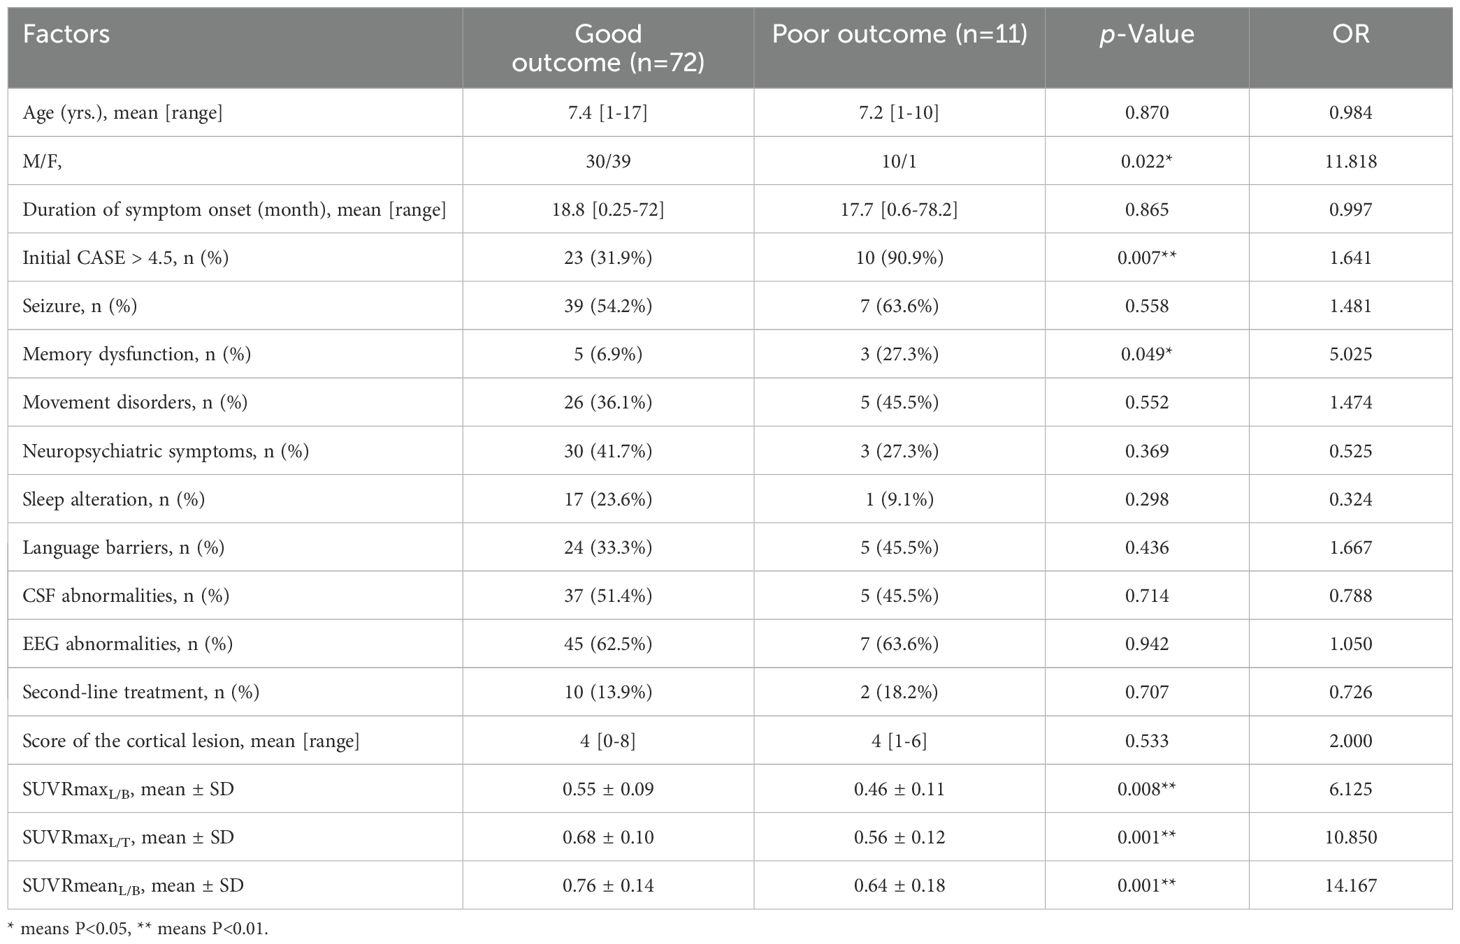
Table 4. Univariate analysis to compare clinical and paraclinical data between the good and poor outcome groups.
3.5 Predictors of prognosis and a prognostic model
All factors with a P-value < 0.05 in Table 4 were included in a multivariate logistic regression model (Supplementary Table 2). Multivariate logistic regression analysis showed that male ([OR] =44.74, p = 0.012), initial CASE>4.5 ([OR] =37.08, p = 0.012), memory dysfunction ([OR] =22.90, p = 0.047), and SUVRmaxL/T < 0.577 ([OR] =45.00, p = 0.005) were independent risk factors associated with poor prognosis of AE. The β value for each factor was obtained by logistic regression. We took the smallest β value (3.131) as a basic unit and scored it as 1. According to the respective β values of each factor, we got optimal new points. A practical predictive model was built based on the optimal new points (Table 5). For the optimized prognostic model, the AUC was 0.948 (95% CI, 0.896 to 1.000). With a cut-off of 1.5, the predicted sensitivity was 100%, and the specificity was 75%. With a cut-off of 2.5, the predicted sensitivity was 63.6%, and the specificity was 98.6%.
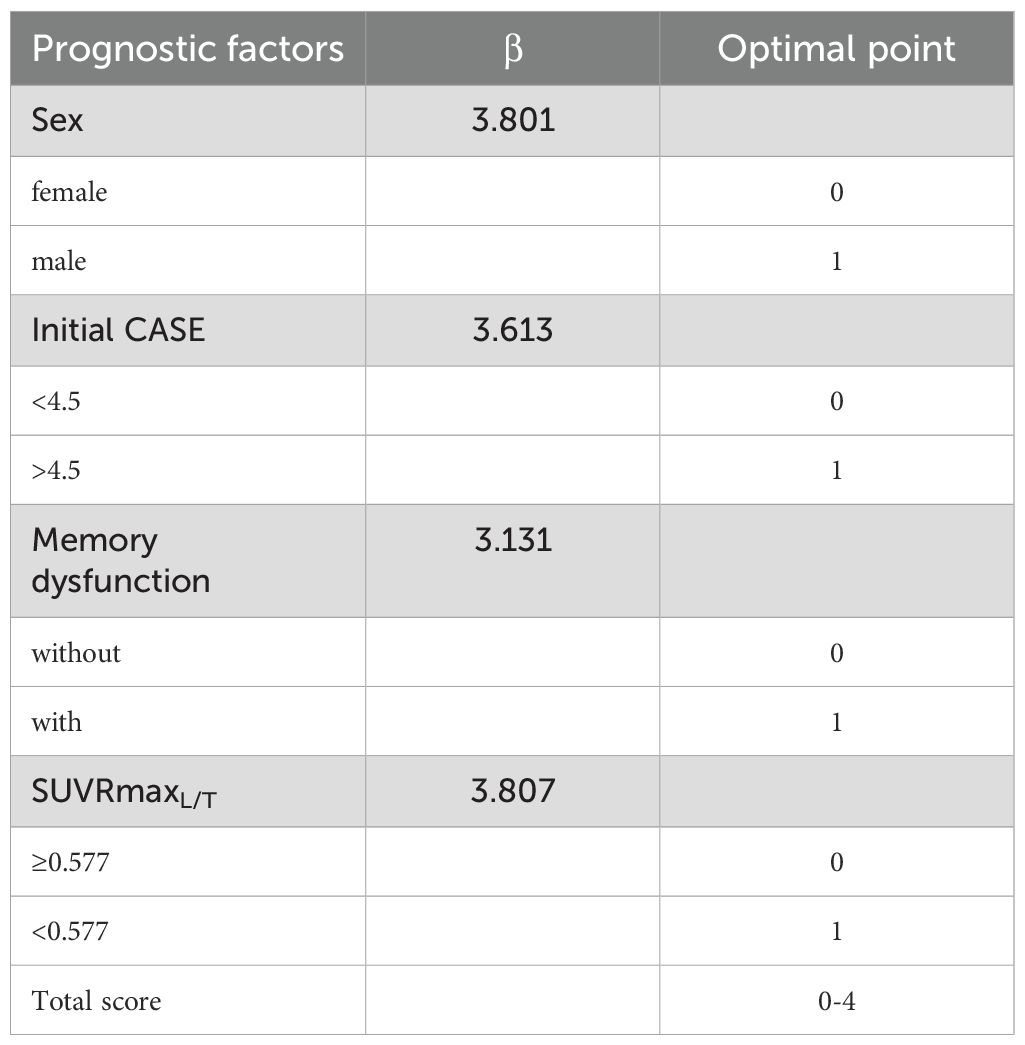
Table 5. The factors and values of the optimized prognostic model.
4 Discussion
The diverse clinical features of AE can mimic a variety of other neurological disorders, making a timely and proper clinical diagnosis difficult (15). Although brain MR imaging is regarded as the first choice of imaging test, 18F-FDG PET/CT has been proven to have a higher sensitivity than MR in AE diagnosis (8, 16). More than half of patients with AE showed non-specific features in MR (16). In our study, all the AE children presented normal or non-specific features in MR, as mentioned in our previous study (9), one reason is that the children with specific features of encephalitis have been diagnosed and treated without the need for FDG PET. PET is valuable in MR-negative patients and can provide vital information to aid in the clinical diagnosis. Moreover, PET findings are more associated with clinical symptoms, disease severity, and recovery after therapy than the MR findings (17). A study concluded that there are two different PET scan patterns in AE. One is a mixture of hyper- and hypometabolism, the other is diffusely reduced cortical uptake of 18F-FDG (18). A diffuse cortical hypometabolism has been found in encephalitis with different antibody types (19, 20). Our previous research concluded that large lobar hypometabolism with or without focal hypermetabolism is the FDG PET/CT diagnostic criteria for AE (9). But visual diagnosis caused low specificity. The reason for this is that some non-AE patients exhibit large lobar hypometabolism, which is the standard for AE visual diagnosis. Part of non-AE patients are ultimately diagnosed with epilepsy. The interphase of epilepsy is characterized by low metabolism of the lesion. A study has shown that the proportion of children with epilepsy with multi lobe hypometabolism is about 47% (21). Therefore, the specificity of simple visual analysis is low. The hypermetabolism in basal ganglia was frequently reported in AE (22, 23). Metabolic alterations in the thalamus have also been reported (24, 25), although not in large numbers. In our study, hypermetabolism in basal ganglia was present in 48.4% of AE patients, and diffuse cortical hypometabolism was in 86%. We quantified these PET features into reproducible diagnostic parameters. The diagnostic model containing semi-quantitative indicators improves diagnostic specificity. Many semi-quantitative analyses rely on software that is not convenient for clinical use (11, 26). We referred to this research (27) and used a simple measurement method to establish the diagnostic model with high sensitivity and accuracy, and the three parameters in the model are easily obtained.
Future studies have been suggested to focus on the evaluation of biomarkers as potential predictors of AE outcomes (28). Most studies in AE used the modified Rankin scale (mRS) as an outcome measure. However, mRS is insufficient to evaluate the neurological improvements of AE as a scale of global disability for acute stroke patients (29). The CASE has good reliability and validity in AE (30–32).It can reflect neuropsychological status, perform satisfactorily even in AE patients with mild symptoms, and changes in CASE score are more sensitive to changes in severity than mRS. The CASE score greater than 9 in pediatric AE patients suggests the need for second-line therapy, and ICU admission may be necessary when the CASE score is greater than 14 (30). We found that an initial CASE score above 4.5 was a risk factor for a poor prognosis. This means that the severity of symptoms is associated with prognostic outcomes. The lower severity of symptoms assessed as no need for ICU support predicts a good outcome (33), which is similar to our results.
PET is one of the possible prognostic biomarkers (10). Cortical hypometabolism may be a predictor of poor outcome or relapse in anti-NMDAR-encephalitis in children (20). Compared with the patients with a good outcome, the patients with a worse long-term outcome showed lower metabolic activity in particular cortical regions at baseline, including the orbital frontal and cingulate gyrus (11). Our finding indicated that the ratios of the most significant hypometabolic lesion to basal ganglia and thalamus are lower in the poor outcome group. Baseline SUVRmaxL/T less than 0.577 may be a marker for a poor prognosis. 18F-FDG-PET imaging has the potential to improve the estimation of follow-up evaluation and therapy monitoring in patients with AE (17, 34). Among the patients included in this study, 13 AE patients underwent PET reexamination, and 10 of them had follow-up information. In the good outcome group, some patients showed a reduction in the range of cortical lesions on PET follow-up after treatment, while some patients had elevated basal ganglia metabolism compared to before treatment. In the poor outcome group, the patient’s second PET showed a similar or slightly reduced range of cortical lesion as before, but there were still lesions with very low metabolism present. Due to the small number of cases and varying intervals between two PET examinations, it is not suitable for statistical analysis. Further research is needed to determine whether changes in PET after treatment can indicate prognosis.
Prognostic studies in adults with AE have found that memory dysfunction is associated with poor prognosis (35). This may be due to reduced connectivity of the anterior hippocampus and the anterior default mode network. These connections seem most vulnerable, which may cause poor memory recovery (36). Other symptoms mentioned in existing studies that may be associated with a poor prognosis for AE in children include disturbance of consciousness, limb dyskinesia (37), altered consciousness, and central hypoventilation (38, 39). As for sex, a study found boys were significantly more likely to need a longer hospital day and a longer course of steroid. Boys might have a worse outcome than girls (40). We found that male is a predictor of poor outcomes, too. While another study indicates outcomes were similar for females and males (41). For patients with anti-NMDA receptor encephalitis, second-line immunotherapy was significantly associated with better outcomes (33). We found that patients treated with second-line therapy had more severe symptoms on admission but recovered well and could return to full recovery. However, our study has not yet found a significant difference between the effects of first-line and second-line treatment on prognosis.
However, this study has some limitations. First, we construct a diagnostic model based on the semi-quantitative parameters of FDG PET from 160 patients, which is not a large data set and lacks validation data. And multi-center studies are necessary to validate the model. For prognostic model, small data, especially the poor outcome group with few patients is the most significant shortcoming, and clinical factors enrolled for analysis are not sufficient, such as the initial time and duration of therapy are not included. Further study enrolled more cases would be performed in future.
5 Conclusion
Compared with visual analysis, the diagnostic model based on metabolic ratios of FDG PET has better specificity and accuracy. Male, initial CASE>4.5, memory dysfunction, and SUVRmaxL/T<0.577 may have predictive value for the poor outcomes of pediatric AE. We provide practical models for diagnosis and prognostic prediction of AE in children. Our results confirm the value of FDG PET in the diagnosis and prognosis of AE.
Data availability statement
The raw data supporting the conclusions of this article will be made available by the authors, without undue reservation.
Ethics statement
The studies involving humans were approved by Ethics Committee of Xin Hua hospital. The studies were conducted in accordance with the local legislation and institutional requirements. The participants provided their written informed consent to participate in this study.
Author contributions
ZL: Data curation, Formal Analysis, Investigation, Methodology, Writing – original draft. JW: Conceptualization, Data curation, Formal Analysis, Writing – review & editing. SW: Investigation, Writing – review & editing. SG: Data curation, Writing – review & editing. MC: Data curation, Writing – review & editing. WC: Investigation, Writing – review & editing. HW: Conceptualization, Writing – review & editing. LL: Conceptualization, Writing – review & editing. YY: Conceptualization, Funding acquisition, Writing – review & editing.
Funding
The author(s) declare that financial support was received for the research and/or publication of this article. This work was supported by the National Nature Science Foundation of China (No. 81974270).
Conflict of interest
The authors declare that the research was conducted in the absence of any commercial or financial relationships that could be construed as a potential conflict of interest.
The reviewer CZ declared a past co-authorship with the authors YY to the handling editor.
Publisher’s note
All claims expressed in this article are solely those of the authors and do not necessarily represent those of their affiliated organizations, or those of the publisher, the editors and the reviewers. Any product that may be evaluated in this article, or claim that may be made by its manufacturer, is not guaranteed or endorsed by the publisher.
Supplementary material
The Supplementary Material for this article can be found online at: https://www.frontiersin.org/articles/10.3389/fimmu.2025.1457758/full#supplementary-material
References
1. Hardy D. Autoimmune encephalitis in children. Pediatr Neurol. (2022) 132:56–66. doi: 10.1016/j.pediatrneurol.2022.05.004
2. Dubey D, Toledano M, McKeon A. Clinical presentation of autoimmune and viral encephalitides. Curr Opin Crit Care. (2018) 24:80–90. doi: 10.1097/MCC.0000000000000483
3. Byrne S, Walsh C, Hacohen Y, Muscal E, Jankovic J, Stocco A, et al. Earlier treatment of NMDAR antibody encephalitis in children results in a better outcome. Neurol Neuroimmunol Neuroinflamm. (2015) 2:e130. doi: 10.1212/NXI.0000000000000130
4. Flanagan EP, Geschwind MD, Lopez-Chiriboga AS, Blackburn KM, Turaga S, Binks S, et al. Autoimmune encephalitis misdiagnosis in adults. JAMA Neurol. (2023) 80:30–9. doi: 10.1001/jamaneurol.2022.4251
5. Dalmau J, Graus F. Diagnostic criteria for autoimmune encephalitis: utility and pitfalls for antibody-negative disease. Lancet Neurol. (2023) 22:529–40. doi: 10.1016/S1474-4422(23)00083-2
6. Graus F, Titulaer MJ, Balu R, Benseler S, Bien CG, Cellucci T, et al. A clinical approach to diagnosis of autoimmune encephalitis. Lancet Neurol. (2016) 15:391–404. doi: 10.1016/S1474-4422(15)00401-9
7. Cellucci T, Van Mater H, Graus F, Muscal E, Gallentine W, Klein-Gitelman MS, et al. Clinical approach to the diagnosis of autoimmune encephalitis in the pediatric patient. Neurol Neuroimmunol Neuroinflamm. (2020) 7:391–404. doi: 10.1212/NXI.0000000000000663
8. Probasco JC, Solnes L, Nalluri A, Cohen J, Jones KM, Zan E, et al. Abnormal brain metabolism on FDG-PET/CT is a common early finding in autoimmune encephalitis. Neurol Neuroimmunol Neuroinflamm. (2017) 4:e352. doi: 10.1212/NXI.0000000000000352
9. Yin Y, Wu J, Wu S, Chen S, Cheng W, Li L, et al. Usefulness of brain FDG PET/CT imaging in pediatric patients with suspected autoimmune encephalitis from a prospective study. Eur J Nucl Med Mol Imaging. (2022) 49:1918–29. doi: 10.1007/s00259-021-05649-w
10. Dalmau J, Armangué T, Planagumà J, Radosevic M, Mannara F, Leypoldt F, et al. An update on anti-NMDA receptor encephalitis for neurologists and psychiatrists: mechanisms and models. Lancet Neurol. (2019) 18:1045–57. doi: 10.1016/S1474-4422(19)30244-3
11. Rissanen E, Carter K, Cicero S, Ficke J, Kijewski M, Park MA, et al. Cortical and subcortical dysmetabolism are dynamic markers of clinical disability and course in anti-LGI1 encephalitis. Neurol Neuroimmunol Neuroinflamm. (2022) 9:e1136. doi: 10.1212/NXI.0000000000001136
12. Liu X, Yu T, Zhao X, Li G, Lv R, Ai L, et al. (18) F-fluorodeoxy-glucose positron emission tomography pattern and prognostic predictors in patients with anti-GABAB receptor encephalitis. CNS Neurosci Ther. (2022) 28:269–78. doi: 10.1111/cns.13767
13. Brenton JN, Goodkin HP. Antibody-mediated autoimmune encephalitis in childhood. Pediatr Neurol. (2016) 60:13–23. doi: 10.1016/j.pediatrneurol.2016.04.004
14. Lee WJ, Lee ST, Kim DY, Kim S, Chu K. Disease progression and brain atrophy in NMDAR encephalitis: Associated factor & clinical implication. Ann Clin Transl Neurol. (2022) 9:912–24. doi: 10.1002/acn3.51604
15. Baumgartner A, Rauer S, Hottenrott T, Leypoldt F, Ufer F, Hegen H, et al. Admission diagnoses of patients later diagnosed with autoimmune encephalitis. J Neurol. (2019) 266:124–32. doi: 10.1007/s00415-018-9105-3
16. Solnes LB, Jones KM, Rowe SP, Pattanayak P, Nalluri A, Venkatesan A, et al. Diagnostic value of (18)F-FDG PET/CT versus MRI in the setting of antibody-specific autoimmune encephalitis. J Nucl Med. (2017) 58:1307–13. doi: 10.2967/jnumed.116.184333
17. Leypoldt F, Buchert R, Kleiter I, Marienhagen J, Gelderblom M, Magnus T, et al. Fluorodeoxyglucose positron emission tomography in anti-N-methyl-D-aspartate receptor encephalitis: distinct pattern of disease. J Neurol Neurosurg Psychiatry. (2012) 83:681–6. doi: 10.1136/jnnp-2011-301969
18. Fisher RE, Patel NR, Lai EC, Schulz PE. Two different 18F-FDG brain PET metabolic patterns in autoimmune limbic encephalitis. Clin Nucl Med. (2012) 37:e213–218. doi: 10.1097/RLU.0b013e31824852c7
19. Sánchez-Ordúz L, Gállego-Pérez-Larraya J, Grisanti F, Centeno M, Arbizu J. Caspr2 antibody-associated limbic encephalitis: contribution of visual aided analysis of (18)F-FDG PET images using normal database comparison. Rev Esp Med Nucl Imagen Mol (Engl Ed). (2020) 39:92–5. doi: 10.1016/j.remn.2019.08.008
20. Pillai SC, Gill D, Webster R, Howman-Giles R, Dale RC. Cortical hypometabolism demonstrated by PET in relapsing NMDA receptor encephalitis. Pediatr Neurol. (2010) 43:217–20. doi: 10.1016/j.pediatrneurol.2010.04.019
21. Abdul Aziz AF, Mohamed AR, Murugesu S, Siti Zarina AH, Lee BN. (18)F-FDG PET/CT for the pre-surgical localization of epileptogenic focus among paediatric patients with drug resistant epilepsy in Malaysia: perspective of a nuclear medicine physician. Med J Malaysia. (2021) 76:502–9.
22. Liu X, Shan W, Zhao X, Ren J, Ren G, Chen C, et al. The clinical value of (18) F-FDG-PET in autoimmune encephalitis associated with LGI1 antibody. Front Neurol. (2020) 11:418. doi: 10.3389/fneur.2020.00418
23. Maeder-Ingvar M, Prior JO, Irani SR, Rey V, Vincent A, Rossetti AO. FDG-PET hyperactivity in basal ganglia correlating with clinical course in anti-NDMA-R antibodies encephalitis. J Neurol Neurosurg Psychiatry. (2011) 82:235–6. doi: 10.1136/jnnp.2009.198697
24. Tripathi M, Tripathi M, Roy SG, Parida GK, Ihtisham K, Dash D, et al. Metabolic topography of autoimmune non-paraneoplastic encephalitis. Neuroradiology. (2018) 60:189–98. doi: 10.1007/s00234-017-1956-2
25. Baumgartner A, Rauer S, Mader I, Meyer PT. Cerebral FDG-PET and MRI findings in autoimmune limbic encephalitis: correlation with autoantibody types. J Neurol. (2013) 260:2744–53. doi: 10.1007/s00415-013-7048-2
26. Probasco JC, Solnes L, Nalluri A, Cohen J, Jones KM, Zan E, et al. Decreased occipital lobe metabolism by FDG-PET/CT: An anti-NMDA receptor encephalitis biomarker. Neurol Neuroimmunol Neuroinflamm. (2018) 5:e413. doi: 10.1212/NXI.0000000000000413
27. Moloney P, Boylan R, Elamin M, O’Riordan S, Killeen R, McGuigan C. Semi-quantitative analysis of cerebral FDG-PET reveals striatal hypermetabolism and normal cortical metabolism in a case of VGKCC limbic encephalitis. Neuroradiol J. (2017) 30:160–3. doi: 10.1177/1971400916689578
28. Broadley J, Seneviratne U, Beech P, Buzzard K, Butzkueven H, O'Brien T, et al. Prognosticating autoimmune encephalitis: A systematic review. J Autoimmun. (2019) 96:24–34. doi: 10.1016/j.jaut.2018.10.014
29. Seifert-Held T, Eberhard K, Lechner C, Macher S, Hegen H, Moser T, et al. Functional recovery in autoimmune encephalitis: A prospective observational study. Front Immunol. (2021) 12:641106. doi: 10.3389/fimmu.2021.641106
30. Zhou H, Deng Q, Yang Z, Tai Z, Liu K, Ping Y, et al. Performance of the clinical assessment scale for autoimmune encephalitis in a pediatric autoimmune encephalitis cohort. Front Immunol. (2022) 13:915352. doi: 10.3389/fimmu.2022.915352
31. Panda PK, Sharawat IK, Ramachandran A, Elwadhi A, Tomar A, Bhardwaj S, et al. Validity and prognostic utility of clinical assessment scale for autoimmune encephalitis (CASE) score in children with autoimmune encephalitis. Brain Dev. (2023) 45:8–15. doi: 10.1016/j.braindev.2022.09.009
32. Cai MT, Lai QL, Zheng Y, Fang GL, Qiao S, Shen CH, et al. Validation of the clinical assessment scale for autoimmune encephalitis: A multicenter study. Neurol Ther. (2021) 10:985–1000. doi: 10.1007/s40120-021-00278-9
33. Titulaer MJ, McCracken L, Gabilondo I, Armangué T, Glaser C, Iizuka T, et al. Treatment and prognostic factors for long-term outcome in patients with anti-NMDA receptor encephalitis: an observational cohort study. Lancet Neurol. (2013) 12:157–65. doi: 10.1016/S1474-4422(12)70310-1
34. Trevino-Peinado C, Arbizu J, Irimia P, Riverol M, Martínez-Vila E. Monitoring the effect of immunotherapy in autoimmune limbic encephalitis using 18F-FDG PET. Clin Nucl Med. (2015) 40:e441–443. doi: 10.1097/RLU.0000000000000839
35. Sun Y, Ren G, Ren J, Shan W, Han X, Lian Y, et al. A validated nomogram that predicts prognosis of autoimmune encephalitis: A multicenter study in China. Front Neurol. (2021) 12:612569. doi: 10.3389/fneur.2021.612569
36. de Bruijn M, Aarsen FK, van Oosterhout MP, van der Knoop MM, Catsman-Berrevoets CE, Schreurs MWJ, et al. Long-term neuropsychological outcome following pediatric anti-NMDAR encephalitis. Neurology. (2018) 90:e1997–2005. doi: 10.1212/WNL.0000000000005605
37. Huang JY, Fan WX, Meng J, Cai CQ, Li D. Immune characteristics of children with autoimmune encephalitis and the correlation with a short-term prognosis. Ital J Pediatr. (2022) 48:94. doi: 10.1186/s13052-022-01247-0
38. Yang S, Yang L, Liao H, Chen M, Feng M, Liu S, et al. Clinical characteristics and prognostic factors of children with anti-N-methyl-D-aspartate receptor encephalitis. Front Pediatr. (2021) 9:605042. doi: 10.3389/fped.2021.605042
39. Pruetarat N, Netbaramee W, Pattharathitikul S, Veeravigrom M. Clinical manifestations, treatment outcomes, and prognostic factors of pediatric anti-NMDAR encephalitis in tertiary care hospitals: A multicenter retrospective/prospective cohort study. Brain Dev. (2019) 41:436–42. doi: 10.1016/j.braindev.2018.12.009
40. Li X, Hou C, Wu WL, Liang H, Zheng K, Zhang Y, et al. Pediatric anti-N-methyl-d-aspartate receptor encephalitis in southern China: Analysis of 111 cases. J Neuroimmunol. (2021) 352:577479. doi: 10.1016/j.jneuroim.2021.577479
Keywords: autoimmune encephalitis, children, positron emission tomography, semi-quantitative, prognosis
Citation: Li Z, Wu J, Wu S, Guo S, Cao M, Cheng W, Wang H, Li L and Yin Y (2025) Towards an optimal diagnostic and prognostic model based on semi-quantitative assessment of 18F−FDG PET in children with autoimmune encephalitis. Front. Immunol. 16:1457758. doi: 10.3389/fimmu.2025.1457758
Received: 01 July 2024; Accepted: 26 February 2025;
Published: 02 April 2025.
Edited by:
Kelli M Money, University of Colorado Anschutz Medical Campus, United StatesCopyright © 2025 Li, Wu, Wu, Guo, Cao, Cheng, Wang, Li and Yin. This is an open-access article distributed under the terms of the Creative Commons Attribution License (CC BY). The use, distribution or reproduction in other forums is permitted, provided the original author(s) and the copyright owner(s) are credited and that the original publication in this journal is cited, in accordance with accepted academic practice. No use, distribution or reproduction is permitted which does not comply with these terms.
*Correspondence: Ling Li, bGlsaW5nQHhpbmh1YW1lZC5jb20uY24=; Yafu Yin, eWlueWFmdUB4aW5odWFtZWQuY29tLmNu
†These authors have contributed equally to this work and share first authorship
‡ORCID: Yafu Yin, orcid.org/0000-0002-4818-6655