 Cezar Valeriu Băluţă1,2
 Luminiţa Voroneanu1,2Ionuţ Nistor1,2
 Lucian Siriteanu1,2*Andreea Simona Covic1,2Raluca Erika Irimie-Băluţă1,3
 Mehmet Kanbay4Adelina Vasilica Miron1,2
 Adrian Constantin Covic1,2
- 1Grigore T. Popa University of Medicine and Pharmacy, Iaşi, Romania
- 2Spitalul Clinic Dr. C. I. Parhon, Iaşi, Romania
- 3Sfanta Parascheva Clinical Hospital for Infectious Diseases, Iaşi, Romania
- 4Department of Medicine, School of Medicine, Koc University, Istanbul, Türkiye
Background: Serum creatinine and proteinuria remain the most frequently used test for monitoring allograft function. However, they are non-specific and insensitive markers. Metabolomics is an emerging field, dealing with the high-throughput identification and quantification of small molecules metabolites. We aimed to systematically review all available data regarding kidney transplantation and metabolomics.
Methods: This is a systematic review evaluating metabolomic usage in kidney transplant patients. A comprehensive search was assembled in the time span extending from inception until March 2024 across MEDLINE (PubMed), Embase and Cochrane. In addition to the databases above, eligible citation were sought through the screening of ClinicalTrials.gov and Google Scholar. Two authors assessed potential citations for eligibility and quality and extracted all data.
Results: A total of 57 articles were identified for inclusion (totaling 3821 patients), containing different methodologies and outcomes related to metabolic profiling. We aimed to offer support for finding new biomarkers that could aid in the evaluation of the kidney transplant patient, covering pathophysiological mechanisms and exploring avenues for personalized care.
Conclussion: Our systematic review underlines the possible role of metabolomics in monitoring kidney transplant patients. By integrating data from numerous studies, we have detected possible new biomarkers that might transform the method we screen kidney transplant recipients.
1 Introduction
Chronic kidney disease (CKD) unfortunately remains a global healthcare burden (1), affecting more than 10% of the worldwide population. With a progressive evolution, its prevalence is higher in women, older individuals and some racial minorities (2). WHO reports that the number of CKD related deaths has risen, pushing CKD from the 13th place to the 10th place of top causes of death worldwide (3). Kidney transplantation is the gold-standard treatment for end stage kidney-disease (4). Despite the continuous evolution of immunosuppressive therapies which led to an improvement in the overall survival rates of both the allograft and the allograft recipients, long-term outcomes remain plagued by the persistence of allograft dysfunction (5), rejection risk (6) and opportunistic infections (7).
Serum creatinine and proteinuria remain the most frequently used test for monitoring allograft function. However, they are non-specific and insensitive markers which often cannot indicate early dysfunction (5). Some centers additionally use protocol kidney graft biopsies. While being the golden standard to evaluate graft structural and functional damage, kidney biopsies come with an associated procedure risk, the need for specialized pathologist and a higher cost, thus making them inconvenient and not readily available. Additionally, transplants can fail for many reasons other than acute graft rejection, including pre-operative organ stress, surgical complications and infectious complications, which cannot be predicted or diagnosed through graft biopsy. Immunosuppressive therapy can also damage the kidney directly and can also expose the patient to an increased risk of developing atherosclerosis, bone disease, chronic viral infections, diabetes, lymphoma or hypertension. The development and usage of novel techniques is the next logical step for an early diagnosis of a failing graft.
Metabolomics is an emerging field, that was developed in the early 2000, dealing with the high-throughput identification and quantification of small molecules metabolites in the metabolome. The metabolome is identified as the collection of small molecule metabolites, either endogenous or exogenous, which can be found in a cell, organ or organism; the terms metabonomics, metabolomics and metabolic profiling are interchangeable and can be used when describing the above method. Metabolic profiling may differ depending on the technique that is used, each strategy having to make a “trade off” between sensitivity, automated and high-throughput and metabolite identification (8).
Extending the clinical research in the field of genomic and proteomic methods might help identify different signature molecules that could be used to monitor kidney graft function and identify the risk of allograft disfunction earlier and more robustly (9). The kidney’s capability to concentrate or filter small molecule metabolites and toxins could make it possible to detect changes in the kidney function reflected in the levels of these elements, or even in changes that may appear to the kidney proteome or transcriptome (10).
The potential benefits of metabolomics in kidney transplantation are emerging (11). Therefore, a systematic evaluation of existing literature is a natural and essential next step to consolidate current knowledge and identify possible research gaps. In this review we aim to systematically assess the utilization of metabolomics in patients who have undergone kidney transplant, focusing on elucidating the role of metabolomics regarding graft function, rejection, post-transplant complications, opportunistic infections and immunosuppressive therapy. To achieve this objective, we outline our methodological approach below, detailing the search strategy, selection criteria and extraction methods employed in this systematic review.
2 Materials and method
In this systematic review, the research questions were formulated using the PICO (Population, Intervention, Comparison, Outcome) framework as recommended by Preferred Reporting Items for Systematic Reviews and Meta-Analyse (PRISMA) guidelines. We followed the updated guidelines outlined by the PRISMA; this involved addressing every aspect, including the methodology of our procedure and the collection and presentation of data. Two independent reviewers screened and assessed the studies for eligibility, resolving any discrepancies through discussion or a third senior reviewer. The protocol was approved and registered on the Open Science Framework (OSF) platform: https://osf.io/f2chb/?view_only=0b3445e250e641b5928013b55378ae80.
No modifications or amendments were made to the original registration protocol throughout the course of this study. The scope, inclusion and exclusion criteria, data extraction and analysis methods, outcome measures, and timeline as specified in the initial registration were followed without any alterations.
2.1 Data sources and search strategy
A comprehensive search was assembled in the time span extending from inception until March 2024 across MEDLINE (PubMed), Embase and Cochrane. In addition to the databases above, eligible citation were sought through the screening of ClinicalTrials.gov and Google Scholar. The search strategy was designed to capture all possible relevant studies published up to the date mentioned above, employing a combination of keywords related to metabolomics and kidney transplantation as follows: “kidney”, “transplantation” “metabolomics”, “NMR”, “nuclear magnetic resonance”, “kidney transplantation”, “liquid chromatography–mass spectrometry”, “LC/MS”. The search strategy is presented in Picture a.
2.2 Inclusion and exclusion criteria
Studies were included if they met the following criteria: (1) evaluated the metabolomic profile/metabolites in adult or pediatric patients with kidney transplant. (2) were available in English language, (3) evaluated the metabolites in biological products such as blood, urine, saliva or fecal matters. Exclusion criteria were also applied, and consisted of: (1) studies focusing solely on no transplant populations (2) populations with multiple organ transplant and (3) studies that involved an animal model.
As the metabolomic field is a relatively nascent and rapidly evolving domain characterized by numerous unknowns, we opted to include in our review not only full-text articles but abstract-only studies and conference abstracts, if they met the following criteria: (1) relevance to the topic – abstracts focusing on metabolomic techniques, biomarkers or outcome related to kidney transplant patients were deemed eligible, (2) availability of essential information – abstracts needed to provide sufficient details on the study design, patient characteristics, metabolomics method used and key findings; (3) currency of data – only abstracts reporting on recent research conducted were included. The decision to include these abstracts without full text was based on the consideration that the metabolomic technology is rapidly evolving and the inclusion of conference abstracts allowed for a comprehensive tour d’horizon on the subject.
2.3 Data extraction and synthesis
Each study was independently assessed by 2 reviewers; discrepancy between reviewers were resolved by consensus or by consulting a third senior reviewer when necessary. The accuracy of the extracted data was performed by cross-checking each entry by a second reviewer against the original articles. The following data were extracted from qualified papers that fulfilled the inclusion criteria: primary investigator, year of publication, population sample, number of samples, biological product that was evaluated, outcome, follow-up and kidney biopsy if these two were mentioned.
2.4 Quality assessment
Assessing the quality of the studies that were included in this review was realized with the Newcastle-Ottawa Scale (NOS); this tool is widely accepted as a method to evaluate and stratify the quality of methodology of included studies and the risk of bias in non-randomized studies. The scale evaluates 3 aspects of each study: the group selection, comparability and exposure. Each study receives points based upon fulfilling the criteria, with higher score indicating lower risk of bias. A detailed evaluation of each study based on NOS can be found in Table 1.
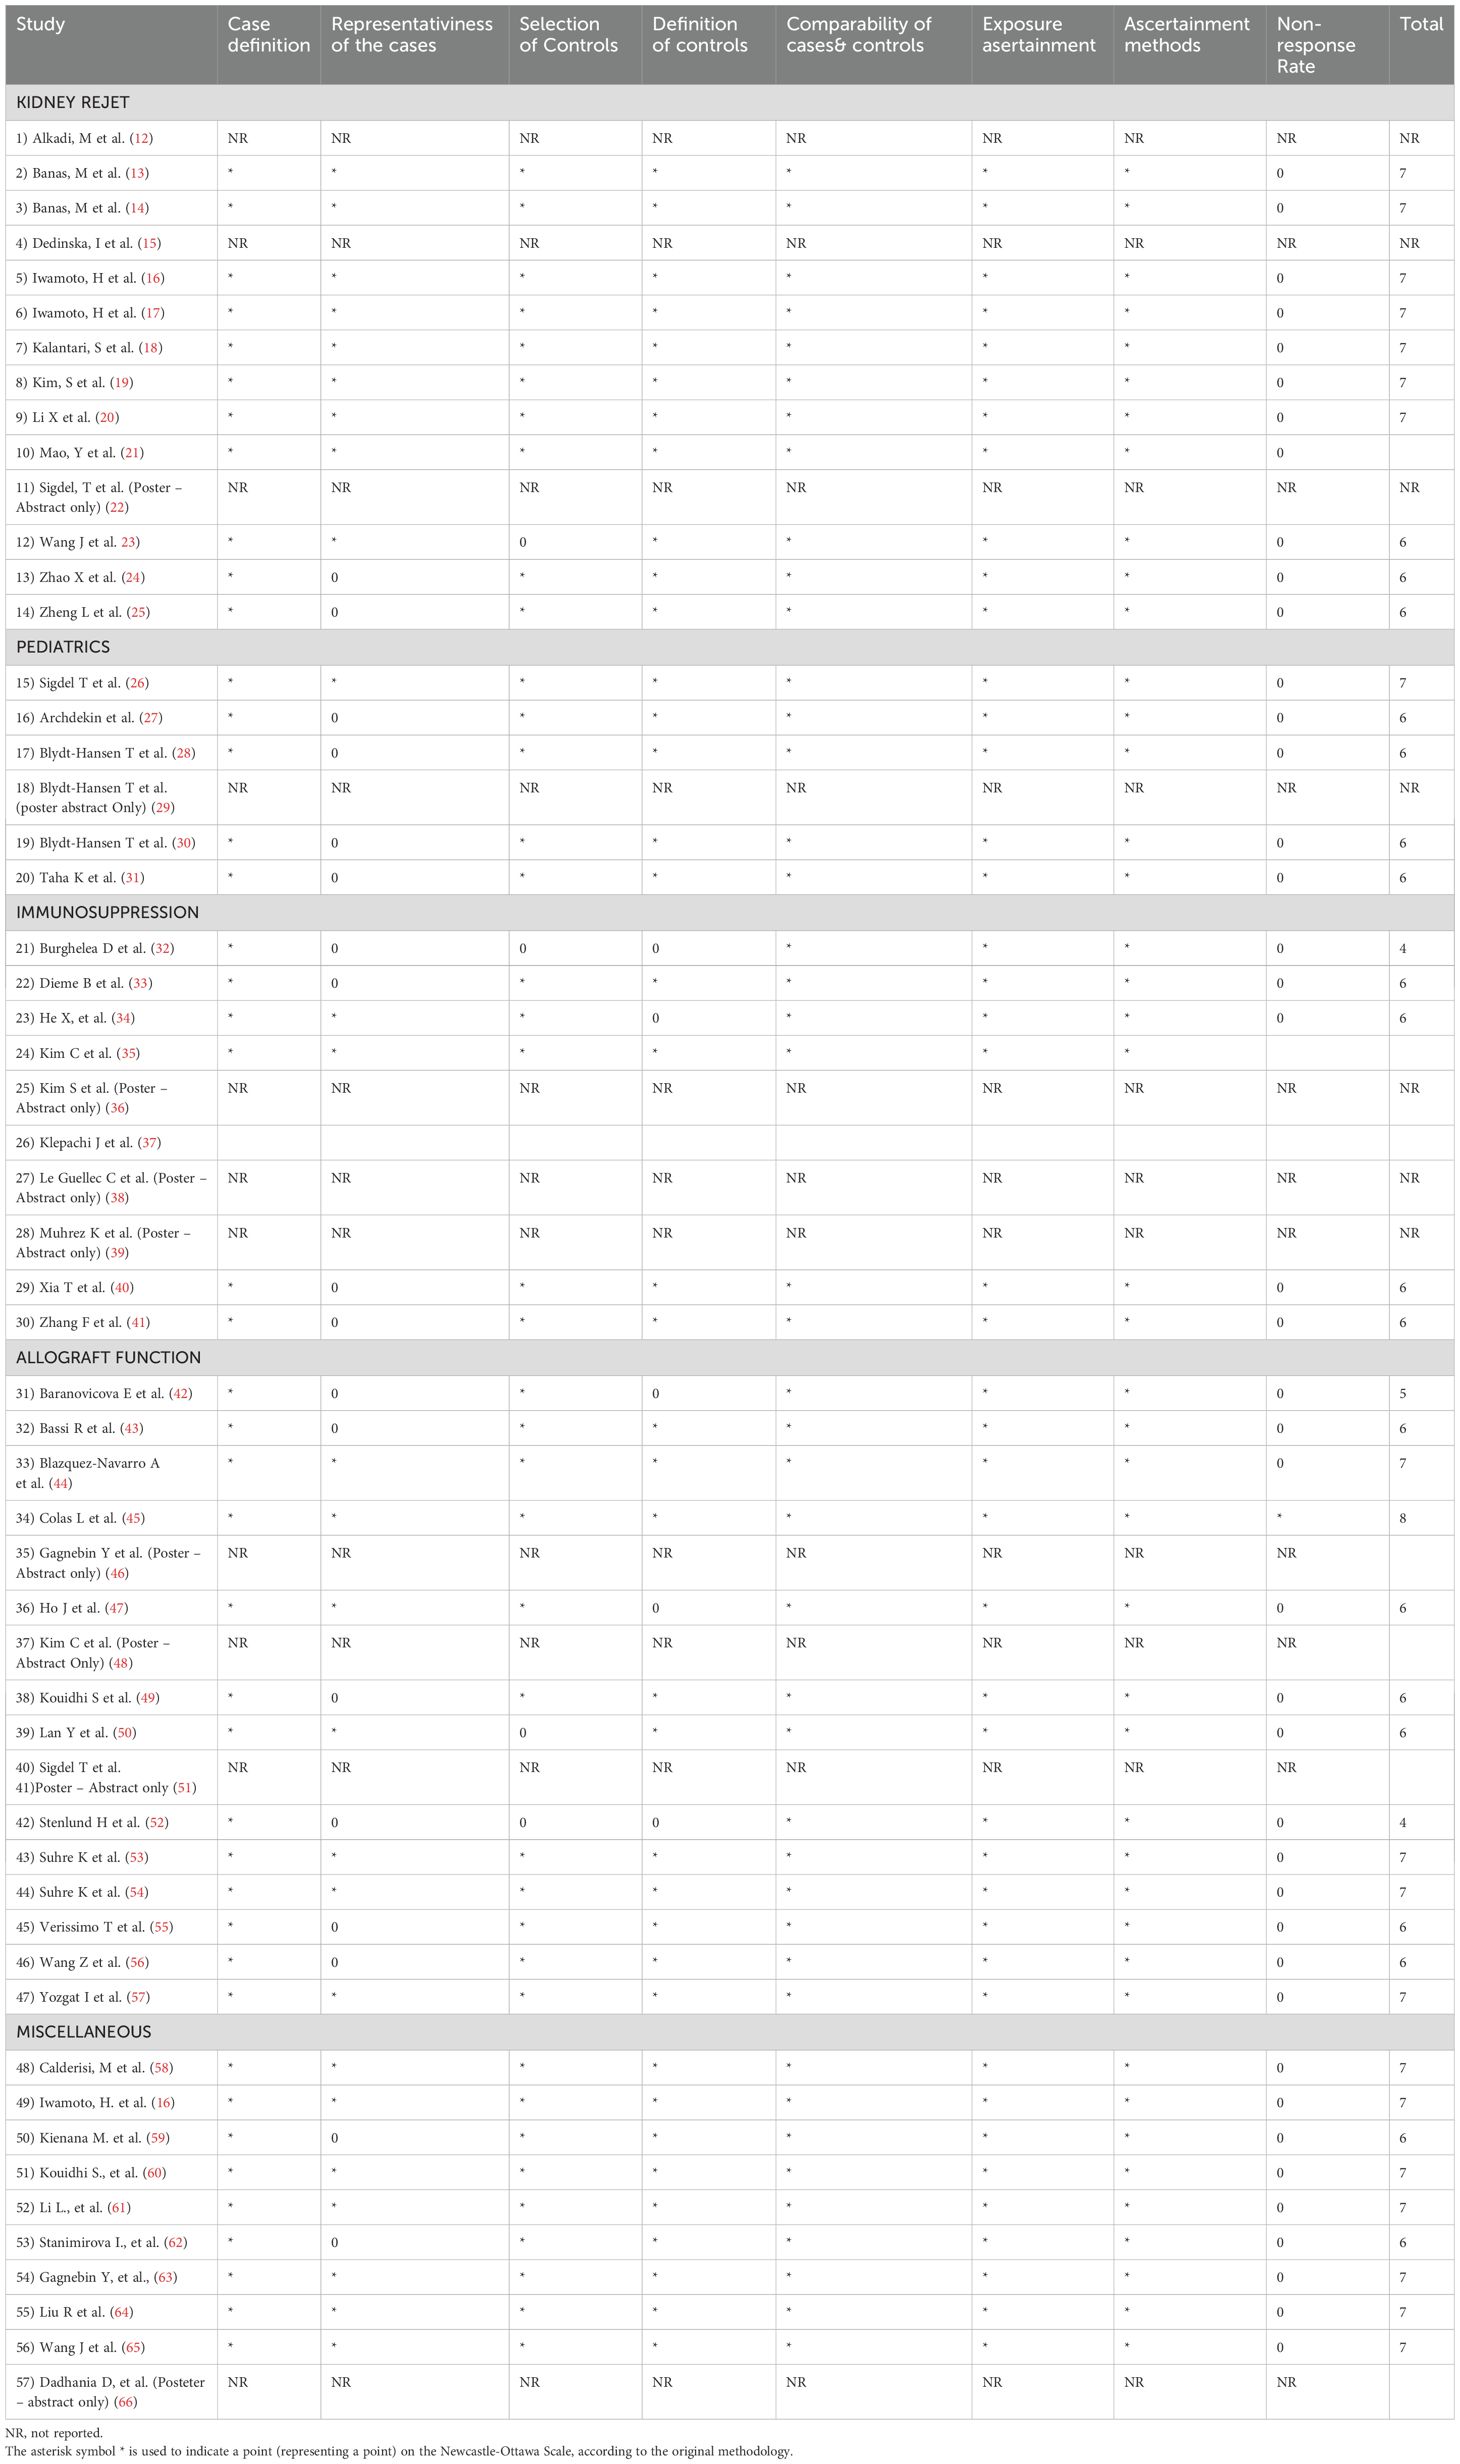
Table 1. Newcastle-Ottawa Scale.
Subjective interpretations while applying the scale coupled with studies that were missing information (conference abstracts or studies with limited reporting) that led to insufficient data available to apply NOS criteria, could impact the overall quality assessment. Additional aspects were discussed in the limitation section.
3 Results
In this systematic review, the current literature regarding the use of metabolomics in kidney transplant patients was analyzed and summarized. Through a thorough search and selection process, a total of 57 articles were identified for inclusion (totaling a number of 3821 patients), containing different methodologies and outcomes related to metabolic profiling in the context of kidney transplant. Our review aimed to offer support for finding new potential biomarkers that could aid in the evaluation of the kidney transplant patient, covering at the same time pathophysiological mechanisms and exploring avenues for personalized patient care.
Selected studies varied in design and included cohort and case-control studies. The sample size ranged from small cohorts (10 patients) to larger ones (up to 310), revealing a diverse representation of kidney transplant recipients across demographic and clinical profiles. As stated, different techniques were employed including mass spectrometry, chromatography-based techniques, nuclear magnetic resonance spectroscopy. Additional information regarding the studies included in this study are provided in Table 2 underlying relevant aspects including author details, publication year, study design, patient demographics, transplant details, immunosuppression information, hemodialysis vintage, and metabolomic utilized technique.
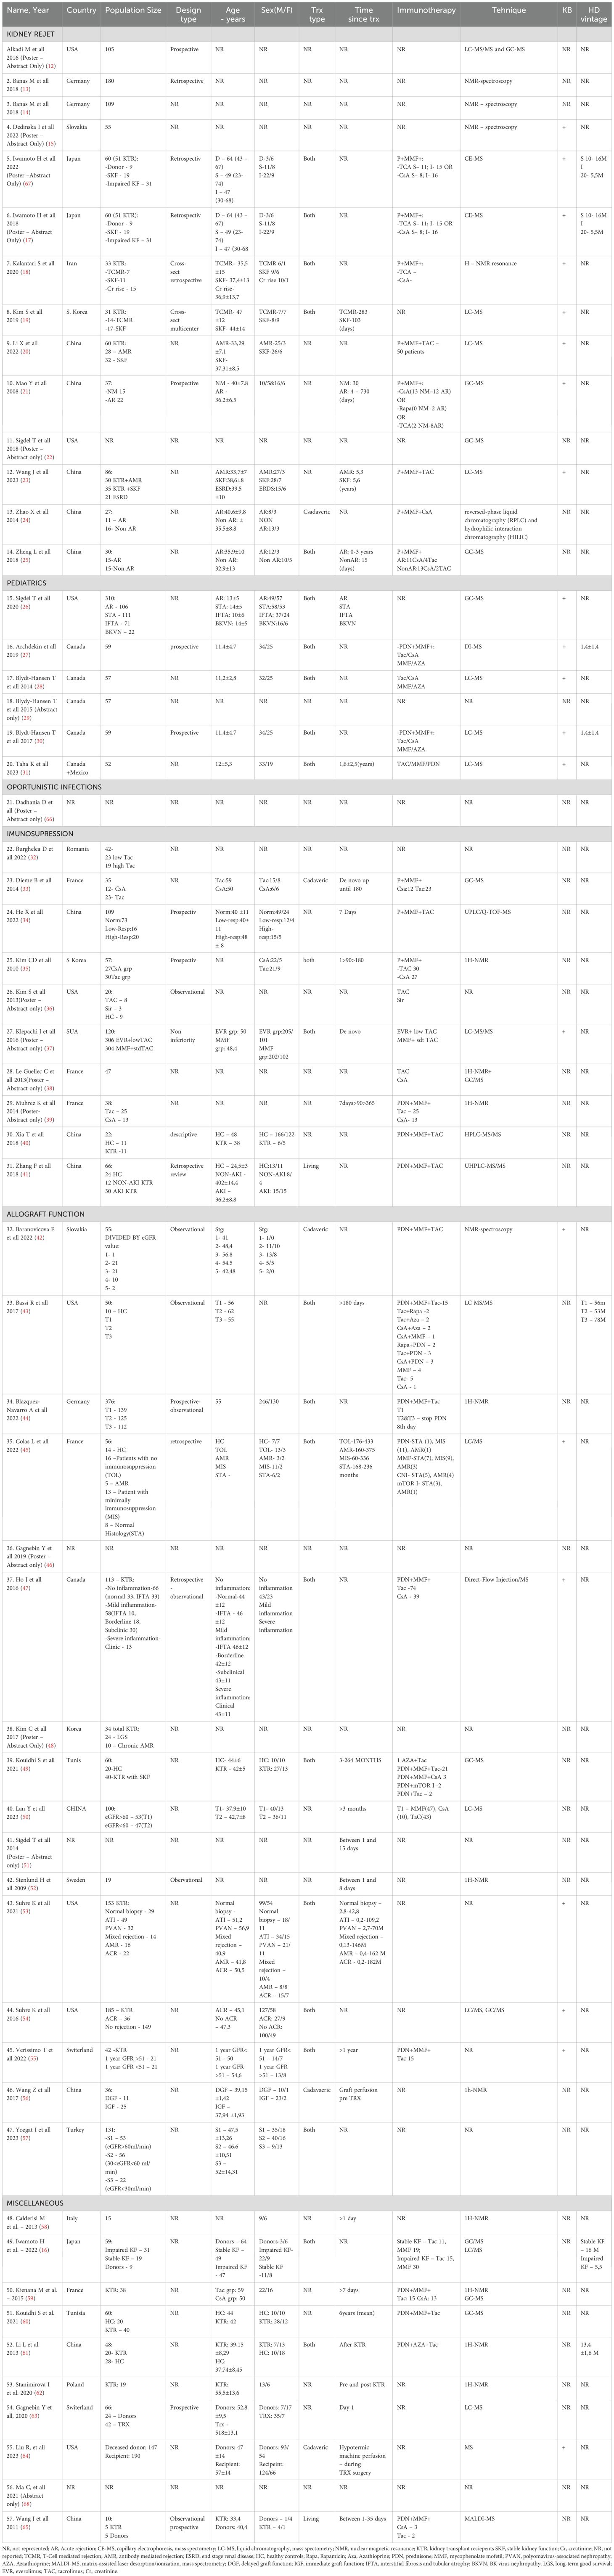
Table 2. General information.
The studies included were divided and grouped based on the outcome that was evaluated: allograft function, immunosuppression, the vast domain of graft rejection, miscellaneous, pediatric patients, opportunistic infections.
Across studies, consistent findings showed alterations in various metabolite profiles. Dysregulation in pathways related to lipid, amino acid and energy metabolism reflect the complex interaction between the transplanted organ, the host, medication and other factors.
The allograft function was the main outcome of 16 studies (totaling 1410 patients) (42–57). Details about the outcome are reported in the Table 3. These studies reports that certain metabolites from plasma/urine/feces alone or in combination could be used as a potential prediction tool to monitor kidney function. Studies involved a range of patient’s size from relatively small (19 pts) to larger cohorts (almost 400 pts) and collected blood, urine or fecal samples in order to establish the metabolomic profile. Different techniques were used; mass spectrometry and nuclear magnetic resonance remained the most commonly used. Baranicova et al. noted a higher glutamine plasma level in posttransplant patients undergoing acute cellular rejection and acute antibody-mediated rejections compared to patients without rejection. Another metabolite involved was histidine, whose plasma levels increased with serum creatinine and decreased with eGFR (42). In an elegant study, Wang et al. performed a graft perfusion with hypertronic citrate adenine II prior to the transplantation surgery. By testing 15 ml of the perfusate from the initial outflow of the allograft renal vein after transplantation, they revealed over 30 metabolites correlated with delayed graft function. Among them, citrate, a-glucose, betaine and taurine were underlined as having a significant correlation with delayed graft function (56).
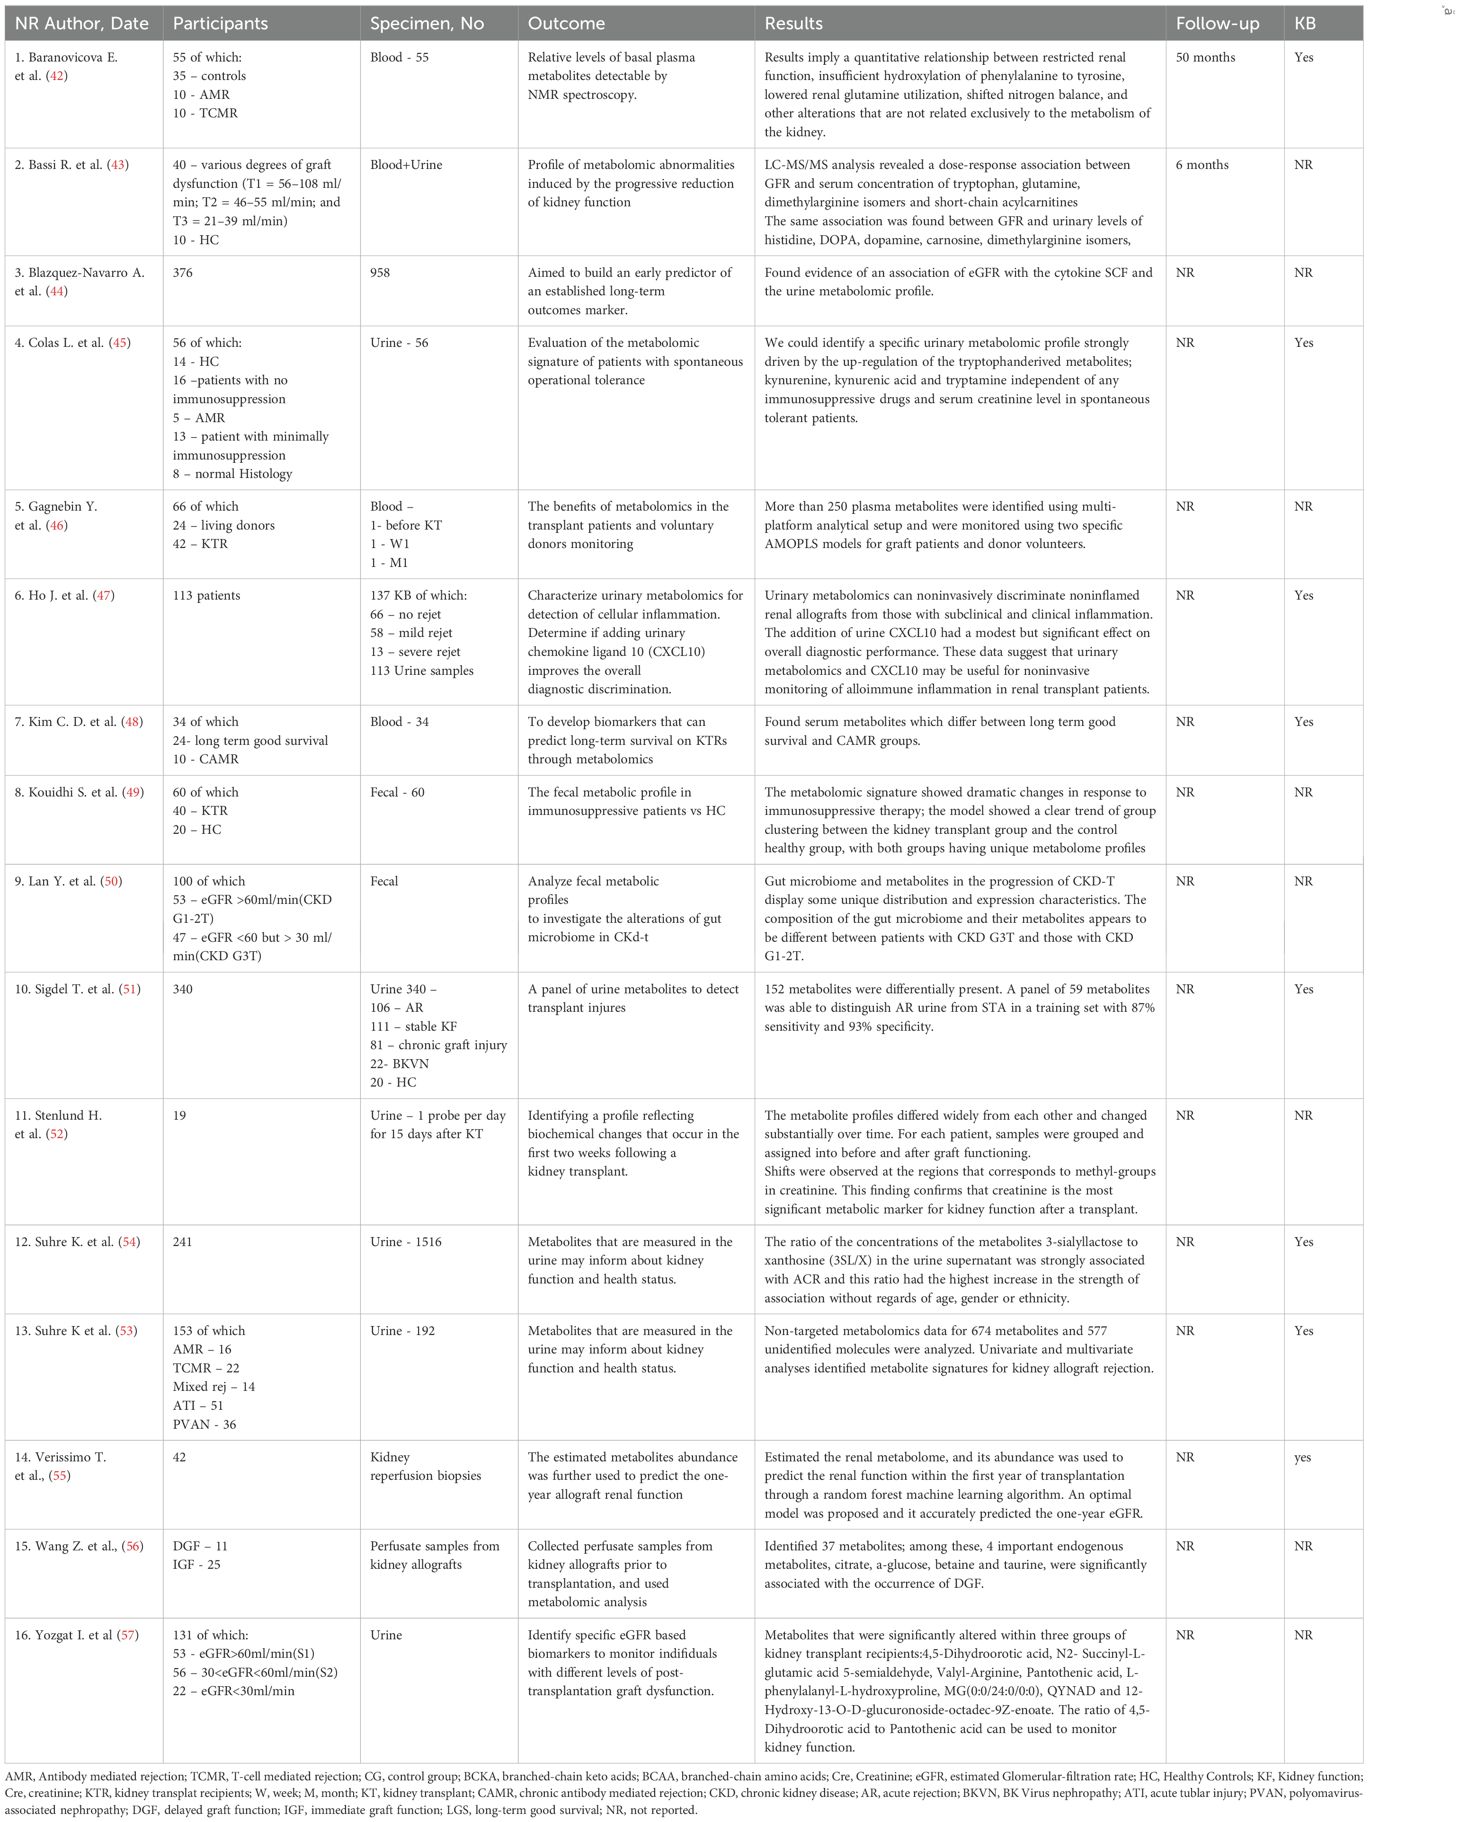
Table 3. Studies evaluating allograft function.
Focusing on the progression of metabolomic profile in the immediate posttransplant period (up to 15 days), Stenlund et al. illustrate the dynamic nature of metabolomic changes following transplantation (52). Their conclusion was that the metabolite profiles vary among individuals and change over time. Changes that become apparent in metabolites up to 6 months post-transplant (that reflect key metabolic changes in the accommodation process) were also evaluated by Stanimirova I et al., 19 patients with normal recovery post-transplant were included. Higher levels of valine, alanine, glutamine, methionine, GPC+APC, mannitol, glucose and lower levels of creatinine, citrate, myo-inositol, lactate, histidine, hippurate and adenine were identified in the post-transplant serum of patients when compared to pre-transplant. Moreover, the minimum number of metabolites that can be used to monitor renal function includes hippurate, mannitol and alanine. Specifically, it was found that the level of hippurate was more sensitive to changes in renal function, while monitoring the creatinine is appropriate for indicating large changes in renal function such as those before/after graft surgery. The most difficult distinction was for the metabolic state in the intermediate period after transplantation (T1 and T2) (62).
In patients with progressive reduction of kidney function, Bassi et al. showed a gradual elevation of glutamine levels compared to patients with preserved kidney function, suggesting a potential link between glutamine metabolism and progressive kidney dysfunction posttransplant. Additionally, an overall reduction in urinary levels of amino acids and biogenic amines in patients with poor graft function was also described. Among biogenic amines, the urinary concentration of carnosine was reduced in patients with a failing graft (43).
14 studies involving 813 patients had kidney graft rejection as a main outcome (12–15, 17–25, 67), with differentiation between antibody mediated rejection (AMR) and T cell mediated rejection (TCMR). Table 1 presents detailed information about the outcome. Table 4 outlines the metabolites that were identified and the trend they followed depending the type of rejection.
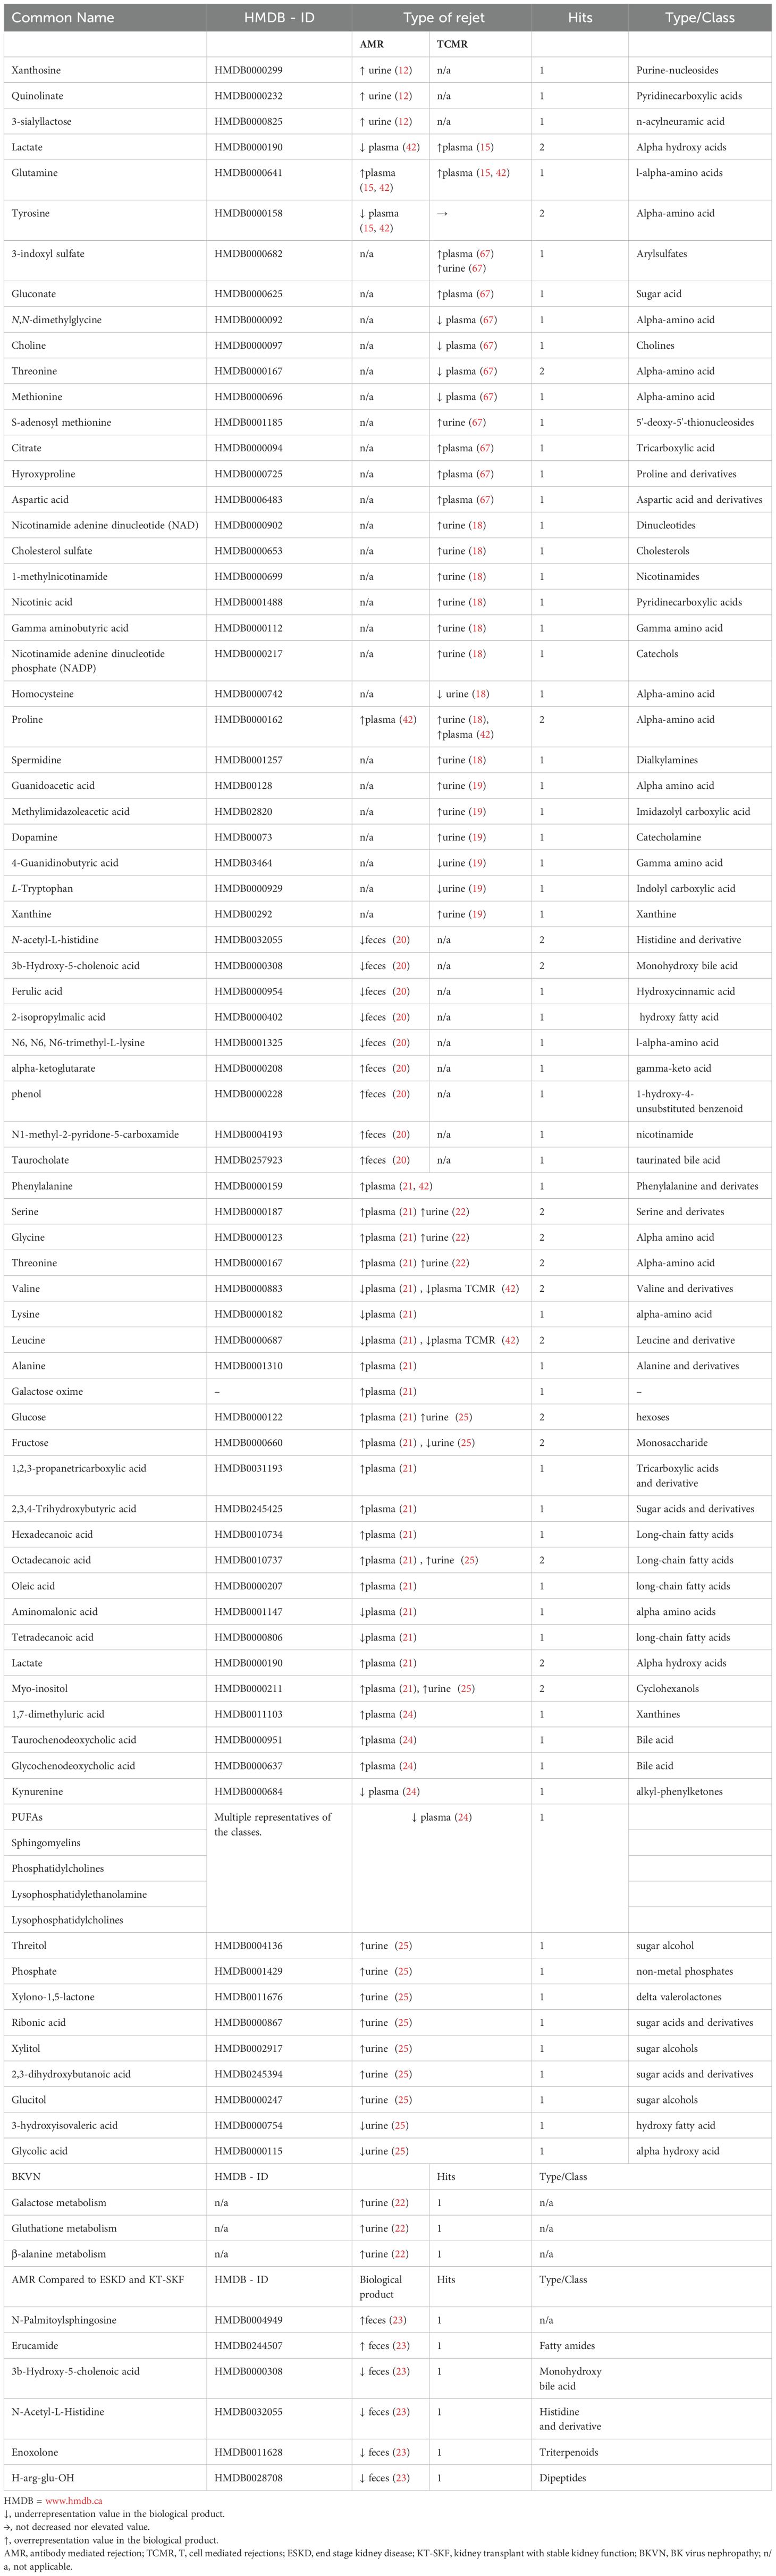
Table 4. Metabolite trends associated with different types of renal allograft rejection.
Discriminative metabolites of acute graft rejection after transplantation were detected, including creatinine, kynurenine, uric acid, polyunsaturated fatty acid, phosphatidylcholines, sphingomyelins, lysophosphatidylcholines, etc. Zhao et al. investigated serum metabolite profile in 27 patients undergoing kidney transplant. Among these, 11 were diagnosed with acute rejection. The lower level of serum dehydroepiandrosterone sulfate was found in the acute graft rejection group compared to those who did not present graft rejection (24).
Sigdel et al. conducted a comprehensive investigation of metabolites in distinct kidney transplant complication, comparing acute rejection, polyoma BK nephropathy, interstitial fibrosis and tubular atrophy (IFTA) with stable transplants (STA). In acute rejection versus stable transplant, 146 metabolites were significantly altered (42 increased and 104 decreased). Augmentation of starch and sucrose metabolism, galactose metabolism aminoacyl-tRNA biosynthesis, glutathione metabolism, and Glycine, serine and threonine metabolism during acute rejection was observed (22).
In a study by Kalantari et al., a panel of nine differential metabolites encompassing nicotinamide adenine dinucleotide, 1-methylnicotinamide, cholesterol sulfate, gamma-aminobutyric acid (GABA), nicotinic acid, nicotinamide adenine dinucleotide phosphate, proline, spermidine, and alpha-hydroxyhippuric acid were identified as novel potential metabolite biomarkers of T-cell mediated rejection. Proline, spermidine, and GABA had the highest area under the curve (>0.7). Additionally, the study underline nicotinamide and nicotinamide metabolism as the most important pathways associated with T cell mediated rejection (18).
The impact of immunosuppressive medication on the metabolite profile was the main outcome of 10 studies totaling a number of 556 patients (32–41). Details about this outcome are reported in the Table 5. Kouidihi S et al. highlighted the impact of immunosuppressive therapy, revealing that the metabolomic signature showed dramatic changes. 21 metabolites were identified and they could mainly be classified into 9 fatty acids and long-chain fatty acids, 3 phenolic compounds, 2 amino acids, and 7 other classified metabolites. The identified metabolites mainly correspond to alterations of biosynthesis of unsaturated fatty acids and tryptophan metabolism (49). Dieme et al. study offers helpful information into the urinary metabolomic profile of patients receiving calcineurin inhibitors. They identified different urinary metabolomic patterns at day 7, months 3 and 12 between the two groups treatment but also within each group over time. The principal metabolites presenting disparity levels between the two groups were mainly sugars, inositol, and hippuric acid (48). Similar information was offered by Le Guellec et al. using 1H-Nuclear Magnetic Resonance (NMR) and gas-chromatography/mass spectrometry (GC/MS) to profile urine samples of 47 kidney transplant patients, they identified specific metabolites, such as hippurate, lactate, and various sugars, that differentiated patients receiving TAC from those receiving CsA. Irrespective of the calcineurin inhibitor used, the urinary metabolite profiles differed between day 7 and month 3 or month 12 but was similar between month 3 and month 12 (49).
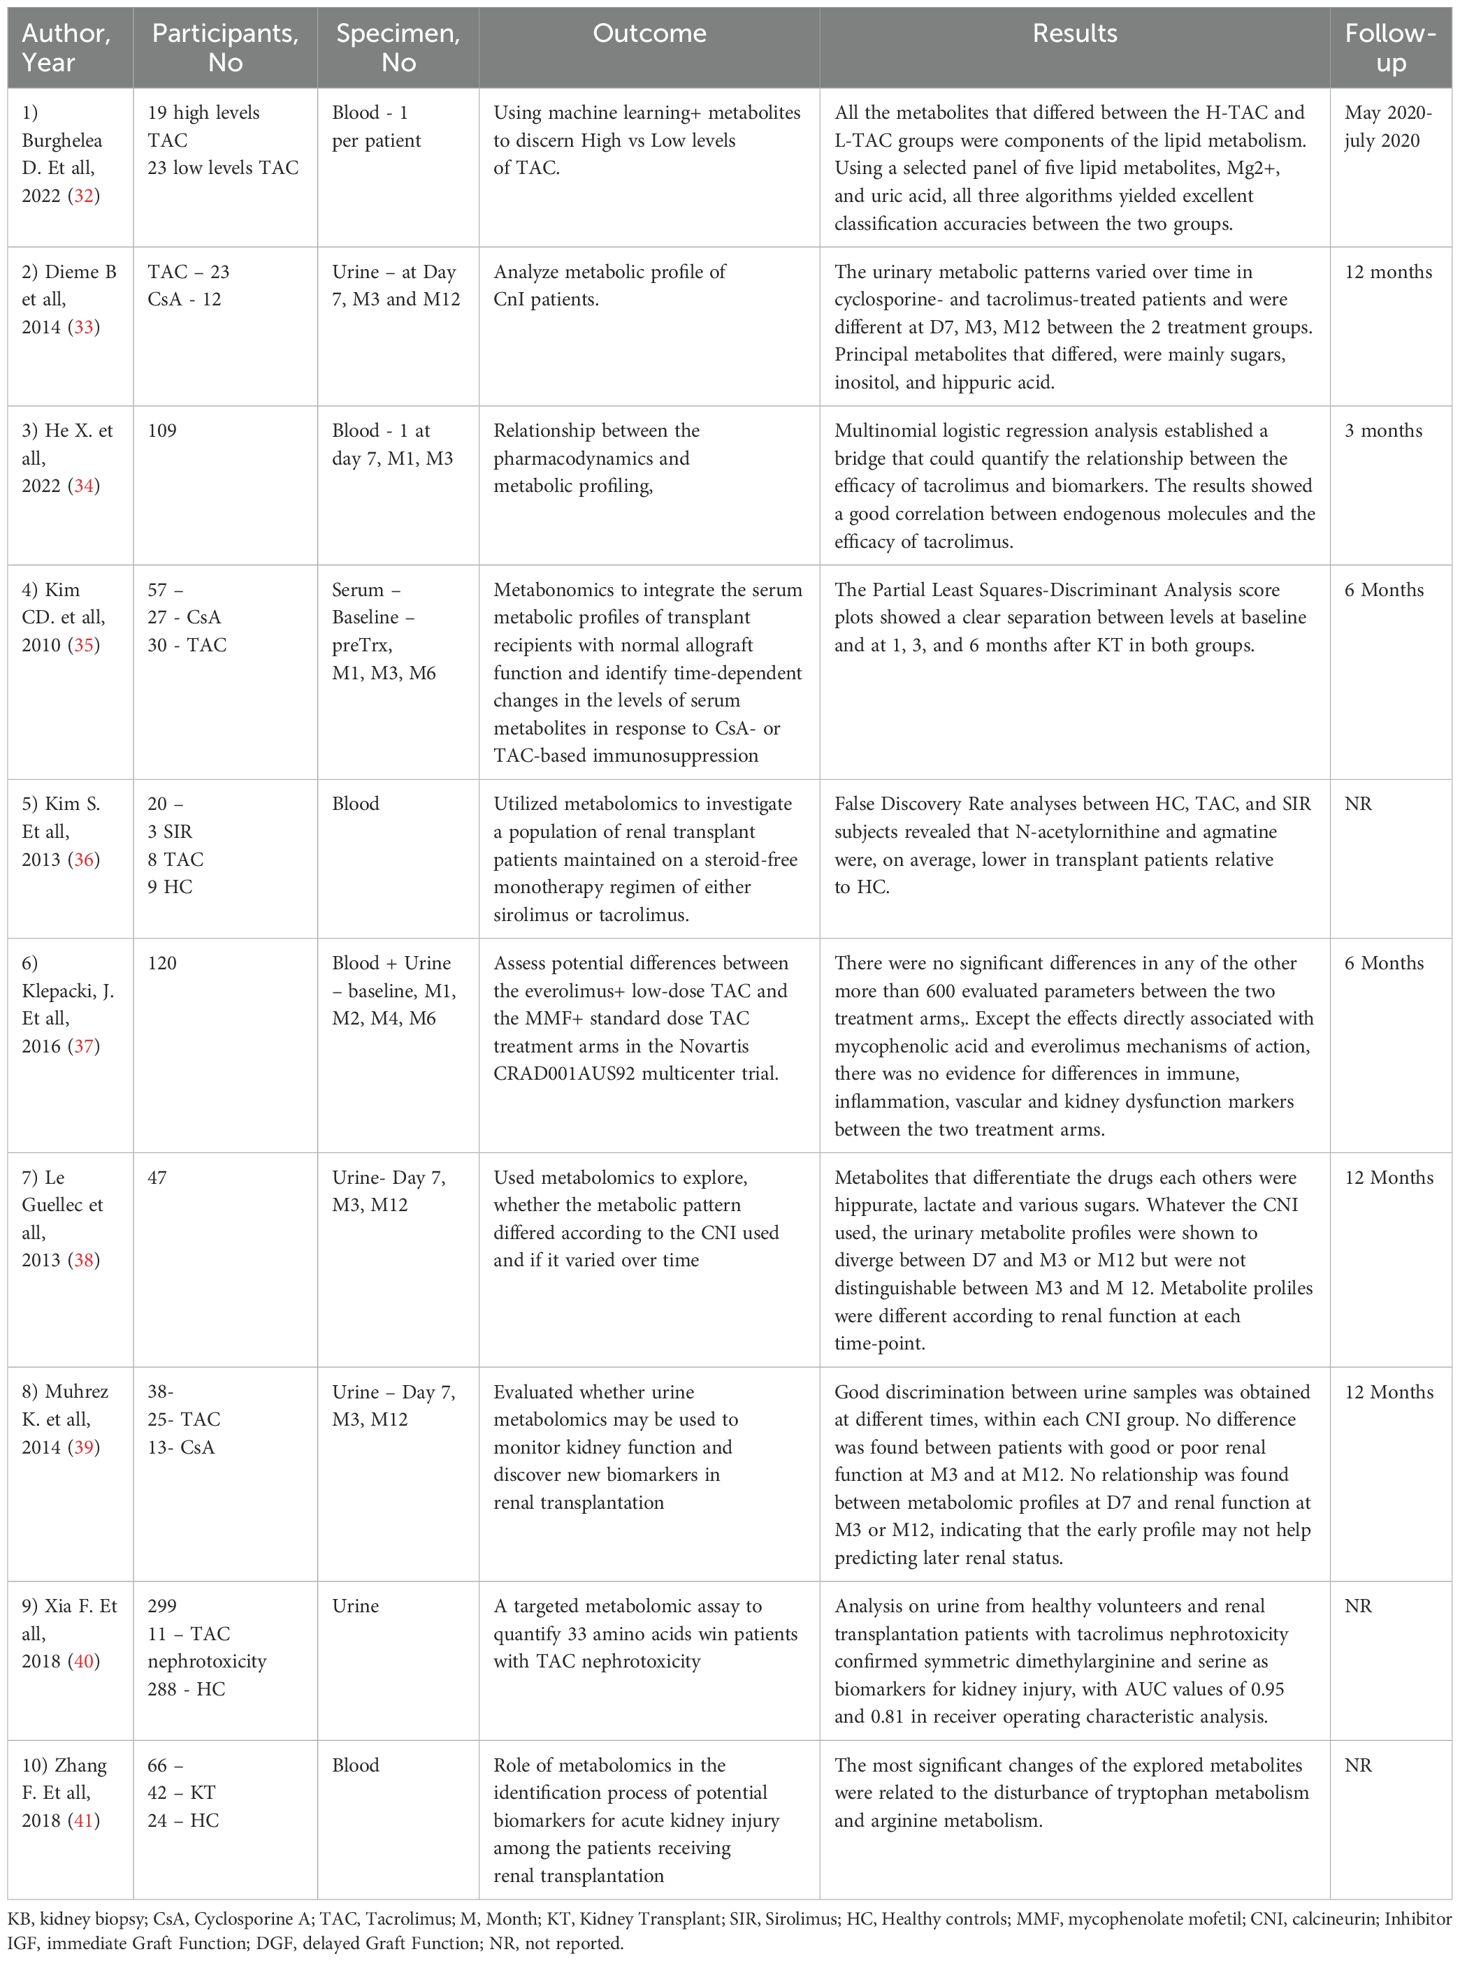
Table 5. Effect of immunosuppressive medication on metabolomic profile.
Steroids, one of the first classes of medication used in kidney transplantation, are a cornerstone in the treatment of kidney graft recpients (69). Considering the important side effects, efforts were made to develop a steroid free treatment regime that could provide valuable advantages in kidney transplant patients. Kim S et al. evaluated a population of steroid free patients with monotherapy with either Sirolimus or tacrolimus. They further explored metabolic differences between these patients and healthy controls. Their analysis revealed that N-acetylornithine and agmatine levels were, on average, lower in transplant patients compared with healthy controls. KEGG pathway mapping based on these metabolites showed that arginine and proline metabolism was significantly affected between the patient groups (36).
Metabolomic approaches have been used to investigate the different alterations associated with opportunistic infections (66). In the aforementioned study, Sigdel et al. compared metabolomic profile in patients with polyoma BK nephropathy versus stable kidney and founded that 90 metabolites were increased and 73 were decreased between groups. The variable selection using random forests methods generated a panel of four metabolites - arabinose, 2-hydroxy-2-methylbutanoic acid, octadecanol, and phosphate, that distinguish BKVN from stable kidney transplant. Detailed findings of the outcome analysis are presented in Table 4, summarizing the results of the included studies, and their implication for kidney transplant patients (51).
In addition to the categories presented above, we identified a subset of studies that did not fit in these categories, so we proceeded in labeling them as miscellaneous (16, 58–65, 68). These studies covered a mix of topics such as: metabolite profile evolution over time after kidney transplant (Gagnebin et al. (63)), metalomics in tubular injury (Wang J, et al. (65)), general profiling of kidney transplant recipients – blood, urine, saliva (Iwamoto et al. (16)). Even if these studies did not evaluate primary outcomes of interest, they provide valuable and detailed information into other aspects of metabolomics usage in kidney transplant patients, and contribute to the overall understanding of the topic. Details regarding outcome are provided in Table 6.
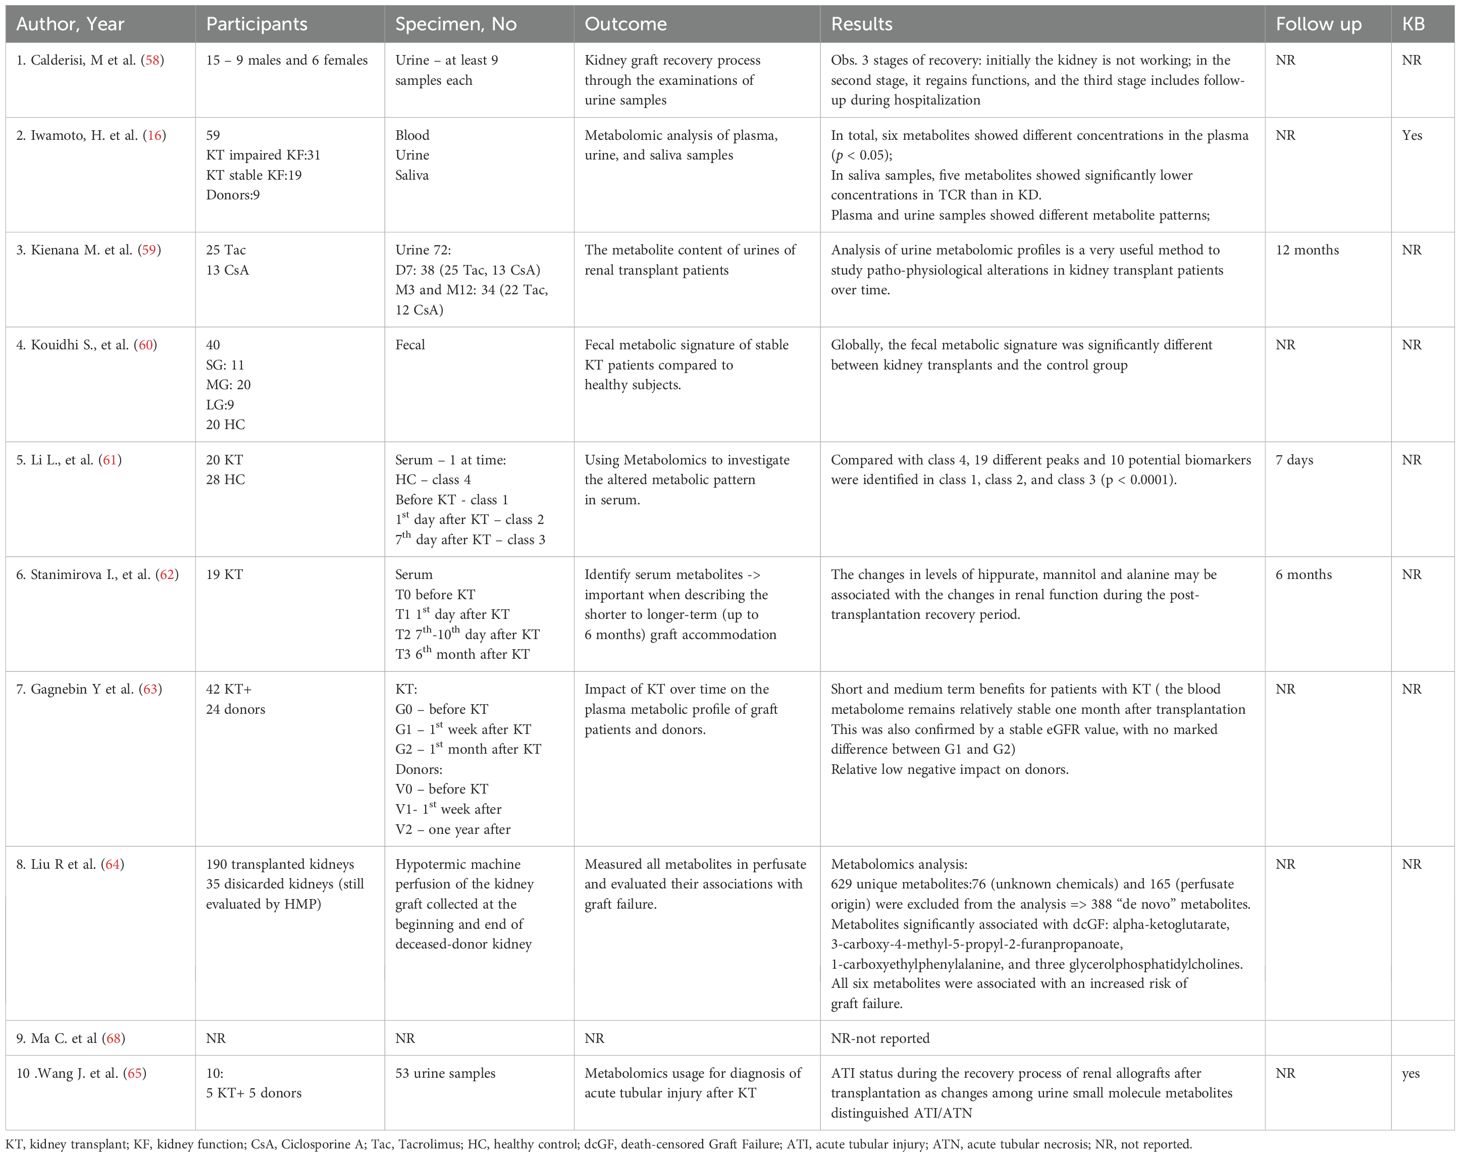
Table 6. Summary of other study outcomes.
In a population of 40 stable kidney transplant participants and 20 healthy controls Kouidhi S et al. (60) compared the fecal metabolic signature between these two cohorts. They observed variation in several metabolic pathways of Ubiquinone and other terpenoid-quinone biosynthesis, tyrosine metabolism, tryptophan biosynthesis and primary bile acid biosynthesis, due to immunosuppressive therapy. The study suggests that the tyrosine metabolism pathway may be predominantly linked with kidney transplantation period and immunosuppressive therapy. Additionally, it seems that there was no difference in endogenous metabolites between long-term and short-term post-transplant patients, indicating that these metabolic alterations do not appears to be strongly influenced by the length since transplant (60).
Studies that evaluated the pediatric population were identified and evaluated (26–31). 6 studies with a total of 537 patients were included. Outcomes can be found in Table 7.
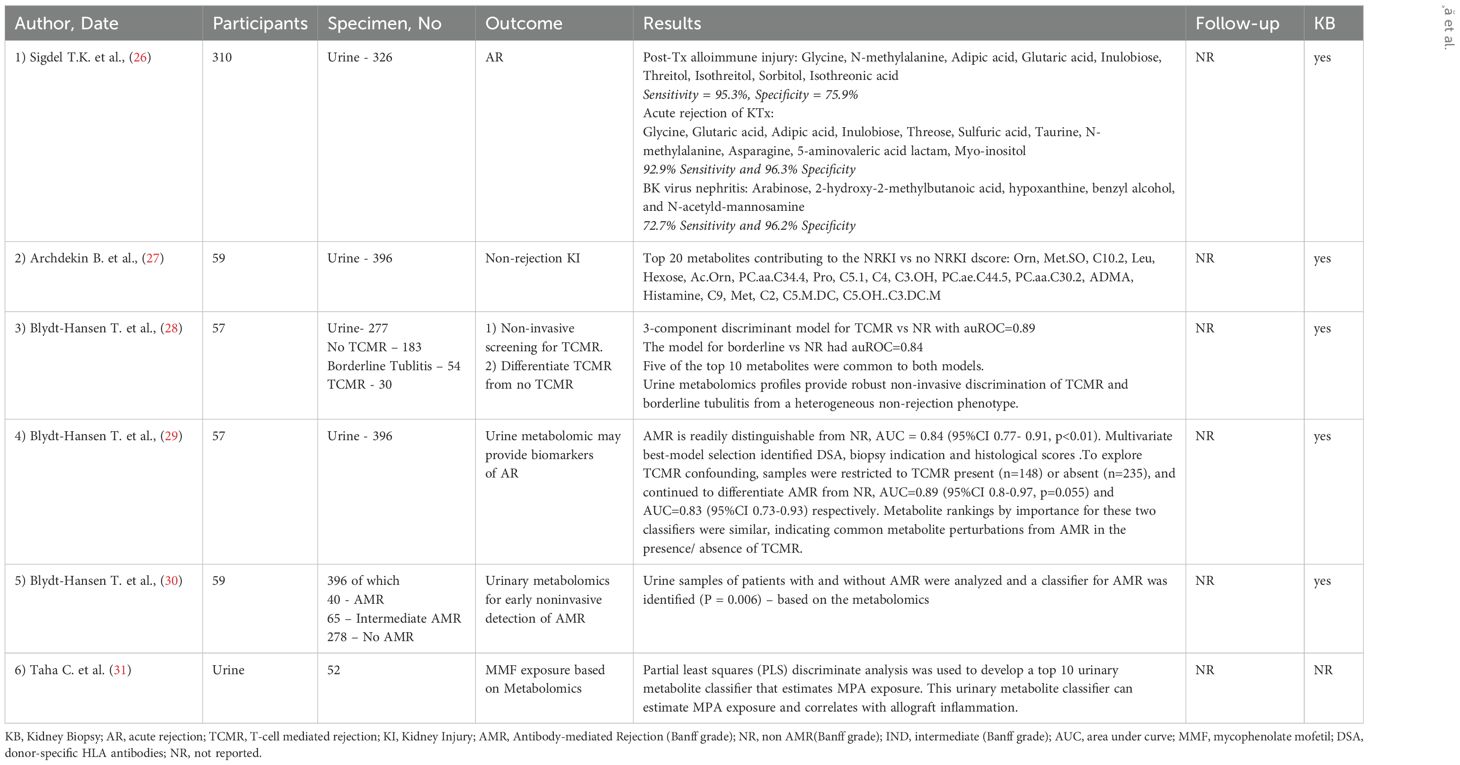
Table 7. Studies evaluating pediatric kidney transplant recipients.
Sigdel et al. in a 2020 study, evaluated allograft disfunction caused by different causes. Using advanced data analysis techniques, including pattern recognition and selection, involving methodology that performed a rigorous scan of the dataset, they could conclude that a panel of 9 metabolites could be used accurately classify post-transplantation alloimmune injury; for acute rejection a metabolite marker panel of 11 metabolties could be used to detect acute rejection. As for BK virus nephropathy (BKVN) 5 metabolites were identified as BKVN-specific metabolites Arabinose, 2-hydroxy-2-methylbutanoic acid, hypoxanthine, benzyl alcohol, and N-acetyl-d-mannosamine). Pathway analysis for enrichment identified nitrogen metabolism, ascorbate and aldarate metabolism, and amino sugar and nucleotide sugar metabolism as the three most significantly enriched pathways (26).
Assessing the quality of the studies that were included in this review was realized with the Newcastle-Ottawa Scale (NOS); this tool is widely accepted as a method to evaluate and stratify the quality of methodology of included studies and the risk of bias in non-randomized studies. The scale evaluates 3 aspects of each study: the group selection, comparability and exposure. Each study receives points based upon fulfilling the criteria, with higher score indicating lower risk of bias. A detailed evaluation of each study based on NOS can be found in Table 1.
4 Discussion
The field of metabolomics is relatively new and continues to expand with rapidly emerging insights. Exploring findings from other areas, such as hematopoietic stem cell transplantation, can offer valuable strategies for application in kidney transplantation. A novel concept evaluated to gain deeper insights into a major complication afflicting allogeneic hematopoietic stem cell transplantation—graft-versus-host disease—could also hold potential application in kidney transplantation: metabolomic reprogramming. Metabolic pathways such as fatty acid oxidation and glycolysis play an important role in T cell function in the context of graft versus host disease. While the activity of pro-inflammatory effector T cells is driven by glycolysis, fatty acid oxidation plays a role in stabilizing regulatory T cells (Tregs). These results suggest a possible new strategy for preventing graft rejection. Combining an inhibition of glycolysis while simultaneously enhancing fatty acid oxidation to boost Treg stability, could lead to a more tolerant immune environment (70). Furthermore, Tomaszewicz M. et al., in a recent study, highlighted that targeted metabolic modulation could enhance Treg efficacy in promoting immune tolerance with a nuanced perspective: modulation toward a particular metabolic stage of Tregs that may improve or weaken cell stability and function. This approach could allow the adaptation of Treg responses based on specific needs -maintaining activation during infections or suppressing it when autoimmunity occurs (71).
Our systematic review underlines the substantial role of metabolomics in improving the understanding and management of kidney transplantation. The findings from the review offer several significant suggestions for clinical practice and future research.
4.1 Metabolomics as a tool for monitoring allograft function
The reviewed studies constantly establish that certain metabolites can function as consistent biomarkers for monitoring kidney allograft function. For example, elevated levels of glutamine and histidine have been linked with acute rejection, whereas a mixture of metabolites such as hippurate, mannitol, and alanine has been proposed as subtle indicators of renal function fluctuations. These biomarkers can possibly complete the customary methods such as serum creatinine and eGFR, delivering a more subtle interpretation of allograft status and possibly permitting a prompt intervention in cases of dysfunction.
Despite progresses in immunosuppressive regimens, rejection continues to be one of the biggest concerns confronted by both patients and their physicians. Prompt diagnosis and optimal management are essential for improving patients’ prognosis. Ultrasound-guided biopsies of the transplanted kidney are the contemporary gold standard for identifying rejection. However, hematoma, gross hematuria or hydronephrosis are sporadic but tangible complications. The ability to differentiate among several rejection types across metabolites such as creatinine, kynurenine, and sphingomyelins delivers a hopeful opportunity for personalized medicine. For example, several urine metabolites (Ribonic acid, glycolic acid, 3-hydroxyisovaleric acid, and octadecanoic acid) have been recognized as potential biomarkers to efficiently differentiate between acute renal allograft rejection and stable transplant recipients. Diagnostic sensitivity and specificity were determined as 80 and 86.7% respectively, with accurate diagnosis of 12 out of 15 renal allograft patients with acute rejection and 13 out of 15 patients with stable kidney function (25). Furthermore, a panel of nine difference metabolites encompassing nicotinamide adenine dinucleotide, 1-methylnicotinamide, cholesterol sulfate, gamma-aminobutyric acid (GABA), nicotinic acid, nicotinamide adenine dinucleotide phosphate, proline, spermidine, and alpha-hydroxy hippuric acid were distinguished as novel potential metabolite biomarkers of T cell mediated rejection (18). Another frequent complication of kidney transplantation that needs addressing represents ischemia-reperfusion injury. A severe condition that is mainly related to donor and recipient factors coupled with graft manipulation during storage. Further involving mechanisms such as oxidative stress, metabolic changes, cell death, microvascular damage and tubular damage are ultimately leading towards kidney damage: metabolomic studies could help establishing a nephroprotective strategy. Identifying pathways with specific molecular signature, metabolic check-points that could be further modulated through various interventions, represent just a few of the of the numerous possibilities metabolomics offers in uncovering novel therapeutic targets, refining precision medicine approaches, and deepening our understanding of complex biological systems (72).
Moreover, the dynamic nature of metabolomic variations following transplantation, as detected in studies by Stenlund et al. and Stanimirova I et al., underlines the value of constant monitoring. The proximate post-transplant period contains important metabolic shifts as the body adjusts to the new organ; several metabolites such as valine, alanine, glutamine, methionine, GPC (glycerophosphocholine) + APC, mannitol, glucose and lower levels of creatinine, citrate, myo-inositol, lactate, histidine, hippurate and adenine had relatively higher levels compared to the metabolite levels that were determined before transplantation. Additionally, the variations in levels of hippurate, mannitol and alanine may be related with the variations in renal function during the post-transplantation recovery period. Precisely, the level of hippurate (or histidine) is more sensitive to any short-term changes in renal activity than creatinine (62). These findings emphasize the need for ongoing metabolomic assessment to seizure the developing metabolic landscape and address possible complications proactively.
4.2 Pediatric considerations and miscellaneous findings
The subdivision of studies concentrating on pediatric patients and additional various topics, for instance the influence of tubular injury and general metabolite profiling, supplements the complete understanding of metabolomics in kidney transplantation. The pediatric population exhibits unique challenges in the setting of kidney transplantation and management. Medication dosing, interactions with the growth factors that are specific to this age and different particular pathophysiologic pathways pose a unique twist in this category. Also, in this population a defined urinary metabolite profile was correlated with T cell mediated rejection; 10 urinary metabolites, including Proline, Kynurenine, and Sarcosine, were noticed to be the most important; of these metabolites, 5-10 appeared to be shared with borderline tubulitis, advocating that allograft injury associated with the T cell-mediated alloimmune response may occur on a continuum of severity. A urinary metabolite signature associated with non-rejection kidney injury in pediatric kidney transplant recipients was also investigated in a single-center pediatric cohort study (28). 20 quantified urinary metabolites were associated with kidney injury independent of acute rejection; of these, proline, ADMA, urinary hexose, butyrylcarnitine, acetylcarnitine and non-acylcarnitine were associated with inflammatory injury. Increased urinary acylcarnitines have also been recognized in patients with diabetic kidney disease who have developed micro- or macroalbuminuria. Urinary carnitine may insinuate mitochondrial and proximal tubule injury. Each of these metabolites makes a relative influence to discrimination, but it is the patterned modification in metabolism characterized by all of these metabolites collectively that delivers robust discrimination (27).
While the outcomes were categorized broadly into areas such as kidney rejection, immunosuppression, and graft function, which might facilitate the aggregation of results and their interpretation, the variability across studies concerning design, patient demographics such as underlying conditions, the age of kidney transplants, as well as how outcomes were defined, measured, and reported, created considerable difficulties in quantitatively combining the results. Moreover, the studies referenced in our paper were typically examining different metabolites that were not directly comparable across the various studies.
5 Limitations and future directions
We can highlight some strong points regarding our review. We performed an extensive database coverage, ensuring thus that our review included studies from multiple databases, such as the ones listed above; we also included conference abstracts, reports avoiding thus some publication bias or missing some unpublished articles that may have had significant findings. We have precise criteria for selecting studies resulting thus in consistency and transparency. We utilized tools for assessing the quality of our included studies (Newcastle-Ottawa Scale).
While the review underlines promising opportunities for metabolomic uses in kidney transplantation, some limitations demand attention. Despite the efforts made that the bibliographical search would be as complete as possible, with double checking the databases for an exhaustive process, some articles, relevant to the topic, may have not been found and therefore omitted from this review. An additional limitation is the English language, as we included studies that were written primarily in English. This may have excluded other potential relevant studies published in other languages, thus having a potential impact on our findings The heterogeneity in study designs, missing demographic data, sample sizes, and metabolomic techniques are challenges in normalizing findings. In addition to these challenges, missing information could impact the quality assessment considering that the NOS has its limitations Moreover, the cross-sectional nature of many studies limits the ability to establish causal relationships between metabolomic changes and clinical outcomes. Future research should focus on larger, multicenter longitudinal studies to validate identified biomarkers and explore their clinical utility in routine practice with an emphasis on enhance methodological consistency that is needed to facilitate better synthesis and interpretation of findings.
6 Conclusion
In conclusion, our systematic review underlines the possible role of metabolomics in monitoring kidney transplant patients. By integrating data from numerous studies and analyzing metabolomic profiles in blood, urine, and fecal samples, we have detected possible new biomarkers that might transform the method we screen kidney transplant recipients. Including other ‘omics’ technologies, such as genomics and proteomics, could extend our consideration of the molecular mechanisms behind graft rejection and dysfunction. This multi-omics approach could deliver complete insights into the biological procedures involved.
Data availability statement
The original contributions presented in the study are included in the article/Supplementary Material. Further inquiries can be directed to the corresponding author/s.
Author contributions
CB: Formal analysis, Writing – original draft, Writing – review & editing. LV: Formal analysis, Methodology, Supervision, Writing – review & editing. IN: Conceptualization, Investigation, Methodology, Supervision, Writing – review & editing. LS: Funding acquisition, Visualization, Writing – original draft. AC: Data curation, Investigation, Validation, Writing – original draft. RI-B: Formal analysis, Methodology, Project administration, Resources, Writing – original draft. MK: Supervision, Validation, Writing – review & editing. AM: Data curation, Formal analysis, Methodology, Resources, Writing – original draft. AC: Conceptualization, Methodology, Supervision, Validation, Writing – review & editing.
Funding
The author(s) declare that financial support was received for the research and/or publication of this article.
Conflict of interest
The authors declare that the research was conducted in the absence of any commercial or financial relationships that could be construed as a potential conflict of interest.
Generative AI statement
The author(s) declare that no Generative AI was used in the creation of this manuscript.
Correction note
This article has been corrected with minor changes. These changes do not impact the scientific content of the article.
Publisher’s note
All claims expressed in this article are solely those of the authors and do not necessarily represent those of their affiliated organizations, or those of the publisher, the editors and the reviewers. Any product that may be evaluated in this article, or claim that may be made by its manufacturer, is not guaranteed or endorsed by the publisher.
Supplementary material
The Supplementary Material for this article can be found online at: https://www.frontiersin.org/articles/10.3389/fimmu.2025.1534875/full#supplementary-material
References
1. Bello AK, Levin A, Tonelli M, Okpechi IG, Feehally J, Harris D, et al. Assessment of global kidney health care status. JAMA. (2017) 317:1864–81. doi: 10.1001/jama.2017.4046
2. Kovesdy CP. Epidemiology of chronic kidney disease: an update 2022. Kidney Int Suppl (2011). (2022) 12:7–11. doi: 10.1016/j.kisu.2021.11.003
3. World Health Organization. The top 10 causes of death. Fact sheet (2019). Available online at: https://www.who.int/news-room/fact-sheets/detail/the-top-10-causes-of-death (Accessed August 2024).
4. Wang JH and Hart A. Global perspective on kidney transplantation: United States. Kidney360. (2021) 2:1836–39. doi: 10.34067/KID.0002472021
5. Nankivell BJ and Chapman JR. Chronic allograft nephropathy: current concepts and future directions. Transplantation. (2006) 81:643–54. doi: 10.1097/01.tp.0000190423.82154.01
6. Oweira H, Ramouz A, Ghamarnejad O, Khajeh E, Ali-Hasan-Al-Saegh S, Nikbakhsh R, et al. Risk factors of rejection in renal transplant recipients: A narrative review. J Clin Med. (2022) 11:1392. doi: 10.3390/jcm11051392
7. Sawinski D and Blumberg EA. Infection in renal transplant recipients. Chronic Kidney Disease Dialysis Transplant. (2019), 621–638.e6. doi: 10.1016/B978-0-323-52978-5.00040-9
8. Dunn WB, Bailey NJ, and Johnson HE. Measuring the metabolome: current analytical technologies. Analyst. (2005) 130:606–25. doi: 10.1039/b418288j
9. Wishart DS. Metabolomics: a complementary tool in renal transplantation. Contrib Nephrol. (2008) 160:76–87. doi: 10.1159/000125935
10. Wishart DS. Metabolomics: the principles and applications to transplantation. Am J Transplant. (2005) 5:2814–20. doi: 10.1111/j.1600-6143.2005.01119.x
11. Christians U, Klawitter J, and Klawitter J. Biomarkers in transplantation–proteomics and metabolomics. Ther Drug Monit. (2016) 38 Suppl 1:S70–4. doi: 10.1097/FTD.0000000000000243
12. Alkadi M, Lee J, Dadhania D, Muthukumar T, Snopkowski C, Li C, et al. Urine cell-free supernatant metabolites diagnostic of antibody mediated rejection in kidney allografts. Am J Transplantation. (2016) 16:247–8.
13. Banas M, Neumann S, Eiglsperger J, Schiffer E, Putz FJ, Reichelt-Wurm S, et al. Identification of a urine metabolite constellation characteristic for kidney allograft rejection. Metabolomics. (2018) 14:116. doi: 10.1007/s11306-018-1419-8
14. Banas M, Neumann S, Pagel P, Chittka D, Pfahlert V, and Banas B. Detection of renal allograft rejection by NMR-based urine metabolomics. Nephron. (2018) 139:108.
15. Dedinska I, Baranovičová E, Graňák K, Vnučák M, Beliančinová M, and Mokáň M. Metbolomics approach and acute rejection in kidney transplant reciepnts. Nephrol Dialysis Transplant. (2022) 37. doi: 10.1093/ndt/gfac087.038
16. Iwamoto H, Okihara M, Akashi I, Kihara Y, Konno O, Kawachi S, et al. Metabolomic profiling of plasma, urine, and saliva of kidney transplantation recipients. Int J Mol Sci. (2022) 23:13938. doi: 10.3390/ijms232213938
17. Iwamoto H, Sugimoto M, Konnno O, Kihara Y, Yokoyama T, Nakamura Y, et al. Diagnosis of acute renal rejection using saliva metabolome analysis [abstract. Am J Transplantation. (2018) 18:958.
18. Kalantari S, Chashmniam S, Nafar M, Samavat S, Rezaie D, and Dalili N. A noninvasive urine metabolome panel as potential biomarkers for diagnosis of T cell-mediated renal transplant rejection. OMICS. (2020) 24:140–7. doi: 10.1089/omi.2019.0158
19. Kim SY, Kim BK, Gwon MR, Seong SJ, Ohk B, Kang WY, et al. Urinary metabolomic profiling for noninvasive diagnosis of acute T cell-mediated rejection after kidney transplantation. J Chromatogr B Analyt Technol BioMed Life Sci. (2019) 1118-1119:157–63. doi: 10.1016/j.jchromb.2019.04.047
20. Li X, Li R, Ji B, Zhao L, Wang J, and Yan T. Integrative metagenomic and metabolomic analyses reveal the role of gut microbiota in antibody-mediated renal allograft rejection. J Transl Med. (2022) 20:614. doi: 10.1186/s12967-022-03825-6
21. Mao YY, Bai JQ, Chen JH, Shou ZF, He Q, Wu JY, et al. A pilot study of GC/MS-based serum metabolic profiling of acute rejection in renal transplantation. Transpl Immunol. (2008) 19:74–80. doi: 10.1016/j.trim.2008.01.006
22. Sigdel T, Yang J, and Sarwal M. A “Multi-omic” Analysis of proteome and metabolome for acute rejection and PVAN in kidney transplantation. Am J Transplant. (2017) 17.
23. Wang J, Zhang X, Li M, Li R, and Zhao M. Shifts in intestinal metabolic profile among kidney transplantation recipients with antibody-mediated rejection. Ther Clin Risk Manage. (2023) 19:207–17. doi: 10.2147/TCRM.S401414
24. Zhao X, Chen J, Ye L, and Xu G. Serum metabolomics study of the acute graft rejection in human renal transplantation based on liquid chromatography-mass spectrometry. J Proteome Res. (2014) 13:2659–67. doi: 10.1021/pr5001048
25. Zheng L, Wang J, Gao W, Hu C, Wang S, Rong R, et al. GC/MS-based urine metabolomics analysis of renal allograft recipients with acute rejection. J Transl Med. (2018) 16:202. doi: 10.1186/s12967-018-1584-6
26. Sigdel TK, Schroeder AW, Yang JYC, Sarwal RD, Liberto JM, and Sarwal MM. Targeted urine metabolomics for monitoring renal allograft injury and immunosuppression in pediatric patients. J Clin Med. (2020) 9:2341. doi: 10.3390/jcm9082341
27. Archdekin B, Sharma A, Gibson IW, Rush D, Wishart DS, and Blydt-Hansen TD. Non-invasive differentiation of non-rejection kidney injury from acute rejection in pediatric renal transplant recipients. Pediatr Transplant. (2019) 23:e13364. doi: 10.1111/petr.13364
28. Blydt-Hansen TD, Sharma A, Gibson IW, Mandal R, and Wishart DS. Urinary metabolomics for noninvasive detection of borderline and acute T cell-mediated rejection in children after kidney transplantation. Am J Transplant. (2014) 14:2339–49. doi: 10.1111/ajt.12837
29. Blydt-Hansen T, Wishart D, Mandal R, Sharma A, Gibson I, Ho J, et al. Urine metabolomics for identifying risk of late antibody-mediated rejection. Pediatr Transplantation. (2015) 19:85.
30. Blydt-Hansen TD, Sharma A, Gibson IW, Wishart DS, Mandal R, Ho J, et al. Urinary metabolomics for noninvasive detection of antibody-mediated rejection in children after kidney transplantation. Transplantation. (2017) 101:2553–61. doi: 10.1097/TP.0000000000001662
31. Taha K, Sharma A, Kroeker K, Ross C, Carleton B, Wishart D, et al. Noninvasive testing for mycophenolate exposure in children with renal transplant using urinary metabolomics. Pediatr Transplant. (2023) 27:e14460. doi: 10.1111/petr.14460
32. Burghelea D, Moisoiu T, Ivan C, Elec A, Munteanu A, Iancu ŞD, et al. The use of machine learning algorithms and the mass spectrometry lipidomic profile of serum for the evaluation of tacrolimus exposure and toxicity in kidney transplant recipients. Biomedicines. (2022) 10:1157. doi: 10.3390/biomedicines10051157
33. Diémé B, Halimi JM, Emond P, Büchler M, Nadal-Desbarat L, Blasco H, et al. Assessing the metabolic effects of calcineurin inhibitors in renal transplant recipients by urine metabolic profiling. Transplantation. (2014) 98:195–201. doi: 10.1097/TP.0000000000000039
34. He X, Yang X, Yan X, Huang M, Xiang Z, and Lou Y. Individualized dosage of tacrolimus for renal transplantation patients based on pharmacometabonomics. Molecules. (2022) 27:3517. doi: 10.3390/molecules27113517
35. Kim CD, Kim EY, Yoo H, Lee JW, Ryu DH, Noh DW, et al. Metabonomic analysis of serum metabolites in kidney transplant recipients with cyclosporine A- or tacrolimus-based immunosuppression. Transplantation. (2010) 90:748–56. doi: 10.1097/TP.0b013e3181edd69a
36. Kim S, Park Y, Cheeseman J, Mehta A, Jones D, and Kirk A. Metabolomic distinctions between renal allograft recipients on monotherapy sirolimus or tacrolimus maintenance therapy. Am J Transplantation. (2013) 13:357.
37. Klepacki J, Klawitter J, Klawitter J, Karimpour-Fard A, Anderson E, Ingle G, et al. A comprehensive biomarker study to compare tacrolimus and mycophenolic acid versus half-dose tacrolimus and everolimus in de novo kidney transplant patients in the novartis US92 study. Am J Transplantation. (2016) 16:535.
38. Guellec CLE, Dieme B, Emond P, Blasco H, Lebranchu Y, Buchler M, et al. Urinary metabolomic pattern varies over time and may be different in patients receiving cyclosporine or tacrolimus. Am J Transplant. (2013) 13.
39. Muhrez K, Nadal-Desbarat L, Blasco H, Dieme B, Halimi JM, and Le Guellec C. Urine metabolomic profiling identifies time dependent effects of calcineurin inhibitors and reflects early graft function in kidney transplant patients. Fundam Clin Pharmacol. (2014) 28:94. doi: 10.1111/fcp.12066
40. Xia T, Fu S, Wang Q, Wen Y, Chan SA, Zhu S, et al. Targeted metabolomic analysis of 33 amino acids and biogenic amines in human urine by ion-pairing HPLC-MS/MS: Biomarkers for tacrolimus nephrotoxicity after renal transplantation. BioMed Chromatogr. (2018) 32:e4198. doi: 10.1002/bmc.4198
41. Zhang F, Wang Q, Xia T, Fu S, Tao X, Wen Y, et al. Diagnostic value of plasma tryptophan and symmetric dimethylarginine levels for acute kidney injury among tacrolimus-treated kidney transplant patients by targeted metabolomics analysis. Sci Rep. (2018) 8:14688. doi: 10.1038/s41598-018-32958-2
42. Baranovicova E, Vnucak M, Granak K, Lehotsky J, Kadasova N, Miklusica J, et al. Circulating metabolites in relation to the kidney allograft function in posttransplant patients. Metabolites. (2022) 12:661. doi: 10.3390/metabo12070661
43. Bassi R, Niewczas MA, Biancone L, Bussolino S, Merugumala S, Tezza S, et al. Metabolomic profiling in individuals with a failing kidney allograft. PloS One. (2017) 12:e0169077. doi: 10.1371/journal.pone.0169077
44. Blazquez-Navarro A, Bauer C, Wittenbrink N, Wolk K, Sabat R, Dang-Heine C, et al. Early prediction of renal graft function: Analysis of a multi-center, multi-level data set. Curr Res Transl Med. (2022) 70:103334. doi: 10.1016/j.retram.2022.103334
45. Colas L, Royer AL, Massias J, Raux A, Chesneau M, Kerleau C, et al. Urinary metabolomic profiling from spontaneous tolerant kidney transplanted recipients shows enrichment in tryptophan-derived metabolites. EBioMedicine. (2022) 77:103844. doi: 10.1016/j.ebiom.2022.103844
46. Gagnebin Y, Pezzati J, Lescuyer P, De Seigneux S, Rudaz S, and Ponte B. Longitudinal metabolomic analysis for the evaluation of kidney transplantation. Swiss Med Weekly. (2019) 149:17S–8S. doi: 10.1016/j.aca.2019.11.050
47. Ho J, Sharma A, Mandal R, Wishart DS, Wiebe C, Storsley L, et al. Detecting renal allograft inflammation using quantitative urine metabolomics and CXCL10. Transplant Direct. (2016) 2:e78. doi: 10.1097/TXD.0000000000000589
48. Kim CD, Jung HY, Kim RH, Park SM, Park JH, Lee KH, et al. Metabolomics study for identification of potential biomarkers of long-term survival in kidney transplantation recipients. Transplant Proc. (2017) 49:1005–11. doi: 10.1016/j.transproceed.2017.03.055
49. Kouidhi S, Souai N, Alhujaily M, Zidi O, Kochbati A, Redissi A, et al. Multi-solvent extraction procedure for the pioneer fecal metabolomic analysis—identification of potential biomarkers in stable kidney transplant patients. Diagnostics. (2021) 11:962. doi: 10.3390/diagnostics11060962
50. Lan Y, Wang D, He J, Yang H, Hou Y, Di W, et al. The gut microbiome and metabolome in kidney transplant recipients with normal and moderately decreased kidney function. Ren Fail. (2023) 45:2228419. doi: 10.1080/0886022X.2023.2228419
51. Sigdel T, Dinh V, Vitalone M, and Sarwal M. Identification of transplant injury specific metabolites in the kidney transplant urine by metabolomics [abstract. Transplantation. (2014) 98:884–5. doi: 10.1097/00007890-201407151-03020
52. Stenlund H, Madsen R, Vivi A, and Calderisi M. Monitoring kidney-transplant patients using metabolomics and dynamic modeling. Chemom Intell Lab Syst. (2009) 98:45–50. doi: 10.1016/j.chemolab.2009.04.013
53. Suhre K, Dadhania DM, Lee JR, Muthukumar T, Chen Q, Gross SS, et al. Kidney allograft function is a confounder of urine metabolite profiles in kidney allograft recipients. Metabolites. (2021) 11:533. doi: 10.3390/metabo11080533
54. Suhre K, Schwartz JE, Sharma VK, Chen Q, Lee JR, Muthukumar T, et al. Urine metabolite profiles predictive of human kidney allograft status. J Am Soc Nephrology. (2016) 27:626–36. doi: 10.1681/ASN.2015010107
55. Verissimo T, Faivre A, Sgardello S, Naesens M, de Seigneux S, Criton G, et al. Estimated renal metabolomics at reperfusion predicts one-year kidney graft function. Metabolites. (2022) 12:57. doi: 10.3390/metabo12010057
56. Wang Z, Yang H, Zhao C, Wei J, Wang J, Han Z, et al. Proton nuclear magnetic resonance (¹H-NMR)-based metabolomic evaluation of human renal allografts from donations after circulatory death. Med Sci Monit. (2017) 23:5472–9. doi: 10.12659/msm.905168
57. Yozgat I, Sahin B, Saral NY, Ulusoy ZB, Kilercik M, Celik H, et al. Untargeted urinary metabolomic profiling in post-kidney transplant with different levels of kidney function. J Res Pharmacy. (2023) 27:1673–86. doi: 10.29228/jrp.451
58. Calderisi M, Vivi A, Mlynarz P, Tassin M, Banasik M, Dawiskiba T, et al. Using metabolomics to monitor kidney transplantation patients by means of clustering to spot anomalous patient behavior. Transplant Proc. (2013) 45:1511–5. doi: 10.1016/j.transproceed.2013.02.049
59. Kienana M, Lydie ND, Jean-Michel H, Binta D, Matthias B, Patrick E, et al. Elucidating time-dependent changes in the urinary metabolome of renal transplant patients by a combined (1)H NMR and GC-MS approach. Mol Biosyst. (2015) 11:2493–510. doi: 10.1039/C5MB00108K
60. Kouidhi S, Zidi O, Alhujaily M, Souai N, Mosbah A, Belali TM, et al. Fecal metabolomics reveals distinct profiles of kidney transplant recipients and healthy controls. Diagnostics (Basel). (2021) 11:807. doi: 10.3390/diagnostics11050807
61. Li L, Sui W, Che W, Li W, Chen J, Li H, et al. 1H NMR-based metabolic profiling of human serum before and after renal transplantation. Asaio J. (2013) 59:286–93. doi: 10.1097/MAT.0b013e31828e2d9f
62. Stanimirova I, Banasik M, Ząbek A, Dawiskiba T, Kościelska-Kasprzak K, Wojtowicz W, et al. Serum metabolomics approach to monitor the changes in metabolite profiles following renal transplantation. Sci Rep. (2020) 10:17223. doi: 10.1038/s41598-020-74245-z
63. Gagnebin Y, Pezzatti J, Lescuyer P, Boccard J, Ponte B, and Rudaz S. Combining the advantages of multilevel and orthogonal partial least squares data analysis for longitudinal metabolomics: Application to kidney transplantation. Anal Chim Acta. (2020) 1099:26–38. doi: 10.1016/j.aca.2019.11.050
64. Liu RX, Koyawala N, Thiessen-Philbrook HR, Doshi MD, Reese PP, Hall IE, et al. Untargeted metabolomics of perfusate and their association with hypothermic machine perfusion and allograft failure. Kidney Int. (2023) 103:762–71. doi: 10.1016/j.kint.2022.11.020
65. Wang J, Zhou Y, Xu M, Rong R, Guo Y, and Zhu T. Urinary metabolomics in monitoring acute tubular injury of renal allografts: a preliminary report. Transplant Proc. (2011) 43:3738–42. doi: 10.1016/j.transproceed.2011.08.109
66. Dadhania D, Lee J, Alkadi M, Muthukumar T, Snopkowski C, Li C, et al. Urine metabolomics: Quinolinate, a product of tryptophan metabolism, is associated with BK virus nephropathy and intragraft inflammation in kidney transplant recipients. Transplantation. (2016) 100:S609–S10.
67. Iwamoto H, Konno O, Kihara Y, Okihara M, Akashi I, Ueno T, et al. Diagnosis of acute graft rejection after kidney transplantation using metabolome analysis by liquid biopsy approach. Am J Transplantation. (2022) 22:1033.
68. Ma C, He J, Lai L, Chen Y, Xue W, Chen J, et al. Intestinal microbiome and metabolome analyses reveal metabolic disorders in the early stage of renal transplantation. Mol Omics. (2021) 17:985–96. doi: 10.1039/D1MO00279A
69. Steiner RW and Awdishu L. Steroids in kidney transplant patients. Semin Immunopathol. (2011) 33:157–67. doi: 10.1007/s00281-011-0259-7
70. Kumari R, Palaniyandi S, and Hildebrandt GC. Metabolic reprogramming-A new era how to prevent and treat graft versus host disease after allogeneic hematopoietic stem cell transplantation has begun. Front Pharmacol. (2020) 11:588449. doi: 10.3389/fphar.2020.588449
71. Tomaszewicz M, Ronowska A, Zieliński M, Jankowska-Kulawy A, and Trzonkowski P. T regulatory cells metabolism: The influence on functional properties and treatment potential. Front Immunol. (2023) 14:1122063. doi: 10.3389/fimmu.2023.1122063
Keywords: kidney transplanation, systematic review, metabolomics, allograft function, kidney reject, metabolites
Citation: Băluţă CV, Voroneanu L, Nistor I, Siriteanu L, Covic AS, Irimie-Băluţă RE, Kanbay M, Miron AV and Covic AC (2025) Exploring the role of metabolomics in kidney transplantation: a systematic review of the literature. Front. Immunol. 16:1534875. doi: 10.3389/fimmu.2025.1534875
Received: 26 November 2024; Accepted: 19 March 2025;
Published: 10 June 2025; Corrected: 30 June 2025.
Edited by:
Victor Xia, University of California, Los Angeles, United StatesReviewed by:
Maciej Zieliński, Department of Medical Immunology Medical University of Gdańsk, PolandChinnarat Pongpruksa, Rajavithi Hospital, Thailand
Copyright © 2025 Băluţă, Voroneanu, Nistor, Siriteanu, Covic, Irimie-Băluţă, Kanbay, Miron and Covic. This is an open-access article distributed under the terms of the Creative Commons Attribution License (CC BY). The use, distribution or reproduction in other forums is permitted, provided the original author(s) and the copyright owner(s) are credited and that the original publication in this journal is cited, in accordance with accepted academic practice. No use, distribution or reproduction is permitted which does not comply with these terms.
*Correspondence: Lucian Siriteanu, c2lyaXRlYW51bHVjaWFuQGdtYWlsLmNvbQ==