 Maolin Ma†
 Fei Han†Qianghua Leng†Xiaorong Chen
 Zuofu TangJinhua Zhang
 You Luo
 Yang Zhang
 Zhengyu Huang*
 Ning Na*
- Organ Transplantation Research Institution, Division of Kidney Transplantation, Department of Surgery, The Third Affiliated Hospital of Sun Yat-sen University, Guangzhou, Guangdong, China
Background: Expanded criteria donors (ECD) have the potential to greatly increase the donor organ pool but pose a higher risk of delayed graft function (DGF) post-transplantation. Uridine diphosphate-glucose (UDP-Glc) plays a significant role in extracellular signaling related to tissue damage and retains stability for detection. Donor urinary UDP-Glc level may be an appropriate and effective biomarker for predicting DGF.
Methods: Recipients who underwent successful kidney transplantation, with corresponding collection of donor urine samples, between June 2023 and August 2024 were included. We measured preoperative donor urinary UDP-Glc levels and analyzed their correlation with graft recovery. The study was registered in the Clinical Trial Registry (no. NCT06707272).
Results: Preoperative donor urinary UDP-Glc levels were different between immediated, slowed, and delayed graft function subgroups (7.23 vs. 9.04 vs. 10.13 ug/mL, p < 0.001). Donor urinary UDP-Glc level was an independent risk factor for DGF (odds ratio [OR] = 1.741, 95% confidence interval [CI]: 1.311–2.312, p < 0.001). Furthermore, donor urinary UDP-Glc showed a better predictive value for DGF (AUROC = 0.791, 95% CI: 0.707–0.875, p < 0.001), and combining donor urinary UDP-Glc and donor terminal serum creatinine improved the model predictive value for DGF (AUROC = 0.832, 95% CI: 0.756–0.908, Youden index = 0.56, sensitivity = 0.81, specificity = 0.75, PPV = 0.72, NPV = 0.83, p < 0.001). Additionally, the donor urinary UDP-Glc level was related to the recipient serum creatinine level at 1 month post-transplantation (rs = 0.475, p < 0.001).
Conclusions: Donor urinary UDP-Glc level is an independent risk factor for DGF and can provide surgeons with a novel strategy to predict DGF earlier and more accurately without invasive procedures.
Clinical trial registration: https://clinicaltrials.gov, NCT06707272 identifier.
1 Introduction
Kidney transplantation is the preferred treatment for end-stage renal disease; however, organ shortage is the primary bottleneck restricting organ transplantation (1). Organs from Expanded Criteria Donors (ECD) have the potential to greatly increase the donor organ pool. However, they require careful selection and utilization. Deceased kidney donors often have a history of central nervous system fluid regulation disorders and inflammatory mediator release, which lead to hemodynamic instability, electrolyte and acid-base imbalances, and a higher risk of primary graft non-function or delayed graft function (DGF) in recipients post-transplantation (2, 3). Searching for appropriate and effective biomarkers to assess renal quality and predict DGF is a crucial issue in the field of kidney transplantation.
Uridine diphosphate-glucose (UDP-Glc) is a damage-associated molecular pattern molecule released by damaged cells (4). UDP-Glc is synthesized in the cytoplasm and transported into the lumen of the endoplasmic reticulum and Golgi apparatus, where it regulates the synthesis of carbohydrates and acts as a substrate to facilitate glycosylation reactions (5). UDP-Glc is an endogenous excitant of the G protein-coupled P2Y14 receptor (6). Additionally, this receptor in humans is expressed at high levels in adipose tissue, stomach, kidney, intestines, specific regions of the brain, skeletal muscle, spleen, lungs, and heart (7). Released UDP-Glc plays a significant role in extracellular signaling within these tissues (8). Activation of P2Y14 promotes neutrophil infiltration, the recruitment of monocytes and macrophages, and the activation of the immune response, ultimately leading to tissue damage (9). Intercalated cells in the collecting duct of the kidney act as sensors for UDP-Glc, and when the P2Y14 receptor on their apical membrane is activated, intercalated cells produce chemotactic cytokines that attract neutrophils to the kidney, causing kidney inflammation and the onset of acute kidney injury (AKI) (10, 11). Furthermore, the concentration of UDP-Glc is higher in the urine of patients with AKI than in those without it (12). UDP-Glc hydrolyzes slowly in the extracellular environment, which results in UDP-Glc being highly stable and easily detectable (5, 13). Therefore, donor urinary UDP-Glc can serve as an appropriate and effective biomarker to assess renal quality and predict DGF.
This study aimed to investigate the correlation between donor urinary UDP-Glc levels and post-transplant graft function in recipients. We hypothesized that the higher the donor urinary UDP-Glc level, the more severe the kidney damage, resulting in a higher probability of DGF. This will provide transplant surgeons with a novel strategy to predict DGF earlier and more accurately without invasive procedures, while also reducing medical costs.
2 Methods and materials
2.1 Study design
This observational clinical study included recipients who underwent successful kidney transplantation, with donor urine samples collected at our center between June 2023 and August 2024. The inclusion criteria were as follows: 1) donors aged between 15 and 75 years, 2) recipients aged between 15 and 75 years, 3) signature of an informed consent form, 4) organs from deceased donors without contraindications for organ donation, and 5) donors free from infectious diseases, including tuberculosis and HIV/AIDS. The exclusion criteria were as follows: 1) donors without urine samples, 2) recipients with multiple organ transplantation, 3) participation in other clinical trials, 4) recipients who died during the perioperative period, 5) recipients who experienced kidney transplant nephrectomy during the perioperative period, 6) recipients who did not have a follow-up visit at our center within 1 month after the first discharge, 7) donors or recipients under 15 years of age, and 8) other features considered unsuitable by researchers. Two researchers independently collected the clinical data of recipients and donors from the medical records and organ transplant response systems, respectively. A third researcher verified the data accuracy.
2.2 Ethical approval
This study adhered to the Consolidated Standards of Reporting Trials (CONSORT) guidelines, and was approved by the Ethics Committee of The Third Affiliated Hospital of Sun Yat-sen University (approval no. II2024-047-02). All the participants provided written informed consent. All organs utilized in the study were donated voluntarily, and none originated from executed prisoners. The study was registered in the Clinical Trial Registry (no. NCT06707272).
2.3 Outcomes of interest
In this study, we used serum creatinine (Scr) as the graft outcome based on follow-up visits to our center within the first month. DGF was defined as the need for dialysis treatment within the first week following transplantation or Scr ≥ 4.52 mg/dL at post-transplant one week (14). Immediated graft function (IGF) was defined as Scr < 2.50 mg/dL at post-transplant one week, and slowed graft function (SGF) was defined as Scr ≥ 2.50 mg/dL but < 4.52 mg/dL without the need for dialysis at post-transplant one week (15). Additionally, ECD were defined as donor age ≥ 60 years or age 50–59 years with the following criteria (≥ 2/3): terminal Scr ≥ 1.50 mg/dL, cerebrovascular accident, and history of hypertension (16).
2.4 Sample collection
Donor urine samples were collected from donors at the time of kidney procurement using sterile tubes, incubated at room temperature for 1 h, and subsequently centrifuged at 2–8 ℃ for about 20 min (2000–3000 rpm). The supernatant was carefully collected, distributed, and stored in -80 ℃. Prior to the test, samples were centrifuged again if precipitation occurred during storage. All time-zero biopsy samples of the donor kidneys were collected by the chief surgeon using 16-gauge needles prior to implantation. Frozen tissue sections were prepared and subjected to hematoxylin and eosin staining. Remuzzi pathology scores were evaluated by the pathologist on duty at our hospital.
2.5 Measurement of donor urinary UDP-Glc level
Donor urinary UDP-Glc was detected using an ELISA kit (MM-92704301; www.mmbio.cn). The detection process was as follows: 1) Sample dilution buffer (40 μL) was added to the wells of the coated ELISA plates, and 10 μL of the testing sample was added to each well. 2) ELISA reagents (50 μL) were added to each well. 3) The plate was sealed and incubated for 30 min at 37°C. 4) A diluted solution was prepared by mixing the concentrated detergent with distilled water at a 1:30 ratio. 5) The plate was unsealed, and the liquid was discarded. The plate was dried by swinging, and washing buffer was added to each well, kept for 30 s, and then removed. This was repeated five times, followed by drying via patting. 6) Color reagent A (50 μL) and color reagent B (50 μL) were added to each well, and the plate was incubated for 10 min at 37°C. 7) Stop solution (50 μL) was added to each well. 8) The optical density at 450 nm was measured within 15 min. Finally, the concentration of UDP-Glc was calculated by constructing a standard curve using the absorbance values obtained.
2.6 Statistical analysis
Continuous variables of normally distributed data (p > 0.05, Shapiro–Wilk test) of donors or recipients were reported as mean ± standard deviation, whereas median and interquartile range was used for skewed data (p < 0.05). Categorical variables regarding donor or recipient data were reported as counts and percentages (%). To analyze the differences in continuous variables for the clinical data of donors or recipients between the different groups, parametric analysis of variance (ANOVA) and Kruskal–Wallis tests were employed. Chi-square or Fisher’s exact tests were used to examine the differences in categorical variables of the clinical data of patients between the groups. Additionally, to identify relevant independent clinical risk factors for donors or recipients with DGF, we used multivariate logistic regression analysis with stepwise backward variable selection (significance threshold defined as p < 0.05). A receiver operating characteristic (ROC) curve was used to evaluate UDP-Glc and other biomarkers for predicting DGF, and optimal cutoff points were derived using the Youden index. Spearman’s correlation coefficient and multiple linear regression analyses were used to evaluate the correlation between UDP-Glc and Scr at 1 month post-transplantation. To control for Type I error inflation due to multiple testing, a Bonferroni correction was applied to adjust the significance level for the 3 independent comparisons. SPSS version 26.0 (IBM Corp., Armonk, NY, USA) was used for analysis, with p < 0.05 considered as statistically significant.
3 Results
3.1 Characteristics of donors and recipients
From the study cohort (Figure 1), 119 recipients were enrolled, with corresponding collection of donor urine samples; Eleven recipients were excluded: one underwent combined liver-kidney transplantation, one died during the perioperative period, one experienced kidney transplant nephrectomy, and eight did not have a follow-up visit at our center within 1 month after the first discharge. Finally, the analysis included a total of 108 recipients. According to graft function, all patients were divided into three subgroups: IGF (n = 43), SGF (n = 17), and DGF (n = 48).
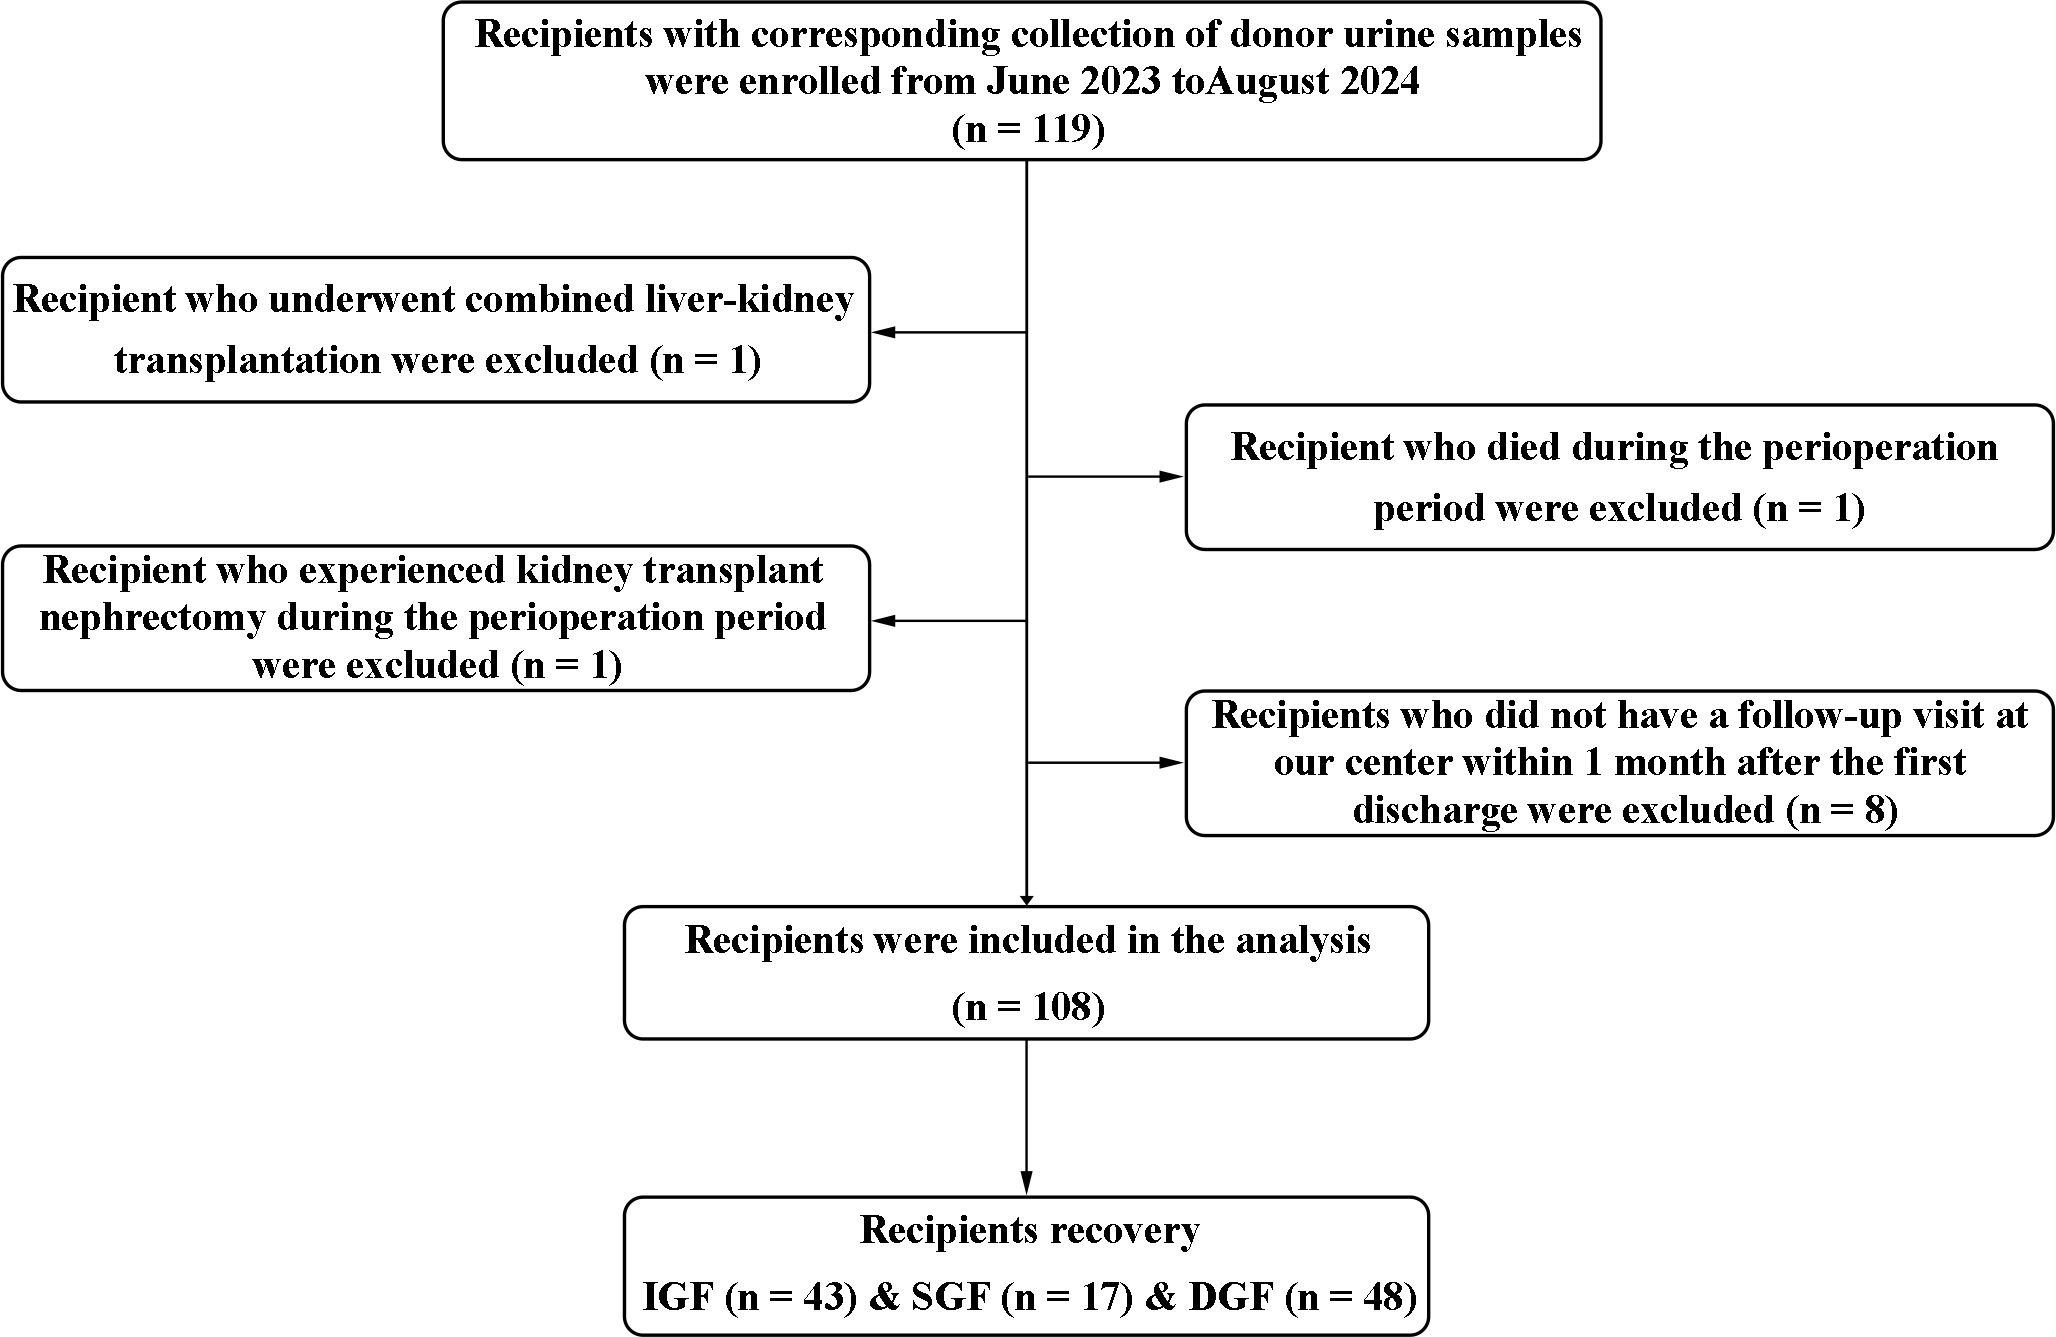
Figure 1. Flow diagram of the study for recipient enrollment.
Donor characteristics are presented in Table 1. The mean donor age was 51.19 ± 10.64 years (49.21 ± 10.21 years in the IGF subgroup, 47.94 ± 8.32 years in the SGF subgroup, and 54.10 ± 11.18 years in the DGF subgroup; p = 0.034). The donor terminal Scr was 0.88 [0.72,1.50] mg/dL for the IGF subgroup, 2.12 [0.77,2.66] mg/dL for the SGF subgroup, and 2.01 [1.22,3.02] mg/dL for the DGF subgroup (p < 0.001). ECD was 8(18.60) for the IGF subgroup, 4(23.53) for the SGF subgroup, and 22(45.83) for the DGF subgroup (p = 0.014). The kidney donor profile index (KDPI) was 58.00 [47.00,75.00]% for the IGF subgroup, 70.00 [45.00,75.50]% for the SGF subgroup, and 76.50 [56.75,86.00]% for the DGF subgroup (p = 0.005). The donor urinary UDP-Glc was 7.23 [6.05,8.96] μg/mL for the IGF subgroup, 9.04 [8.23,10.95] μg/mL for the SGF subgroup, and 10.13 [8.64,11.32] μg/mL for the DGF subgroup (p < 0.001). No significant differences were observed in donor sex, donor body mass index (BMI), hypertension, cause of death, or Remuzzi pathology scores between the IGF, SGF, and DGF subgroups. The characteristics of the recipients are presented in Table 2. Pre-transplantation recipient features were not different between the three subgroups.
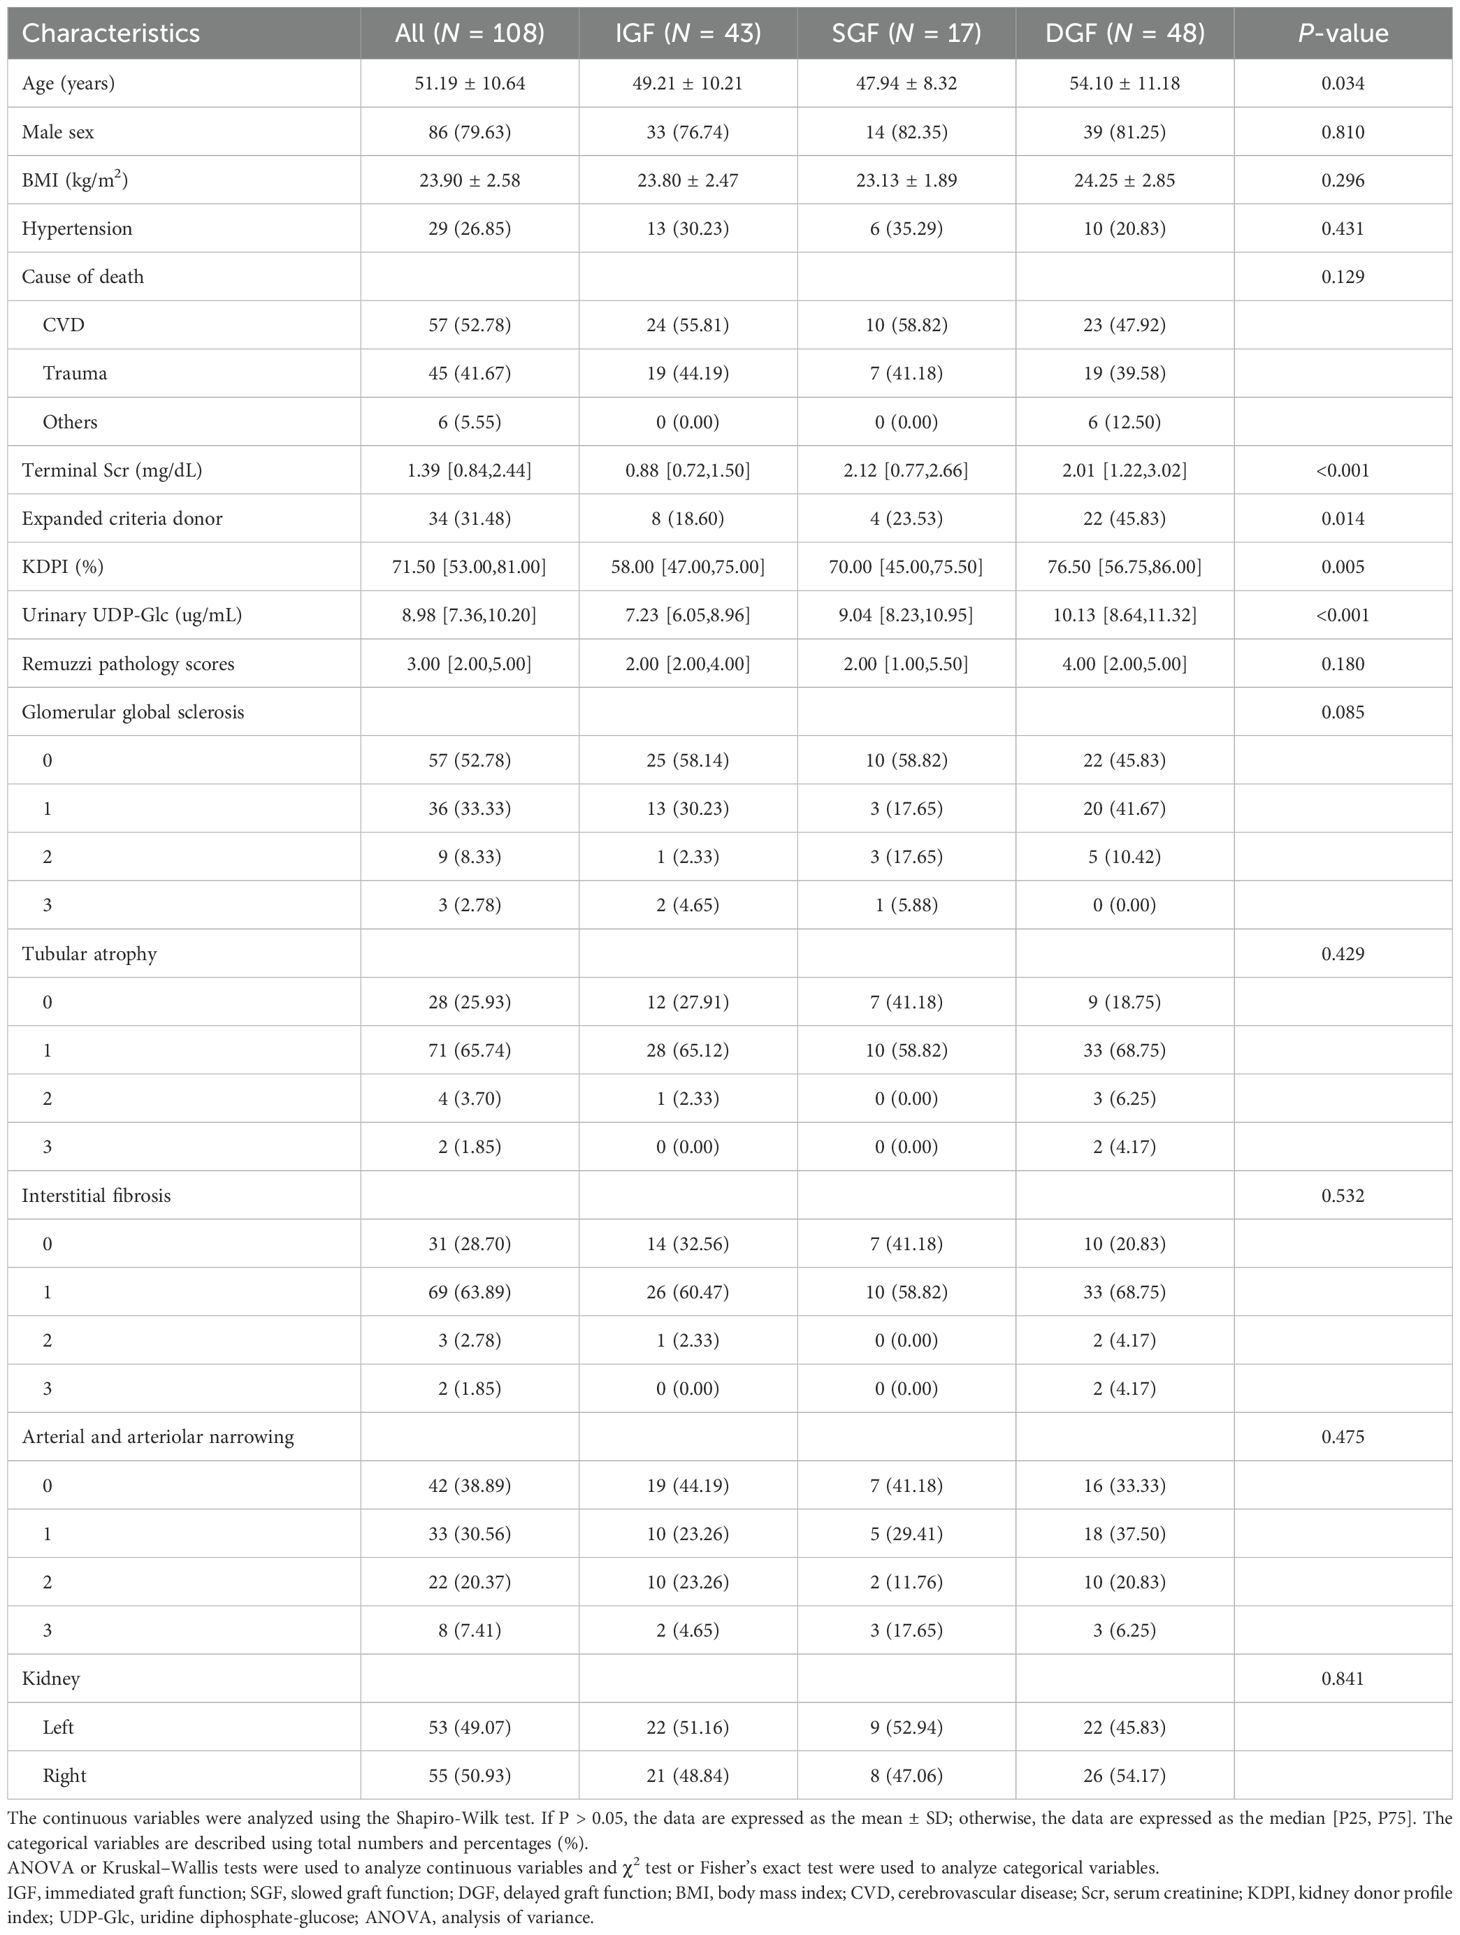
Table 1. Summary of characteristics in donors, stratified by recipients allograft function.

Table 2. Summary of characteristics in recipients, stratified by recipient allograft function.
3.2 Distinction of donor urinary UDP-Glc levels among recipients with different graft function
The donor urinary UDP-Glc was higher in the DGF subgroup (n = 48) than in the non-DGF subgroup (n = 60) (10.13 [8.64,11.32] μg/mL vs. 8.08 [6.27,9.08] μg/mL, p < 0.001), and the differences in other clinical characteristics between the two subgroups are shown in Supplementary Figure S1. Subsequently, we found that donor urinary UDP-Glc in the IGF subgroup was significantly lower compared to the SGF (7.23 [6.05,8.96] μg/mL vs. 9.04 [8.23,10.95] μg/mL, p = 0.003) and DGF (7.23 [6.05, 8.96] μg/mL vs. 10.13 [8.64,11.32] μg/mL, p < 0.001) subgroups, but there were no significant differences between the SGF and DGF subgroups (P = 0.760; Figure 2A). Additionally, compared to the DGF subgroup, the IGF subgroup had a lower donor terminal Scr level (0.88 [0.72,1.50] mg/dL vs. 2.01 [1.22,3.02] mg/dL, p < 0.001; Figure 2B) and a lower KDPI (58.00 [47.00,75.00]% vs. 76.50 [56.75,86.00]%, p = 0.005; Figure 2C). However, no significant differences were observed in the number of human leukocyte antigen (HLA) mismatches, recipient Scr at pre-transplantation, or donor Remuzzi pathology scores (including Remuzzi-total, Remuzzi-g, Remuzzi-ti, and Remuzzi-a scores) between the three subgroups (Figures 2D, E, G; Table 1). Finally, we found that recipients in the IGF subgroup had a lower Scr at 1 month post-transplantation compared to those in the SGF subgroup (1.23 [0.94,1.53] mg/dL vs. 1.89 [1.42,3.00] mg/dL, p = 0.001) and DGF subgroup (1.23 [0.94,1.53] mg/dL vs. 2.63 [1.65,3.70] mg/dL, p < 0.001; Figure 2F).
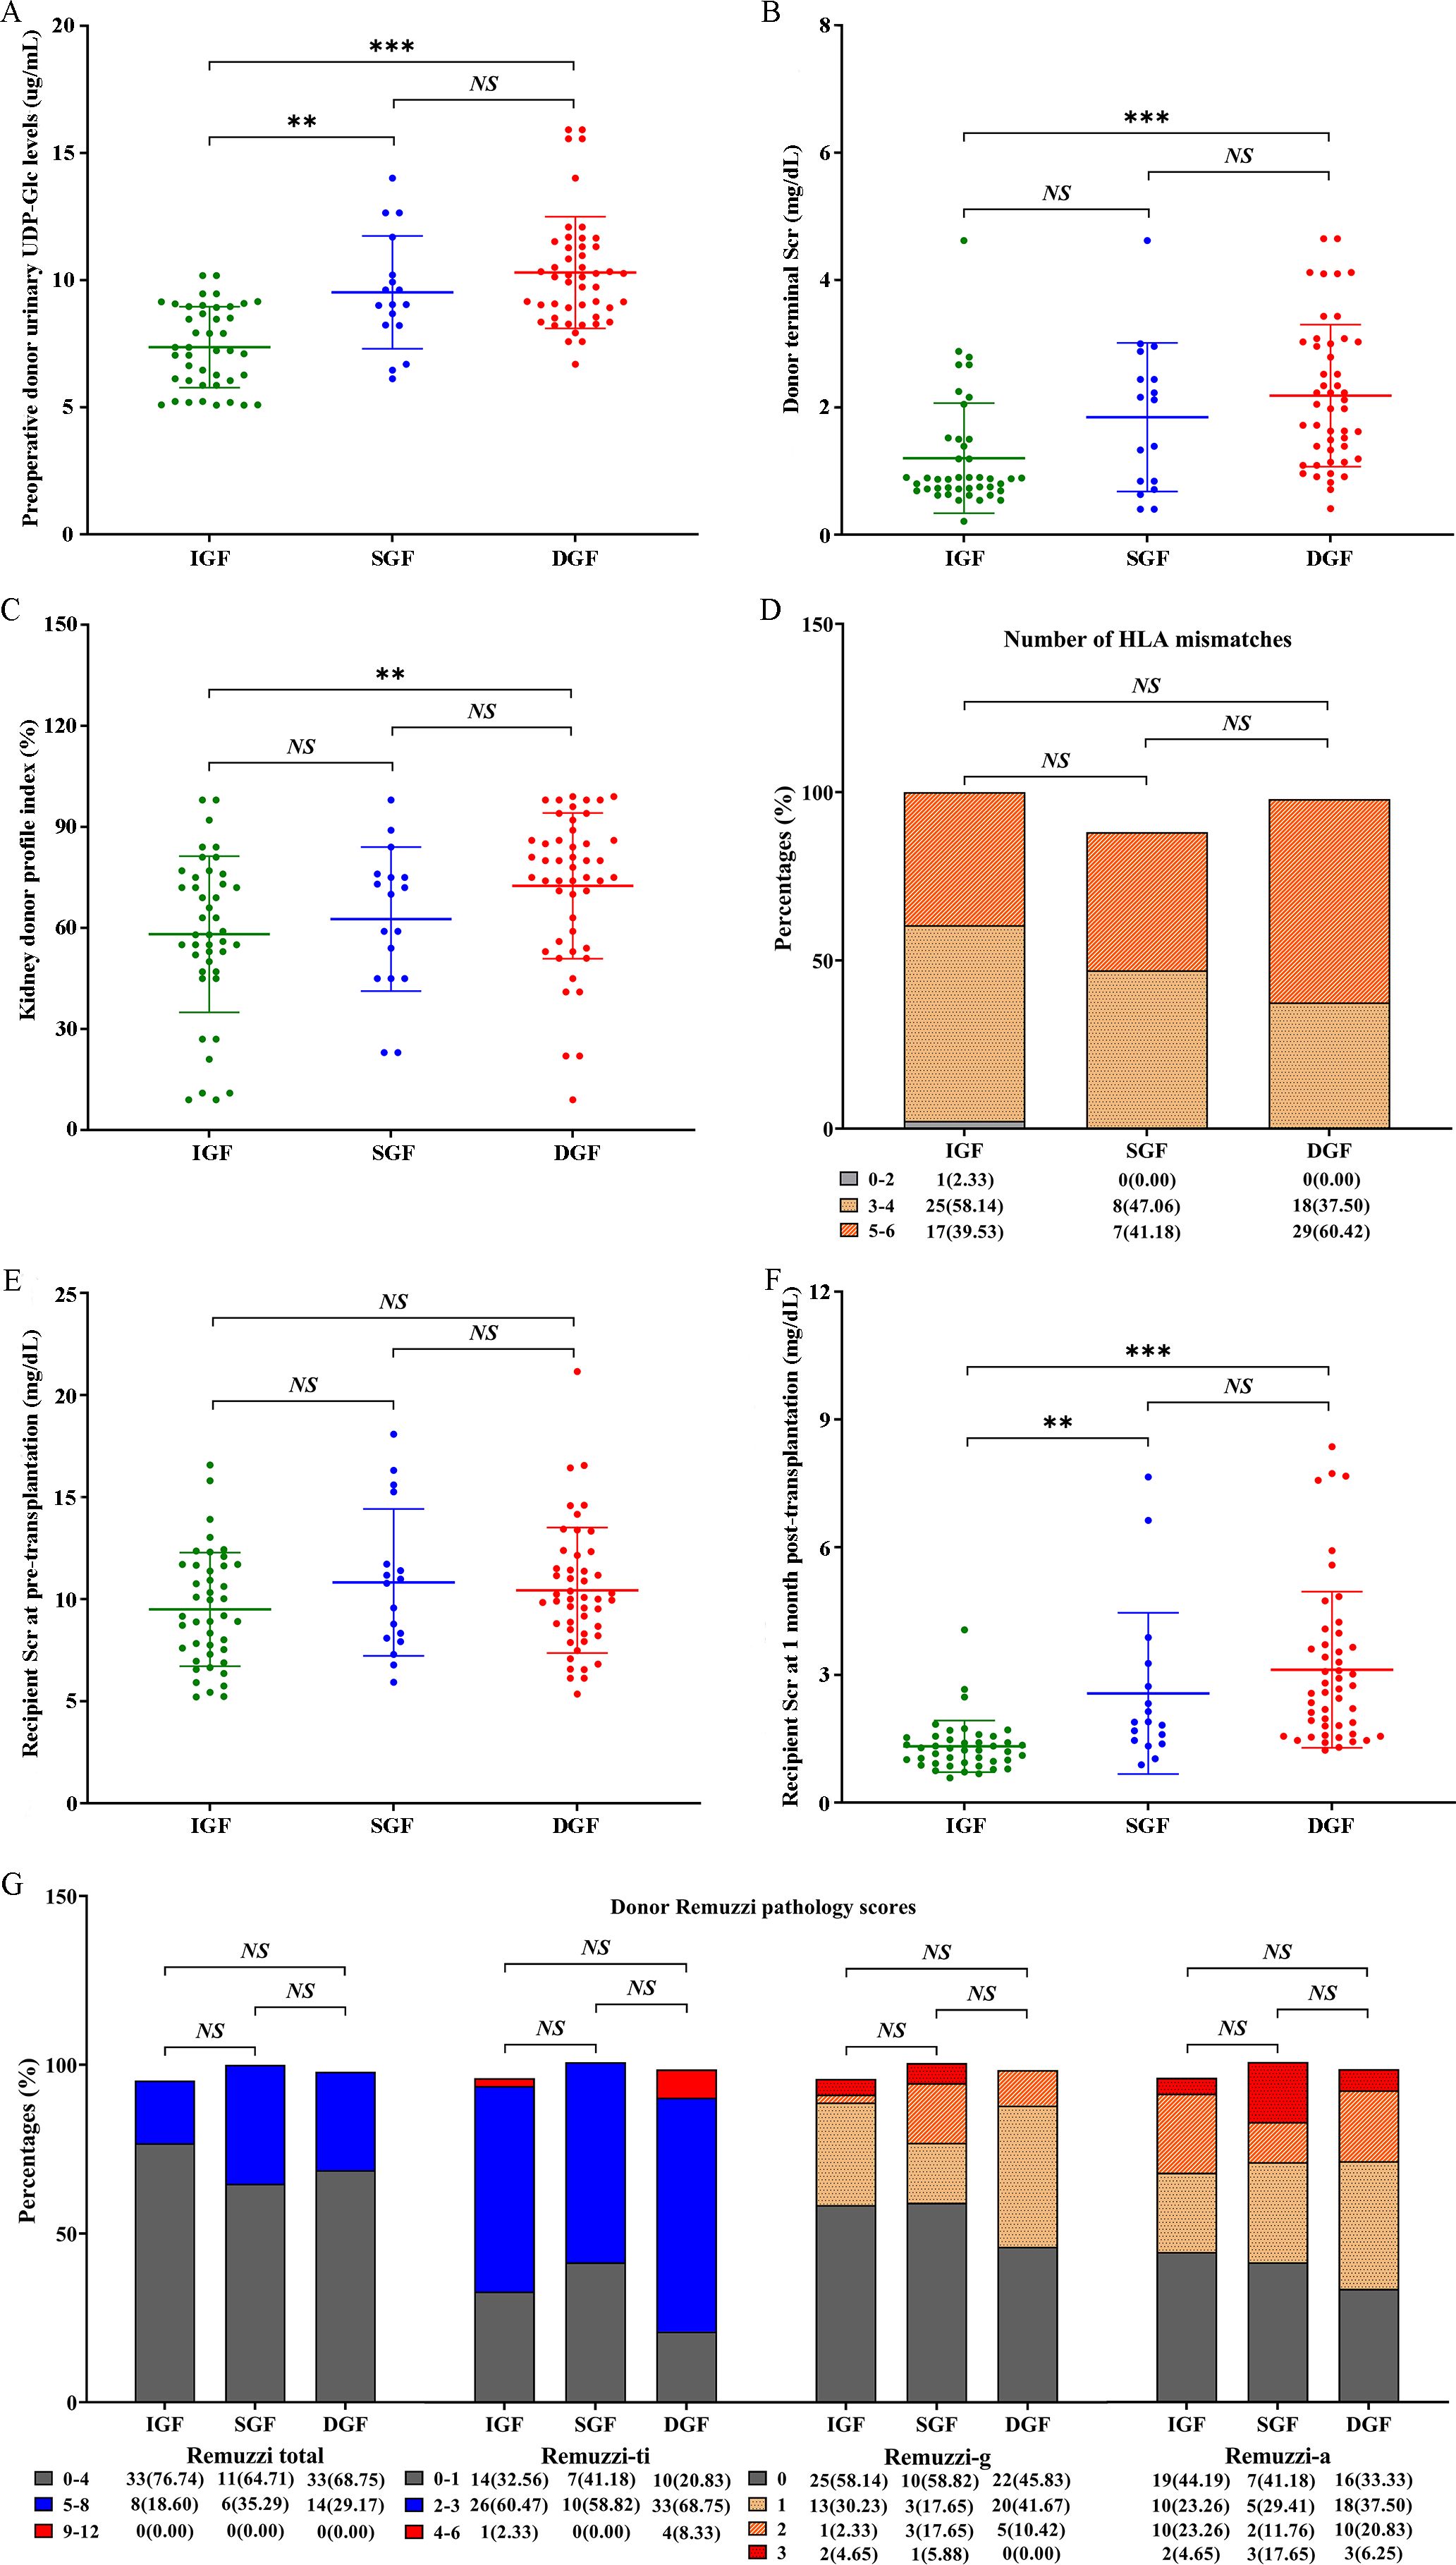
Figure 2. Distribution of several relevant clinical factors in the IGF, SGF, and DGF subgroups. (A) Preoperative donor urinary UDP-Glc levels; (B) donor terminal Scr; (C) kidney donor profile index; (D) number of HLA mismatches; (E) recipient Scr at pre-transplantation; (F) recipient Scr at 1 month post-transplantation; (G) donor Remuzzi pathology scores. IGF, immediated graft function; SGF, slowed graft function; DGF, delayed graft function; UDP-Glc, Uridine diphosphate glucose; Scr, serum creatinine; HLA, human leukocyte antigen; g, glomerular global sclerosis; ti, tubular atrophy and interstitial fibrosis; a, arterial and arteriolar narrowing. NS, non-significant; **p < 0.01; ***p < 0.001.
3.3 Donor urinary UDP-Glc as an independent risk factor for DGF
In total, 48/108 (44.44) recipients had DGF. We analyzed the correlation between DGF and the relevant clinical parameters of donors and recipients (Table 3). Firstly, based on univariate logistic regression analyses, we found that donor urinary UDP-Glc (odds ratio [OR] = 1.769, 95% confidence interval [CI]: 1.366–2.291, p < 0.001), donor age (OR = 1.053, 95% CI: 1.011–1.097, p = 0.014), donor terminal Scr (OR = 2.045, 95% CI: 1.366–3.061, p = 0.001), ECD (OR = 3.385, 95% CI: 1.447–7.919, p = 0.005), KDPI (OR = 1.028, 95% CI: 1.009–1.048, p = 0.005), and panel reactive antibody levels (OR = 2.695, 95% CI: 1.004–7.238, p = 0.049) were significantly correlated with DGF. Subsequently, multivariate logistic regression analyses showed that donor urinary UDP-Glc (OR = 1.741, 95% CI: 1.311–2.312, p < 0.001), donor terminal Scr (OR = 1.684, 95% CI: 1.061–2.674, p = 0.027), and ECD (OR = 3.091, 95% CI: 1.075–8.887, p = 0.036) were independent risk factors for DGF.
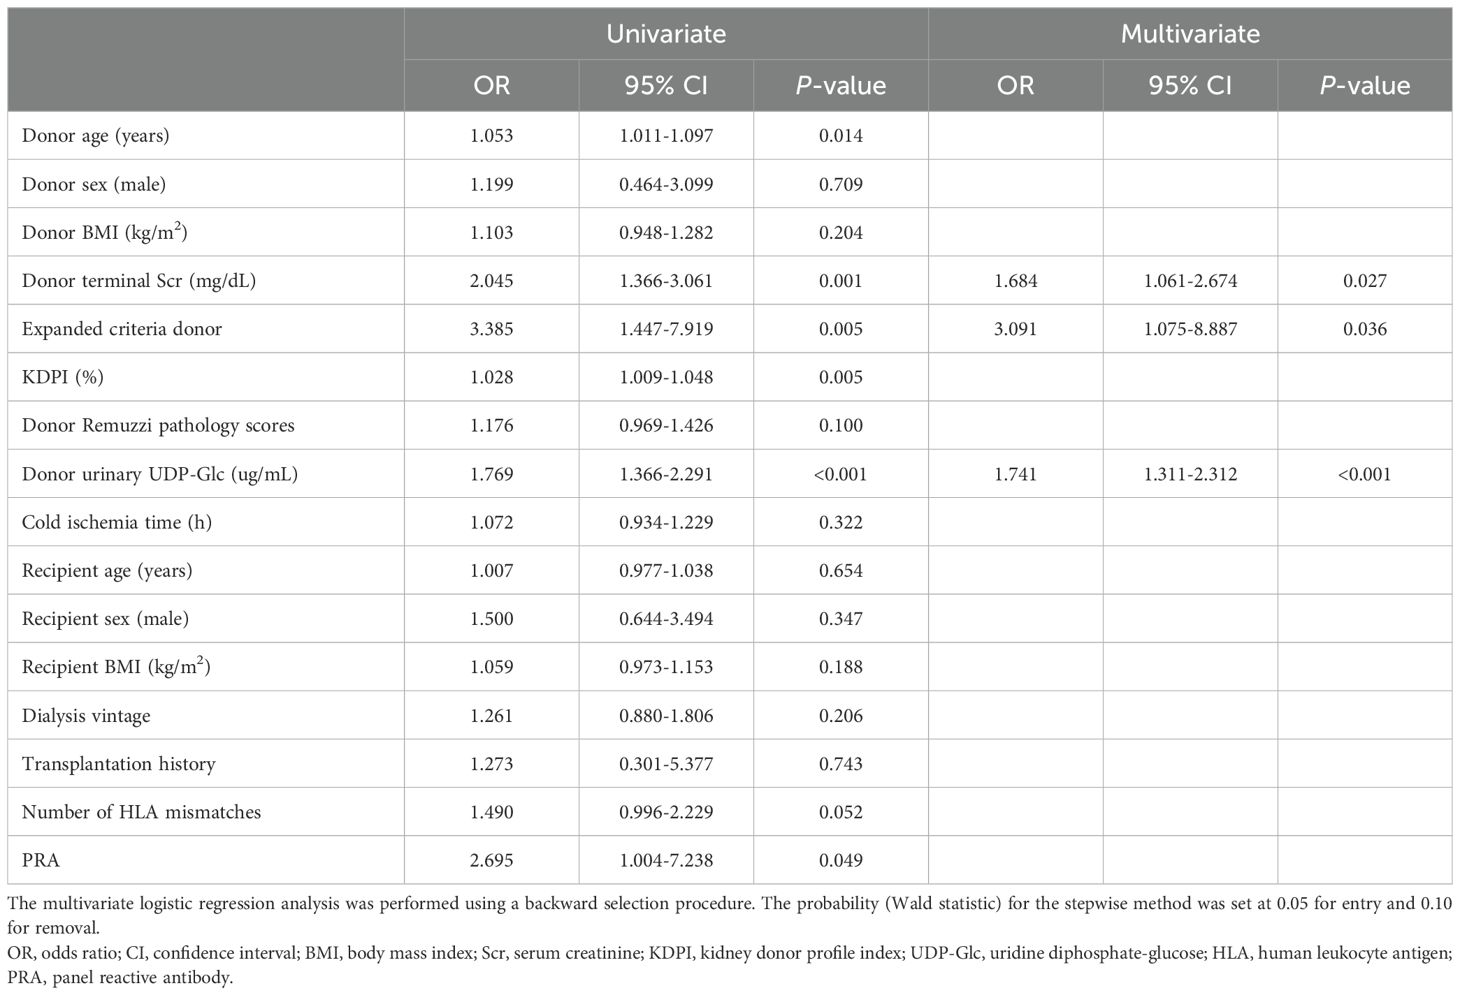
Table 3. Univariate and multivariate logistic regression analyses for predicting delayed graft function.
3.4 Predictive value of donor urinary UDP-Glc for DGF
ROC curve analysis was employed to evaluate the predictive value of relevant clinical parameters for DGF (Figure 3), and the Youden index, sensitivity, specificity, positive predictive value (PPV), and negative predictive value (NPV) at the optimal cut-off point are listed in Table 4. Firstly, the area under the ROC curve (AUROC) of the (A) donor urinary UDP-Glc, (B) donor terminal Scr, (C) donor age, (D) KDPI, (E) donor Remuzzi pathology scores, and (F) number of human leukocyte antigen (HLA) mismatches in predicting DGF were 0.791 (95% CI: 0.707–0.875, p < 0.001; Figure 3A), 0.747 (95% CI: 0.655–0.840, p < 0.001; Figure 3B), 0.635 (95% CI: 0.528–0.741, p = 0.016; Figure 3C), 0.678 (95% CI: 0.575–0.782, p = 0.001; Figure 3D), 0.604 (95% CI: 0.494–0.715, p = 0.067; Figure 3E), and 0.607 (95% CI: 0.499–0.716, p = 0.059; Figure 3F), respectively. Donor urinary UDP-Glc showed the best AUROC value for DGF compared to the other clinical factors. Based on the above analysis, we developed several predictive models. The model that included A+B+C+D+E+F improved the AUROC to 0.853 (95% CI: 0.780–0.925, Youden index = 0.58, sensitivity = 0.87, specificity = 0.71, PPV = 0.71, NPV = 0.88, p < 0.001; Figure 3G), the prediction formula was as follows: y = 0.567×donor urinary UDP-Glc + 0.422×donor terminal Scr + 0.049×donor terminal Scr + 0.008×KDPI + 0.178×donor Remuzzi pathology scores + 0.544×number of HLA mismatches - 12.193. The model that included A+B+F improved the AUROC to 0.840 (95% CI: 0.764–0.916, Youden index = 0.62, sensitivity = 0.81, specificity = 0.81, PPV = 0.78, NPV = 0.84, p < 0.001; Figure 3H), the prediction formula was as follows: y = 0.538×donor urinary UDP-Glc + 0.546×donor terminal Scr + 0.406×number of HLA mismatches - 7.809. The model that included A+B improved the AUROC to 0.832 (95% CI: 0.756–0.908, Youden index = 0.56, sensitivity = 0.81, specificity = 0.75, PPV = 0.72, NPV = 0.83, p < 0.001; Figure 3I), the prediction formula was as follows: y = 0.552×donor urinary UDP-Glc + 0.586×donor terminal Scr - 6.245.
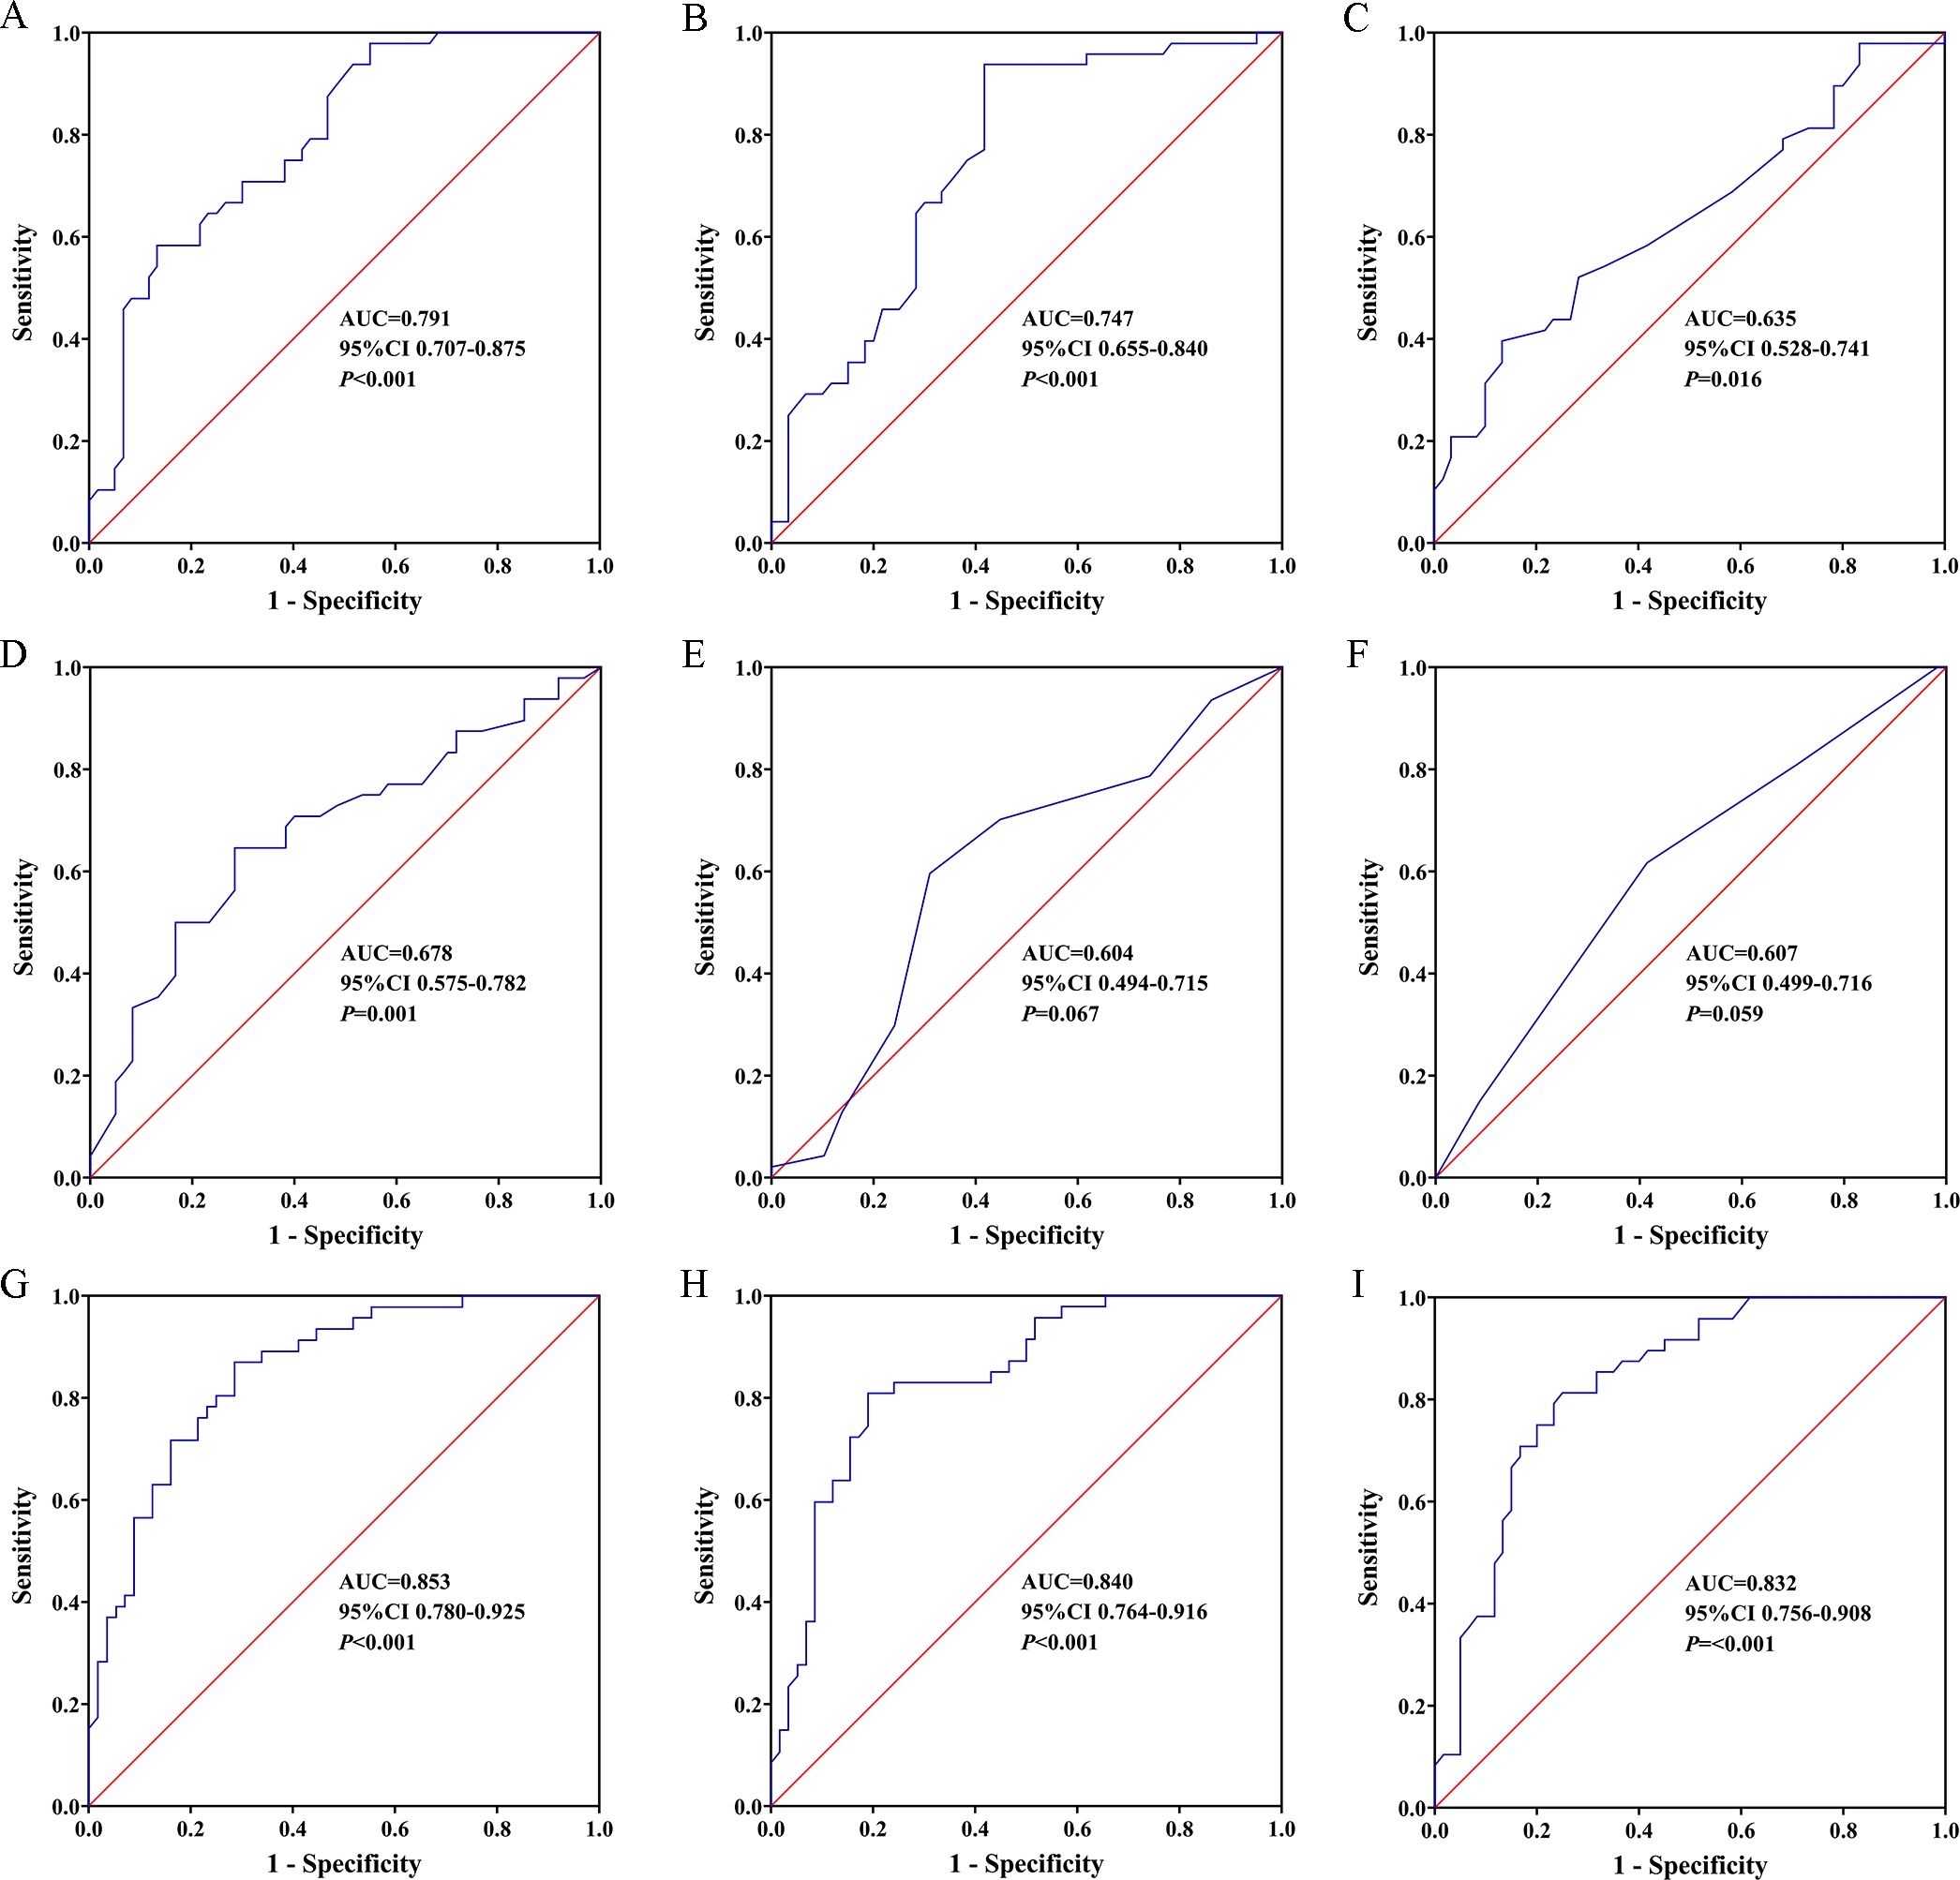
Figure 3. Predictive value of donor urinary UDP-Glc for DGF. Receiver operating characteristic (ROC) curves: (A) donor urinary UDP-Glc, (B) donor terminal Scr, (C) donor age, (D) kidney donor profile index, (E) donor Remuzzi pathology scores, (F) number of HLA mismatches, (G) predictive model including A+B+C+D+E+F, (H) predictive model including A+B+F, (I) predictive model including A+B. AUC, area under curve; CI, confidence interval; UDP-Glc, Uridine diphosphate glucose; DGF, delayed graft function.
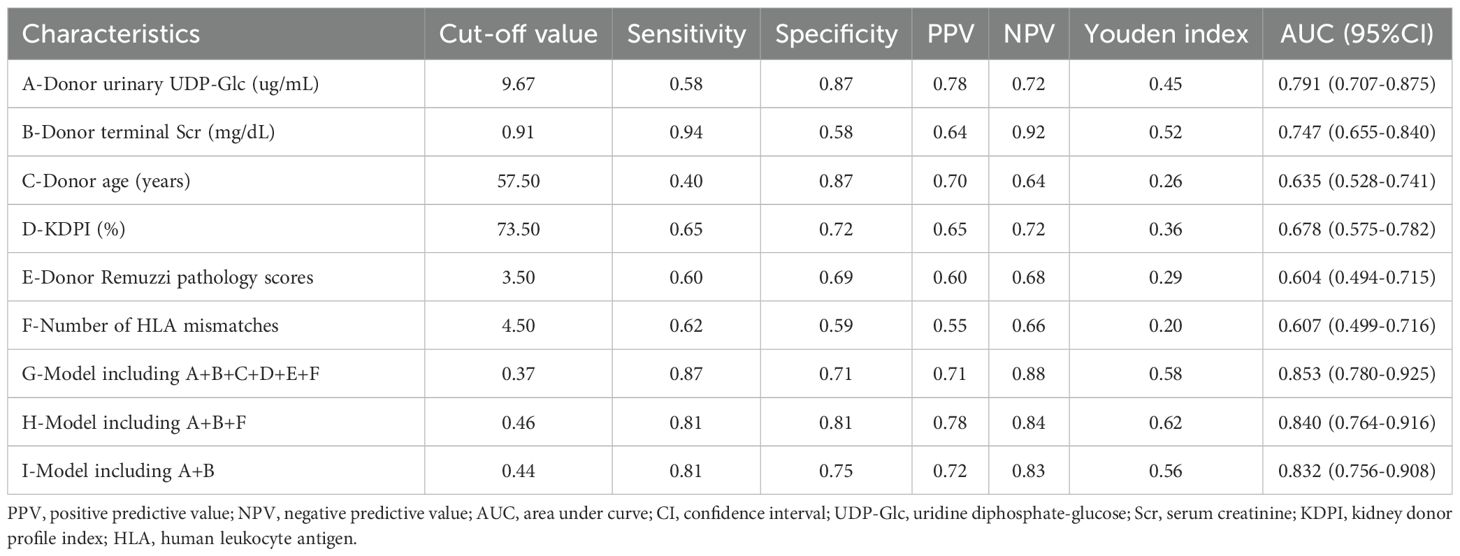
Table 4. Sensitivity, specificity, and predictive values for predicting delayed graft function at optimum cut-off value of donor and recipient characteristic.
3.5 Donor urinary UDP-Glc is related to recipient Scr at 1 month post-transplantation
We analyzed the correlation between recipient Scr at 1 month post-transplantation and the relevant clinical parameters of donors and recipients (Table 5). Based on the univariate linear regression analyses, we found that donor urinary UDP-Glc (β coefficient = 0.324, 95% CI: 0.100–0.357, p = 0.001), KDPI (β coefficient = 0.262, 95% CI: 0.006–0.033, p = 0.006), male recipients (β coefficient = 0.248, 95% CI: 0.228–1.601, p = 0.010), and recipient BMI (β coefficient = 0.307, 95% CI: 0.045–0.179, p = 0.001) were significantly related to recipient Scr at 1 month post-transplantation. Subsequently, according to multivariate linear regression analyses, we showed that donor urinary UDP-Glc (β coefficient = 0.306, 95% CI: 0.096–0.347, p = 0.001), donor Remuzzi pathology scores (β coefficient = 0.195, 95% CI: 0.018–0.306, p = 0.028), and recipient BMI (β coefficient = 0.303, 95% CI: 0.048–0.178, p = 0.001) were correlated with recipient Scr at 1 month post-transplantation. Additionally, we concluded that donor urinary UDP-Glc (rs = 0.475, p < 0.001; Figure 4A), donor terminal Scr (rs = 0.445, P < 0.001; Figure 4B), KDPI (rs = 0.297, p = 0.002; Figure 4C), donor Remuzzi pathology scores (rs = 0.202, p = 0.039; Figure 4D), recipient BMI (rs = 0.364, p < 0.001; Figure 4E), and recipient Scr at pre-transplantation (rs = 0.262, p = 0.006; Figure 4F) were significantly related to recipient Scr at 1 month post-transplantation by Spearman’s correlation coefficient analyses.
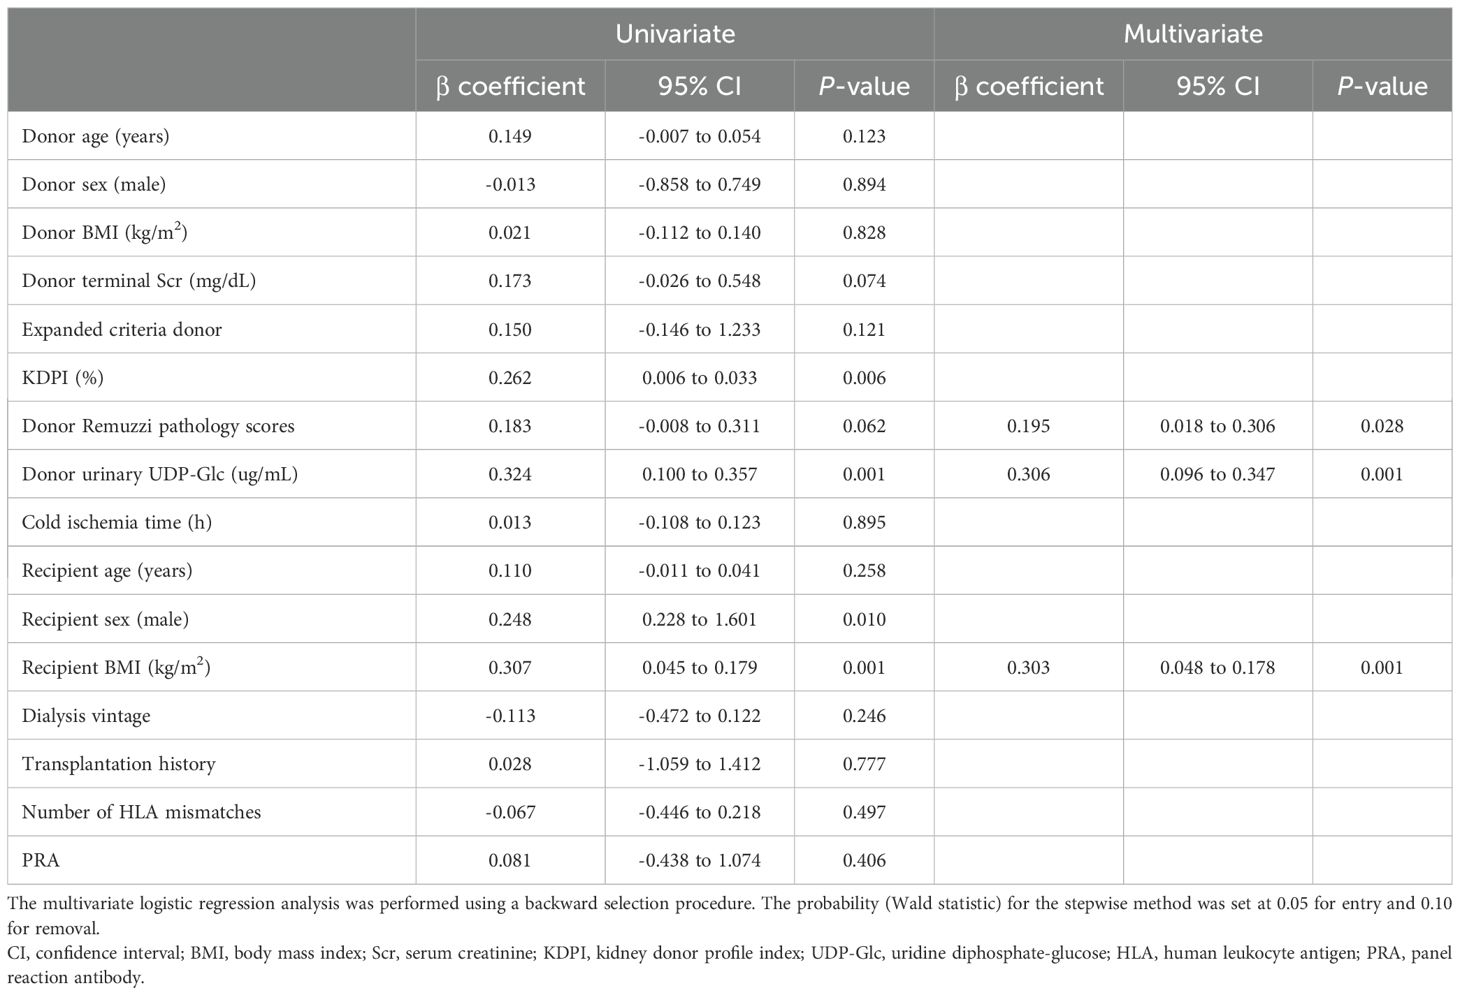
Table 5. Univariate and multivariate linear regression analyses for predicting 1 month graft function.
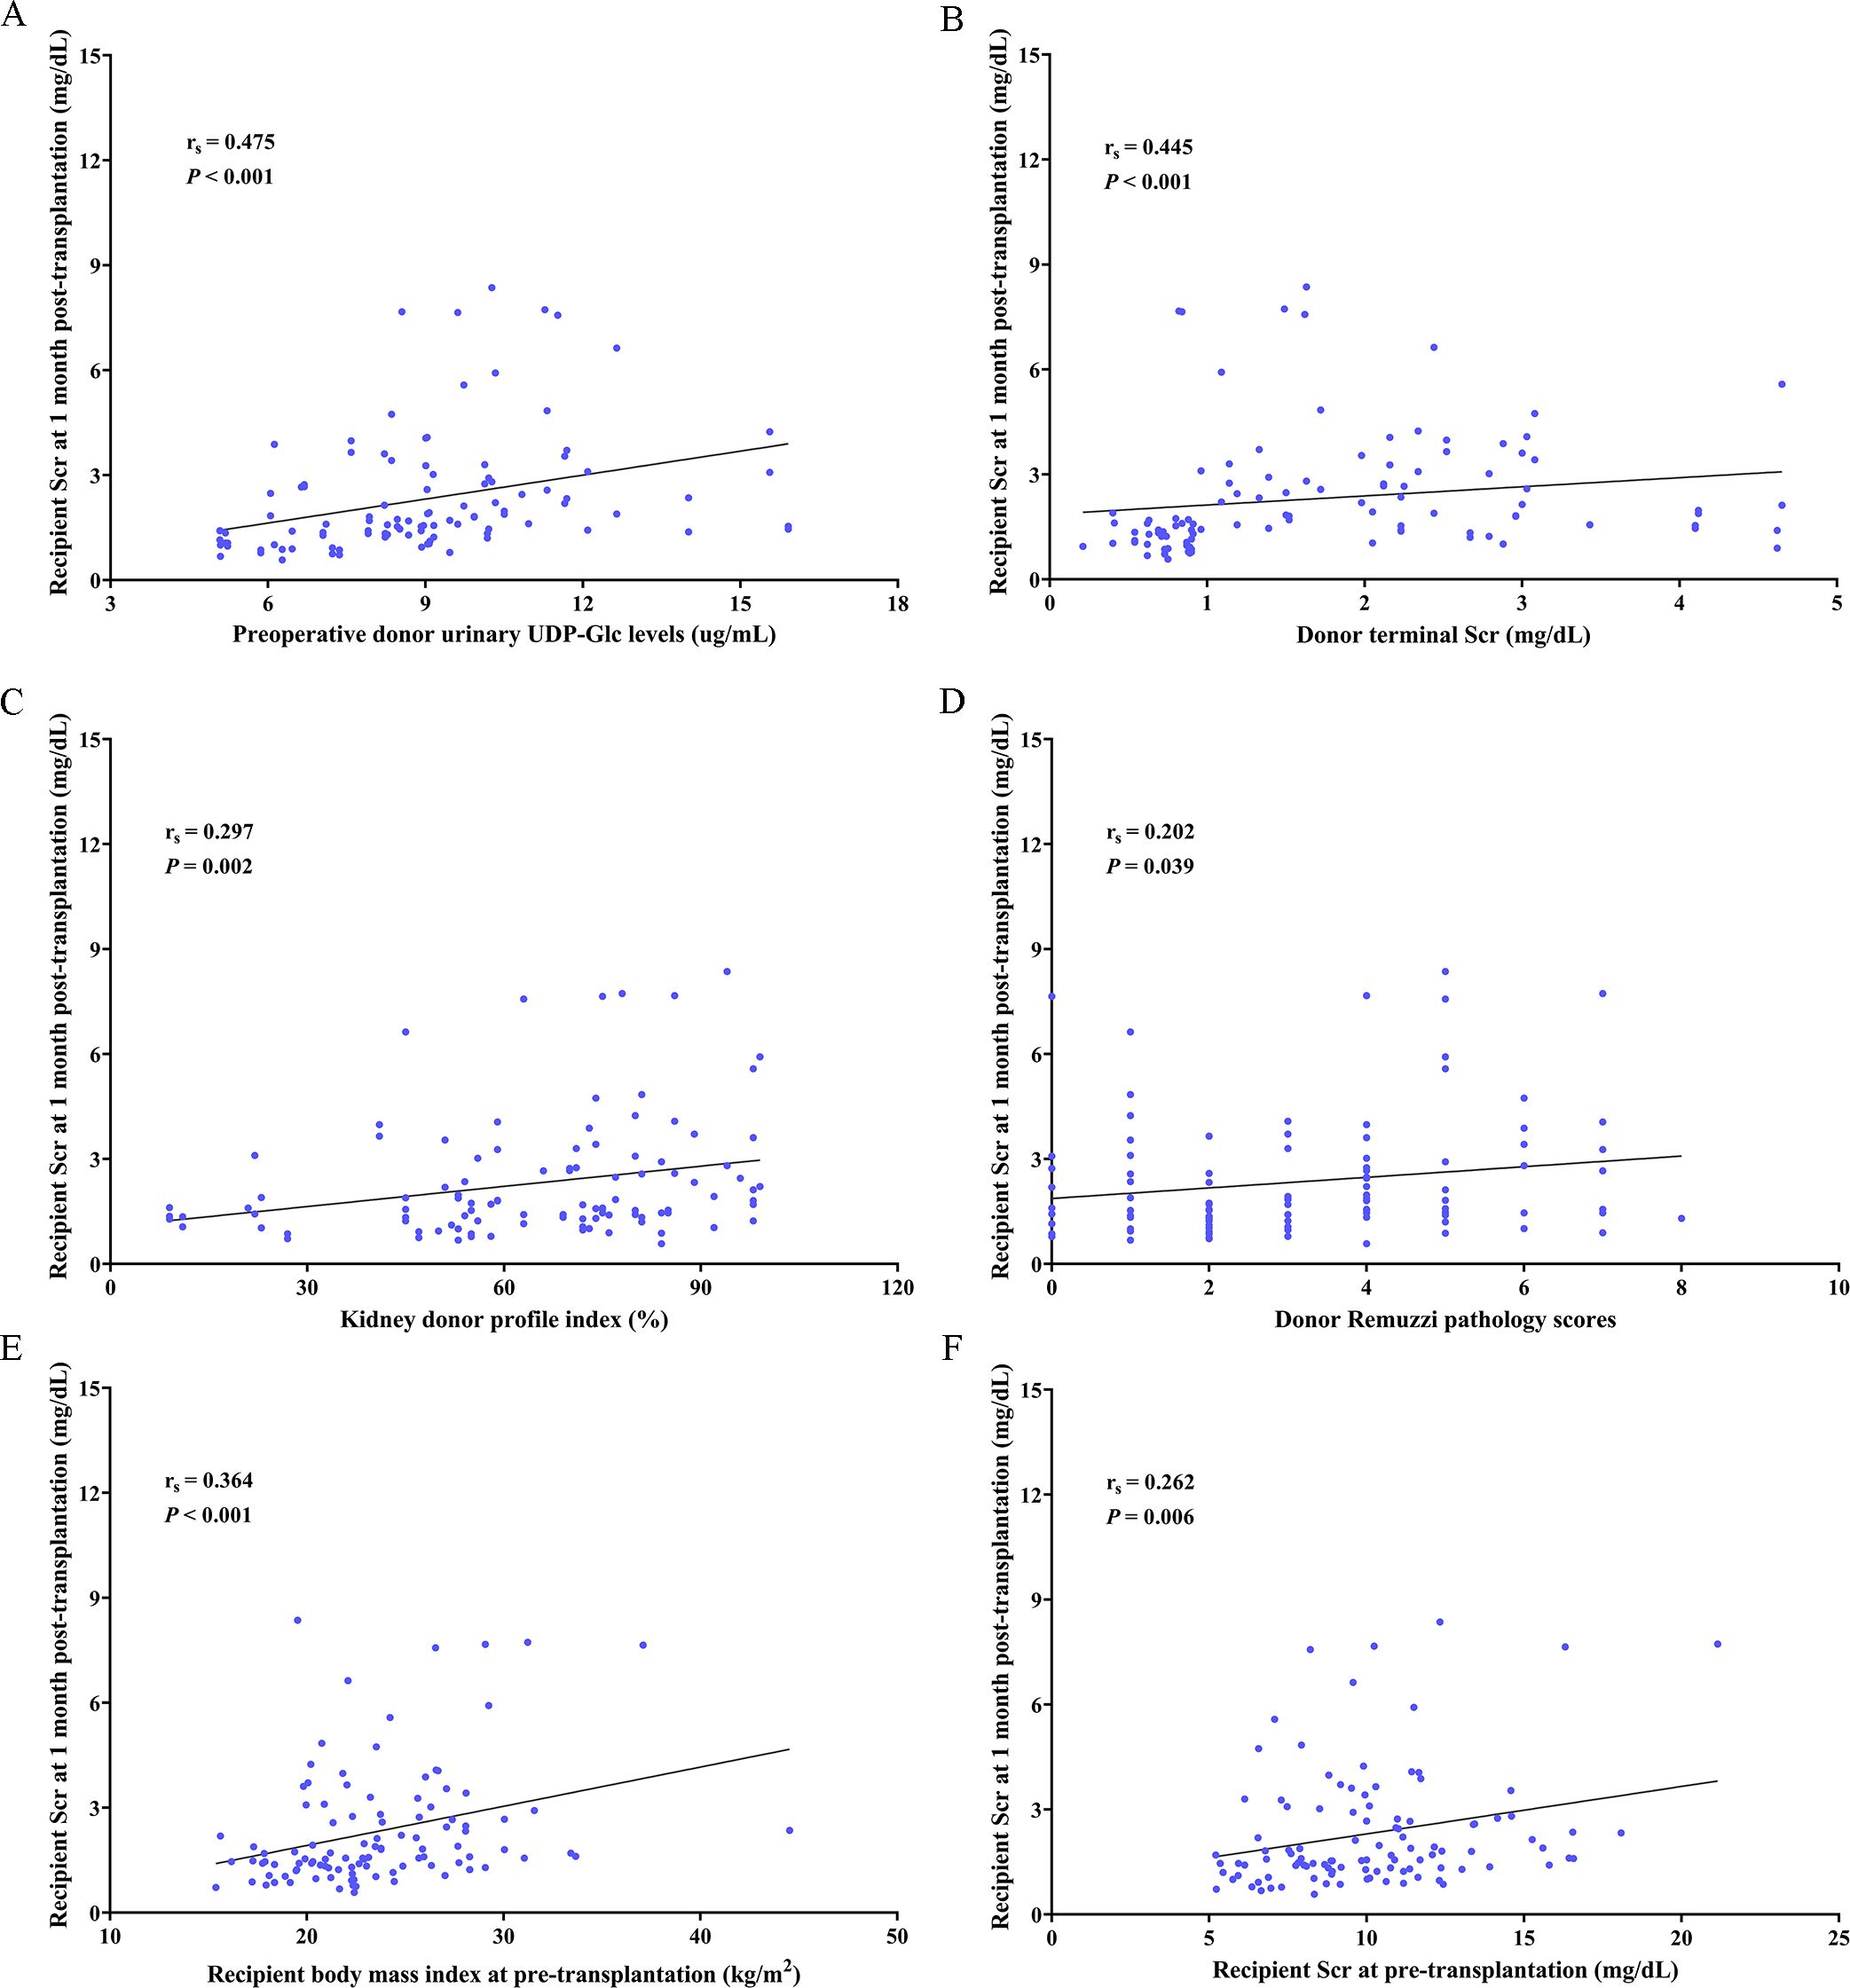
Figure 4. Donor urinary UDP-Glc is related to the recipient Scr at 1 month post-transplantation. Spearman’s correlation between (A) preoperative donor urinary UDP-Glc levels, (B) donor terminal Scr, (C) kidney donor profile index, (D) donor Remuzzi pathology scores, (E) recipient body mass index at pre-transplantation, and (F) recipient Scr at pre-transplantation and recipient Scr at 1 month post-transplantation. UDP-Glc, Uridine diphosphate glucose; Scr, serum creatinine.
4 Discussion
In this study, we evaluated the potential of donor urinary UDP-Glc as a biomarker and found it to be an independent risk factor for DGF. Furthermore, the predictive value of donor urinary UDP-Glc for DGF was higher than that of other biomarkers. Additionally, donor urinary UDP-Glc levels were positively correlated with recipient Scr levels at 1 month after transplantation.
DGF is a common complication that can have detrimental effects on graft survival, cause acute rejection, increase hospital stay, and affect renal function (17, 18). AKI plays an important role in DGF, and several researchers and surgeons believe that DGF is a form of AKI (19). UDP-Glc is a key component of damage-associated molecular patterns and is released from injured cells. When kidney injury occurs, UDP-Glc reaches the lumen of the collecting duct, binds and activates P2Y14 located on the apical membrane of intercalated cells, and triggers renal inflammation, leading to proximal tubule injury and causing additional damage (20). Lazarowski et al. demonstrated that urinary UDP-Glc levels were higher in patients with AKI than in those without it (12). Our results also show that patients with DGF were associated with higher levels of donor urinary UDP-Glc.
Organ shortage limits the widespread use of kidney transplantation; ECD is used to reduce the shortage of kidneys for transplantation; however, it contributes to a higher risk of DGF, and we anticipate that the incidence of DGF is expected to increase in the coming years (21–24). Additionally, DGF is an independent risk factor for graft survival in recipients with ECD kidneys (25). Searching for appropriate and effective biomarkers to assess renal quality and predict DGF is a topic of persistent interest in the field of kidney transplantation. Various scoring systems and biomarkers have been used to evaluate renal quality and predict DGF. However, they have certain limitations. Previous studies suggested that increased donor age remained an independent risk factor for DGF (26, 27). In contrast, a study by Helantera et al. was unable to demonstrate an association between donor age and DGF (28). Donor AKI or higher donor terminal Scr is associated with DGF (29). However, many factors can impact donor creatinine levels, including prerenal, intrarenal, and postrenal injury factors, which have limited the predictive value of donor terminal Scr for DGF (30, 31). The KDPI scoring system has been employed as an effective tool for evaluating the quality of donor kidneys, and a high KDPI typically has a stronger association with DGF and poorer transplant outcomes (32, 33). Due to the unique characteristics of this era, kidneys from ECD at extreme ages were utilized, which restricted the accuracy of the KDPI scoring system (34). Previous studies have demonstrated that the utilization of zero-point biopsy combined with the Remuzzi scoring system in guiding kidney transplantation is significant as it assists surgeons in accurately identifying the severity of AKI and chronic damage and provides a basis for early intervention and personalized treatment strategies to optimize patient outcomes (35, 36). However, the Remuzzi scoring system has limitations, including subjectivity in evaluation, lack of standardization across different centers, potential issues with specificity and sensitivity in identifying certain pathologies, failure to capture dynamic tissue changes, and reliance on the representativeness of biopsy samples, where certain types of damage may be missed due to insufficient sampling, which may lead to biased clinical decision-making. Additionally, the role of HLA mismatch in the short-term outcomes of kidney transplantation is subject to ongoing debate. While many studies indicate that lower HLA mismatches reduce the risk of acute rejection, leading to improved transplant success rates and kidney function recovery, other studies suggest that HLA compatibility is theoretically important but that its impact on actual clinical short-term outcomes may not be as significant as anticipated (37, 38). Our study found that the predictive value of donor urinary UDP-Glc for DGF was higher than that of other biomarkers. UDP-Glc is correlated with inflammation and injury (39). Additionally, the concentration of urinary UDP-Glc rapidly increases in the early stages of kidney injury, and extracellular UDP-Glc exhibits high stability (12, 40). The high concentration and stability of UDP-Glc provide a strong foundation for its use as a valuable biomarker for predicting DGF. UDP-Glc can provide transplant surgeons with a novel strategy to predict DGF earlier and more accurately without invasive procedures while also reducing medical costs.
Consequently, to further enhance the predictive value of the DGF, we combined clinical parameters to develop an effective predictive model. Notably, a combination of donor urinary UDP-Glc and donor terminal Scr, which demonstrated a relatively high predictive value for DGF in this study, was used to create the model. We found that the predictive value of the model improved, with an AUROC of 0.832 and a Youden index of 0.56. When donor urinary UDP-Glc, donor terminal Scr, and number of HLA mismatches were used to build a predictive model for DGF, the AUROC was 0.840, with a Youden index of 0.62. Additionally, when donor urinary UDP-Glc, donor terminal Scr, donor age, KDPI, donor Remuzzi pathology scores, and number of HLA mismatches were used to construct the model, the AUROC was 0.853, with a Youden index of 0.58. We considered these possibilities for the following reasons: first, utilizing multiple factors provides a comprehensive view of patient conditions and varied information that enhances decision-making capabilities; second, this approach reduces bias arising from single predictors, effectively captures complex relationships within the data, and improves generalization to unknown data. Additionally, advanced algorithms can leverage the integrated factors more efficiently, resulting in greater predictive accuracy. Overall, the integration of diverse clinical factors significantly boosts performance and clinical relevance (14, 41–44).
Finally, we showed that donor urinary UDP-Glc levels positively correlated with recipient Scr levels at 1 month after transplantation. This suggests that elevated urinary UDP-Glc concentrations in donors may reflect early kidney dysfunction in transplant recipients. Gaining a better understanding of the quality of donor kidneys, maintaining professional donor care, and effectively managing recipients can improve graft survival (45–47). However, our study had limitations that merit considering. These included a single-center observational clinical study design, a small sample size resulting in reduced statistical power, and a short follow-up period that restricted the assessment of long-term outcomes. Further research is needed to investigate the mechanisms involved and to evaluate the potential of donor urinary UDP-Glc as a predictive biomarker for long-term outcomes in kidney transplant recipients.
In conclusion, our study found that donor urinary UDP-Glc level was an independent risk factor for DGF. We believe that these findings can direct transplant surgeons towards novel strategies to predict DGF earlier and more accurately without invasive procedures while also reducing medical costs.
Data availability statement
The original contributions presented in the study are included in the article/Supplementary Material. Further inquiries can be directed to the corresponding author.
Ethics statement
The studies involving humans were approved by the Ethics Committee of The Third Affiliated Hospital of Sun Yat-sen University. The studies were conducted in accordance with the local legislation and institutional requirements. Written informed consent for participation in this study was provided by the participants’ legal guardians/next of kin.
Author contributions
MM: Data curation, Formal analysis, Investigation, Methodology, Writing – original draft, Writing – review & editing. FH: Formal analysis, Funding acquisition, Investigation, Writing – original draft, Writing – review & editing. QL: Data curation, Investigation, Methodology, Writing – original draft, Writing – review & editing. XC: Investigation, Methodology, Software, Writing – original draft, Writing – review & editing. ZT: Data curation, Methodology, Writing – original draft, Writing – review & editing. JZ: Conceptualization, Resources, Writing – original draft, Writing – review & editing. YL: Conceptualization, Resources, Writing – original draft, Writing – review & editing. YZ: Conceptualization, Resources, Writing – original draft, Writing – review & editing. ZH: Data curation, Project administration, Supervision, Writing – original draft, Writing – review & editing. NN: Data curation, Project administration, Supervision, Writing – original draft, Writing – review & editing.
Funding
The author(s) declare that financial support was received for the research and/or publication of this article. This study was supported by National Natural Science Foundation of China (No. 82200847), Science and Technology Project of Guangzhou City (No. 2024A03J0765).
Conflict of interest
The authors declare that the research was conducted in the absence of any commercial or financial relationships that could be construed as a potential conflict of interest.
The reviewer CH is currently organizing a Research Topic with the author NN.
Generative AI statement
The author(s) declare that no Generative AI was used in the creation of this manuscript.
Publisher’s note
All claims expressed in this article are solely those of the authors and do not necessarily represent those of their affiliated organizations, or those of the publisher, the editors and the reviewers. Any product that may be evaluated in this article, or claim that may be made by its manufacturer, is not guaranteed or endorsed by the publisher.
Supplementary material
The Supplementary Material for this article can be found online at: https://www.frontiersin.org/articles/10.3389/fimmu.2025.1545280/full#supplementary-material
Abbreviations
ECD, expanded criteria donors; DGF, delayed graft function; UDP-Glc, uridine diphosphate-glucose; AKI, acute kidney injury; Scr, serum creatinine; IGF, immediated graft function; SGF, slowed graft function; ROC, receiver operating characteristic; BMI, body mass index; KDPI, kidney donor profile index; OR, odds ratio; CI, confidence interval; PPV, positive predictive value; NPV, negative predictive value; AUROC, area under the ROC curve; HLA, human leukocyte antigen.
References
1. Shi BY, Liu ZJ, Yu T. Development of the organ donation and transplantation system in China. Chin Med J (Engl). (2020) 133:760–5. doi: 10.1097/CM9.0000000000000779
2. Meyfroidt G, Gunst J, Martin-Loeches I, Smith M, Robba C, Taccone FS, et al. Management of the brain-dead donor in the ICU: general and specific therapy to improve transplantable organ quality. Intensive Care Med. (2019) 45:343–53. doi: 10.1007/s00134-019-05551-y
3. Sekhon MS, Gooderham P, Menon DK, Brasher PMA, Foster D, Cardim D, et al. The burden of brain hypoxia and optimal mean arterial pressure in patients with hypoxic ischemic brain injury after cardiac arrest. Crit Care Med. (2019) 47:960–9. doi: 10.1097/CCM.0000000000003745
4. Mederacke I, Filliol A, Affo S, Nair A, Hernandez C, Sun Q, et al. The purinergic P2Y14 receptor links hepatocyte death to hepatic stellate cell activation and fibrogenesis in the liver. Sci Transl Med. (2022) 14:eabe5795. doi: 10.1126/scitranslmed.abe5795
5. Khalafalla FG, Kayani W, Kassab A, Ilves K, Monsanto MM, Alvarez R Jr, et al. Empowering human cardiac progenitor cells by P2Y14 nucleotide receptor overexpression. J Physiol. (2017) 595:7135–48. doi: 10.1113/JP274980
6. Zhang JZ, Shi NR, Wu JS, Wang X, Illes P, Tang Y. UDP-glucose sensing P2Y14R: A novel target for inflammation. Neuropharmacology. (2023) 238:109655. doi: 10.1016/j.neuropharm.2023.109655
7. Katakura S, Takao T, Arase T, Yoshimasa Y, Tomisato S, Uchida S, et al. UDP-glucose, a cellular danger signal, and nucleotide receptor P2Y14 enhance the invasion of human extravillous trophoblast cells. Placenta. (2020) 101:194–203. doi: 10.1016/j.placenta.2020.09.061
8. Lazarowski ER, Harden TK. UDP-sugars as extracellular signaling molecules: cellular and physiologic consequences of P2Y14 receptor activation. Mol Pharmacol. (2015) 88:151–60. doi: 10.1124/mol.115.098756
9. Lairion F, Carbia C, Chiesa IM, Saporito-Magriña C, Borda N, Lazarowski A, et al. Uridine diphosphate glucose (UDP-G) activates oxidative stress and respiratory burst in isolated neutrophils. Pharm (Basel). (2023) 16:1501. doi: 10.3390/ph16101501
10. Azroyan A, Cortez-Retamozo V, Bouley R, Liberman R, Ruan YC, Kiselev E, et al. Renal intercalated cells sense and mediate inflammation via the P2Y14 receptor. PloS One. (2015) 10:e0121419. doi: 10.1371/journal.pone.0121419
11. Breton S, Brown D. Novel proinflammatory function of renal intercalated cells. Ann Nutr Metab. (2018) 72 Suppl 2:11–6. doi: 10.1159/000488303
12. Battistone MA, Mendelsohn AC, Spallanzani RG, Allegretti AS, Liberman RN, Sesma J, et al. Proinflammatory P2Y14 receptor inhibition protects against ischemic acute kidney injury in mice. J Clin Invest. (2020) 130:3734–49. doi: 10.1172/JCI134791
13. Lazarowski ER, Shea DA, Boucher RC, Harden TK. Release of cellular UDP-glucose as a potential extracellular signaling molecule. Mol Pharmacol. (2003) 63:1190–7. doi: 10.1124/mol.63.5.1190
14. Han F, Wan S, Sun Q, Chen N, Li H, Zheng L, et al. Donor plasma mitochondrial DNA is correlated with posttransplant renal allograft function. Transplantation. (2019) 103:2347–58. doi: 10.1097/TP.0000000000002598
15. Hall IE, Reese PP, Doshi MD, Weng FL, Schröppel B, Asch WS, et al. Delayed graft function phenotypes and 12-month kidney transplant outcomes. Transplantation. (2017) 101:1913–23. doi: 10.1097/TP.0000000000001409
16. HYPOREME Trial Group. Hypothermia for expanded criteria organ donors in kidney transplantation in France (HYPOREME): a multicentre, randomised controlled trial. Lancet Respir Med. (2024) 12:693–702. doi: 10.1016/S2213-2600(24)00117-6
17. Parajuli S, Muth BL, Astor BC, Redfield RR, Mandelbrot DA, Odorico JS, et al. Delayed kidney graft function in simultaneous pancreas-kidney transplant recipients is associated with early pancreas allograft failure. Am J Transplant. (2020) 20:2822–31. doi: 10.1111/ajt.15923
18. Gill J, Dong J, Rose C, Gill JS. The risk of allograft failure and the survival benefit of kidney transplantation are complicated by delayed graft function. Kidney Int. (2016) 89:1331–6. doi: 10.1016/j.kint.2016.01.028
19. Yamani F, Cianfarini C, Batlle D. Delayed graft function and the renin-angiotensin system. Transplantation. (2024) 108:1308–18. doi: 10.1097/TP.0000000000004934
20. Breton S, Battistone MA. Unexpected participation of intercalated cells in renal inflammation and acute kidney injury. Nephron. (2022) 146:268–73. doi: 10.1159/000519265
21. Mundt HM, Yard BA, Krämer BK, Benck U, Schnülle P. Optimized donor management and organ preservation before kidney transplantation. Transpl Int. (2016) 29:974–84. doi: 10.1111/tri.12712
22. Mezzolla V, Pontrelli P, Fiorentino M, Stasi A, Pesce F, Franzin R, et al. Emerging biomarkers of delayed graft function in kidney transplantation. Transplant Rev (Orlando). (2021) 35:100629. doi: 10.1016/j.trre.2021.100629
23. Brulé N, Canet E, Péré M, Feuillet F, Hourmant M, Asehnoune K, et al. Impact of targeted hypothermia in expanded-criteria organ donors on recipient kidney-graft function: study protocol for a multicentre randomised controlled trial (HYPOREME). BMJ Open. (2022) 12:e052845. doi: 10.1136/bmjopen-2021-052845
24. Balaz P, Rokosny S, Wohlfahrtova M, Wohlfahrt P, Bartonova A, Pokorna E, et al. Identification of expanded-criteria donor kidney grafts at lower risk of delayed graft function. Transplantation. (2013) 96:633–8. doi: 10.1097/TP.0b013e31829d9225
25. Han F, Lin MZ, Zhou HL, Li H, Sun QP, Huang ZY, et al. Delayed graft function is correlated with graft loss in recipients of expanded-criteria rather than standard-criteria donor kidneys: a retrospective, multicenter, observation cohort study. Chin Med J (Engl). (2020) 133:561–70. doi: 10.1097/CM9.0000000000000666
26. Shi HB, Zhao YY, Li Y, Li Y, Liu B, Gong NQ, et al. Values of donor serum lipids and calcium in predicting graft function after kidney transplantation: A retrospective study. Curr Med Sci. (2023) 43:514–9. doi: 10.1007/s11596-023-2729-2
27. Swanson EA, Patel MS, Groat T, Jameson NE, Ellis MKM, Hutchens MP, et al. Vasopressor selection during critical care management of brain dead organ donors and the effects on kidney graft function. J Trauma Acute Care Surg. (2020) 88:783–8. doi: 10.1097/TA.0000000000002688
28. Helanterä I, Ibrahim HN, Lempinen M, Finne P. Donor age, cold ischemia time, and delayed graft function. Clin J Am Soc Nephrol. (2020) 15:813–21. doi: 10.2215/CJN.13711119
29. Hall IE, Schröppel B, Doshi MD, Ficek J, Weng FL, Hasz RD, et al. Associations of deceased donor kidney injury with kidney discard and function after transplantation. Am J Transplant. (2015) 15:1623–31. doi: 10.1111/ajt.13144
30. Ye Y, Han F, Ma M, Sun Q, Huang Z, Zheng H, et al. Plasma macrophage migration inhibitory factor predicts graft function following kidney transplantation: A prospective cohort study. Front Med (Lausanne). (2021) 8:708316. doi: 10.3389/fmed.2021.708316
31. Irish GL, Coates PT, Clayton PA. Association of admission, nadir, and terminal donor creatinine with kidney transplantation outcomes. Kidney Int Rep. (2021) 6:2075–83. doi: 10.1016/j.ekir.2021.05.005
32. Cashion WT, Zhang X, Puttarajappa C, Sharma A, Mehta R, Ganoza A, et al. Interaction between cold ischemia time and Kidney Donor Profile Index on postrenal transplant outcomes. Am J Transplant. (2024) 24:781–94. doi: 10.1016/j.ajt.2024.01.026
33. Schrezenmeier E, Müller M, Friedersdorff F, Khadzhynov D, Halleck F, Staeck O, et al. Evaluation of severity of delayed graft function in kidney transplant recipients. Nephrol Dial Transplant. (2022) 37:973–81. doi: 10.1093/ndt/gfab304
34. Rogers J, Farney AC, Orlando G, Harriman D, Reeves-Daniel A, Jay CL, et al. Dual kidney transplantation from donors at the extremes of age. J Am Coll Surg. (2019) 228:690–705. doi: 10.1016/j.jamcollsurg.2018.12.021
35. Wang M, Lv J, Zhao J, Wang H, Chen J, Wu J. Postreperfusion renal allograft biopsy predicts outcome of single-kidney transplantation: A 10-year observational study in China. Kidney Int Rep. (2023) 9:96–107. doi: 10.1016/j.ekir.2023.10.021
36. Gandolfini I, Buzio C, Zanelli P, Palmisano A, Cremaschi E, Vaglio A, et al. The Kidney Donor Profile Index (KDPI) of marginal donors allocated by standardized pretransplant donor biopsy assessment: distribution and association with graft outcomes. Am J Transplant. (2014) 14:2515–25. doi: 10.1111/ajt.12928
37. Hernandez-Fuentes MP, Franklin C, Rebollo-Mesa I, Mollon J, Delaney F, Perucha E, et al. Long- and short-term outcomes in renal allografts with deceased donors: A large recipient and donor genome-wide association study. Am J Transplant. (2018) 18:1370–9. doi: 10.1111/ajt.14594
38. Farouk S, Zhang Z, Menon MC. Non-HLA donor-recipient mismatches in kidney transplantation-A stone left unturned. Am J Transplant. (2020) 20:19–24. doi: 10.1111/ajt.15612
39. Sesma JI, Weitzer CD, Livraghi-Butrico A, Dang H, Donaldson S, Alexis NE, et al. UDP-glucose promotes neutrophil recruitment in the lung. Purinergic Signal. (2016) 12:627–35. doi: 10.1007/s11302-016-9524-5
40. Sesma JI, Kreda SM, Steinckwich-Besancon N, Dang H, García-Mata R, Harden TK, et al. The UDP-sugar-sensing P2Y(14) receptor promotes Rho-mediated signaling and chemotaxis in human neutrophils. Am J Physiol Cell Physiol. (2012) 303:C490–8. doi: 10.1152/ajpcell.00138.2012
41. Cai A, Li Y, Xi X, Wang Q, Yang J, Wang L, et al. Analysis of risk factors and development of predictive model for malnutrition in patients with traumatic brain injury. Nutr Neurosci. (2024) 27:1439–49. doi: 10.1080/1028415X.2024.2342152
42. Jiang Y, Zhang J, Ainiwaer A, Liu Y, Li J, Zhou L, et al. Development and validation of a predictive model for acute kidney injury in patients with ureterolithiasis. Ren Fail. (2024) 46:2394634. doi: 10.1080/0886022X.2024.2394634
43. Xu Q, Liang R, Luo J, Zhang Y. Development and validation of a predictive model for end-stage renal disease in systemic lupus erythematosus patients. Rheumatol Int. (2024) 44:1941–58. doi: 10.1007/s00296-024-05686-2
44. Xue W, Wang C, Chen J, Sun X, Wu X, Peng L, et al. A prediction model of delayed graft function in deceased donor for renal transplant: a multi-center study from China. Ren Fail. (2021) 43:520–9. doi: 10.1080/0886022X.2021.1895838
45. Kotloff RM, Blosser S, Fulda GJ, Malinoski D, Ahya VN, Angel L, et al. Management of the potential organ donor in the ICU: society of critical care medicine/american college of chest physicians/association of organ procurement organizations consensus statement. Crit Care Med. (2015) 43:1291–325. doi: 10.1097/CCM.0000000000000958
46. Wood KE, Becker BN, McCartney JG, D’Alessandro AM, Coursin DB. Care of the potential organ donor. N Engl J Med. (2004) 351:2730–9. doi: 10.1056/NEJMra013103
Keywords: kidney transplantation, delayed graft function, tissue damage, donor urinary UDP-Glc, predictive model
Citation: Ma M, Han F, Leng Q, Chen X, Tang Z, Zhang J, Luo Y, Zhang Y, Huang Z and Na N (2025) Preoperative donor urinary UDP-Glc as an independent risk factor for delayed graft function. Front. Immunol. 16:1545280. doi: 10.3389/fimmu.2025.1545280
Received: 14 December 2024; Accepted: 03 March 2025;
Published: 17 March 2025.
Edited by:
Zhenhua Dai, Guangdong Provincial Academy of Chinese Medical Sciences, ChinaReviewed by:
Cheng Yang, Fudan University, ChinaXiaopeng Hu, Capital Medical University, China
Wenjun Shang, First Affiliated Hospital of Zhengzhou University, China
Copyright © 2025 Ma, Han, Leng, Chen, Tang, Zhang, Luo, Zhang, Huang and Na. This is an open-access article distributed under the terms of the Creative Commons Attribution License (CC BY). The use, distribution or reproduction in other forums is permitted, provided the original author(s) and the copyright owner(s) are credited and that the original publication in this journal is cited, in accordance with accepted academic practice. No use, distribution or reproduction is permitted which does not comply with these terms.
*Correspondence: Ning Na, bmFuaW5nQG1haWwuc3lzdS5lZHUuY24=; Zhengyu Huang, aHpoZW5neUBtYWlsLnN5c3UuZWR1LmNu
†These authors have contributed equally to this work and share first authorship