 Jennifer N. Saultz1,2*
 Daniel Bottomly2
 Faith Burns2
 Kaelan Byrd2Yoko Kosaka2,3Bernhard Alber2
 Daniel Chandra1,2
 Stephen E. Kurtz2Guang Fan4Andy Kaempf5Nicola Long2Marta Sanchez-Martin6Lei Wang6Karen McGovern6
 Dan S. Kaufman7
 Shannon K. McWeeney2,8,9Brian J. Druker1,2
 Jeffrey W. Tyner2,10
 Evan F. Lind2,3,10
- 1Division of Hematology/Medical Oncology, Oregon Health & Science University, Portland, OR, United States
- 2Knight Cancer Institute, Oregon Health & Science University, Portland OR, United States
- 3Department of Molecular Microbiology and Immunology, Oregon Health and Science University, Portland, OR, United States
- 4Molecular Pathology and Molecular Diagnostics Laboratories, Knight Diagnostic Laboratories, Oregon Health & Science University, Portland, OR, United States
- 5Biostatistics Shared Resource (BSR) Knight Cancer Institute, Oregon Health & Science University, Portland, OR, United States
- 6IKENA Oncology, Boston, MA, United States
- 7Division of Regenerative Medicine, Department of Medicine, University of California, San Diego, La Jolla, CA, United States
- 8Division of Bioinformatics and Computational Biology, Department of Medical Informatics and Clinical Epidemiology, Oregon Health & Science University, Portland, OR, United States
- 9Division of Oncological Sciences Oregon Health & Science University, Portland, OR, United States
- 10Department of Cell, Developmental & Cancer Biology, Oregon Health & Science University, Portland, OR, United States
Background: Acute myeloid leukemia (AML) is characterized by a complex interplay between genomic alterations, aberrant hematopoiesis, and immune evasion. The aryl hydrocarbon receptor (AHR) pathway is a critical player in this phenomenon determining the fate of stem cell differentiation as well as dictating immune cell development and function. Despite this critical connection, little is known about how AHR regulates the immune microenvironment in AML.
Methods: We performed a retrospective study examining the pre-treatment effect of immune cell numbers (T and NK cells) in the bone marrow and their impact on overall survival in AML patients undergoing 7+3 induction chemotherapy. Utilizing flow cytometry and both bulk and single-cell RNA sequencing of AML patient samples, we characterized the immune signature of blast cells and the influence of AHR on the immune microenvironment. Lastly, we performed functional studies to determine impact of pharmacological and genomic AHR inhibition on NK cell function.
Results: Higher bone marrow NK cell percentage in ND-AML correlated with poorer OS and expression of HLA-E on leukemic blasts. AHR upregulation was associated with HLA-E expression on blasts and an innate immune resistant signature defined by upregulation of key cytokine pathways, interferon gamma (IFN-g) pathway, and MHC class I/II as well as impaired NK cell profiles. High AHR expression in AML was associated with monocytic maturation and discrepant MHC class I/II profiles. Pre-treatment of blasts with an AHR inhibitor (AHRi) prior to NK cell killing assay downregulated key checkpoint molecules, including HLA-E, and key IFN-g signaling transcription factors (STAT1, IRF1) and led to enhanced NK cell killing among multiple FAB subsets in AML.
Conclusion: The data support targeting the AHR pathway as a dual tumor intrinsic and immune targeting therapeutic strategy for AML, particularly in combination with NK cellular therapy.
Introduction
Acute myeloid leukemia (AML) is a highly lethal disease characterized by clonal, neoplastic myeloid expansion and resultant bone marrow dysfunction. Despite significant advancements in our knowledge and treatment of AML, tumor-driven resistance strategies and crosstalk between immune cells remains elusive. As leukemic blasts progress, innate and adaptive immune resistance signatures emerge, highlighting the dual role of mutation acquisition and immune tolerance (1). Natural killer (NK) cells are a potential “off the shelf” cell-based therapy capable of inducing long-term survival in hematological malignancies (2–4). NK cell function relies on the complex interplay between activating and inhibitory signals. Key NK cell activating receptor-ligand pairs include NKG2D receptors (MICA, MICB, ULBP1, ULBP2/5/6), and FAS, while the presence of HLA class I, LILRB4, B7H3, TRAIL1, PD-L1, HLA-E and PD-L2 are known to inhibit NK cell function (5–7). Immature NK cells (i.e., Stage 1–3 including early progenitors which are CD56 negative, CD94 negative and CD16 negative produce higher levels of cytokines with little to no cytotoxicity while more mature NK cells (i.e., Stage CD56 bright/CD94 positive, low to absent killer immunoglobulin-like receptor (KIR), high inhibitory CD94/NKG2A heterodimer positive and Stage 5 CD56dim, CD94 negative, high KIR, and CD16 positive) have anti-tumor natural cytotoxicity as well as antibody dependent cellular cytotoxicity (ADCC) in the presence of CD16 expression (8). Major histocompatibility complex class I (MHC-I) HLA ligand expression on healthy and leukemic blasts mediate immune recognition. Downregulation of MHC-I classical (HLA-A, -B and -C) in AML leads to impaired CD8+ T -cell recognition, however, may increase susceptibility to NK cell mediated killing through lack of engagement with KIR and CD94/NKG2A heterodimer, respectively (9–13). MHC class II and non-classical MHC class I expression (HLA-E/F/G) also play major roles in immune recognition (14, 15). Previous studies have shown the NKG2A-HLA-E axis as a critical induced checkpoint for cytokine-induced memory-like NK cells leading to treatment failure in patients with AML (16). HLA-E, as well as other MHC class I genes, have been previously shown to be induced by IFN-γ, although HLA-E appears to be most sensitive based on the presence of a distinct IFN-γ-responsive element, termed the interferon response region (IRR) (17). In AML, u of HLA-E on leukemic blasts has been shown to occur through secretion of immature NK cell and T cell production of IFN-γ leading to leukemic blast immune evasion (18).
The aryl hydrocarbon receptor (AHR) is a ligand-activated transcription factor that regulates immune responses, cell growth, differentiation and environmental chemical detoxification pathways. AHR has many activating ligands, including 2,3,7,8-Tetrachlorodibenzo-p-dioxin (TCCD), formylindolo [3,2-b] carbazole (FICZ), metabolites of arachidonic acid, dietary indoles (cruciferous vegetables), kynurenine pathway and catabolism of tryptophan to N-formyl-kynurenine through tryptophan-2,3-dioxygenase (TDO2) and indoleamine-2,3-dioxygenases (IDO1 and 2) (19). Once AHR is activated, it dimerizes with AHR nuclear translocator (ARNT) to induce AHR-regulated genes including Cytochrome P450 1A1 (CYP1A1), Cytochrome P450 1B1 (CYP1B1) and Thrombospondin-1 (THBS1) by binding directly to gene promoters. Downstream effects of AHR activation include upregulation of MAPK and STAT signaling, cell differentiation, and regulation of immune cell maturation (20). Specifically, the AHR/kynurenine pathway is closely regulated by IFN-γ, which plays a central role in immune responses and inflammation. IFN-γ strongly induces the expression of IDO1, which catalyzes the conversion of tryptophan into kynurenine (21). This shift in tryptophan metabolism leads to local tryptophan depletion and kynurenine accumulation. Kynurenine acts as a ligand for AHR, promoting the differentiation of regulatory T cells (Tregs) and suppressing effector T cell activity, contributing to immune tolerance (22). Elevated kynurenine levels and kynurenine/tryptophan ratios are frequently observed in conditions characterized by chronic IFN-γ signaling, such as infections, cancer, and autoimmune disorders (23). Therefore, the kynurenine pathway serves as a key downstream effector of IFN-γ signaling, translating inflammatory cues into metabolic and immune regulation that can either resolve inflammation or facilitate immune evasion, depending on the context.
In AML, AHR has been found to be a driver of monocytic differentiation and chemotherapy resistance (24) (25, 26). In human and murine AML, AHR activation impairs innate lymphoid cell (ILC) development, blocking maturation, while AHR inhibition restored a normal NK cell maturation profile and sensitized leukemic blasts to NK cell-mediated killing (27, 28). The mechanism of enhanced killing with AHR antagonist has not been fully elucidated. Herein, we report a connection between AHR activation and high IFN-γ signature, monocytic differentiation, HLA-E expression and a resultant innate immune resistance. This unique axis is associated with high IFN-γ receptor 1 (IFNGR1) gene signaling and differential expression of key NK cell receptor-ligand pairs. Inhibition of AHR prior to NK cell co-culture resulted in enhanced NK cell killing among many FAB AML subsets and downregulation of STAT1. Our data adds to the existing literature that inhibiting AHR may be a therapeutic strategy to augment leukemic blast sensitivity to NK cellular therapy through modulation of HLA-E.
Materials and methods
Cell culture
Primary peripheral blood and marrow mononuclear cells (PBMCs) were obtained from healthy donor and AML patients in accordance with the Oregon Health & Science University Institutional Review Board (OHSU IRB protocol 4422) and the Declaration of Helsinki. The human MOLM-14 cell line (FLT3-ITD positive) were obtained from ATCC. STR profiling for human cell line authentication was performed in the OHSU DNA Services Core and tested for mycoplasma on a monthly schedule. All cell lines were maintained in RPMI, 10-20% fetal bovine serum (FBS), L-glutamine and penicillin/streptomycin. IK-364 was obtained from IKENA Oncology. Chemical structure is shown (Supplementary Figure 1A). The starting dose of IK-364 (3 µM) was chosen after testing percent inhibition of viable cells across graded concentrations on MOLM-14 parental cell line (Supplementary Figure 1B), and chosen based on inhibition of CYP1B1, a gene which is regulated by AHR (Supplementary Figure 1C) Primary AML PBMCs, previously frozen, were thawed and assayed in RPMI media containing 20% fetal bovine serum, 1% antibiotic/antimycotic, human interleukin-3 (hIL-3; 10ng/mL), hIL-2 (100 U/mL), hIL-6 (100 ng/mL) and stem cell factor (100 ng/mL). Primary patient samples were plated at 2 x 10⁶cells/mL and cell lines were co-cultured at a concentration of 0.5 x 10⁶ cells/mL in 2mL of media with IK-364 at 500 nM, 3 µM or DMSO (vehicle control) for 1 day, 2 days or 3 days, prior to performing assays. Annexin stain was used to determine initial viability between DMSO and treated samples without direct cell death noted at either 500 nM or 3 µM IK-364 dosing for 24 hours in healthy donor or AML patient samples (Supplementary Figure 1E).
Flow cytometry
Briefly, 1 x 10⁶ cells were stained with zombie aqua (Biolegend, #423101) and incubated for 15 minutes at room temperature in the dark. Cells were then washed with FACS buffer (PBS 2% bovine calf serum, 0.005% sodium azide) and resuspended in 20 μL/sample 1:50 human Fc block (Biolegend #422302) and incubated for 5 minutes on ice. Antibody cocktail was added to each sample for 30 minutes, washed and resuspended in FACS buffer prior to running on a BD Fortessa or BD FACSAria. Data analysis was done using FlowJo software. Antibodies used to characterize NK cell profiles are found in Supplementary Table 2.
RT-PCR for CYP1B1
RNA was isolated utilizing the PureLink RNA Kit (Life Technologies). Reverse transcription of RNA was performed utilizing the Superscript VILO system (LifeTechnologies). Quantitative PCR (qPCR) was performed using primers with SYBR Green Master Mix (Life Technologies) using a ViiA 7 RT-PCR system (Life Technologies) with CYP1B1 and glyceraldehyde-3-phosphate dehydrogenase (GAPDH) (internal control). SYBR Green primers were obtained from IDT. Primers are listed in Supplementary Table 3. Gene expression was normalized to an internal control (DCt = Ct gene of interest – Ct internal control).
Bulk RNAseq analyses
Among 69 newly diagnosed (ND) AML patients treated with 7 + 3 chemotherapy at OHSU (this clinical dataset is further explained below), 39 had available bulk RNA sequencing (RNAseq) data from Beat AML (with the generation and processing of these RNAseq data described in the original Beat AML paper) (29). Of these 39 AML patients, n=10 “low” NK cell (2.4% - 4.4%) and n=10 “high” NK cell (11.1% - 22.6%) were selected based on the bottom and top quartiles, respectively, of NK cell percentage of lymphocytes. Gene-level read counts from Beat AML were exposed to low-count filtering and normalized by the trimmed mean of M-values method (‘edgeR’ Bioconductor/R package). Surrogate variable analysis (‘SVA’ Bioconductor/R package) was applied to address confounding from unmeasured sources. For the 20 included patients, differential expression analysis (DEA) comparing NK high to NK low percentage was performed with the limma-voom procedure (‘limma’ Bioconductor/R package) upon adjusting for specimen type and 2 identified surrogate variables (30). Differentially expressed genes (defined as those with unadjusted p-value < 0.05) were utilized to conduct over-representation analyses within Gene Ontology (GO) terms and KEGG (Kyoto Encyclopedia of Genes and Genomes) pathways (‘limma’ package). Additionally, ordered (by log2fold change) gene set enrichment analysis (GSEA) was performed on all Reactome pathways comprising 5 to 500 Entrez ID-annotated genes (‘ReactomePA’ Bioconductor/R package).
Bulk RNAseq-based normalized gene expression values were obtained from Beat AML, with generation of these values previously explained (28, 50). “High” and “low” categorizations for AHR and HLA-E expression were defined as the top and bottom 10% of corresponding values, respectively. DEA was performed using limma-trend v3.54.1 (31). The resulting T-statistics were used to perform pre-ranked GSEA using ReactomePA v1.42.0 (32). Pathway significance was determined as FDR-adjusted p-value ≤ 0.05 (33).
Additional bulk RNAseq was performed on the MOLM-14 parental cell line, including 3 replicates a piece for 24-hour treatment with DMSO (vehicle control) or IK-364. OHSU’s Massively Parallel Sequencing Shared Resource (MPSSR) performed library preparation (TruSeq Stranded mRNA kit; Illumina Inc.), sequencing (NovaSeq 6000; Illumina), base calling (RTA v3.4.4; Illumina), paired-end read trimming (Trimmomatic 0.36), and alignment to the GRCh38.89 reference genome. Gene-level read counts were filtered (removing lowly-expressed genes) and normalized by the Trimmed Mean of M-values method (‘edgeR’ R/Bioconductor package). Surrogate variable analysis identified unmeasured confounders to be controlled for as covariates in gene-wise models. The limma-voom procedure (‘limma’ R/Bioconductor package) was applied to each remaining gene (using empirical Bayes to borrow information between genes) for DEA of IK-364 vs. DMSO, which produced log2 fold change estimates and associated raw and FDR-adjusted p-values (34).
CRISPR-Cas9 single gene inactivation by individual sgRNAs
Single sgRNA sequences were designed using Synthego design tool (https://design.synthego.com/#/) and converted to DNA sequences. Phosphorylated complementary oligonucleotides were annealed and ligated into BsmbI-digested pLentiCRISPRV2 backbone, containing sequences for Cas9 and puromycin resistance, and then validated by Sanger sequencing. Lipofectamine 2000 (Invitrogen, #11668019) was used to transfect HEK293T cells with single transfer vectors with packaging plasmids psPax2 (Addgene, #12260, RRID: Addgene_12260) and VSVG (Invitrogen) to generate virus. Viral supernatants were collected, filtered through 0.45-µm filters, and used for transduction of MOLM-14 cells using a spinoculation method. Knockdown of AHR and IFNGR1 was carried out by cloning sgRNAs into plentiCRISPRv2 (Addgene, #52961) as described previously (35). All sgRNAs used in this study are provided in Supplementary Table 5. Cells were selected with 2µg/mL of puromycin for 5 to 7 days and grown for 14 days in culture before experiments.
Western blotting
For the IFN-γ experiments, 2 x 10⁶ MOLM-14 cells were seeded in 4ml of RPMI with 100 IU/ml IFN-γ or 0.1% BSA in PBS. Following overnight incubation, cells were pelleted and lysed. Protein concentration was calculated with a BCA protein assay kit (Thermo Fisher). 120µg protein were mixed with NuPAGE LDS Sample Buffer (Invitrogen) and NuPAGE Sample reducing Agents and denatured for 10min at 95°C. Cell lysates were loaded onto each lane of a 4-15% Criterion Tris-HCl Protein gel (BioRad) and transferred onto a PVDF membrane (Millipore). Membranes were incubated in primary antibody at 4°C overnight prior to incubation in secondary antibody. ECL reagent (BioRad) was used to visualize protein. The primary antibodies included anti-AHR (Cell Signaling Technologies #83200). The protein levels were normalized to β-tubulin (Cell Signaling Technologies #2146).
Single-cell RNA sequencing
Five previously frozen peripheral blood AML mononuclear cells were selected for single cell sequencing based on normalized log2 RNA expression and available samples (2 AHR high >8 and 3 AHR low <5). Samples were thawed and sorted for viable cells at the OHSU Flow Cytometry Core Facility. Single-cell RNA sequencing was performed by the OHSU Massively Parallel Sequencing Shared Resource using the 10x Genomics Chromium system with Single Cell 3’ v3 chemistry. Alignment and counting were performed using CellRanger v6.1.2 relative to GRCh38. We removed cells with overall counts < 1,000 or > 20% mitochondrial gene count percentage. Additionally, we removed all cells flagged as doublets by the `scDblFinder` package (36) separately for each sample. We initially annotated the cells using an adapted version of the RandomForest classifier described previously (37). Processing was performed using Seurat with integration using Harmony. Pseudo-bulk differential expression was performed using limma-voom after removing samples/conditions with fewer than 10 cells (31). FDR adjustment was performed using qvalue (38).
Analysis of single-cell NK and T cell subsets
We first selected NK cells by requiring CD3D, CD3E and CD3G to be zero and either NKp80/KLRF1 or CD56/NCAM1 to be greater than zero as previously proposed (39). We then clustered these cells using Leiden clustering in Seurat after integrating the samples using Harmony. We used a small resolution (0.25) to coarsely define clusters. From examining these clusters, we identified one containing high quality NK cells based on expression of known markers (CD7, KLRF1, NKG7, GNLY) (40). We further stratified these cells into four groups based on the non-zero expression of CD16/FCGR3A and CD94/KLRD1. We evaluated these four groups for differential abundance using edgeR (41, 42). Similarly for T-cells, we first selected cells that had expression of at least one of the CD3 subunits. We then clustered these cells using Leiden clustering in Seurat after integrating the samples using Harmony. Selecting for fewer but larger clusters we used a Leiden resolution of 0.25. We selected two clusters based on the expression of the CD4 and CD8A and B genes, respectively.
Statistical analyses
Group differences were tested for continuous features with the Wilcoxon rank sum test and for categorical features with Fisher’s exact test. Specific statistical analyses are mentioned in other (context relevant) subsections of the Methods and described in figure legends. In all figures, “ns” denotes not significant (P ≥ 0.05), “*” denotes P < 0.05, “**” denotes P < 0.01, “***” denotes P < 0.001, and “****” denotes P < 0.0001.
Clinical outcome association with bone marrow NK cell percentage
Analysis was performed on a clinical cohort comprised of 69 adults with newly diagnosed AML (including 2 patients with an antecedent hematological disorder and 1 with therapy-related AML) between September 2010 and March 2016 who had a diagnostic bone marrow biopsy that underwent clinical flow cytometry and targeted next-generation sequencing (NGS) within 30 days prior to 7 + 3 induction treatment at OHSU on an IRB-approved protocol. Multicolor flow cytometry performed on the patient’s bone marrow yielded cellular estimates including white blood cell (WBC) count, leukemic blast percentage, lymphocyte percentage, absolute NK cell count (cells per microliter), and NK cell percentage (of lymphocytes). Lymphocytes were identified by CD45 expression and light side scatter and NK cells were defined as CD20-, CD14-, CD3-, and CD56+. NK cell percentage was dichotomized at the cohort median, resulting in “low” (n = 35; range = 2.1% – 8.7%) and “high” (n = 34, range = 8.8% – 22.6%) NK groups. Overall survival (OS) was measured from AML diagnosis date to the date of death or last contact, estimated with the Kaplan–Meier method, and compared between NK groups using the log-rank test and Cox regression models that produced hazard ratios and associated p-values. The effect of bone marrow T cell percentage on OS in a cohort that included these 69 AML patients was previously published.
NK cell cytotoxicity
For cytotoxicity assays, target cells (MOLM-14 cells or primary patient leukemic blasts) were pre-stained with 1µL of CellTrace™ Violet (Thermo Fisher) at 1:2000 dilution in PBS. Cells were stained at a concentration of 1 x 10⁶ cells/mL for 15 min at 37°C, protected from light. After 15 minutes, 5x cell staining volumes of RPMI-10% FBS was added and incubated for 5 minutes at 37°C. Cells were then pelleted and resuspended in fresh pre-warmed culture medium at 20,000 cells per 50 µL. Previously frozen healthy donor NK cells were thawed and stimulated overnight with 2.5 ng/mL hIL-2 and 1% NEAA (non-essential amino acids) prior to co-cultures. Targets were co-cultured with NK cells at effector-to-target (E:T) ratios of 20:1, 10:1, 5:1, 2.5:1 and 1:1 and incubated at 37°C for 3.5 hours. Caspase-3/7 Green Detection Reagent (Thermo Fisher) and SYTOX AADvanced dead cell stain solution (Thermo Fisher) were added during the last 30 min of culture for a total incubation time of 4 hours. Cells were then analyzed by flow cytometry. NK cell killing was calculated by subtracting the background of untreated target cells from all the other samples of the same experimental group.
Isolation and expansion of NK cells
NK cells from healthy donor peripheral blood were enriched using the RosetteSep™ Human NK Cell Enrichment Cocktail (StemCell Technologies) which removes unwanted cells via tetrameric antibody complexes recognizing non-NK cells and red blood cells (RBCs). These cells were then expanded on irradiated (100 cGy) K562-IL21 feeder cells (CSTX002, kindly shared by CYTOSEN) (43) at a ratio of 1:2 (PBMC∶ CSTX002) in NK cell media at 2×10⁵ PBMC/mL. Cultures were refreshed with half-volume media changes every two to three days and re-stimulated with CSTX002at a ratio of 1∶1 every seven days. Expanded NK cells were carried forward for subsequent stimulations or cryopreserved for later experiments.
Results
AML overall survival is associated with bone marrow NK cell percentage at the time of diagnosis
We conducted a retrospective study n=69 newly diagnosed (ND) adult AML patients who underwent intensive chemotherapy to determine the influence of pre-treatment NK cell percentage on survival. Patient demographics, disease characteristics, and clinical response- stratified by our median-dichotomized NK cell % groups- are displayed in Supplementary Table 1. We found that a higher NK cell percentage was associated with significantly shorter OS (Hazard Ratio [HR]=1.10 for each 1-unit increase in NK%, p=0.002; HR = 2.78 for NK% >median vs. ≤median, p=0.006; Figure 1A) similar to other publications (44, 45). This negative impact of higher NK% was also observed when adjusting for age, ELN risk, and de novo vs. secondary AML status (adjusted HR = 1.08, p=0.026 for each 1-unit increase; adjusted HR = 2.06, p=0.086 for NK% >median). While neither the number of marrow T cells (per µL) nor its percentage among lymphocytes was associated with NK% group, a higher T cell percentage prior to intensive induction chemo was correlated with longer survival (1-unit increase in T cell % HR=0.96, p=0.004) (Supplementary Table 1). A non-significant trend (p=0.197) toward higher NK% in non-monocytic AML (FAB M0-M2, n=41) with median (interquartile range [IQR]) of 9.1% (6.1%-13.1%) compared to monocytic AML (FAB M4/M5, n=25) with median (IQR) of 7.8% (4.7%-10.1%) suggests cell differentiation state may influence immune profiles. To determine global immune changes within this cohort on a broader scale, we performed RNA sequencing analysis of Beat AML patients who overlapped with our clinical cohort to explore MHC class I and II changes. There were 39 out of 69 patients in our clinical cohort with RNA sequencing. Within this subset of our clinical cohort, we performed DEA to compare n=10 low NK% to n=10 high NK % patients. We observed upregulation of genes encoding MHC class II proteins in our low NK cell % group, specifically: HLA-DRB1 (high to low NK % log2 FC = -2.0, p<0.001), HLA-DPB1 (log2 FC = -1.4, p<0.001), HLA-DPB2 (log2 FC = -3.5, p<0.001), HLA-DPA1 (log2 FC = -1.3, p=0.001), and HLA-DRA (log2 FC = -1.2, p=0.001) (Supplementary Figure 1D). Reactome-based GSEA also showed upregulation of the ‘MHC class II antigen presentation’ pathway (comprising ~100 genes) for low NK% patients compared to high NK% (FDR p=0.015). Together, our data suggests that tumor MHC expression may impact immune microenvironment which may reflect leukemic blast differentiation state.
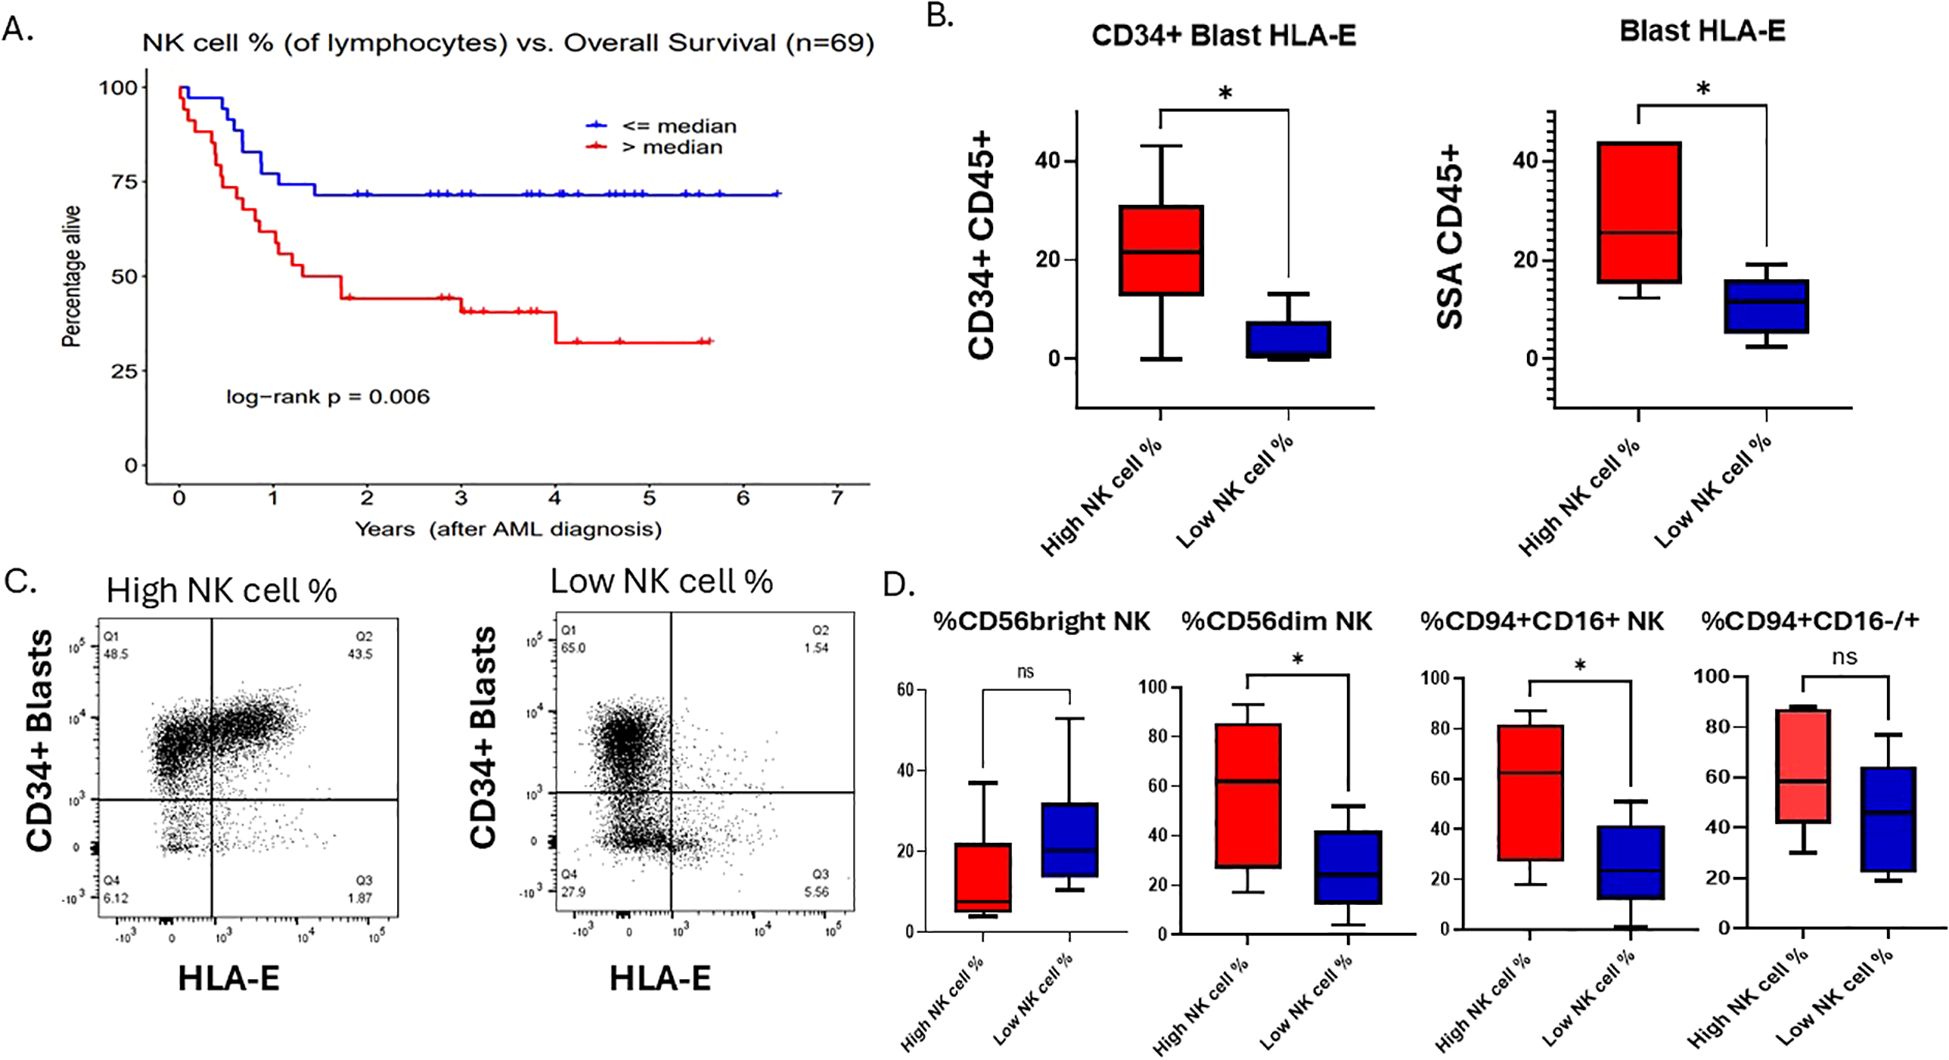
Figure 1. AML overall survival is associated with bone marrow NK cell percentage at the time of diagnosis. (A) Overall survival Kaplan-Meier curves for “low” vs. “high” total NK cell % groups as determined by the sample median. (B) Flow cytometry analysis of AML blasts gated on CD34+ HLA-E+ or SSA/CD45+ blasts, respectively, of NK cell % high patient and NK cell % low patient dichotomized at the cohort median. Student t test, *P <.05. Error bars indicate SD. (C) A flow cytometry plot showing HLA-E on x-axis and CD34+ on the y-axis of a representative patent from the high NK cell % cohort and one from the low NK cell % cohort. (D) Flow cytometry analysis of 12 primary AML samples within our clinical cohort with relative % of NK cell subsets of lymphocytes that are CD56 bright, CD56dim NK cells or CD94+/CD16+/-, gated on lineage negative (CD3, CD20, CD14) in NK% high (n=6) and NK% low (n=6).
To examine this further, we identified 12 samples with viably frozen bone marrow cells (6 with high NK cell percentage; 6 with low NK cell percentage). We examined cell phenotypes using flow cytometry markers that included CD45, CD34, CD56, CD94, CD16, HLA-E, CD3, CD13, CD14, CD20 and a viability dye. The samples with high NK cell percentage exhibited increased expression of HLA-E on both CD34+ leukemic blasts as well as on the total leukemic blast population (Figures 1B, C), suggesting that despite a high percentage of mature NK cells, the killing of leukemic blast targets by NK cells may be blocked by inhibitory HLA-E expression on the AML tumor cells. Previously published data shows that overexpression of HLA-E is dependent on IFN-γ produced by immature (CD56 bright) NK cells and CD8 T cells (18). Previous publications have found that higher immature NK cell percentage is associated with worse prognosis (46, 47). Thus, we hypothesized that immature NK cells were responsible for the higher levels of HLA-E on leukemic blasts in these samples. In contrast to this hypothesis, we found that the samples with high NK cell percentage had lower levels of CD56bright NK cells (Figure 1D), however this was not statistically significant due to low sample size. Since almost all CD56 bright NK cells also express CD94, we performed additional flow analysis on patient samples within our cohort using CD94 in addition to CD56 and CD16. We found that the NK cell high% samples had relatively higher % of total CD94+ NK cells compared to low NK cell% and found that NK cell% high patients had higher expression of CD94+/CD16+ compared to NK cell% low samples (Figure 1D). The CD94+ CD16-/+ NK cells (stage 4/early stage 5) represent a functionally distinct population of early mature, cytotoxic NK cells that play significant roles in interferon gamma production, especially under conditions of activation. Resting CD94+CD16+ NK cells have limited interferon gamma but upon activation by tumor cells produce high levels of interferon gamma. The fact that high NK cell % patients have higher relative numbers of CD94+ CD16+/- NK cells could explain a link between interferon gamma secretion from the microenvironment and higher HLA-E expression on myeloid blasts. Overall, this suggests that NK cell immune profiles in AML patient’s bone marrow at diagnosis impact survival but also may correlate with tumor resistance signatures dependent on leukemic blast maturation state. To first understand the clinical significance of higher HLA-E expression in AML and differentiation state, we set out to determine the genetic signature associated with HLA-E gene expression in AML using the Beat AML dataset and The Cancer Genome Atlas (TCGA).
Characterization of HLA-E in AML
HLA-E is the major ligand for the inhibitory receptor CD94/NKG2A found on both NK cells and subsets of cytotoxic CD8+ T cells and is highly conserved among MHC class I genes with only two allelic variants (Arg in HLA-E*0101, Gly in HLA-E*01031) (48). Expression and the role of HLA-E is not well-characterized in AML; however, downregulation can lead to enhanced NK cell recognition. To explore the possibility of targeting HLA-E as a means to enhance cellular therapy, we endeavored to define associations with HLA-E RNA expression from Beat AML dataset with ELN risk, genetic subtype and FAB status. HLA-E gene expression showed variation across common AML gene fusions; in particular, compared to cytogenetically normal AML, HLA-E expression was lowest in promyelocytic leukemia (PML)/retinoic acid receptor α (RARA) fusion gene (p=0.00016) and highest in GATA2-MECOM (p=0.00479) compared to normal karyotype based on the Beat AML dataset (Figure 2A) and validated in the TCGA dataset (Supplementary Figure 4A). HLA-E was upregulated in residual AML versus ND AML, suggesting potential differences in microenvironment favoring immune resistance in AML cases more recalcitrant to up-front therapy (p=<0.00001) (Figure 2B). This observation may also suggest that AML therapy can drive an inflammatory process that induces HLA-E gene upregulation. We observed a correlation between HLA-E gene transcript levels with transcriptional signature classifications of AML cell differentiation state (37). Specifically, we found that HLA-E expression was correlated with monocytic-like leukemic blast differentiation state based on RNAseq classification of cell states in both Beat AML dataset by published methods (37) (Figure 2C, r=0.48, p-value = 1.075353e-33) and in TCGA dataset Supplementary Figure 4B (TCGA monocyte-like vs HLA-E, r=0.517; 0.4-0.617 95% CI; Pval: 1.31e-13; Pearsons correlation). In line with this finding, HLA-E was highly correlated with AHR (p<0.0001) in the Beat AML dataset, previously found to be a driver of monocytic maturation in AML (25, 26) (p<0.0001) (Figure 2D) as well as in the TCGA dataset (High vs Low: 0.69; 0.272-1.11 95% CI; Pval: 0.00207; Welchs T-test) (Supplementary Figure 4C). In addition, the protein expression of HLA-E was also found to correlate with AHR levels in primary AML patient samples (Figure 2E) (29, 49). Monocytic AML tends to be more inflammatory and may exploit IFN- γ signaling for survival-γ (50). To explain the presence of higher HLA-E expression in AHR high monocytic AML patient samples, we hypothesized that these tumors may exhibit higher dependence on IFN-γ signaling as dictated by higher relative expression of interferon gamma receptor 1 (IFNGR1). As expected, we found higher IFNGR1 gene expression in monocytic FAB M4/M5 compared to FAB M0/M1 subtype (Figure 2F). The distribution of IFNGR1 among all FAB subtypes is included in Supplementary Figure 2B. Since HLA-E can be upregulated by cell stress and high states of IFN-γ (18), we next sought to examine the immunological signatures associated with AHR activation.
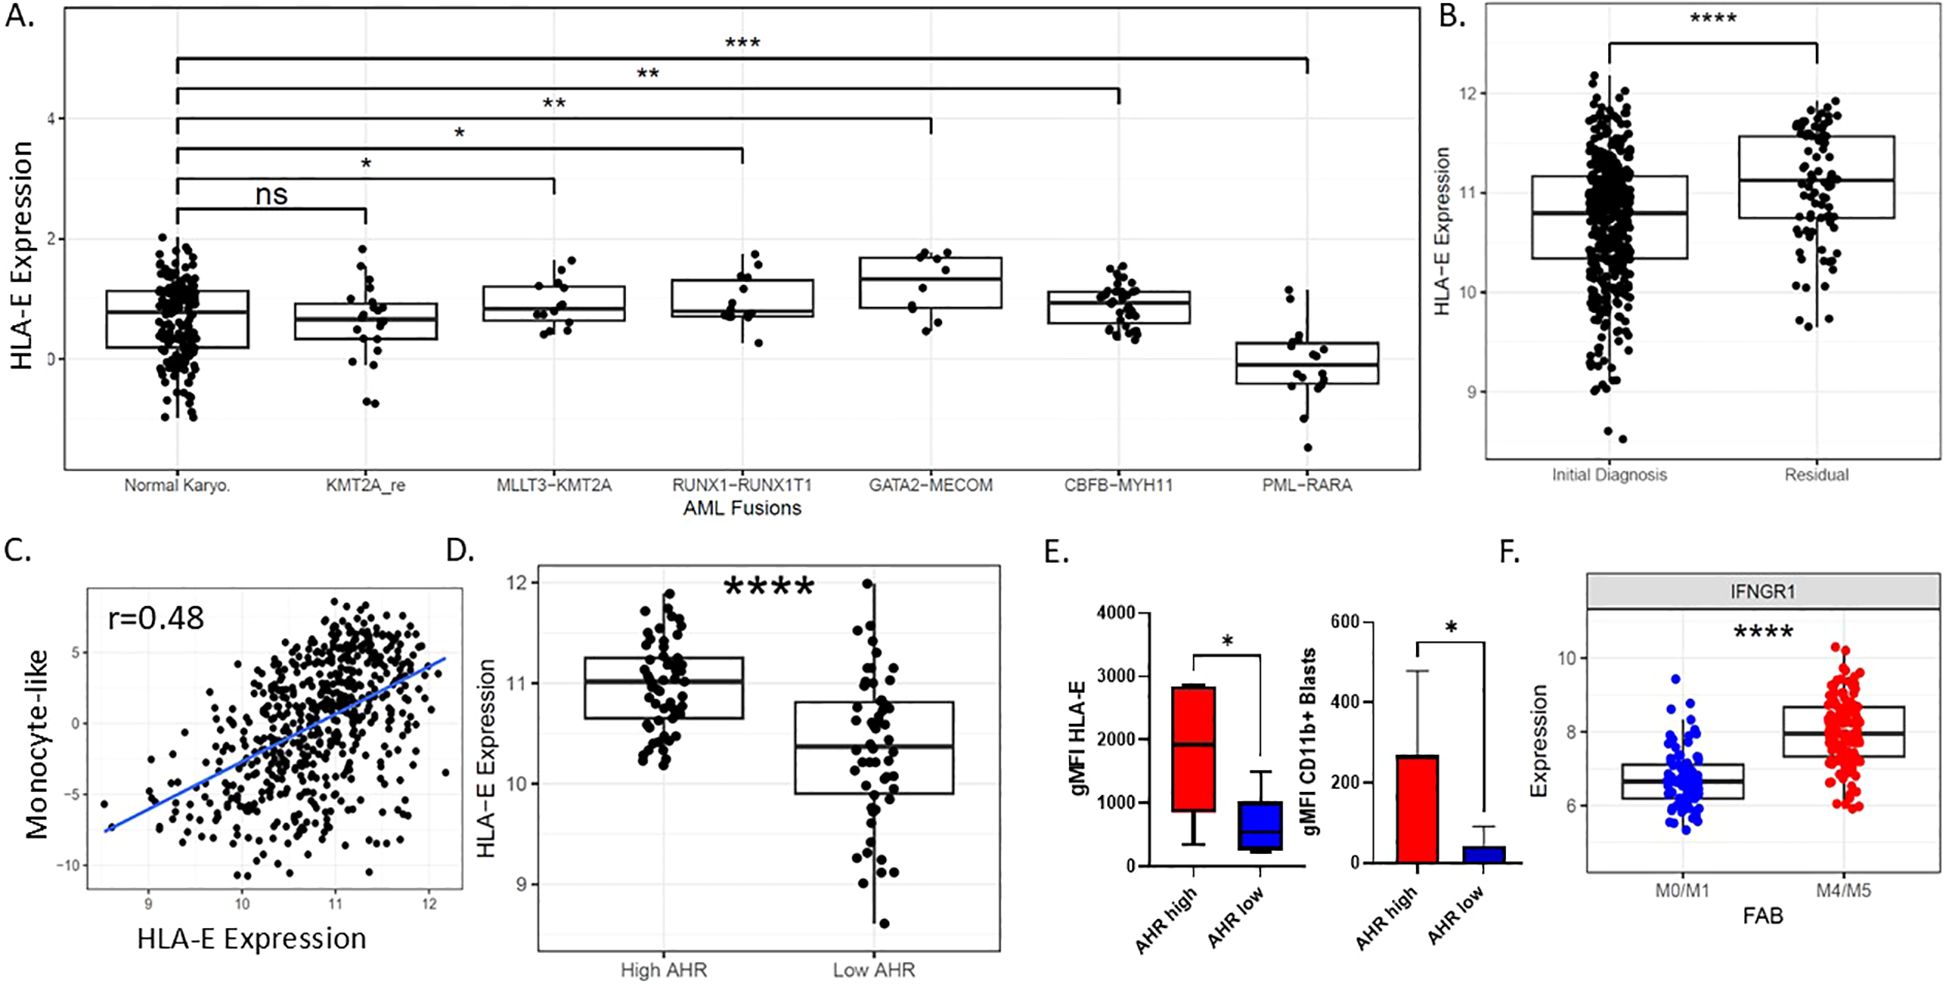
Figure 2. Characterization of HLA-E in AML. (A) HLA-E expression by RNA sequencing among common AML genomic fusion partners. (B) HLA-E expression by RNA among newly diagnosed and refractory AML patients. (C) Pearson correlation plot showing RNA monocyte-like differentiation state scores based on RNAseq as published (32) and HLA-Expression, r=0.48; p-value is 1.075353e-33. (D) Expression of RNA levels of HLA-E correlated with AHR RNA expression groups in beat AML patients ****p<0.0001. (E) AML patient samples protein expression of HLA-E and CD11b based on AHR low or AHR high status (n=12). (F) IFNGR1 correlates with FAB classification state in primary AML samples, ****p<0.0001. * p<0.05, ** p<0.01, *** p<0.001, **** p<0.0001, n.s., Non-significant.
AHR high AML samples have a gene signature enriched in IFN-γ signaling, inflammatory, and immune response pathways
Although AHR has been shown to be associated with monocytic AML maturation and a distinct genomic signature, the immune profile has not been fully explored. Utilizing the Beat AML dataset of 560 patients with RNAseq data, published by our group in collaboration with others, we ranked all de-novo samples by normalized AHR expression with “high” and “low” expression groups based on the 90th and 10th percentiles, respectively. Group 1 was labeled as “AHR high” and group 2 labeled as “AHR low”. Genes with increased expression in the AHR high samples were enriched in Reactome pathways such as TCR signaling, IL10 signaling, PD1 and IFNγ signaling. While genes with increased expression in the AHR low group were enriched in Reactome pathways pertaining to DNA repair and telomere maintenance (Figure 3A) (Supplementary Figure 2A) (51). In addition, when ranking AHR RNA levels by immune ligands of interest, the AHR low and high samples clustered into three groups of samples: Cluster1 and Cluster2 were mainly comprised of AHR low samples while AHR high samples were found in Cluster3. With respect to the AHR pathway genes and immune markers, Cluster1 had decreased expression, was (i.e., ‘immune cold’), Sample Cluster3 had increased expression, (i.e., ‘immune hot’), while Cluster2 had mid-range expression (Figure 3B). The AHR low group had the lowest expression genes encoding MHC class I and II as well as key immune markers, including downregulation of immune checkpoint molecules (LILRB1, HLA-E, CD274 (PD-L1) and IFNG. In addition, AHR high AML samples had lower percentages of total CD56+ NK cells as well as lower mature NK cells defined as lineage negative (CD3-, CD14-, CD20-), CD56dim, or CD94+ CD16+ NK cells (Supplementary Figure 2E, Figure 3C). These findings suggest a connection between AHR signaling and the complex immune microenvironment that is critical for dictating immune response. Monocytic AML defined by high AHR may be less susceptible to immune based killing. Overall, our data suggests that monocytic AML is associated with higher AHR expression but also a unique immune profile which may be deleterious to overall survival in AML patients. To determine the baseline levels of IFN-γ in monocytic AML and effect of IFN-γ on leukemic blasts, we exposed MOLM-14 cells to IFN-γ and measured AHR levels by western blotting. We found that interferon gamma upregulated AHR after 24 hours in MOLM-14 cells (Figure 3D) mimicking the proposed changes we see in the microenvironment with NK or T cell IFN-γ secretion. To confirm this, we also performed genetic knockdown of IFNGR1 in MOLM-14 and found that AHR secretion was dependent on the presence of IFNGR1 likely due to a dependency on JAK/STAT signaling to produce AHR upregulation (Supplementary Figures 2C, D) and also described recently in another published manuscript (52). We therefore propose that AHRi mediated control of HLA-E is related to STAT1 signaling controlled by IFN-γ (Figure 3E). To validate the source of IFN-γ secretion in the microenvironment and to obtain more accurate NK cell characteristics including NK cell receptor/ligand pairs in AML patients, we performed single-cell RNA sequencing on AHR high vs AHR low peripheral blood samples.
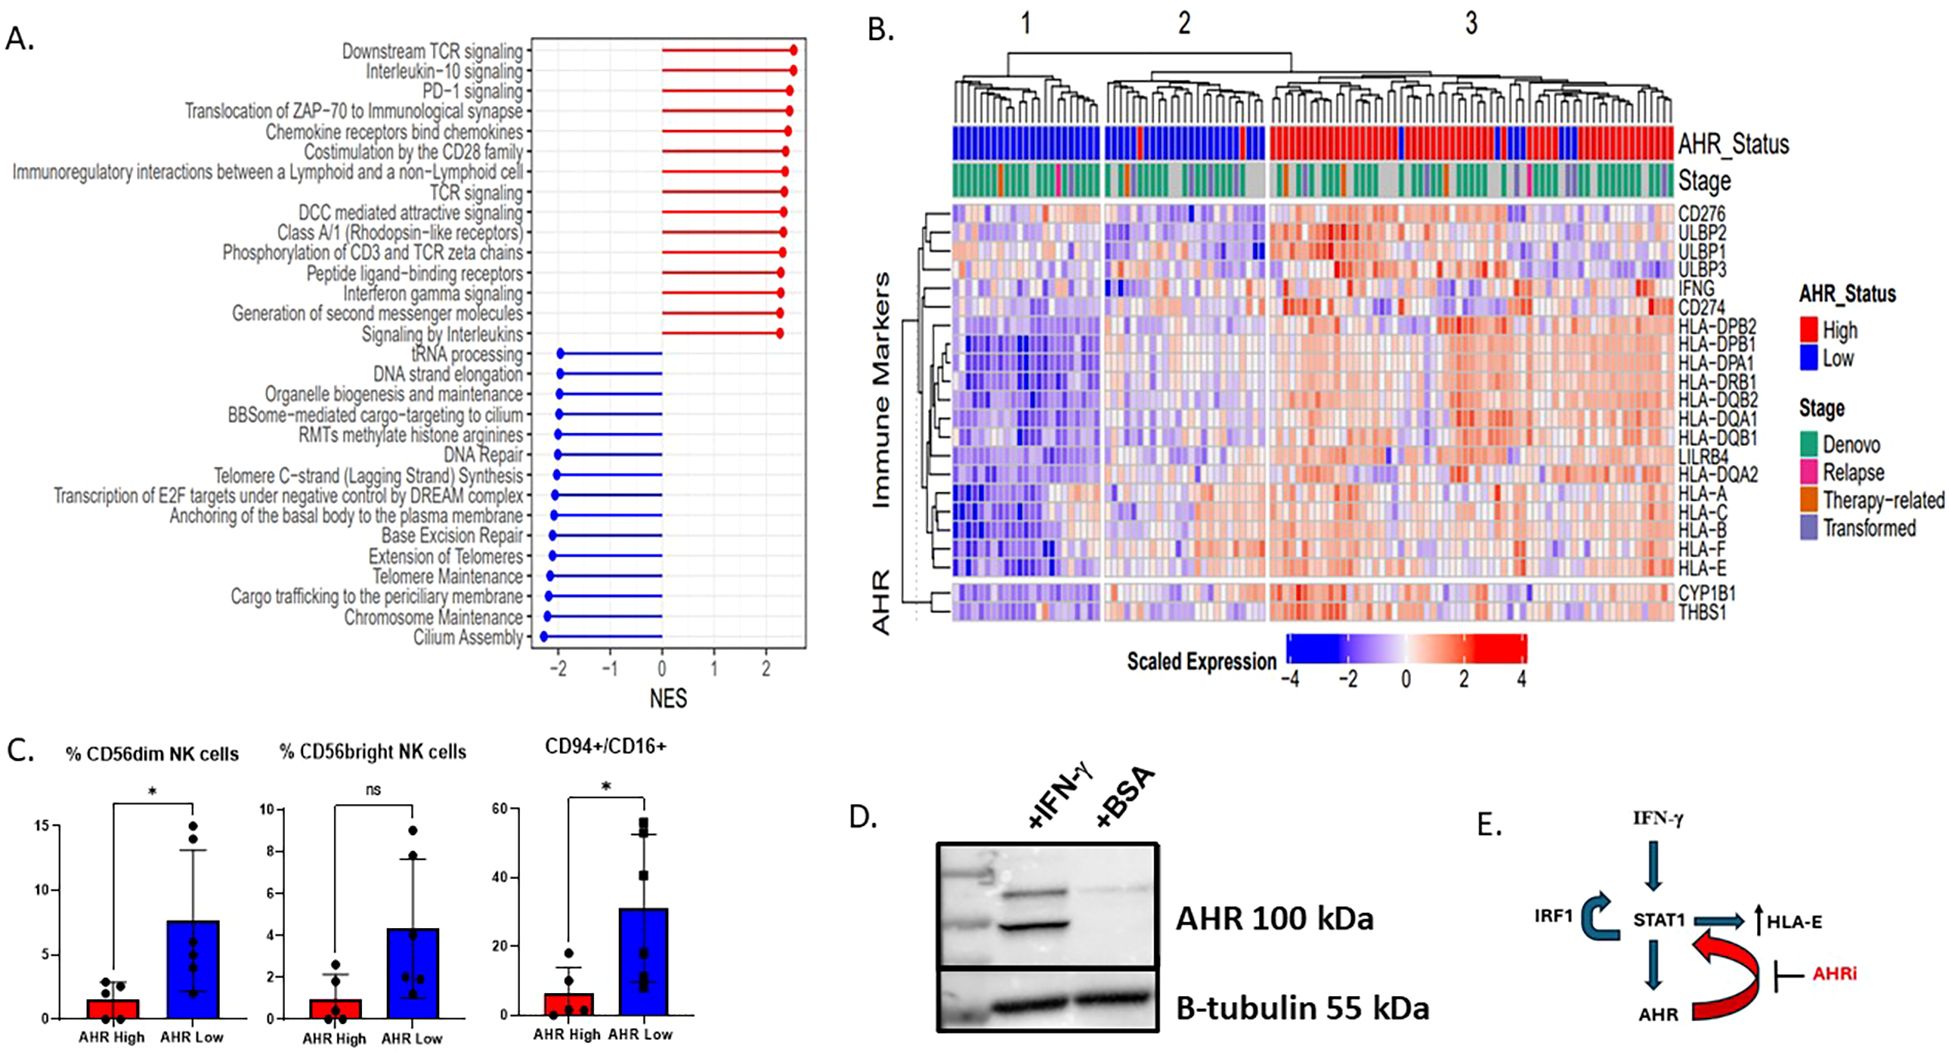
Figure 3. AHR high AML samples have a gene signature enriched for interferon gamma signaling, inflammation, and immune response pathways. (A) Forest plot showing the differential expression of key immune pathways in the top 10% AHR high vs bottom 10% AHR low AML samples in beat AML by RNA sequencing. Sample size includes 545 patients. NES is normalized enrichment score between AHR high vs AHR low based on log2 fold change RPKM. (B) Heatmap displaying the scaled expression of genes associated with AHR as well as immune ligands. Beat AML patient samples were ranked by AHR with the top 10% deemed high and lowest 10% low. They are shown and clustered based on average-linkage hierarchical clustering (n=111). (C) Flow cytometry summary statistics showing 11 patient samples which are AHR high or AHR low (n=11) and relative % of NK cells of lymphocytes based on AHR high (n=5) or low (n=6) on lineage negative CD56+ cells (n=11). * p<0.05 (D) MOLM-14 cells treated for 24 hours with interferon gamma 100 IU/ml or BSA (control) and AHR expression was measured by western blot. (E) Proposed mechanism of how AHR interacts with HLA-E via STAT1. IFN-γ triggers a signaling cascade involving the IFN-γ receptor and ultimately leads to the phosphorylation of STAT1. STAT1 then can bind to the HLA-E gene promoter, increasing HLA-E transcription and expression. Activation of the JAK/STAT pathway leads to the transcription of IRF1, and IRF1, in turn, can contribute to a positive feedback loop by promoting STAT1 phosphorylation and DNA binding, further enhancing the JAK/STAT signaling. We therefore propose that AHRi directly inhibits AHR and downregulates STAT1 leading to HLA-E downregulation.
High AHR AML is associated with abnormal NK cell profiles in peripheral blood
AML evades both innate and adaptive immunity through several defined mechanisms and may be dependent on maturation state of the leukemic blast (53–55). The interplay between leukemic blast maturation state and immune recognition has not been clearly defined in the context of AHR. We previously looked at the role of NK cell percentage and number in newly diagnosed AML samples and found that higher NK cell percentage in the marrow was associated with worse OS. We therefore wanted to determine if NK cell profiles in the peripheral blood were different among monocytic AHR high AML samples vs low. We used single-cell RNAseq to characterize NK maturation and receptor-ligand pairs in 2 AHR-high (>8 RPKM) and 3 AHR-low (<5 RPKM) peripheral blood samples from AML patients. Characteristics of these patient samples are displayed in Supplementary Table 4. Cell type clusters in these samples are displayed using UMAP for AHR high and AHR low malignant cells and non-malignant cells to determine cell type differences (Figure 4A). Consistent with our flow cytometric analysis (Figure 3C), single cell analysis of the 5 AML samples demonstrated that AHR-high samples have a lower percentage of mature CD56dim, CD94+/- CD16+ “stage 5” NK cells in the peripheral blood compared to AHR-low samples (Figure 4B). In addition, NK cells identified in AHR-high samples had less expression of NCRs (NKp30), CD16, NKG2D, and 2B4 (Figure 4C) (56). NK cells from AHR-high samples also had lower expression of perforin (PRF1) and granzyme A/B (GZMA, GZMB), suggesting that AHR-high NK cells are hypofunctional compared to AHR-low samples. Previous studies have shown that AHR directly binds to the promoter of IFNG in human NK cells; thus, we hypothesized that the NK cells are secreting IFN-γ rather than an autocrine process by leukemic blasts. We indeed found that IFN-γ was highest in NK cells (particularly the CD94-, CD16- subset, likely stage 2 immature NK cell) and cytotoxic CD8+ T lymphocytes and not found in leukemic blasts (Figure 4D). We also looked at T cell subsets, defined as CD3+ CD8+ or CD4+ cells and found no significant differences between AHR groups (Supplementary Figure 3A). To pair our immune findings with leukemic blast differentiation state, we examined NK receptor ligands (NKRLs) known to impact T and NK cell function (including MHC Class I, LILRB4, TRAILR1, B7H3, CD112, TRAILR2, MICA/B and FAS) based on differentiation state of the leukemic blast defined by single-cell sequencing (HSC/Prog state being more immature while the Promono/Monocytic/Dendritic cell leukemic blast being more mature), as previously described (29, 37). Among the NKRLs examined, NKG2D receptor ligands (MICA, MICB ULBP1, ULBP2/5/6) and FAS are known to confer an activating signal to NK cells while MHC class I, LILRB4, B7H3, TRAIL1, PDL1, and PDL2 are known to inhibit NK cell function (5, 57). AHR-high samples had significantly higher expression of NK cell inhibitory receptors MHC Class I (HLA-A, -B, -C, -E) and LILRB4 (FDR <.05) than AHR-low samples on monocytic leukemic blasts (Figure 4E). MHC Class I subsets among all leukemic blast maturation states are shown in Supplementary Figure 3B. CD112, TRAILR1, and B7H3 also trended higher in AHR-high samples. Absence of NKG2D ligands on stem cells were previously reported to be a mediator of immune evasion (7). Interestingly, MHC Class I was more highly expressed on both HSC and mature leukemic blasts in the AHR-high samples compared to AHR-low (Supplementary Figure 3C). In summary, our data supports other published reports linking differentiation state of the leukemic blast with immune sensitivity, which may be driven by AHR (5, 7, 37). Given the relatively high transcript levels for MHC Class I and HLA-E and the lower expression of NK cell activating receptors in AHR-high samples, we hypothesized that blocking the AHR pathway with an AHR inhibitor may enhance NK cell killing through modulating leukemic blast ligands.
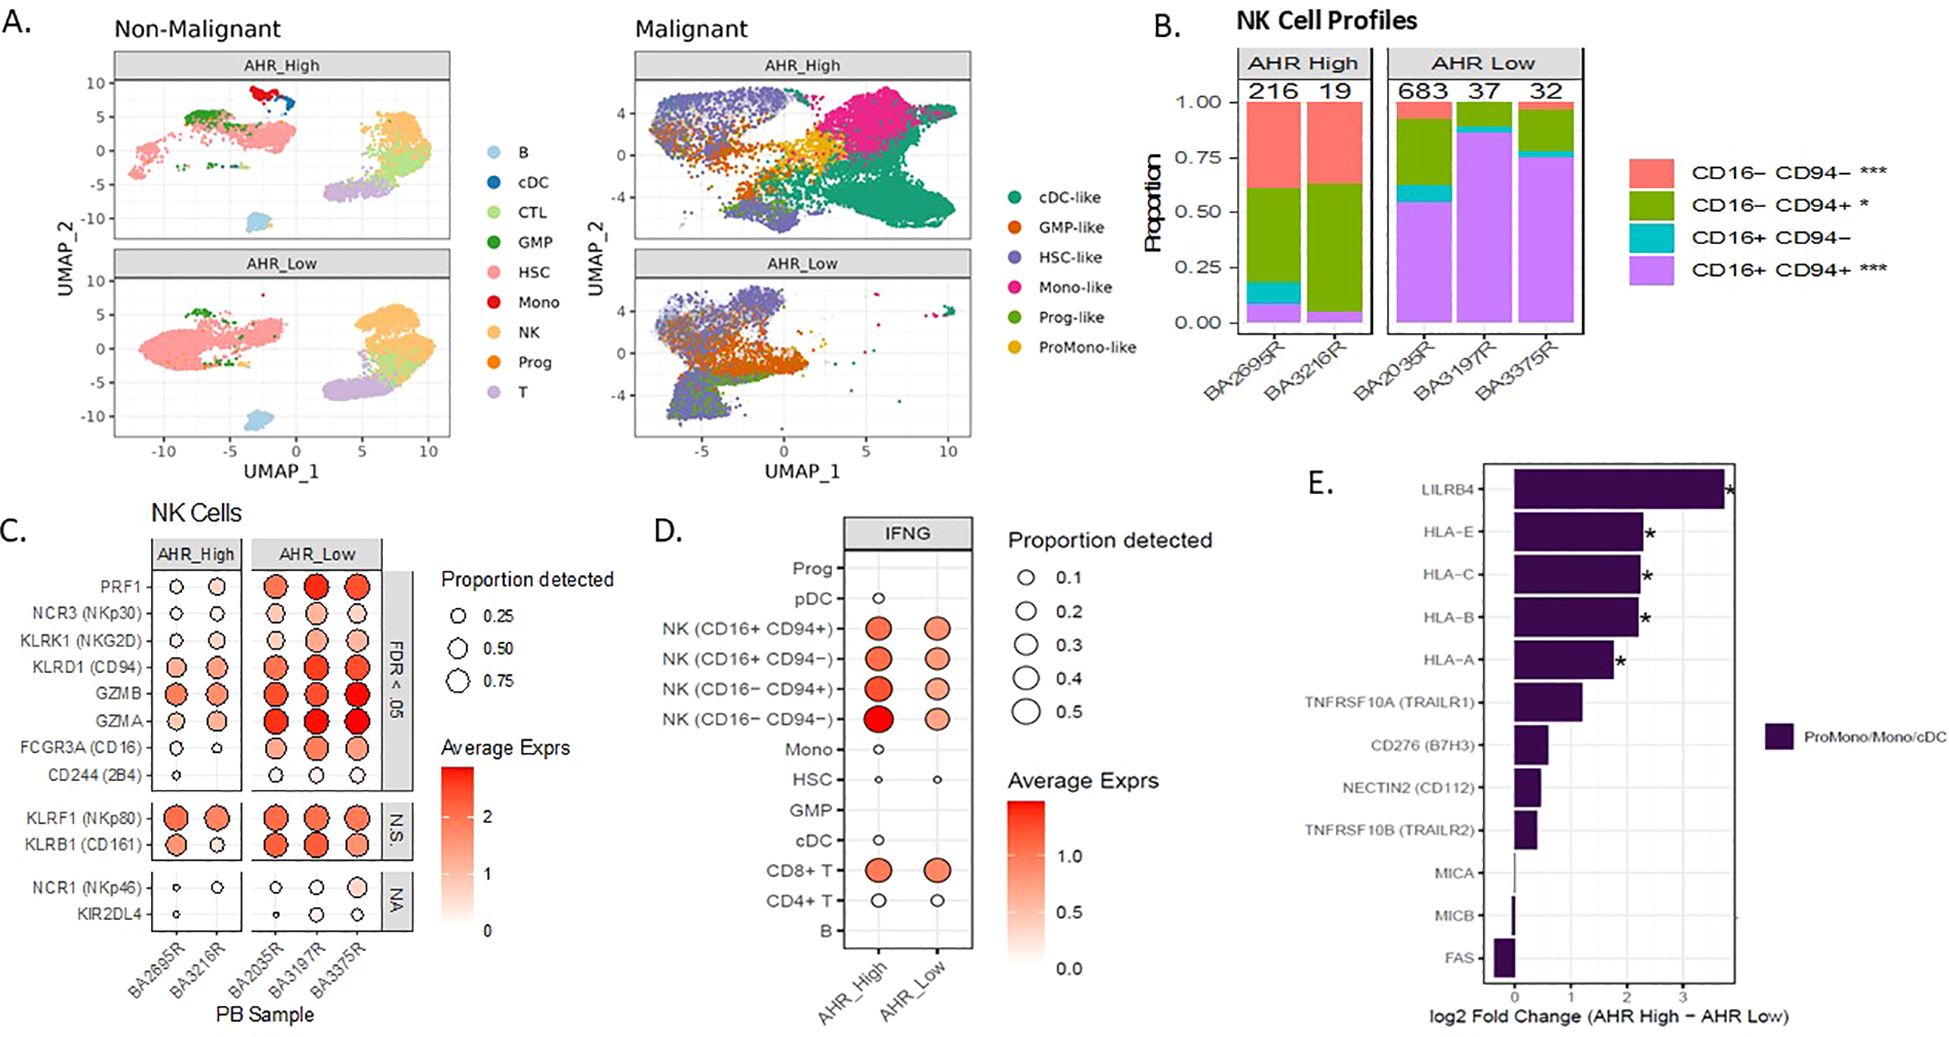
Figure 4. AHR pathway activation in AML correlates with abnormal NK cell profiles in PB. (A) Single cell UMAP clustering of AML peripheral blood samples with predicted non-malignant and malignant cell profiles separated by AHR high and AHR low samples. (B) NK cell maturation of single cell samples based on percentage of CD94/CD16 in 2 AHR high vs 3 AHR low (n=5). (C) Single cell NK cell receptor average expression (based on color scale) and proportion detected (size of circle) on AHR high and low samples. Significance indicated by FDR <0.05, N.S. indicates non-significance, NA indicates not evaluable. (D) Average expression and proportion detected of IFN-γ across the single-cell subsets for both AHR high and AHR low samples. (E) Pseudobulk differential expression of blast ligands on monocyte-like blasts in AHR high and AHR low samples. *FDR <.05.
AHR inhibitor enhances NK cell cytotoxicity and downregulates HLA-E and STAT1
HLA-E is the major ligand for the inhibitory receptor CD94/NKG2A found on both NK cells and subsets of cytotoxic CD8+ T cells and is highly conserved among MHC Class I genes (48). The expression and role of HLA-E is not well-characterized in AML; however, downregulation can lead to enhanced NK cell recognition. IK-364 is a potent AHR inhibitor in pre-clinical development. Dose-finding studies showed that IK-364 is a potent inhibitor of AHR, demonstrated by the decreased expression of AHR downstream target CYP1B1 at all tested (Supplementary Figure 1C) and noted to have an IC50 of 5nM in MOLM-14 cells. Of note, the 3µM IK-364 dose was not associated with direct cell apoptosis (Supplementary Figure 1E). To determine the functional impact of blocking the AHR pathway on leukemic blasts, MOLM-14 cells were cultured with IK-364 3uM for 48 hours. Compared with the vehicle control group, pre-treatment with 3 µM IK-364 enhanced NK cell-mediated cytotoxicity against MOLM-14 as well as in primary patient samples (Figure 5A) of different FAB classification subsets (Supplementary Figure 5). Clinical characteristics of all patients are shown in Supplementary Table 4. Furthermore, this enhanced NK cell killing after exposure to IK-364 also correlated with a downregulation of HLA-E in patient samples (Figure 5B) and in 12 patient samples (Figure 5C). To validate the significance of HLA-E as mediator of enhanced NK cell killing, we performed assays using NK cells treated with a NKG2A blocking antibody for 30 minutes prior to adding them to the targets. We found that the addition of the NKG2A blocking antibody blocked the effect of IK-364 in a patient sample with high HLA-E, suggesting that the HLA-E-NKG2A axis is a major driver of NK cell resistance (Figure 5D). To determine the mechanism behind HLA-E downregulation with IK-364, we performed bulk RNAseq sequencing to assess expression of gene encoding transcription factors known to regulate HLA-E such as GATA2, CIITA, STAT1, IRF1, NF-kB and HOXA5. We found significant downregulation of both STAT1 (FDR p=0.012) and IRF1 (FDR p=0.016) when exposed to 24 hours of 3uM IK-364 compared to DMSO alone (Supplementary Figure 6). Kynurenine, STAT1 and IRF1 are closely connected through the IFN-y signaling pathway. IFN-γ activates STAT1 leading to induction of IRF1. IRF1 binds to the promoter of the IDO1 gene, which is the enzyme that catalyzes the conversion of tryptophan to kynurenine initiating the kynurenine/AHR pathway. To determine if AHR mediates direct regulation of HLA-E (outside of STAT1/IFN-γ)we performed genetic KO of AHR and did not see a significant impact on HLA-E expression (Supplementary Figures 7A, B) suggesting that HLA-E regulation by AHR is likely through an indirect mechanism (ie. IRF1 and/or STAT1) rather than direct. Given the connection between monocytic AML and BCL2 inhibitor resistance, we set out to determine if the co-expression of AHR and HLA-E could discriminate BCL2 family expression as well as expression of an immune repertoire. To our surprise, the co-expression of both HLA-E and AHR by RNA, clearly separated patients visually into immune “hot”/high AHR states vs immune “cold”/AHR low states (Figure 5E) where “hot” indicates higher relative centered/scaled expression (Zscore > 0) and “low” indicates lower relative expression (Zscore < 0). These data add to the growing literature of a dual role of AHR signaling in controlling key mediators of immune regulation as well as leukemic blast cell differentiation state. Our work highlights a continued interest in the role of AHR blockade in AML and adds to the literature on how AHR inhibition may enhance NK cell killing through modulating the expression of leukemic blast ligands that are critical for NK cell function.
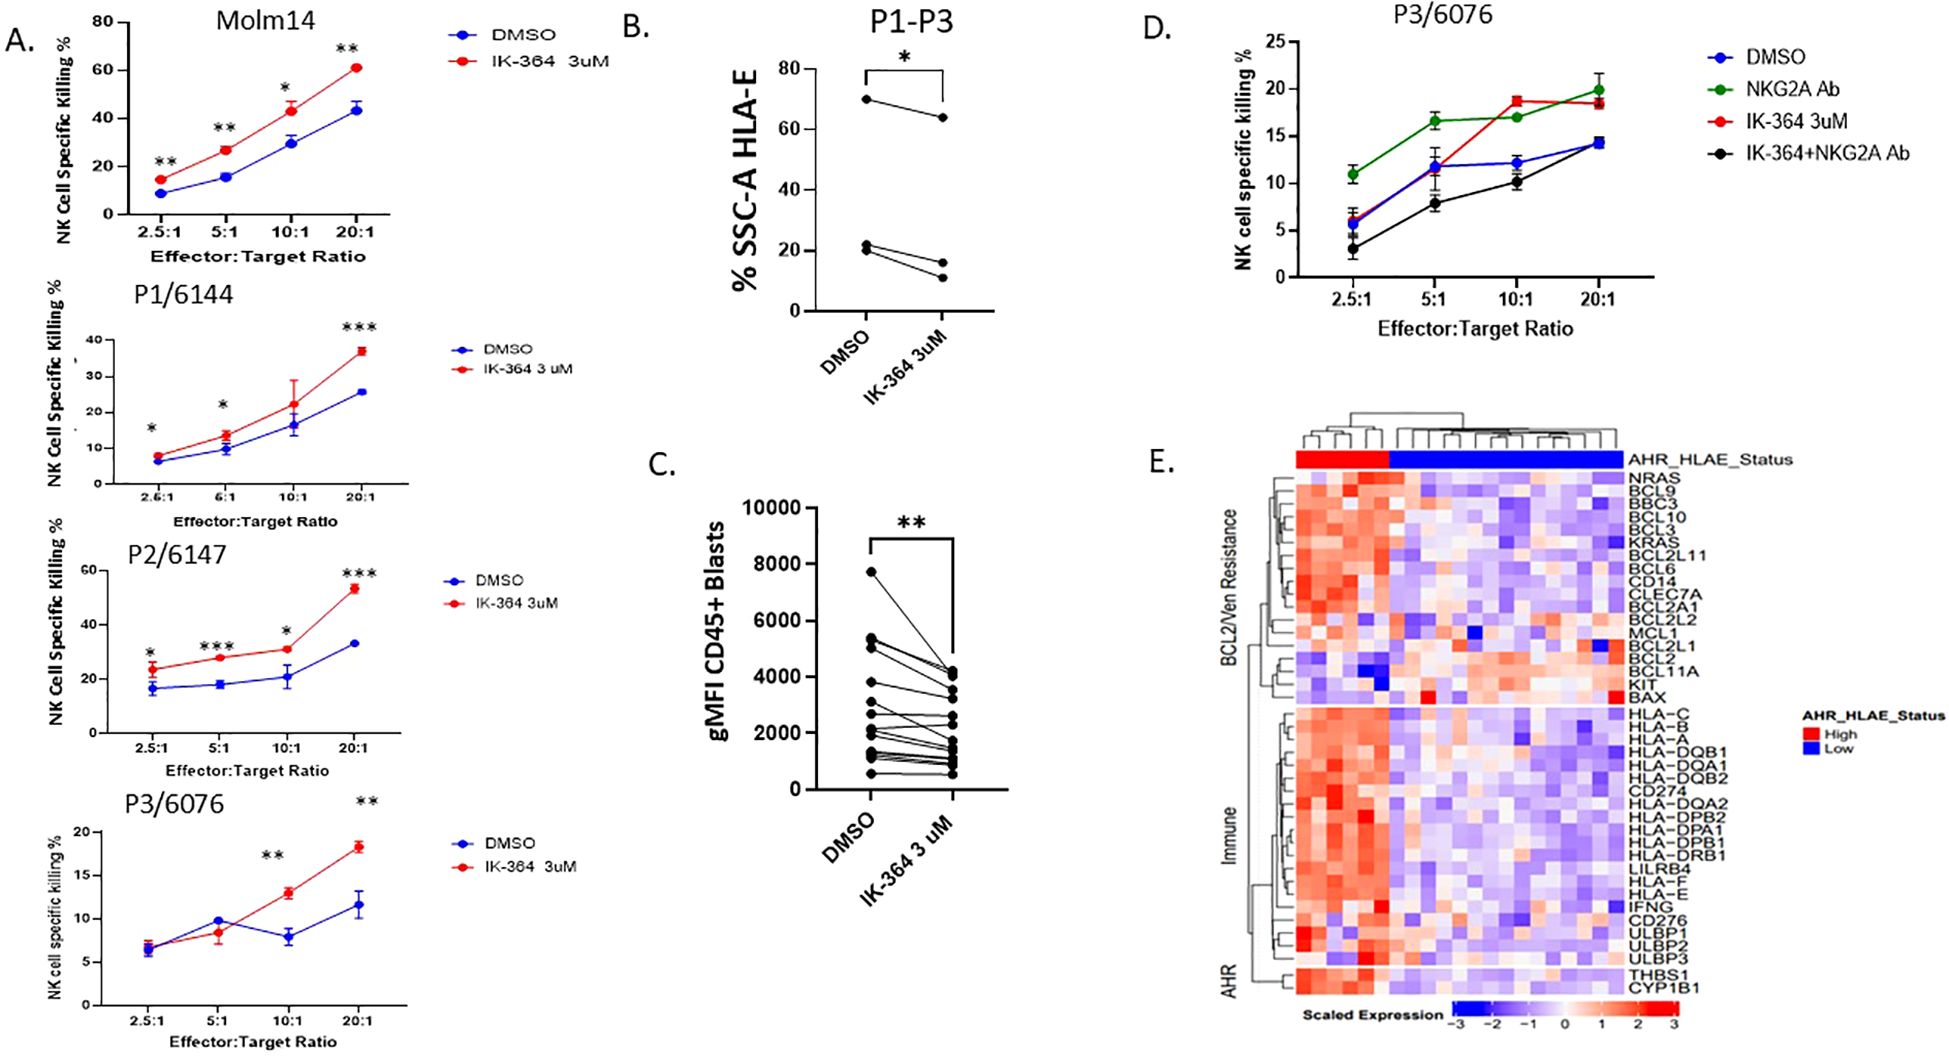
Figure 5. AHR inhibitor, IK-364, enhances NK cell cytotoxicity and downregulates HLA-E. (A) NK cell killing assay on MOLM-14 cell line (repeated in triplicate) and patient samples pre-exposed to IK-364 3 µM for 48 hours prior to NK co-culture. Each dot has 3 replicates with error bars shown. p<0.05, ** p<0.01, ***p<0.001 (B) HLA-E protein expression based on % SSC-A of live cell HLA-E + by flow cytometry between vehicle treated (DMSO) or IK-364 for 48 hours in patient samples (P1-P3), paired student T test P<0.05. (C) HLA-E geometric mean florescent intensity (gMFI) between DMSO or IK-264 treated AML patient samples (n=12). ** P<0.001 (D) Primary patient sample (P3) with antecedent CMML/AML treated with NKG2A blocking antibody 1-hour prior NK cell exposure. (E) Heatmap of immune and Venetoclax resistant marker RNA expression in beat AML for patients with dual expression of AHR and HLA-E (high/high and low/low; n=21).
Discussion
Herein we show that higher NK cell percentage at diagnosis in the bone marrow negatively impacts OS in newly diagnosed AML patients treated with standard induction intensive 7 + 3 chemotherapy. We found that these patients had higher relative expression of HLA-E on leukemic blasts and higher CD94+ NK cells. Importantly, we found that higher T cell numbers were associated with improved OS in this cohort as well as a correlation between low NK cell % patients having higher MHC Class II expression. Through the Beat AML dataset, we were able to correlate HLA-E expression with AHR and monocytic maturation. We further define AHR as a surrogate marker for immune dysregulation with lower percentage of mature NK cells found in the peripheral blood by flow cytometry and single cell sequencing. Unique to our work, we identified an immune signature associated with AHR, defined by high levels of HLA Class I, HLA-E and IFN-γ signaling, which may impact treatment response to cellular therapy. We show in-vitro that IFN-γ exposure upregulates AHR in leukemic blasts after just 24 hours mimicking the role of T and NK cell in the microenvironment. NK cells from AHR-high patients had impaired maturation profiles characterized by less mature CD16+/CD56dim NK cells and had less activating NCRs including NKp30, CD16, 2B4 and NKG2D. When primary patient samples were exposed to the AHR inhibitor, IK-364, HLA-E protein was downregulated on leukemic blasts and NK cell cytotoxicity was enhanced. Lastly, we found that IK-364 downregulated STAT1 and IRF1 in MOLM-14 cells and propose STAT1 as the major mediator connecting AHR inhibition to downregulation of HLA-E.
AML has many mechanisms for evading innate and adaptive immune control critical for predicting response to immune based therapies. NK cells isolated from AML patients have decreased expression of NCRs NKp46, NKp30, NKp44, NKp80, and 2B4, increased expression of inhibitory CD94/NKG2A, shedding of activating ligands (e.g., CD16) and decreased killing activity (58). AML cells can also stimulate immunosuppressive effects on NK cells by supporting regulatory T cells (Tregs) and inhibiting dendritic cell function. Wang et al. recently showed the significance of IFN-γ signaling in venetoclax resistance and paired immune markers including MHC Class I and HLA-E expression (59). Although they showed convincing evidence of the role of immune suppression in monocytic AML, their report lacked functional studies and did not address mechanisms to reverse this defect for clinical applications. We largely validated their finding by showing that monocytic AML was highly correlated with HLA-E expression, as well as linking the monocytic driver, AHR, to these immune changes and IFN-γ through bulk and single cell sequencing. Our work highlights the AHR -IFN-γ cross talk, which may be a driver of immune evasion and HLA-E in AML. Our findings also support and validate that NK cell maturation is altered in AML patients relative to AHR expression in the peripheral blood. In particular, previous publications have shown that AHR activation leads to expansion of type 1 innate lymphoid cells (ILC1), a NK cell maturation block and fewer NK cells (1, 27, 28). Our current work adds to this literature by linking AHR as a potential targetable pathway to enhance NK cell therapy in AML.
We had several limitations in our study which could impact our findings. First, we did not account for a newly described AML subset “CD56 neg CD16+” NK cells that were recently found to be associated adverse clinical outcome in AML (60). In the manuscript, AML patients with expanded CD56neg CD16+ NK cells group had significantly poorer overall survival (HR[CI95]=3.3[0.75-14.7], p=0.0251) and relapse-free survival (HR[CI95]=13.1[1.9-87.5], p=0.0079) after 36 months follow-up (60). It is possible that this NK cell subset contributed to our differences in OS however was not accounted for in our analysis. Second, we were not able to connect our initial bone marrow findings of NK cell percentage in the marrow with AHR levels or FAB maturation state despite RNA sequencing overlap between our cohorts. We believe the reason for this may be related to the relative expression differences of AHR in bone marrow vs peripheral blood, since AHR levels in the bone marrow are much lower than in the peripheral blood. Previous publications have shown that AHR signaling is preferentially downregulated in LSC-enriched populations within the bone marrow to allow for stem cell maintenance (25). Another limitation to our study is the small sample size for single cell data analysis in the peripheral blood samples and not having paired bone marrow samples. In addition, we showed a single patient sample validating NKG2A as a major driver of NK cell dysfunction in a high HLA-E expressing patient. However, these results are still reportable given the current validated work in the field and our correlation with the larger Beat AML dataset confirming HLA-E presence in AHR high samples, MHC class I/II and NK cell receptor-ligand differences. Lastly, we did not show how AHR directly downregulates HLA-E in AML. Previous literature suggests that it is medicated through interferon gamma crosstalk rather than AHR directly binding to the HLA-E promoter. Our experiments with genetic knock out of AHR did not change relative protein expression of HLA-E in the KO cell line compared to NT suggesting the mechanism is not direct. Genetic knockdown of IFNGR1 on MOLM-14 cells prevents AHR secretion by IFN-γ, in line with a prior publication by Snyder et al. which links AHR to IFN-γ-induced JAK/STAT pathway and immune checkpoint-mediated immunosuppression in lung adenocarcinoma (52). Based on our current understanding and available data, we believe IFN-γ triggers a signaling cascade involving the IFN-γ receptor, Janus kinases (JAKs), and ultimately leads to the phosphorylation and activation of STAT1. STAT1 then can bind to the HLA-E gene promoter, increasing HLA-E transcription and expression (61). Activation of the JAK/STAT pathway leads to the transcription of IRF1, and IRF1, in turn, can contribute to a positive feedback loop by promoting STAT1 phosphorylation and DNA binding, further enhancing the JAK/STAT signaling (62). We therefore propose that AHRi directly inhibits AHR and downregulates STAT1 causing HLA-E downregulation (Figure 3E). We acknowledge that AHR may be modulating several other ligands on leukemic blasts other than HLA-E. We suspect that the proinflammatory environment characterized by high IFN-γ levels and other microenvironmental factors are also important mediators of NK cell resistance. Although we highlight MHC Class I, including HLA-E, we acknowledge that there may be multiple AHR-induced changes on leukemic blasts (e.g. MHC Class I, MHC Class II, LILRB4) that contribute to impaired NK cell cytotoxicity. Future experiments will investigate these multifactorial changes in immune ligands vs maturation state via genome-wide CRISPR screens with NK cells to determine and validate the targets most critical for augmenting NK cell function. In addition, future studies will work to clarify the role of monocytic/venetoclax resistant AML and the role for immune modulation in the setting of cellular therapy.
In summary, our work highlights the immune profiles associated with AHR in AML and supports continued interest in targeting the AHR pathway to augment immune-based therapies in AML.
Data availability statement
All sequencing data, along with relevant clinical annotations have been submitted to dbGaP and Genomic Data Commons (GDC) and are publicly available. The dbGaP study ID is 30641 and accession ID is phs001657.v2p1 (https://www.ncbi.nlm.nih.gov/projects/gap/cgi-bin/study.cgi?study_id=phs001657.v2.p1). The single-cell data are available in the GDC as part of the BEATAML1.0-COHORT project.
Ethics statement
The studies involving humans were approved by Oregon Health & Science University Institutional Review Board (OHSU IRB protocol 4422). The studies were conducted in accordance with the local legislation and institutional requirements. The human samples used in this study were acquired from the above protocol for which consent was obtained. Additional written informed consent was not required from the participants or the participants’ legal guardians/next of kin in accordance with the national legislation and institutional requirements.
Author contributions
JS: Conceptualization, Data curation, Formal Analysis, Funding acquisition, Investigation, Methodology, Project administration, Resources, Supervision, Validation, Writing – original draft, Writing – review & editing. DB: Writing – original draft, Writing – review & editing, Conceptualization, Data curation, Formal Analysis, Funding acquisition, Investigation, Methodology, Project administration, Resources, Software, Supervision, Validation, Visualization. FB: Data curation, Writing – review & editing. KB: Data curation, Writing – review & editing. YK: Writing – review & editing. BA: Data curation, Formal analysis, Project administration, Investigation, Writing – review & editing. DC: Data curation, Writing – review & editing. SK: Investigation, Writing – review & editing. GF: Formal Analysis, Writing – review & editing. AK: Data curation, Writing – review & editing. NL: Data curation, Writing – review & editing. MS-M: Writing – review & editing. LW: Investigation, Writing – review & editing. KM: Investigation, Writing – review & editing. DK: Writing – review & editing. SM: Conceptualization, Data curation, Methodology, Writing – review & editing. BD: Supervision, Writing – review & editing. JT: Conceptualization, Data curation, Formal Analysis, Investigation, Resources, Supervision, Visualization, Writing – original draft, Writing – review & editing. EL: Conceptualization, Data curation, Formal Analysis, Investigation, Project administration, Supervision, Visualization, Writing – review & editing.
Funding
The author(s) declare financial support was received for the research and/or publication of this article. This work was supported by an American Society of Hematology Scholar grant awarded to J.N.S. and by a sponsored research agreement with IKENA Oncology. JT, BD, SM., EL, and JS received funding through NCI (2U54CA224019-05).
Acknowledgments
We thank our patients for donating precious samples for research. DNA and RNA quality assessments, library creation, and short-read sequencing assays were performed by the OHSU Massively Parallel Sequencing Shared Resource. The authors also gratefully acknowledge the use of the OHSU Analytical Cytometry Shared Resource and the AML cells provided by the OHSU Leukemia Tissue Bank Shared Resource.
Conflict of interest
The authors declare that the research was conducted in the absence of any commercial or financial relationships that could be construed as a potential conflict of interest.
Generative AI statement
The author(s) declare that no Generative AI was used in the creation of this manuscript.
Any alternative text (alt text) provided alongside figures in this article has been generated by Frontiers with the support of artificial intelligence and reasonable efforts have been made to ensure accuracy, including review by the authors wherever possible. If you identify any issues, please contact us.
Publisher’s note
All claims expressed in this article are solely those of the authors and do not necessarily represent those of their affiliated organizations, or those of the publisher, the editors and the reviewers. Any product that may be evaluated in this article, or claim that may be made by its manufacturer, is not guaranteed or endorsed by the publisher.
Supplementary material
The Supplementary Material for this article can be found online at: https://www.frontiersin.org/articles/10.3389/fimmu.2025.1554166/full#supplementary-material
References
1. Mundy-Bosse BL, Scoville SD, Chen L, McConnell K, Mao HC, Ahmed EH, et al. MicroRNA-29b mediates altered innate immune development in acute leukemia. J Clin Invest. (2016) 126:4404–16. doi: 10.1172/JCI85413
2. Miller JS, Soignier Y, Panoskaltsis-Mortari A, McNearney SA, Yun GH, Fautsch SK, et al. Successful adoptive transfer and in vivo expansion of human haploidentical NK cells in patients with cancer. Blood. (2005) 105:3051–7.
3. Ruggeri L, Capanni M, Urbani E, Perruccio K, Shlomchik WD, Tosti A, et al. Effectiveness of donor natural killer cell alloreactivity in mismatched hematopoietic transplants. Science. (2002) 295:2097–100.
4. Moretta L, Locatelli F, Pende D, Marcenaro E, Mingari MC, and Moretta A. Killer Ig–like receptor-mediated control of natural killer cell alloreactivity in haploidentical hematopoietic stem cell transplantation. Blood. (2011) 117:764–71.
5. Mastaglio S, Wong E, Perera T, Ripley J, Blombery P, Smyth MJ, et al. Natural killer receptor ligand expression on acute myeloid leukemia impacts survival and relapse after chemotherapy. Blood Adv. (2018) 2:335–46. doi: 10.1182/bloodadvances.2017015230
6. Diermayr S, Himmelreich H, Durovic B, Mathys-Schneeberger A, Siegler U, Langenkamp U, et al. NKG2D ligand expression in AML increases in response to HDAC inhibitor valproic acid and contributes to allorecognition by NK-cell lines with single KIR-HLA class I specificities. Blood. (2008) 111:1428–36. doi: 10.1182/blood-2007-07-101311
7. Paczulla AM, Rothfelder K, Raffel S, Konantz M, Steinbacher J, Wang H, et al. Absence of NKG2D ligands defines leukaemia stem cells and mediates their immune evasion. Nature. (2019) 572:254–9.
8. Freud AG and Caligiuri MA. Human natural killer cell development. Immunol Rev. (2006) 214:56–72. doi: 10.1111/j.1600-065X.2006.00451.x
9. Lazetic S, Chang C, Houchins JP, Lanier LL, and Phillips JH. Human natural killer cell receptors involved in MHC class I recognition are disulfide-linked heterodimers of CD94 and NKG2 subunits. J Immunol. (1996) 157:4741–5. doi: 10.4049/jimmunol.157.11.4741
10. Kamiya T, Seow SV, Wong D, Robinson M, and Campana D. Blocking expression of inhibitory receptor NKG2A overcomes tumor resistance to NK cells. J Clin Invest. (2019) 129:2094–106. doi: 10.1172/JCI123955
11. Braud VM, Allan DS, O’Callaghan CA, Söderström K, D’Andrea A, Ogg GS, et al. HLA-E binds to natural killer cell receptors CD94/NKG2A, B and C. Nature. (1998) 391:795–9. doi: 10.1038/35869
12. Béziat V, Hervier B, Achour A, Boutolleau D, Marfain-Koka A, and Vieillard V. Human NKG2A overrides NKG2C effector functions to prevent autoreactivity of NK cells. Blood. (2011) 117:4394–6.
13. DhatChinamoorthy K, Colbert JD, and Rock KL. Cancer immune evasion through loss of MHC class I antigen presentation. Front Immunol. (2021) 12:636568. doi: 10.3389/fimmu.2021.636568
14. Bukur J, Jasinski S, and Seliger B. The role of classical and non-classical HLA class I antigens in human tumors. Semin Cancer Biol. (2012) 22:350–8. doi: 10.1016/j.semcancer.2012.03.003
15. Kaiser BK, Pizarro JC, Kerns J, and Strong RK. Structural basis for NKG2A/CD94 recognition of HLA-E. Proc Natl Acad Sci. (2008) 105:6696–701. doi: 10.1073/pnas.0802736105
16. Berrien-Elliott MM, Cashen AF, Cubitt CC, Neal CC, Wong P, Wagner JA, et al. Multidimensional analyses of donor memory-like NK cells reveal new associations with response after adoptive immunotherapy for leukemia. Cancer Discovery. (2020) 10:1854–71. doi: 10.1158/2159-8290.CD-20-0312
17. Gustafson KS and Ginder GD. Interferon-γ Induction of the human leukocyte antigen-E gene is mediated through binding of a complex containing STAT1α to a distinct interferon-γ-responsive element*. J Biol Chem. (1996) 271:20035–46. doi: 10.1074/jbc.271.33.20035
18. Nguyen S, Beziat V, Dhedin N, Kuentz M, Vernant JP, Debre P, et al. HLA-E upregulation on IFN-gamma-activated AML blasts impairs CD94/NKG2A-dependent NK cytolysis after haplo-mismatched hematopoietic SCT. Bone Marrow Transplant. (2009) 43:693–9. doi: 10.1038/bmt.2008.380
19. Hankinson O. The aryl hydrocarbon receptor complex. Annu Rev Pharmacol Toxicology. (1995) 35:307–40. doi: 10.1146/annurev.pa.35.040195.001515
20. Trikha P and Lee DA. The role of AhR in transcriptional regulation of immune cell development and function. Biochim Biophys Acta (BBA) - Rev Cancer. (2020) 1873:188335. doi: 10.1016/j.bbcan.2019.188335
21. Moffett JR and Namboodiri MA. Tryptophan and the immune response. Immunol Cell Biol. (2003) 81:247–65. doi: 10.1046/j.1440-1711.2003.t01-1-01177.x
22. Mezrich JD, Fechner JH, Zhang X, Johnson BP, Burlingham WJ, and Bradfield CA. An interaction between kynurenine and the aryl hydrocarbon receptor can generate regulatory T cells. J Immunol. (2010) 185:3190–8. doi: 10.4049/jimmunol.0903670
23. Munn DH and Mellor AL. Indoleamine 2,3-dioxygenase and tumor-induced tolerance. J Clin Invest. (2007) 117:1147–54. doi: 10.1172/JCI31178
24. Jia Y, Guo J, Zhao Y, Zhang Z, Shi L, Fang Y, et al. AHR signaling pathway reshapes the metabolism of AML/MDS cells and potentially leads to cytarabine resistance. Acta Biochim Biophys Sin. (2021) 53:492–500. doi: 10.1093/abbs/gmab017
25. Ly M, Rentas S, Vujovic A, Wong N, Moreira S, Xu J, et al. Diminished AHR signaling drives human acute myeloid leukemia stem cell maintenance. Cancer Res. (2019) 79:5799–811. doi: 10.1158/0008-5472.CAN-19-0274
26. Romine KA, Nechiporuk T, Bottomly D, Jeng S, McWeeney SK, Kaempf A, et al. Monocytic differentiation and AHR signaling as Primary Nodes of BET Inhibitor Response in Acute Myeloid Leukemia. Blood Cancer discovery. (2021) 2:518–31. doi: 10.1158/2643-3230.BCD-21-0012
27. Scoville SD, Nalin AP, Chen L, Chen L, Zhang M, McConnell K, et al. Human AML activates the AHR pathway to impair NK cell development and function. Blood. (2018) 132:1792–804. doi: 10.1182/blood-2018-03-838474
28. Lordo MR, Wu KG, Altynova E, Shilo N, Kronen P, Nalin AP, et al. Acute myeloid leukemia alters group 1 innate lymphoid cell differentiation from a common precursor. J Immunol. (2021) 207:1672–82. doi: 10.4049/jimmunol.2100023
29. Bottomly D, Long N, Schultz AR, Kurtz SE, Tognon CE, Johnson K, et al. Integrative analysis of drug response and clinical outcome in acute myeloid leukemia. Cancer Cell. (2022) 40:850–64.e9.
30. Leek JT and Storey JD. Capturing heterogeneity in gene expression studies by surrogate variable analysis. PloS Genet. (2007) 3:1724–35. doi: 10.1371/journal.pgen.0030161
31. Law CW, Chen Y, Shi W, and Smyth GK. voom: precision weights unlock linear model analysis tools for RNA-seq read counts. Genome Biol. (2014) 15:R29. doi: 10.1186/gb-2014-15-2-r29
32. Yu G and He QY. ReactomePA: an R/Bioconductor package for reactome pathway analysis and visualization. Mol Biosyst. (2016) 12:477–9. doi: 10.1039/C5MB00663E
33. Benjamini Y and Yekutieli D. The control of the false discovery rate in multiple testing under dependency. Ann Statistics. (2001) 29:1165–88, 24. doi: 10.1214/aos/1013699998
34. Benjamini Y and Hochberg Y. Controlling the false discovery rate: A practical and powerful approach to multiple testing. J R Stat Society: Ser B (Methodological). (1995) 57:289–300. doi: 10.1111/j.2517-6161.1995.tb02031.x
35. Joshi SK, Nechiporuk T, Bottomly D, Piehowski PD, Reisz JA, Pittsenbarger J, et al. The AML microenvironment catalyzes a stepwise evolution to gilteritinib resistance. Cancer Cell. (2021) 39:999–1014.e8. doi: 10.1016/j.ccell.2021.06.003
36. Germain PL, Lun A, Garcia Meixide C, Macnair W, and Robinson MD. Doublet identification in single-cell sequencing data using scDblFinder. F1000Res. (2021) 10:979.
37. van Galen P, Hovestadt V, Wadsworth Ii MH, Hughes TK, Griffin GK, Battaglia S, et al. Single-cell RNA-seq reveals AML hierarchies relevant to disease progression and immunity. Cell. (2019) 176:1265–81.e24. doi: 10.1016/j.cell.2019.01.031
38. Storey JD. The positive false discovery rate: a Bayesian interpretation and the q-value. Ann Statistics. (2003) 31:2013–35, 23. doi: 10.1214/aos/1074290335
39. Tang F, Li J, Qi L, Liu D, Bo Y, Qin S, et al. A pan-cancer single-cell panorama of human natural killer cells. Cell. (2023) 186:4235–51.e20. doi: 10.1016/j.cell.2023.07.034
40. Yang C, Siebert JR, Burns R, Gerbec ZJ, Bonacci B, Rymaszewski A, et al. Heterogeneity of human bone marrow and blood natural killer cells defined by single-cell transcriptome. Nat Commun. (2019) 10:3931. doi: 10.1038/s41467-019-11947-7
41. Lun ATL, Richard AC, and Marioni JC. Testing for differential abundance in mass cytometry data. Nat Methods. (2017) 14:707–9. doi: 10.1038/nmeth.4295
42. Robinson MD, McCarthy DJ, and Smyth GK. edgeR: a Bioconductor package for differential expression analysis of digital gene expression data. Bioinformatics. (2010) 26:139–40. doi: 10.1093/bioinformatics/btp616
43. Denman CJ, Senyukov VV, Somanchi SS, Phatarpekar PV, Kopp LM, Johnson JL, et al. Membrane-bound IL-21 promotes sustained ex vivo proliferation of human natural killer cells. PloS One. (2012) 7:e30264. doi: 10.1371/journal.pone.0030264
44. Chretien AS, Devillier R, Granjeaud S, Cordier C, Demerle C, Salem N, et al. High-dimensional mass cytometry analysis of NK cell alterations in AML identifies a subgroup with adverse clinical outcome. Proc Natl Acad Sci U.S.A. (2021) 118. doi: 10.1073/pnas.2020459118
45. Jamal E, Azmy E, Ayed M, Aref S, and Eisa N. Clinical impact of percentage of natural killer cells and natural killer-like T cell population in acute myeloid leukemia. J Hematol. (2020) 9:62–70. doi: 10.14740/jh655
46. Cooper MA, Fehniger TA, Turner SC, Chen KS, Ghaheri BA, Ghayur T, et al. Human natural killer cells: a unique innate immunoregulatory role for the CD56(bright) subset. Blood. (2001) 97:3146–51.
47. Chretien AS, Fauriat C, Orlanducci F, Galseran C, Rey J, Bouvier Borg G, et al. Natural killer defective maturation is associated with adverse clinical outcome in patients with acute myeloid leukemia. Front Immunol. (2017) 8:573. doi: 10.3389/fimmu.2017.00573
48. Rölle A, Jäger D, and Momburg F. HLA-E peptide repertoire and dimorphism—Centerpieces in the adaptive NK cell puzzle? Front Immunol. (2018) 9.
49. Tyner JW, Tognon CE, Bottomly D, Wilmot B, Kurtz SE, Savage SL, et al. Functional genomic landscape of acute myeloid leukaemia. Nature. (2018) 562:526–31.
50. Kraaij MD, Vereyken EJ, Leenen PJ, van den Bosch TP, Rezaee F, Betjes MG, et al. Human monocytes produce interferon-gamma upon stimulation with LPS. Cytokine. (2014) 67:7–12.
51. Gillespie M, Jassal B, Stephan R, Milacic M, Rothfels K, Senff-Ribeiro A, et al. The reactome pathway knowledgebase 2022. Nucleic Acids Res. (2022) 50:D687–d92. doi: 10.1093/nar/gkab1028
52. Snyder M, Wang Z, Lara B, Fimbres J, Pichardo T, Mazzilli S, et al. The aryl hydrocarbon receptor controls IFN-γ-induced immune checkpoints PD-L1 and IDO via the JAK/STAT pathway in lung adenocarcinoma. J Immunol. (2025) 214:413–32. doi: 10.1093/jimmun/vkae023
53. Khaznadar Z, Boissel N, Agaugué S, Henry G, Cheok M, Vignon M, et al. Defective NK cells in acute myeloid leukemia patients at diagnosis are associated with blast transcriptional signatures of immune evasion. J Immunol. (2015) 195:2580–90. doi: 10.4049/jimmunol.1500262
54. Liu G, Zhang Q, Yang J, Li X, Xian L, Li W, et al. Increased TIGIT expressing NK cells with dysfunctional phenotype in AML patients correlated with poor prognosis. Cancer Immunol Immunother. (2022) 71:277–87. doi: 10.1007/s00262-021-02978-5
55. Saultz JN and Tyner JW. Chasing leukemia differentiation through induction therapy, relapse and transplantation. Blood Rev. (2023) 57:101000. doi: 10.1016/j.blre.2022.101000
57. Lin Y-L and Lin S-C. Analysis of the CD161-expressing cell quantities and CD161 expression levels in peripheral blood natural killer and T cells of systemic lupus erythematosus patients. Clin Exp Med. (2017) 17:101–9. doi: 10.1007/s10238-015-0402-1
58. Salih HR, Antropius H, Gieseke F, Lutz SZ, Kanz L, Rammensee HG, et al. Functional expression and release of ligands for the activating immunoreceptor NKG2D in leukemia. Blood. (2003) 102:1389–96.
59. Wang B, Reville PK, Yassouf MY, Jelloul FZ, Ly C, Desai PN, et al. Comprehensive characterization of IFNγ signaling in acute myeloid leukemia reveals prognostic and therapeutic strategies. Nat Commun. (2024) 15:1821. doi: 10.1038/s41467-024-45916-6
60. Wlosik J, Orlanducci F, Richaud M, Demerle C, Amara AB, Rouviere MS, et al. CD56(neg) CD16(+) cells represent a distinct mature NK cell subset with altered phenotype and are associated with adverse clinical outcome upon expansion in AML. Front Immunol. (2024) 15:1487792.
61. Gobin SJP and van den Elsen PJ. Transcriptional regulation of the MHC class Ib genes HLA-E, HLA-F, and HLA-G. Hum Immunol. (2000) 61:1102–7. doi: 10.1016/S0198-8859(00)00198-1
Keywords: leukemia, immunotherapy, NK cells, AhR, AML
Citation: Saultz JN, Bottomly D, Burns F, Byrd K, Kosaka Y, Alber B, Chandra D, Kurtz SE, Fan G, Kaempf A, Long N, Sanchez-Martin M, Wang L, McGovern K, Kaufman DS, McWeeney SK, Druker BJ, Tyner JW and Lind EF (2025) The aryl hydrocarbon receptor is associated with monocytic AML and innate immune resistance reversible with an AHR inhibitor. Front. Immunol. 16:1554166. doi: 10.3389/fimmu.2025.1554166
Received: 01 January 2025; Accepted: 20 October 2025;
Published: 09 December 2025.
Edited by:
Francisco Javier Quintana, Harvard Medical School, United StatesReviewed by:
Aditya Yashwant Sarode, Columbia University, United StatesFangmin Zhong, Nanchang University, China
Mingying Li, Shandong University, China
Copyright © 2025 Saultz, Bottomly, Burns, Byrd, Kosaka, Alber, Chandra, Kurtz, Fan, Kaempf, Long, Sanchez-Martin, Wang, McGovern, Kaufman, McWeeney, Druker, Tyner and Lind. This is an open-access article distributed under the terms of the Creative Commons Attribution License (CC BY). The use, distribution or reproduction in other forums is permitted, provided the original author(s) and the copyright owner(s) are credited and that the original publication in this journal is cited, in accordance with accepted academic practice. No use, distribution or reproduction is permitted which does not comply with these terms.
*Correspondence: Jennifer N. Saultz, c2F1bHR6amVAb2hzdS5lZHU=