 Yongfen Huang1†Ping Yi2,3†Yixuan Wang4Lingling Wang1Yongqin Cao1Jingbo Lu1Kun Fang2,3*
 Yuexin Cheng1*
 Yuqing Miao1,4*
- 1Department of Hematology, Yancheng No.1 People’s Hospital, Yancheng, China
- 2Department of Scientific Research Project, Wuhan Kindstar Medical Laboratory Co., Ltd., Wuhan, China
- 3Kindstar Global Precision Medicine Institute, Wuhan, China
- 4Yancheng Clinical College, Xuzhou Medical University, Yancheng, China
Introduction: The prognostic management of acute myeloid leukemia (AML) remains a challenge for clinicians. This study aims to construct a novel risk model for AML patient through comprehensive analysis of scRNA and bulk RNA data to optimize the precise treatment strategies for patients and improve prognosis.
Methods and Results: scRNA-seq classified cells into nine clusters, including Bcells, erythrocyte, granulocyte-macrophage progenitor (GMP), hematopoietic stem cell progenitors (HSC/Prog), monocyte/macrophagocyte (Mono/Macro), myelocyte, neutrophils, plasma, and T/NK cells. Functional analysis demonstrated the important role of inflammation immune response in the pathogenesis of AML, and the leukocyte transendothelial migration and adhesion in the process of inflammation should be noticed. ssGSEA method identified four core cells including GMP, HSC/Prog, Mono/Macro, and myelocyte for subsequent analysis, which contains 1,594 marker genes. Furthermore, we identified AML-associated genes (2,067genes) and DEGs (1,010genes) between AML patients and controls usingGSE114868dataset. After performing intersection, univariate Cox, and LASSO analysis, we obtained a prognostic model based on the expression levels of five signature genes, namely, CALR, KDM1A, SUCNR1, TMEM220, and ADM. The prognostic model was then validated by two external datasets. Patients with high-risk scores are predisposed to experience poor overall survival. Further GSEA analysis of risk-model-related genes revealed the significant differences in inflammatory response between high-and low-risk groups.
Conclusion: In conclusion, we constructed an inflammation related risk model using internal scRNA data and external bulk RNA data, which can accurately distinguish survival outcomes in AML patients.
Introduction
Acute myeloid leukemia (AML) is a highly heterogeneous malignant clonal disease derived from myeloid hematopoietic stem cells and progenitor cells characterized by abnormal proliferation of blast cells and leukemia cells in the bone marrow, thus leading to hematopoietic dysfunction. It is the most common subtype of leukemia, with 20,800 new cases and 11,220 deaths in 2024 in the United States (1). In the past 5 decades, AML therapy primarily depended on one poorly tolerated and modestly effective standard of care: the cytarabine combined with anthracyclines (2). Despite the advances in strategies containing high-dose cytarabine, targeted therapy, allogeneic hematopoietic stem cell transplantation, and immunotherapy, its 5-year overall survival (OS) is only 30% and <10% in patients older than 60 years (2, 3). Therefore, it is of great significant to discover novel therapeutic target and prognostic signature to guide treatment, thereby improving outcome of patients.
Bulk transcriptome sequencing (bulk RNA-seq) is an effective tool to profile average gene expression in cell populations, identifying abnormal expressed genes as potential therapy targets for diseases, including AML. Li et al. identified METTL3 as a biomarker of AML chemoresistance, providing a novel target for AML therapy (4). In contrast to bulk RNA-seq, single-cell RNA-seq (scRNA-seq) reveals the cell-type heterogeneity and genetic information by elucidating the transcriptomic diversity among individual cells, beneficial to specify personalized therapeutic schedule and disease diagnosis (5, 6). As reported by Bijender Kumar, contact between AML blasts and NK cells activated TGF-β and, in turn, contributing to NK cell exhaustion. BATF was identified as a key transcription factor that mediates NK-cell dysfunction in AML, implying that the adoptive transfer of allogeneic healthy NK cells in combination with TGF-β inactivation or BATF suppression might be a promising method for AML immunotherapy (7). Tian et al. suggested ENO1 as a plausible candidate for AML therapy and prognostic assessment using scRNA-seq, due to its specific function in self-renewal of leukemia stem cell (8). Given these advantages, bulk RNA-seq and scRNA-seq are frequently employed in combination for patient stratification and therapy (9, 10).
In this work, we mapped the immune microenvironment landscape and determine how it contributes to the progression of AML using scRNA-seq. In addition, we conducted comprehensive bioinformatics analyses using scRNA-seq and bulk RNA-seq data to obtain a prognostic signature of AML patients, with two online validation sets to verify its reliability for risk stratification.
Materials and methods
Participants
A total of 11 patients diagnosed as AML were eligible in this study and divided into favorable (group 1), intermediate (group 2), and unfavorable (group 3) prognosis groups according to risk stratification. The baseline characteristics of included AML patients are shown in Table 1. Two matched individuals with monophyletic reduction were involved as control. Bone marrow (BM) of all included patients was obtained for scRNA-seq. Human experimental procedures in this study were reviewed and approved by the ethics committee of Yancheng No. 1 People’s Hospital, and all participants provide written informed consent.
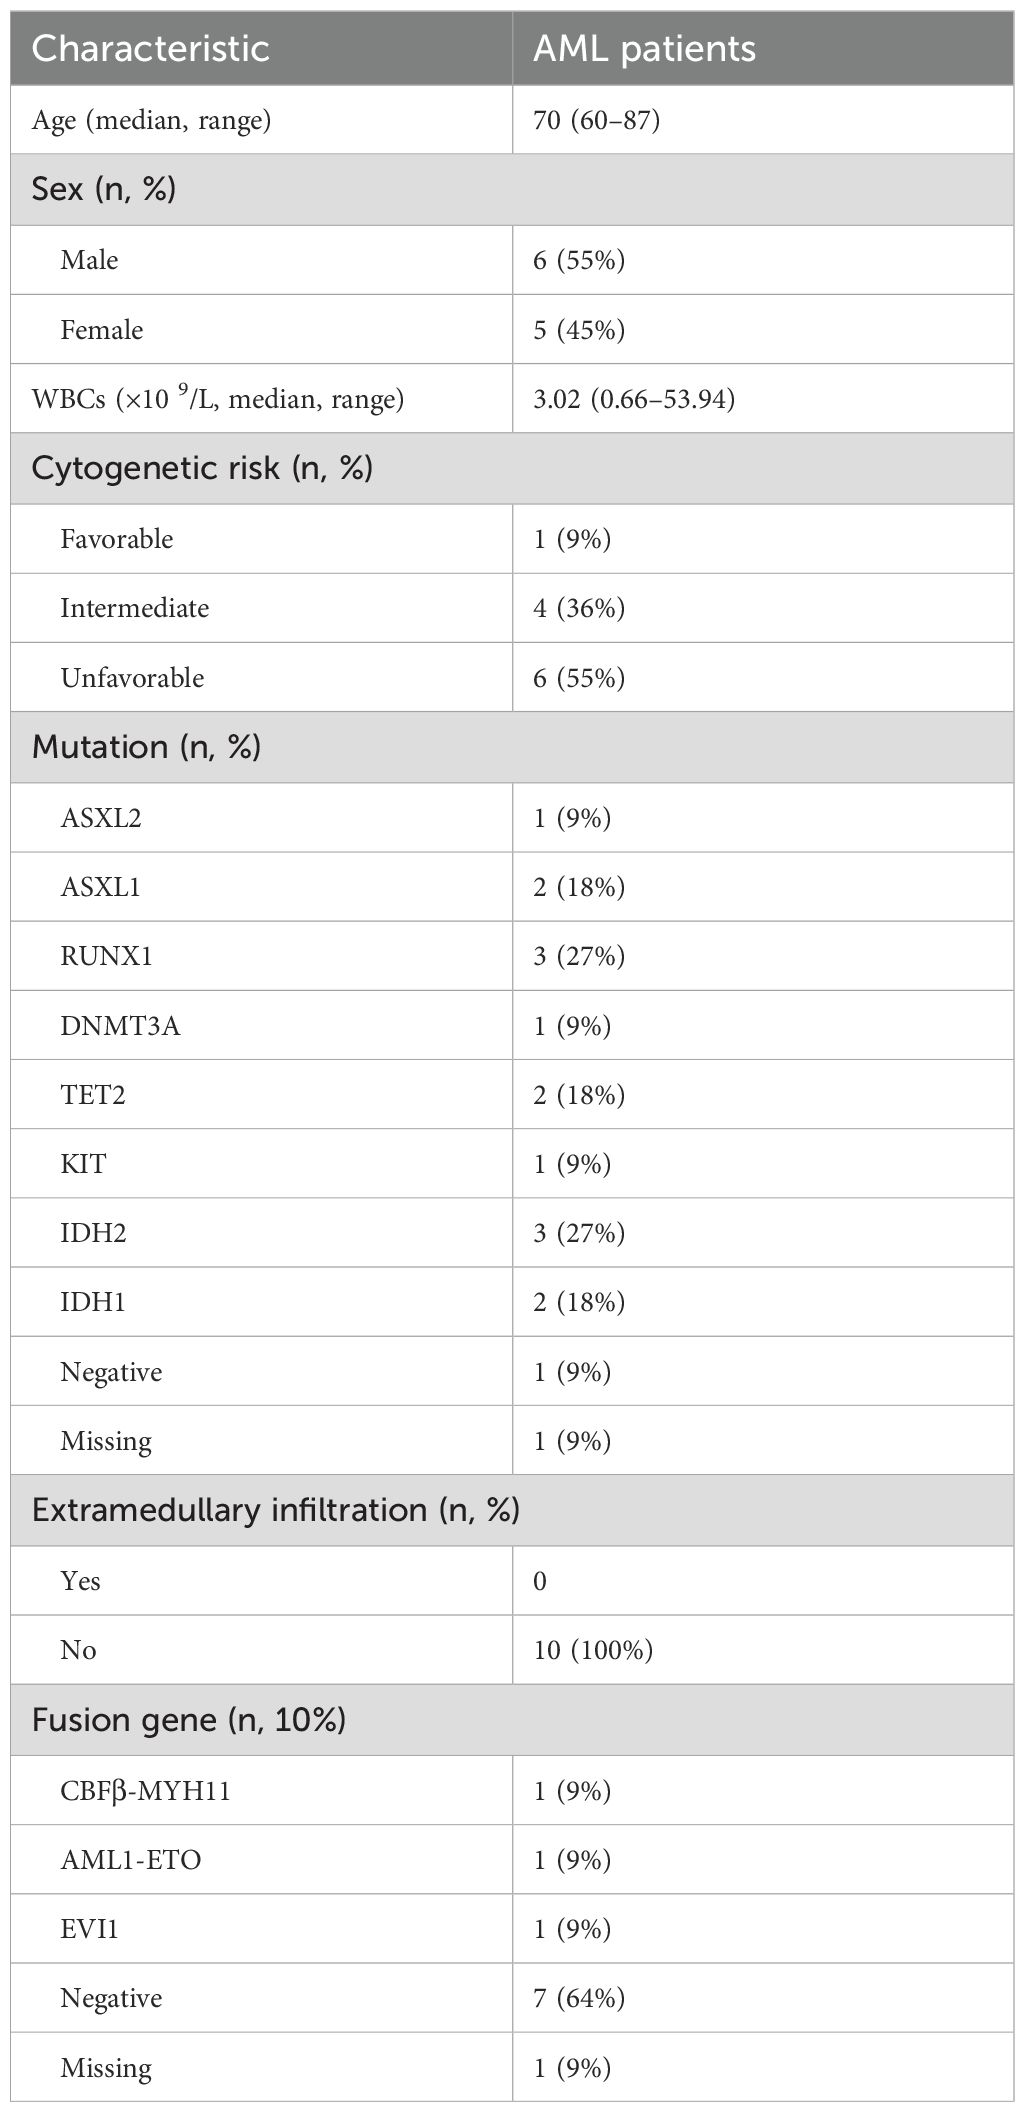
Table 1. The baseline characteristics of 11 AML patients collected for single-cell sequencing.
Single-cell library preparation, sequencing, and data analysis
The BM sample were first prepared as single-cell suspension at a concentration of 700–1,200 cell/μ, followed by single-cell capture, mRNA reverse transcription, cDNA amplification, and 3′ sc-RNA-seq library construction using the 10X Genomics platform according to the manufacturer’s instructions. After quality inspection, the library was sequenced using Illumina platform. The obtained data were quantified using cellranger software to generate cell–gene expression matrix, followed by quality control. The umap algorithm was employed for dimensionality reduction analysis. The “singleR” package in R software with HumanPrimaryCellAtlasData, BlueprintEncodeData, and ImmuneCellExpressionData as reference was used for cell annotation based on marker genes finding from the CellMarker database and previous studies. By using the FindAllMarkers function of Seurat package, the marker genes for each cell type were obtained, and significantly different marker genes of each cluster were identified according the metrics of: logFC > 1 and adj.P.Val < 0.05. Then, these differently expressed marker genes and ssGSEA were used to calculate ssGSEA scores of each cell to acquire the different cells between AML patients and control individuals. GO and KEGG enrichment analysis of differently expressed marker genes and GSEA enrichment of all marker genes of selected cells were performed using clusterProfiler package in R software. CellPhone DB v2.0 was used to explore the potential interactions between different cells.
Bulk RNA-seq datasets acquisition and processing
Bulk RNA-seq data of GSE114868 were downloaded from GEO database, containing 194 AML patients and 20 healthy donors. The differently expressed genes (DEGs) between AML and healthy donors were filtered based on the categories of logFC > 1 and adj.P.Val < 0.05, and genes associated with AML were screened using the R package WGCNA to find out overlapped genes of scRNA-seq. GSE37642 dataset, including 417 AML patients, was downloaded from GEO database and termed as training set to construct the prognostic signature of AML patients based on the overlapped genes. TCGA_LAML dataset (containing 130 AML patients) downloaded from TCGA database and GSE106291 dataset (containing 250 AML patients) downloaded from GEO database were termed as validation set to validate the constructed prognostic signature.
Prognostic signature construction and validation
The overlapped genes of differently expressed genes between AML and healthy donors in GSE114868 dataset, AML-linked genes in GSE114868 dataset, and selected marker genes of scRNA-seq were considered as candidates. Univariate Cox regression analysis was employed on these candidates in the training set to filtered out informative genes correlated with prognosis. Genes with p < 0.05 were included in the least absolute shrinkage and selection operator (LASSO) regression analysis to resolve the final variables in prognostic model. The risk model was constructed based on the formula: risk score = gene exp1 × β1 + gene exp2 × β2 + … + gene expression n × βn, where gene expression represents the gene expression value and β represents the corresponding coefficient of LASSO regression. Patients were classified into high- and low-risk groups according to the median value of risk score. Subsequent prognostic model validation was performed on external datasets TCGA_LAML and GSE106291. Kaplan–Meier curves visualized by “survminer” package was utilized to analyze prognostic value of the two groups and the final remaining genes. The risk map of patients was visualized using “ggrisk” package in R software. The difference in risk scores among available subtypes was determined using the Kruskal–Wallis test or the Wilcoxon rank test. The receiver operating characteristic (ROC) curves were plotted using the “survROC” package to evaluate the performance of risk scores in predicting overall survival at 1, 2, 3, and 4 years in AML patients. In addition, a stratified survival analysis of available clinicopathological characteristics was carried out for high- and low-risk groups. In addition, the functional enrichment of the risk model associated genes was predicated using GSEA.
Immune microenvironment analysis and chemotherapy drug sensitivity analysis
Immune microenvironment-related scores containing ImmuneScore, StromalScore, and ESTIMATEScore were calculated per AML patients in TCGA-LAML dataset using corresponding algorithm. The difference in each score between high- and low-risk AML samples was determined using the Wilcoxon rank sum test, and Pearson correlation analysis was performed to evaluate the correlation between our constructed prognostic signature and immune microenvironment status. Furthermore, we predicted the sensitivity of 198 drugs for the high- and low-risk groups using the oncoPredict package in R software, and drugs that are statistically different and potentially useful for AML treatment were selected for correlation analysis with target gene.
Statistical analysis
All statistical computations and graphical representations were executed in R statistical software. Inter-group comparisons were conducted using t-tests and Wilcoxon rank-sum tests. For multi-group analyses, the Kruskal–Wallis test was systematically applied. Survival outcomes were evaluated through Kaplan–Meier estimators with between-curve differences quantified by log-rank testing. Prognostic biomarkers were identified using univariate Cox regression model. Bivariate associations were examined through Spearman’s rank correlation analysis. All inferential analyses maintained a predetermined p level of 0.05 for statistical significance determination.
Results
Cell subtype identification of included individuals
A total of 97,531 core cells were obtained for subsequent analysis after quality control (Figure 1A), and classified into 21 independent clusters using the umap algorithm (Figures 1B, C). Then, the various clusters were annotated using corresponding marker genes found in CellMarker database and previous references (Figure 1D), classifying into nine cell clusters, including B cells, erythrocyte, granulocyte-macrophage progenitor (GMP), hematopoietic stem cell progenitors (HSC/Prog), monocyte/macrophagocyte (Mono/Macro), myelocyte, neutrophils, plasma, and T/NK cells (Figure 1E). The different subtype demonstrated discrepant proportion in each group (Figures 1F, G), and the ratios of GMP, HSC/Prog, Mono/Macro, B cells, myelocyte, neutrophils, and T/NK cells in all cells are significantly different between AML patients and controls (Figure 1H), which were consistent with previous studies (11).
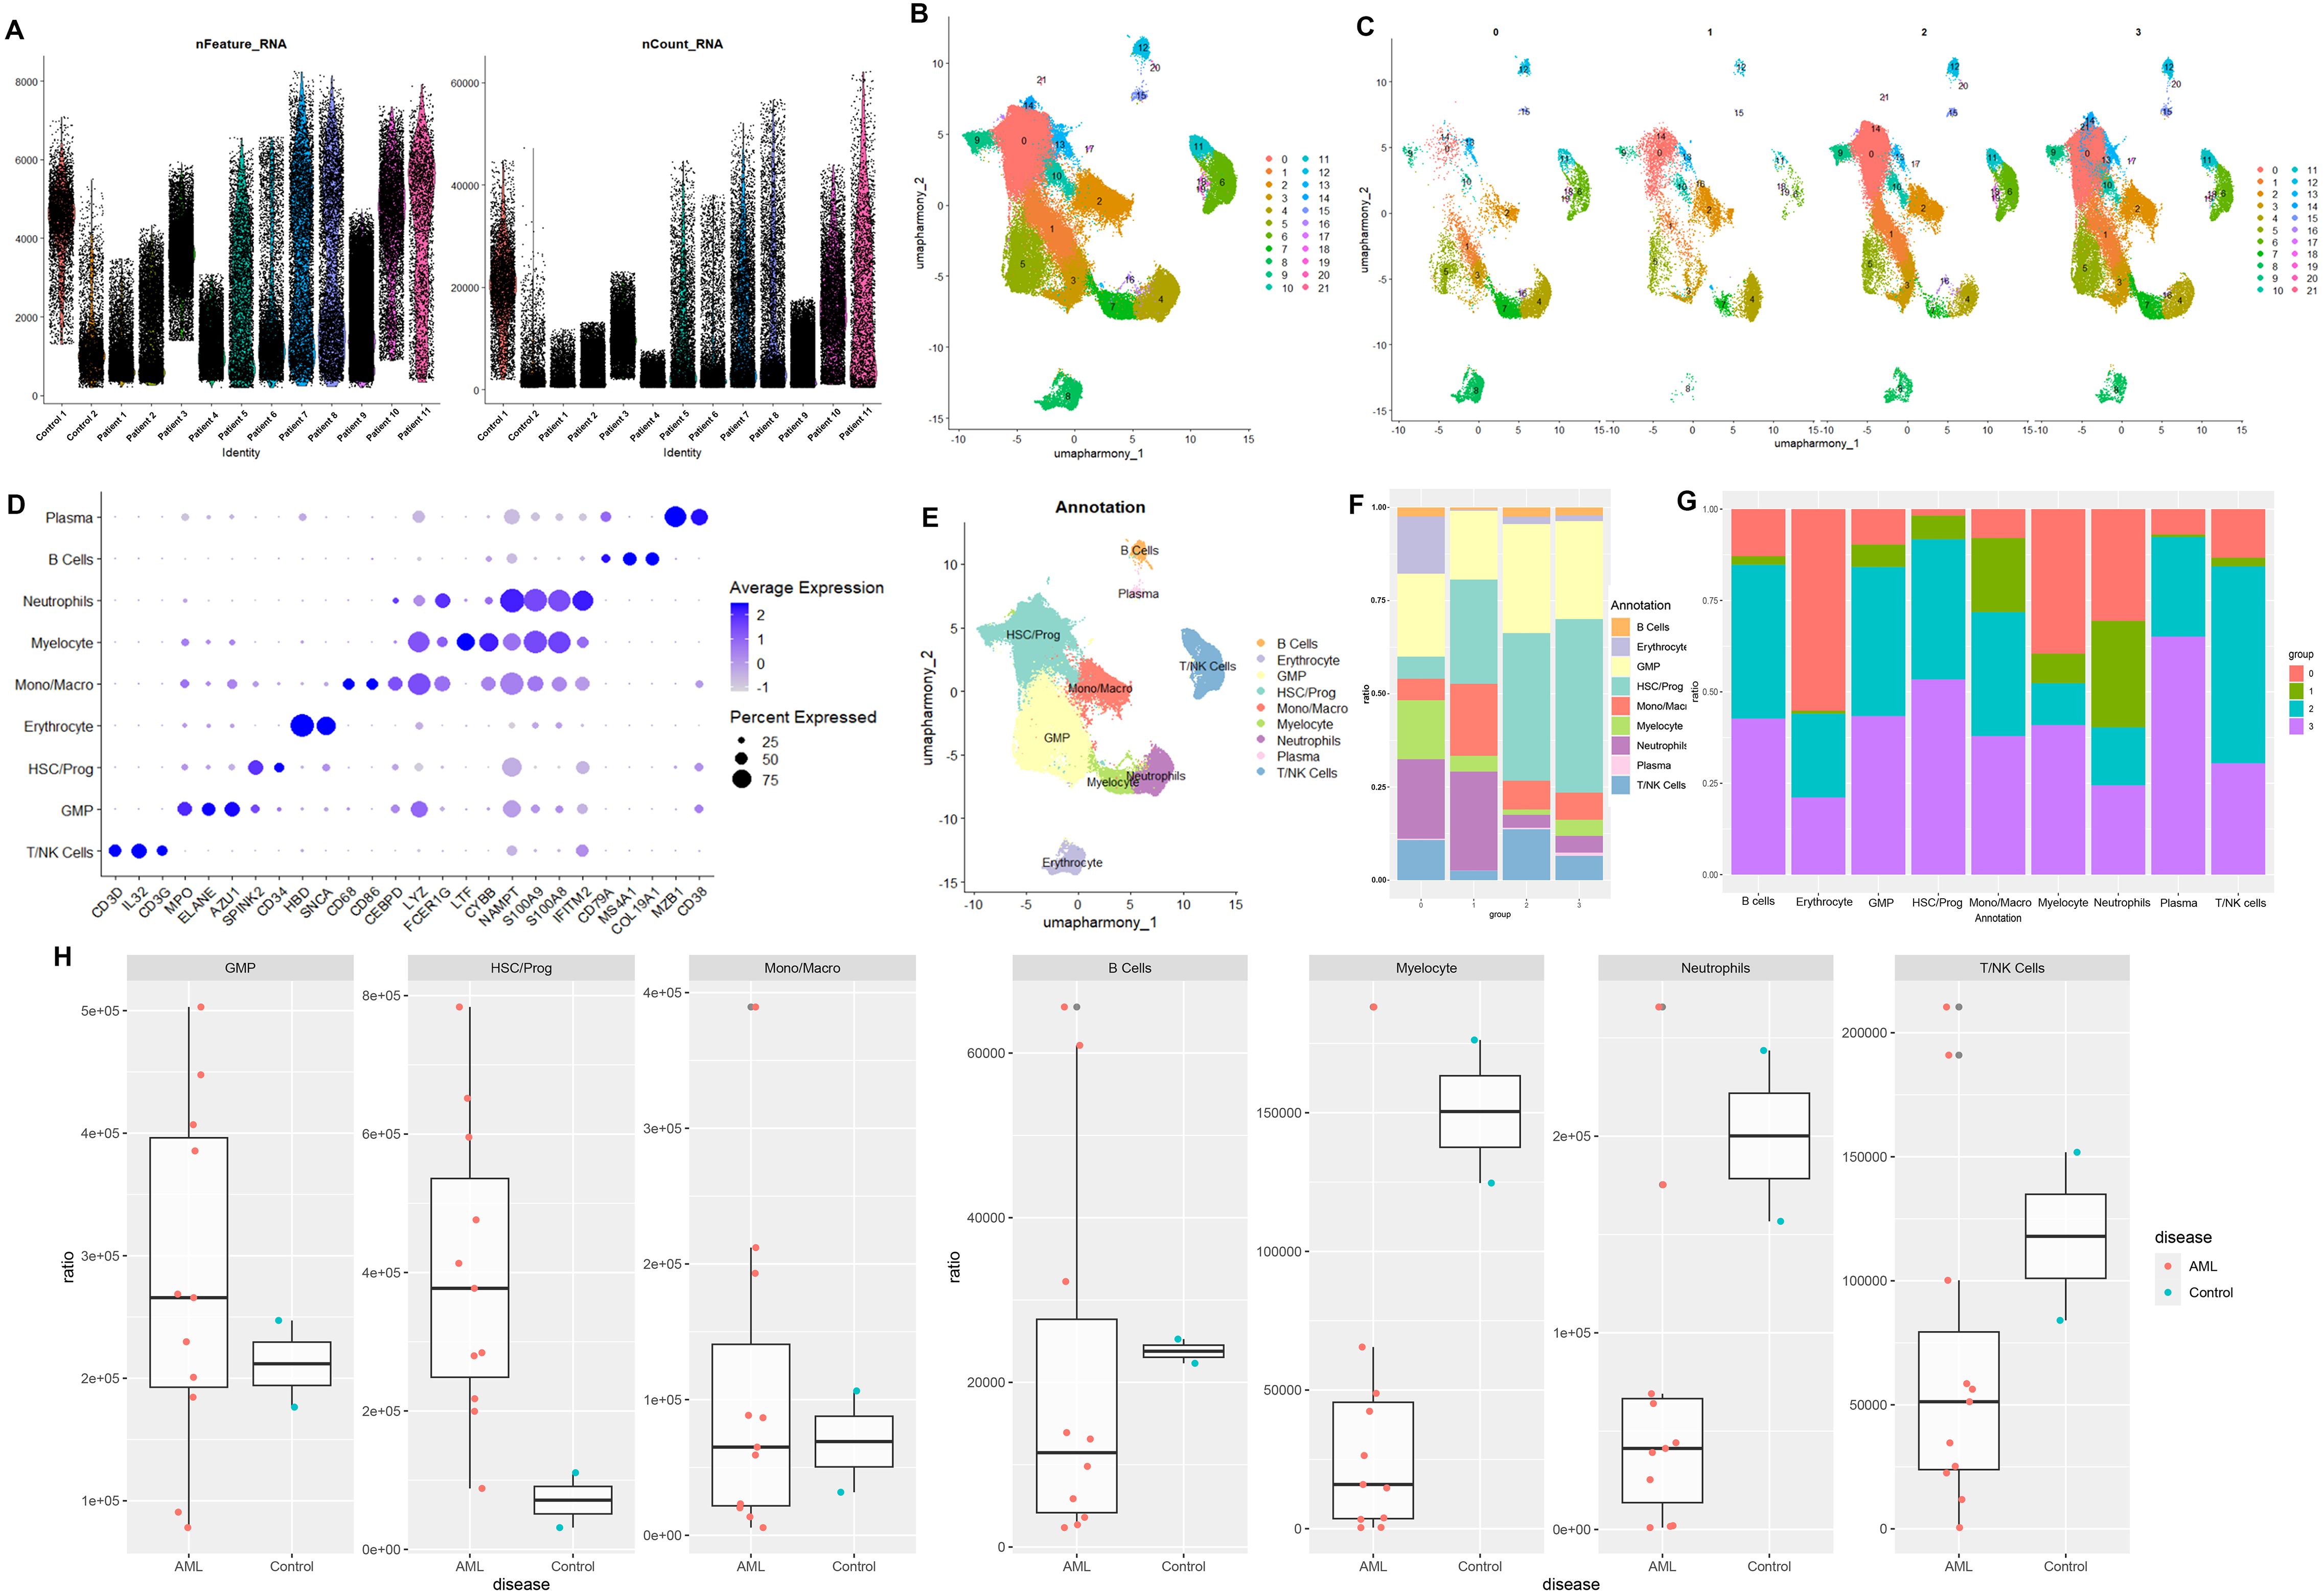
Figure 1. Quality control and cell type annotation of single-cell RNA sequencing. (A) Violin plot of filtered single-cell RNA sequencing data, showing a total of 97,531 cells meeting the criteria. (B) The umap algorithm was employed to classify the obtained cells, and 21 independent clusters were successfully classified. (C) Classification of cell clusters in each group. (D) Expression levels of cell marker genes in each cell cluster. (E) Cell-type annotation based on the corresponding marker genes, with nine cell clusters obtained. (H) The proportion of annotated cells in AML patients and healthy donors.
Cell interaction and functional enrichment analysis of various cellular marker genes
Intercellular interaction was predicted based on characteristic ligand receptors and pathways. As shown in cell–cell communication networks, there was more frequency and intensity of interaction between Mono/Macro and HSC/Prog, Mono/Macro and plasma, and Mono/Macro and GMP. T/NK cells demonstrated relatively poor communication with other cells (Figure 2A). Moreover, the significantly different marker genes of each cell subtype were identified using FindAllMarkers function of Seurat, followed by calculating ssGSEA scores. We found that the scores of all the identified cell clusters between AML patients and control individuals are significantly different, especially GMP, HSC/Prog, Mono/Macro, and myelocyte that are obviously downregulated in AML patients. Thus, these four cell types were regarded as core cells for subsequent analysis. In addition, the marker genes of these selected four clusters were enriched for KEGG and GO functions (Figure 2C). In detail, the marker genes for HSC/Prog, Mono/Macro, and B cells were associated with transcriptional misregulation in cancer. The marker genes of Mono/Macro, T/NK cells, and B cells were notably enriched in Th17 cell differentiation. In addition, the maker genes of B cells, myelocyte, and neutrophils were enriched in leukocyte transendothelial migration. In terms of GO enrichment, the marker genes of Mono/Macro, T/NK cells, B cells, myelocyte, and neutrophils were enriched in several immune-response-related terms at BP category.
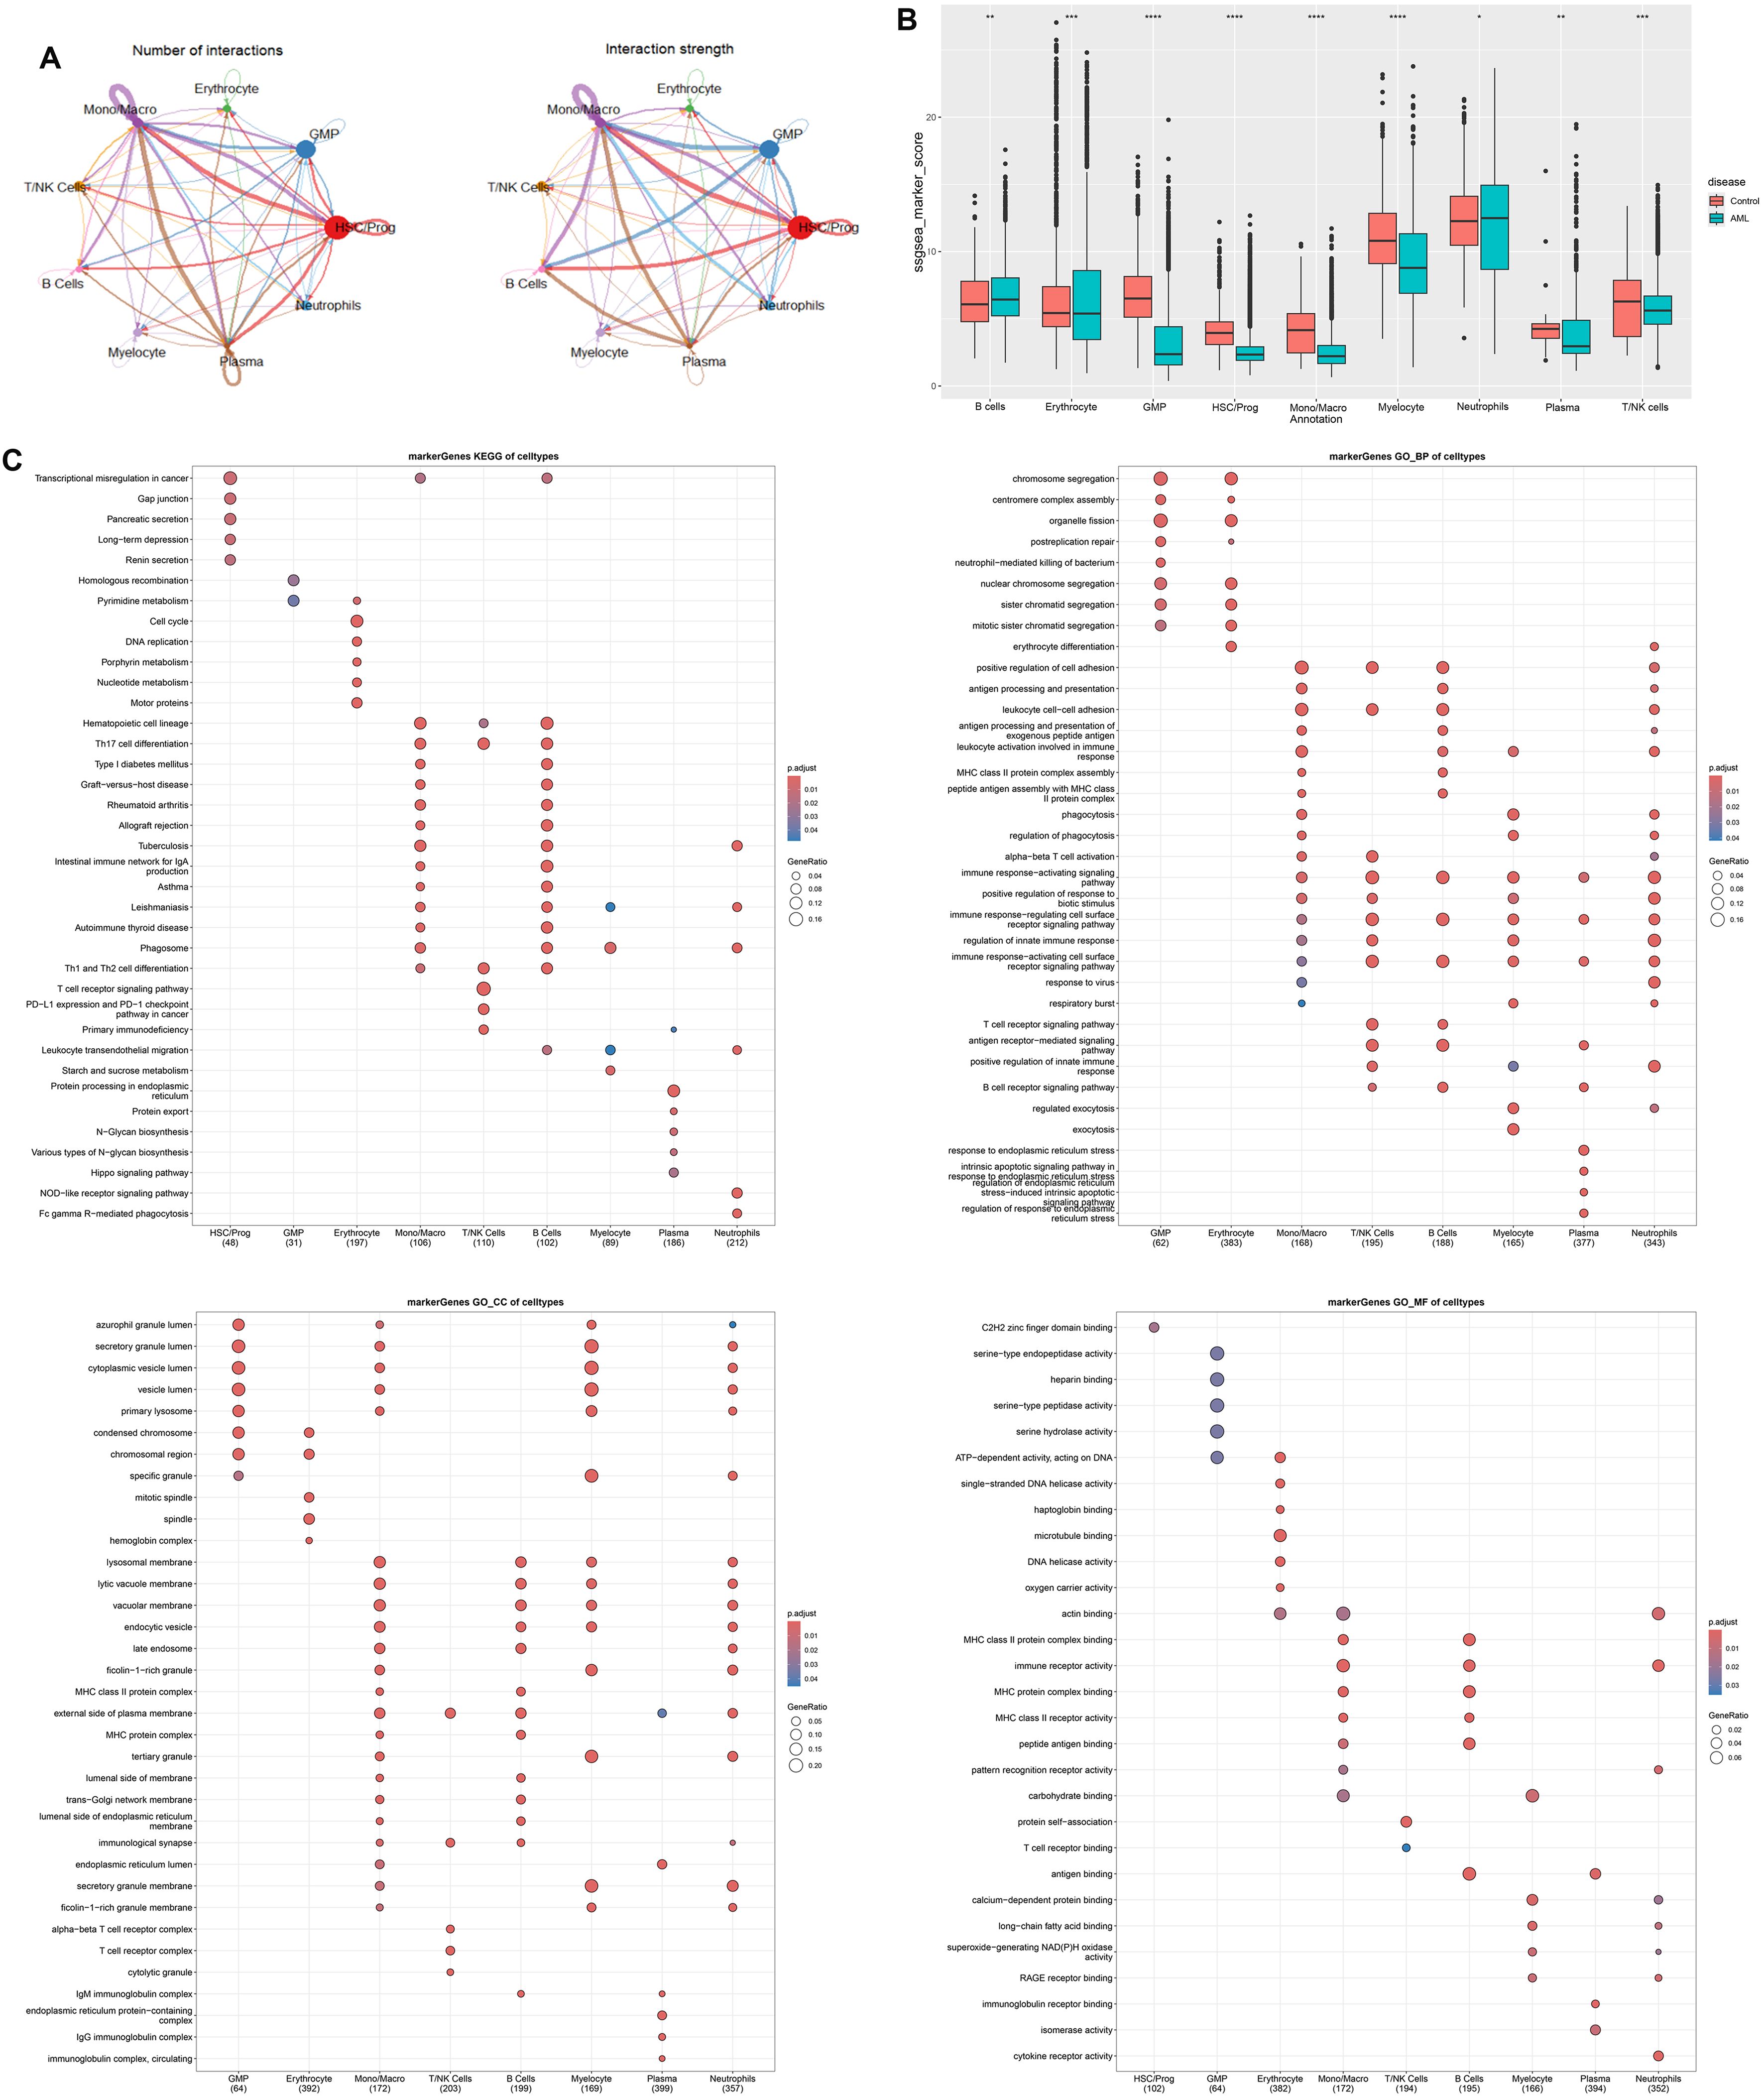
Figure 2. Cell–cell communication analysis and function enrichment of marker genes based on nine cells clusters. (A) Number and strength of interactions between major cells. (B) Differentially expressed cells in AML and controls were obtained by calculating the ssGSEA score of each cluster based on the marker genes. (C) KEGG and GO enrichment analysis based on marker genes of differentially expressed cells. *p < 0.05, ** p < 0.01, *** p < 0.001, **** p < 0.0001.
AML-associated key modules and DEG identification using bulk RNA-seq
The GSE114868 dataset was downloaded to identify major modules associated with AML and DEGs between AML patients and controls. In details, WGCNA was employed to analyze genes associated with AML development and progression. The soft-thresholding power was optimized for the network topology by balancing the criteria of mean connectivity and scale-free topology fit, ensuring biologically interpretable network sparsity while preserving scale-independent properties. Setting the scale-free topology model fit index threshold to 0.85, we selected β = 7 as the soft threshold, at which the scale-free network performed optimally (Figure 3A). Highly similar modules were then clustered, and a total of 20 modules were available after dynamic hybrid cutting (Figure 3B). We then calculated the correlation between AML and the genes modules. Based on the p-value and correlation coefficient, we finally chose MEblue module (containing 2,967 genes) as the targeted module, which has the strongest positive association with AML (Figure 3C). The clustering of genes in MEblue module can separate AML patients from healthy donors properly (Figure 3D). A total of 1,010 DEGs were filtered based on the criteria of logFC > 1 and adj.P.Val < 0.05 (Figure 3E), which classified AML patients and healthy donors into two clusters (Figure 3F).
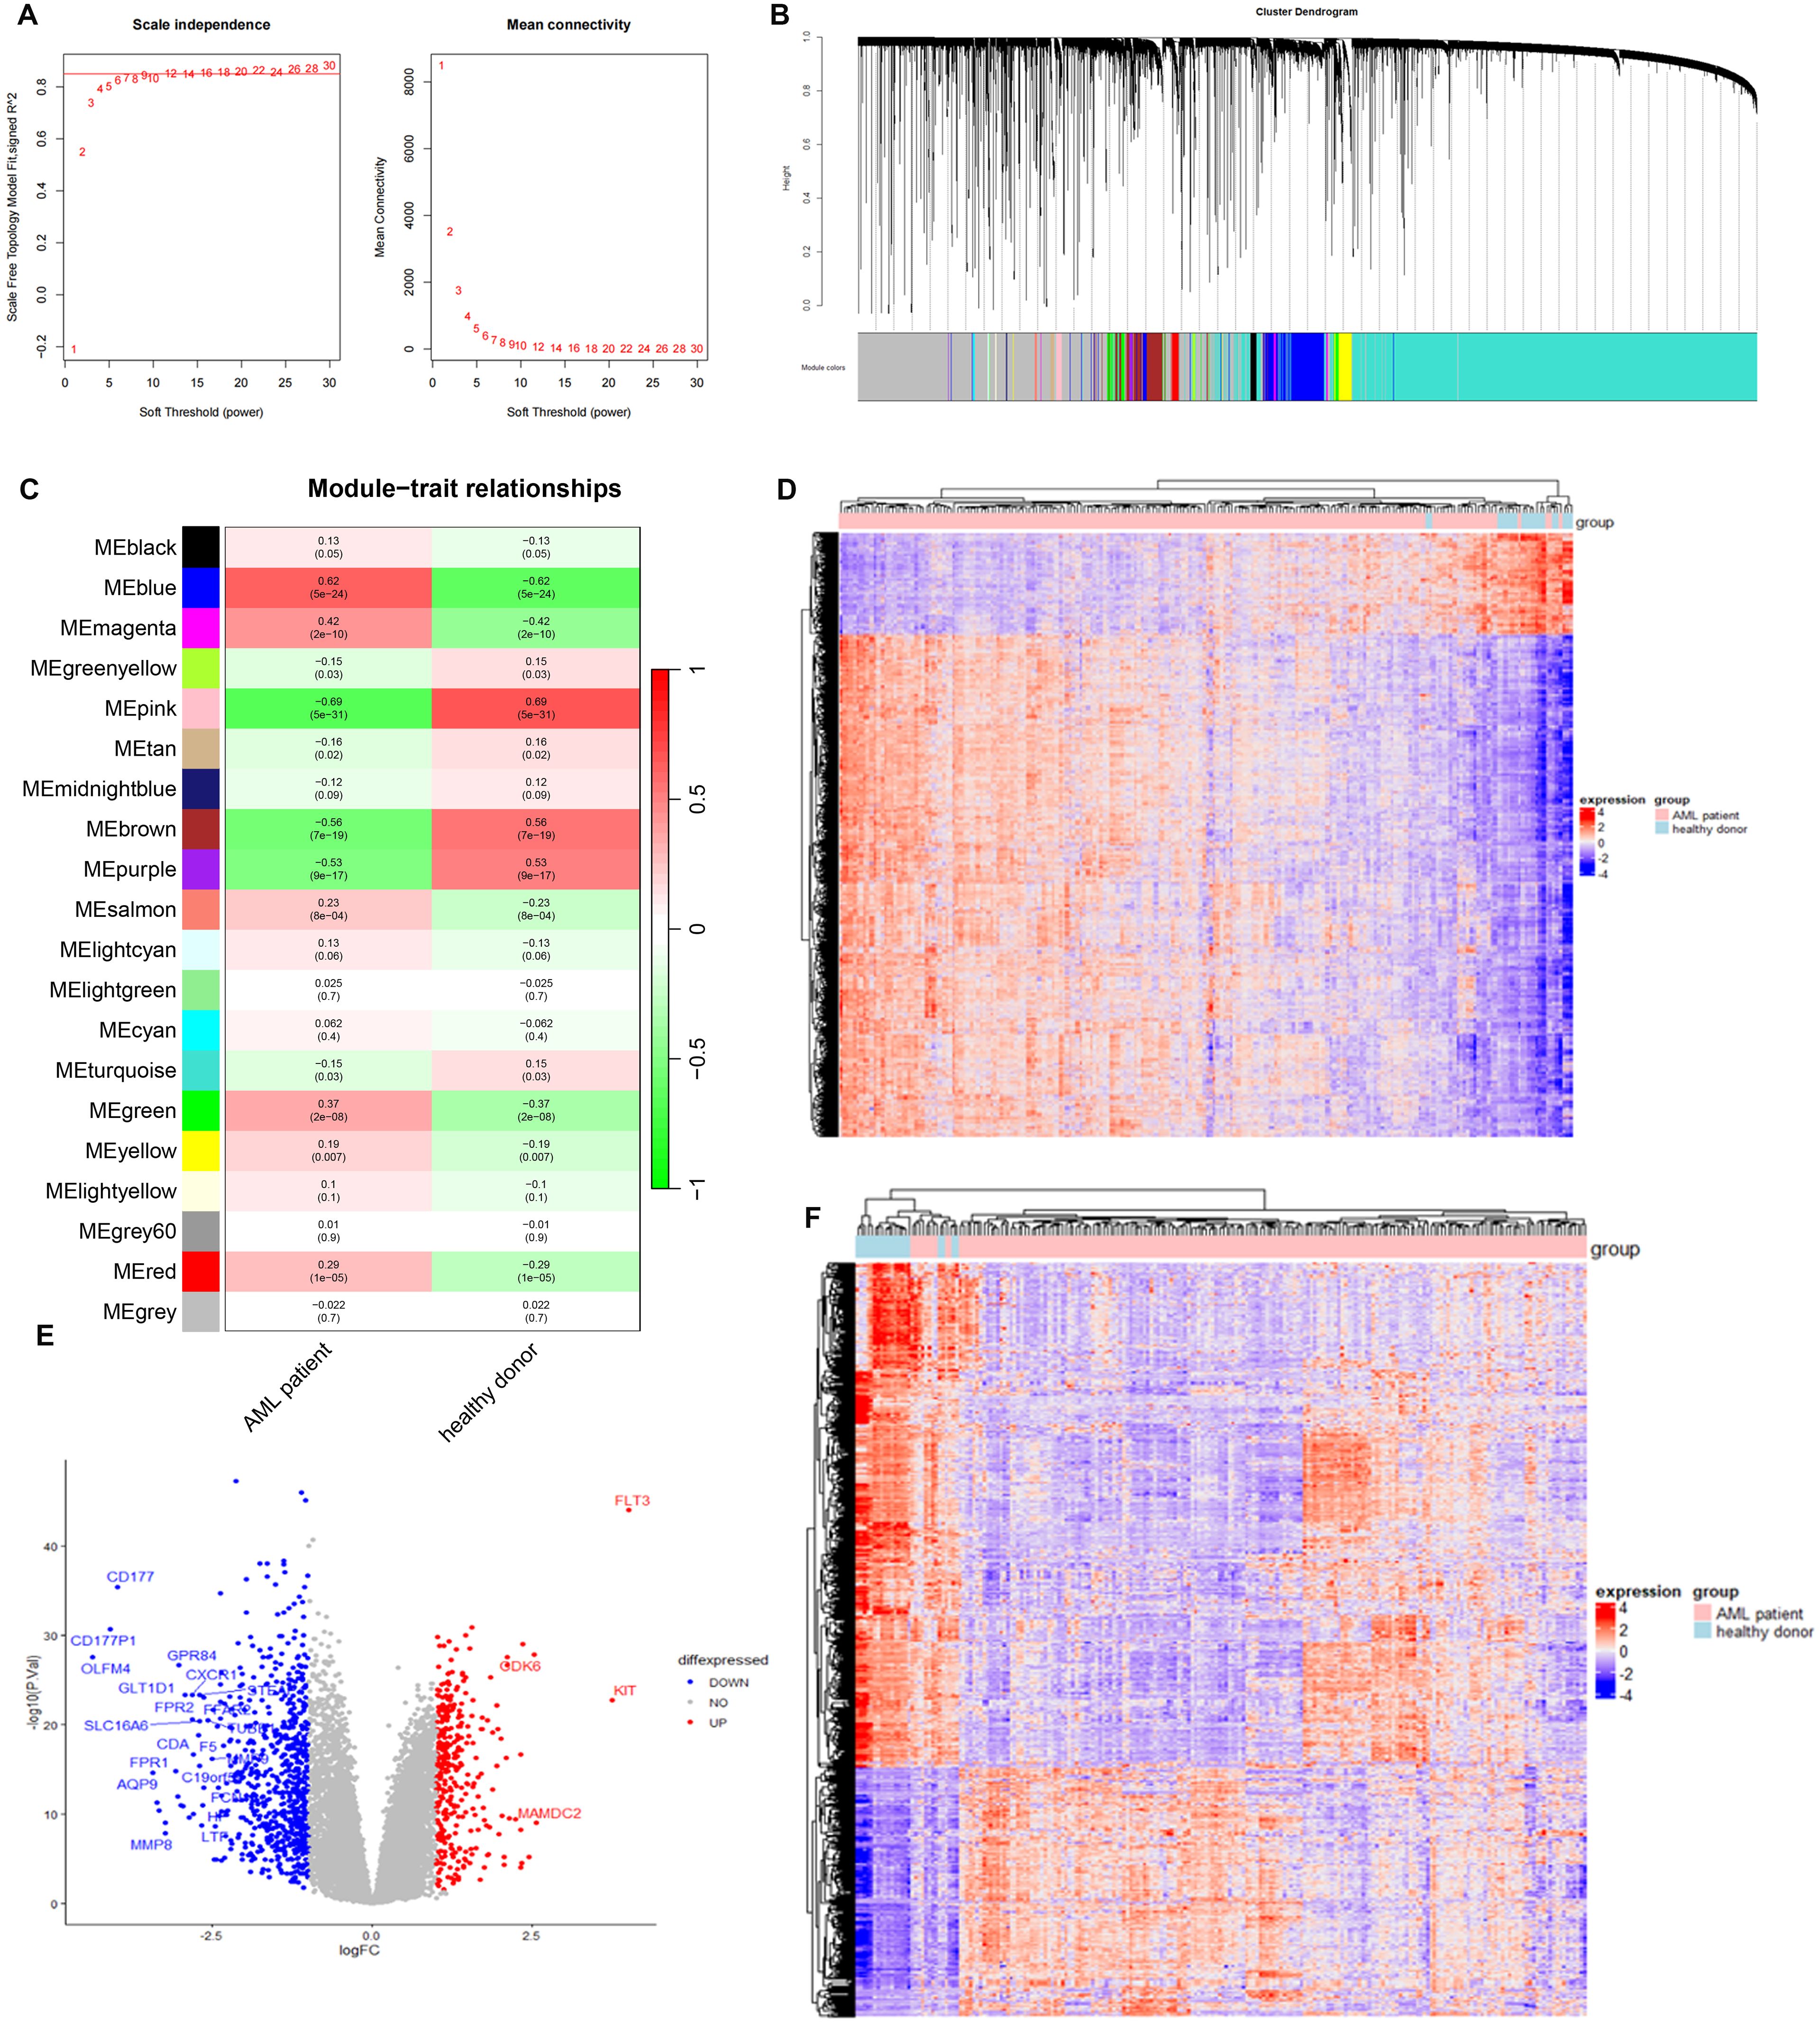
Figure 3. Identification of AML-associated genes and differential expressed genes in AMP patients using GSE114868 dataset. (A) Analysis of the scale-free index for various soft-threshold powers (β). (B) Gene cluster dendrogram and gene module colors. (C) Heatmap of correlations between modules and AML. (D) Heatmap of AML-associated genes in MEblue model. (E) The volcano plot of differentially expressed genes between AML patients and controls. Each blue dot represents a downregulated gene in AML patients, and each read dot represents an upregulated gene in AML patients. (F) Heatmap of differential expressed genes between AML patients and controls.
Construction and validation of prognostic model
We selected the overlapped genes of core cell marker genes, genes in MEblue module, and DEGs between AML patients and controls in GSE114868 dataset as candidates, resulting in 35 genes (Figure 4A). Univariate Cox regression analysis was then performed on these candidates in the training set to filter out genes significantly correlated with prognosis, containing CALR, CDK6, KDM1A, CYTL1, SUCNR1, TMEM220, and ADM (Figure 4B). Final variables, including CALR, KDM1A, SUCNR1, TMEM220, and ADM, that were used for prognostic model construction were screened using LASSO regression analysis (Figures 4C, D). Prognostic risk stratification in AML patients was mathematically derived through weighted integration of multivariate regression coefficients and normalized expression values for five feature-selected genes. The detailed formula is shown below: Risk score = −0.44751 * CALR + 0.28535 * KDM1A + 0.11832 * ADM − 0.20546*TMEM220 − 0.06282 * SUCNR1. Patients were classified into high- and low-risk groups according to the median value of risk score. Further Kaplan–Meier curves analysis suggested that low expression of CALR, SUCNR1, KDM1A, and TMEM220, and high expression of ADM were associated with poor prognosis of AML patients (Figure 4E). Moreover, the constructed prognostic model was validated using TCGA_LAML and GSE106291 validation sets. Patients in the TCGA_LAML dataset were categorized into high- and low-risk groups. Kaplan–Meier curves analysis showed that patients with low-risk score have more favorable prognosis than those with high-risk score (Figures 5A, B). The ROC curve for overall survival was inferred to further evaluate the availability of prognostic signature, demonstrating that the area under the curve at 1, 2, 3, and 4 years were >0.6 (Figure 5C), implying the reliability of the prognostic signature. Available clinicopathological characteristic analysis revealed the significant difference of risk score between patients older than 60 and patients younger than 60 (Figures 5D, E). In addition, we observed that patients with high-risk score demonstrate higher ImmuneScore, StromalScore, and ESTIMATEScore than those with low-risk score (Figure 5F), and patients’ risk score is positively correlated with ImmuneScore, StromalScore, and ESTIMATEScore (Figure 5G). Furthermore, we validated the risk model using the GSE106291 dataset. The results showed the analogous outcome of TCGA_LAML dataset that patients with low-risk score have more favorable prognosis than those with high-risk score (Figures 6A, B). Patients who were drug resistant and older than 60 showed higher risk score than those who were drug sensitive and younger than 60, respectively (Figure 6C). GSEA analysis of risk-model-related genes in both TCGA_LAML and GSE106291 datasets revealed the significant differences in inflammatory response between high- and low-risk groups (Figures 6D, E). We further analyzed the correlation between five identified signature genes and inflammatory-related cytokines using TCGA-LAML dataset, showing that CALR, KDM1A, SUCNR1, and TMEM220 were negatively correlated with IL10 and ADM was positively correlated with IL10. In addition, we observed that CALR, SUCNR1, and TMEM220 were negatively correlated with IL6, and ADM was positively correlated with IL6 (Figure 6F). Subsequent analysis demonstrated that all five identified signature genes were significantly correlated with numerous immune cells, indicating the immune correlation of our constructed prognostic model (Figure 6G).
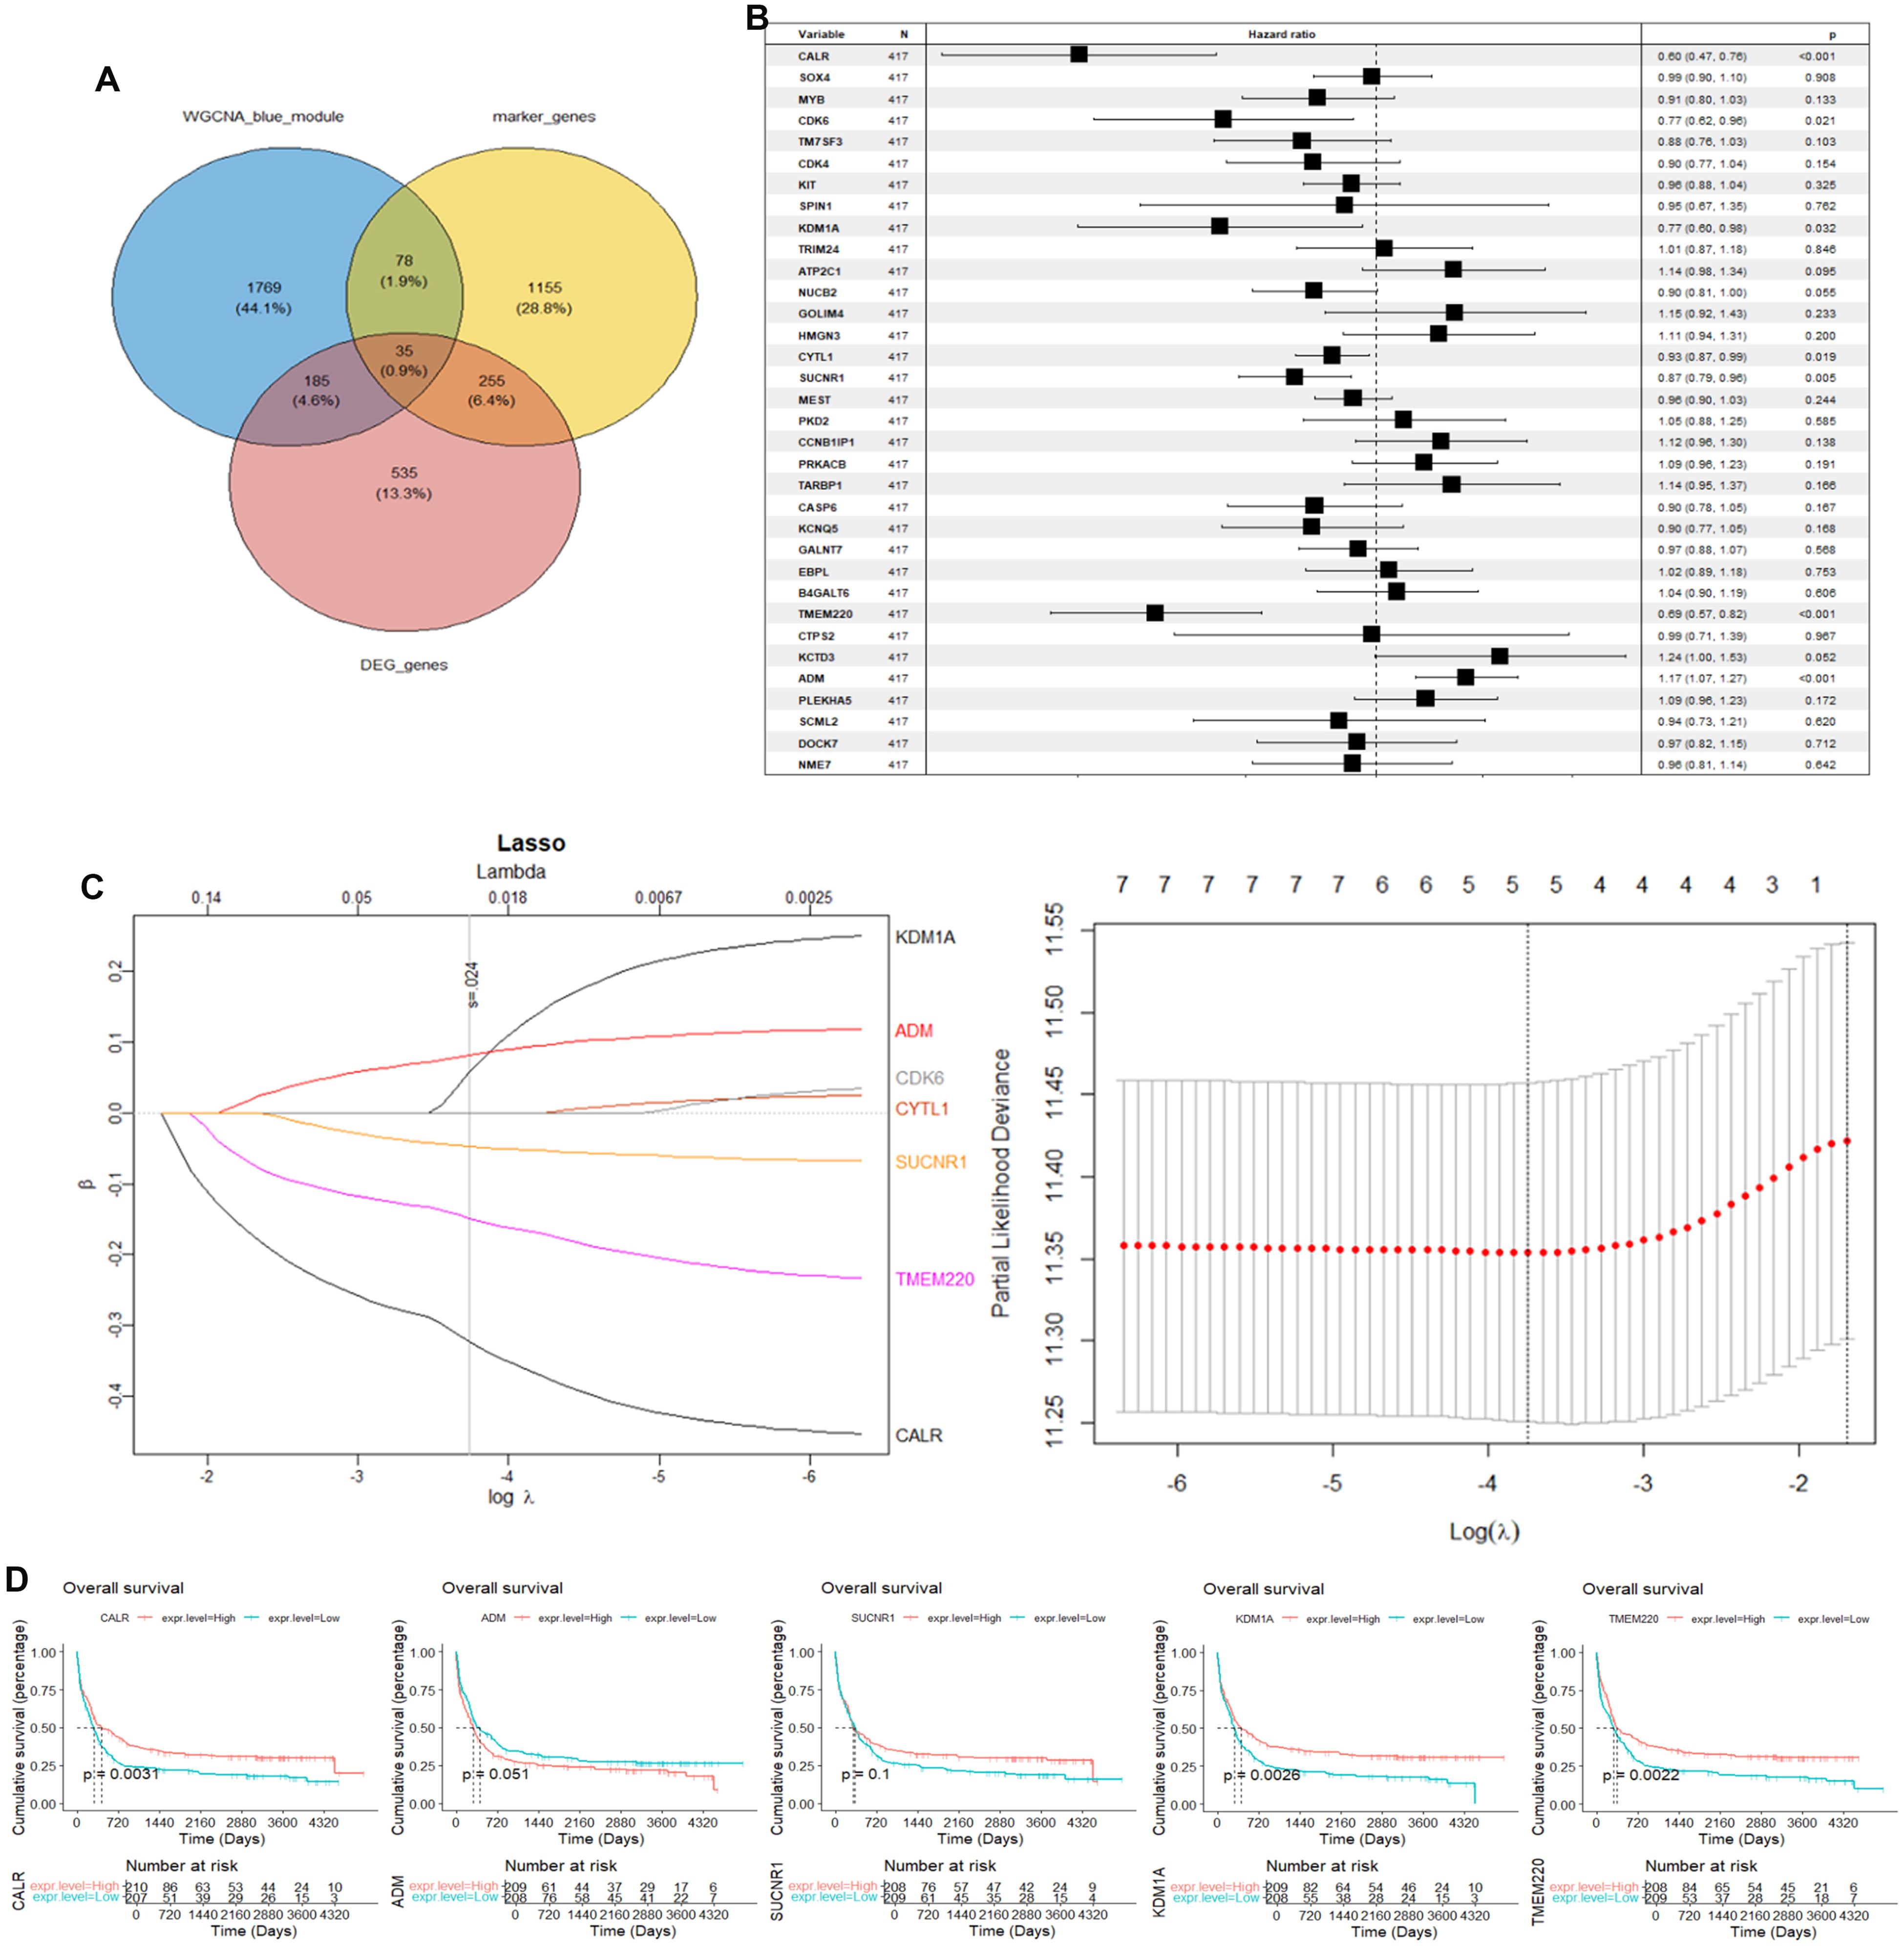
Figure 4. Construction of prognostic signature using GSE37642 dataset. (A) Intersection of AML-associated genes, DEGs in key cells, and DEGs between AML and controls. (B) Univariate Cox regression analysis of OS. (C) LASSO regression of OS-related genes. (D) Kaplan–Meier curve of CALR, KDM1A, SUCNR1, TMEM220, and ADM.
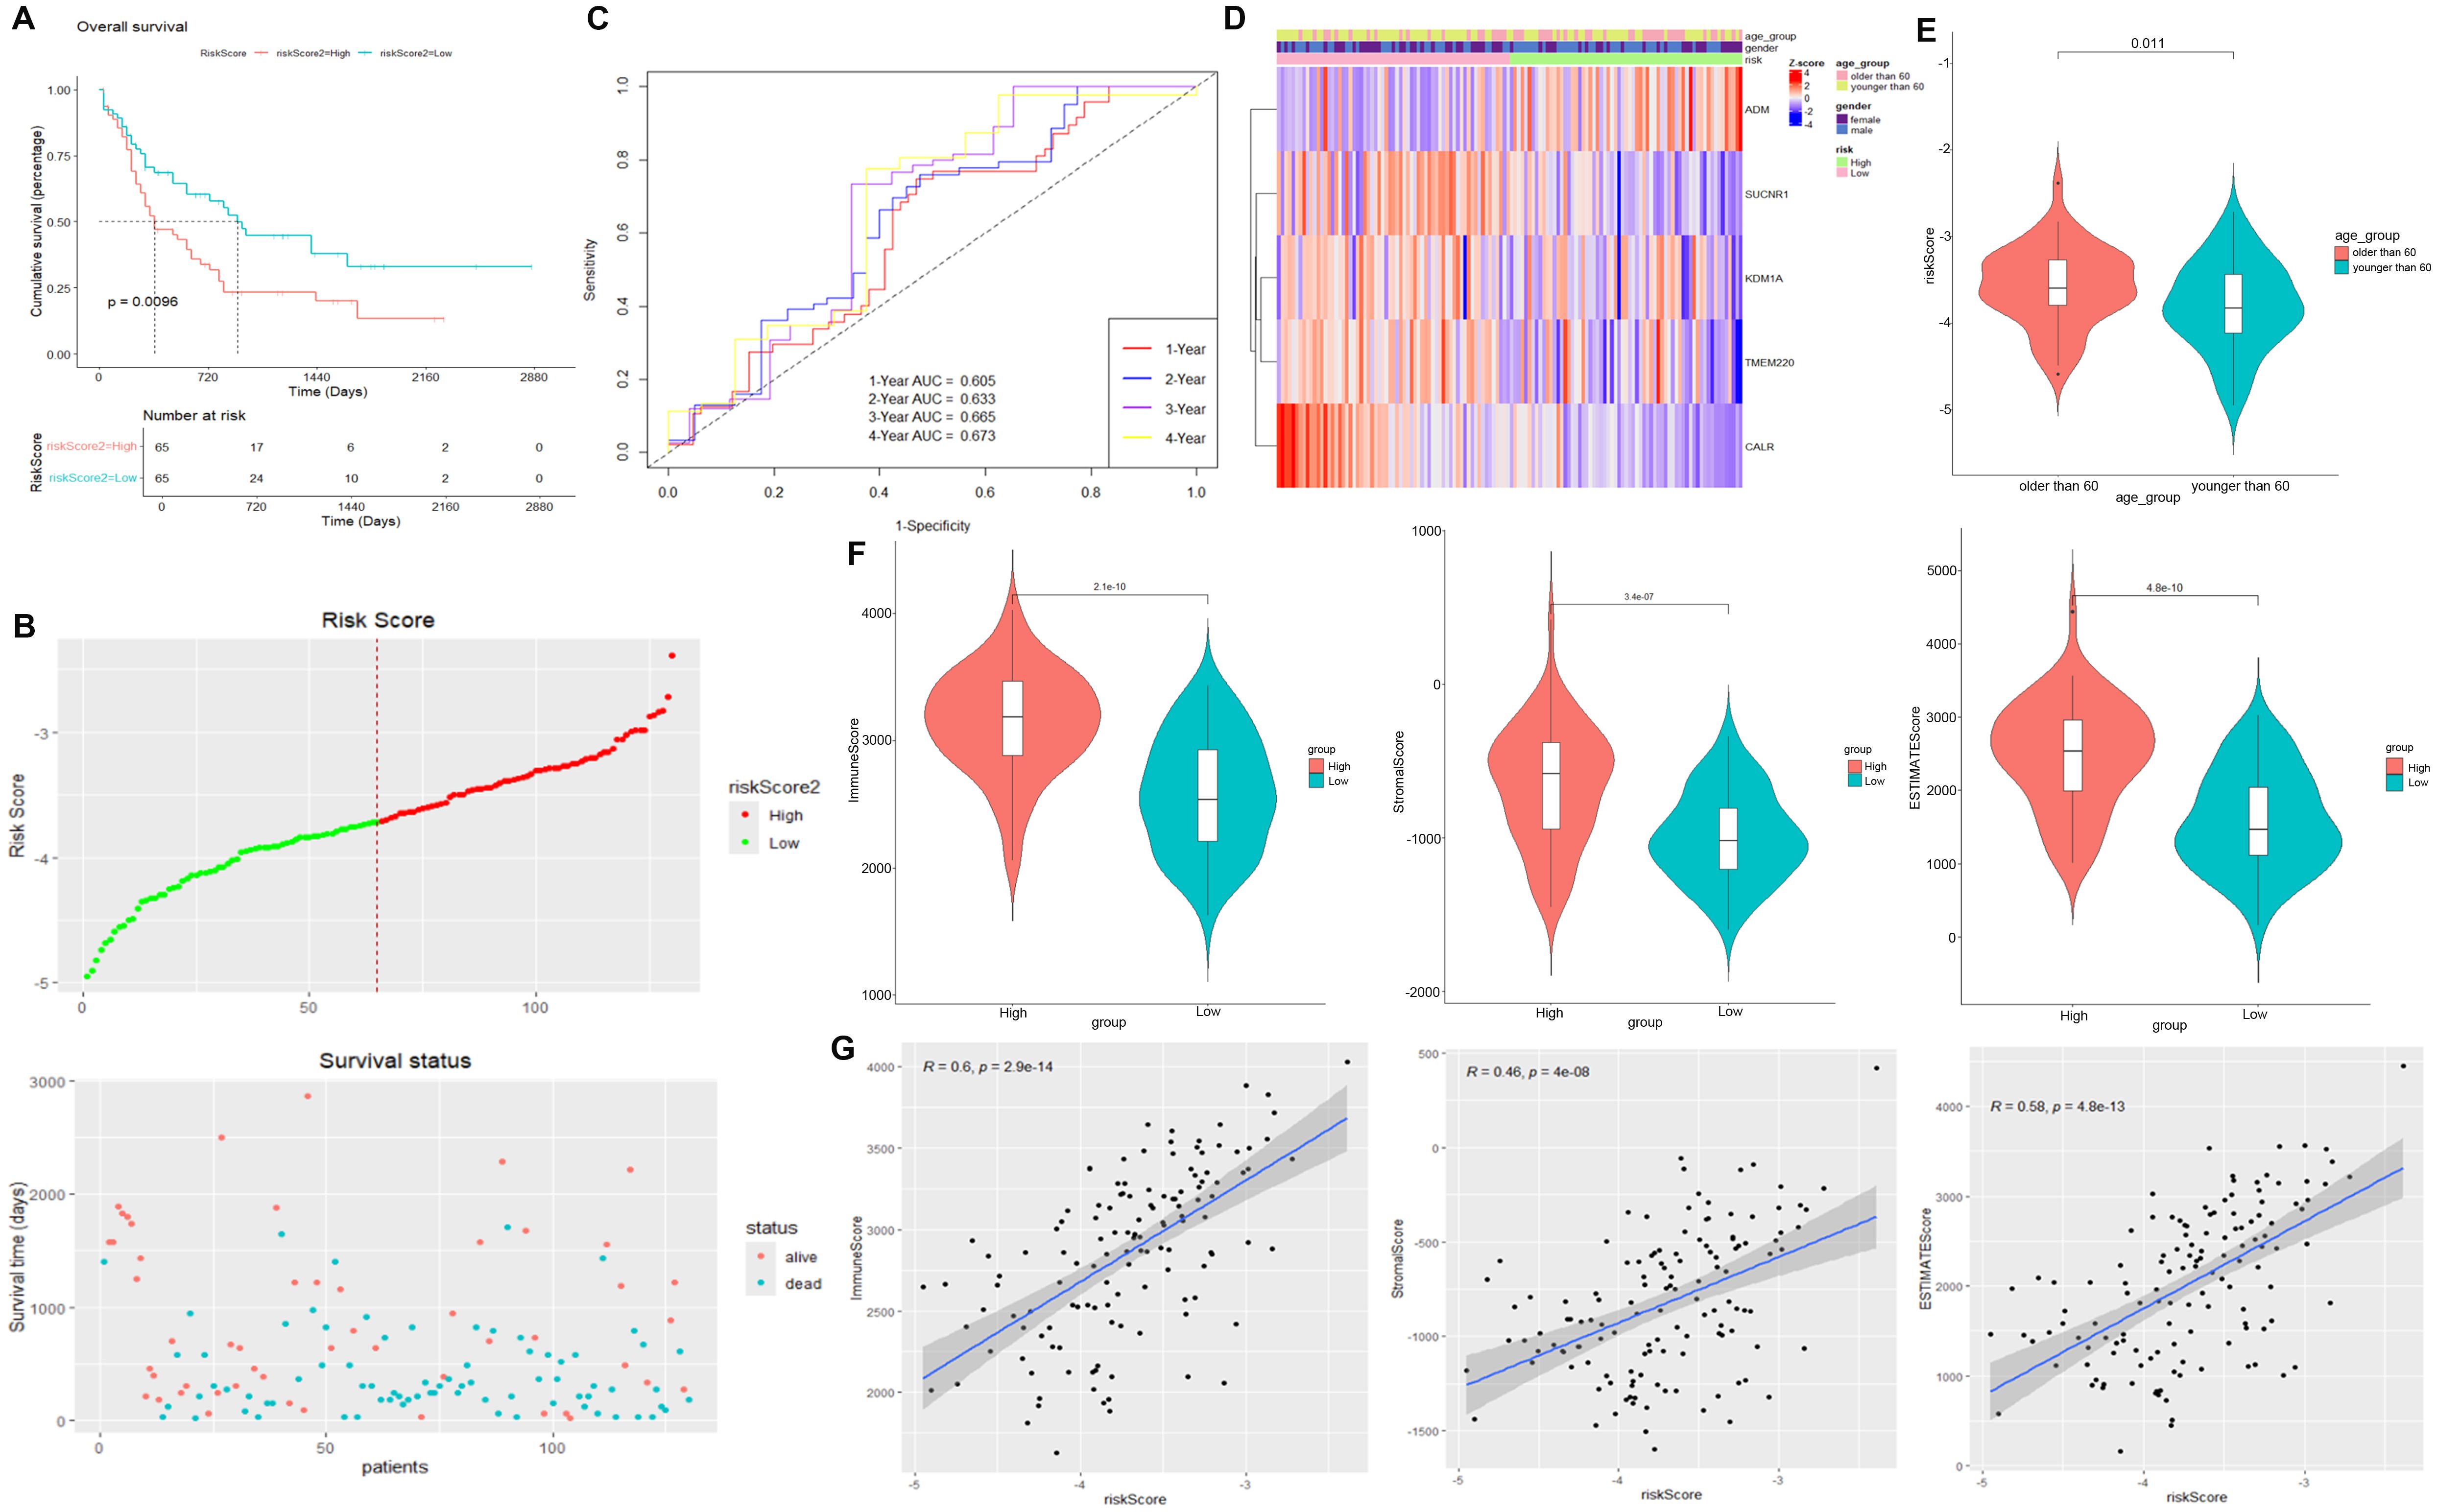
Figure 5. Validation of prognostic signature using TCGA_LAML dataset. (A) Kaplan–Meier curve result. (B) Risk survival status plot. (C) The AUC of the prediction of 1-, 2-, 3-, and 4-year survival rates of AML patients. (D) Heatmap of risk model and clinical characteristics. (E) Risk score of AML patients older than 60 years and younger than 60 years. (F) Scatter plot between immune score, StromalScore, and ESTIMATEScore in high- and low-risk scores. (G) Correlation between immune score, StromalScore or ESTIMATEScore, and risk score.
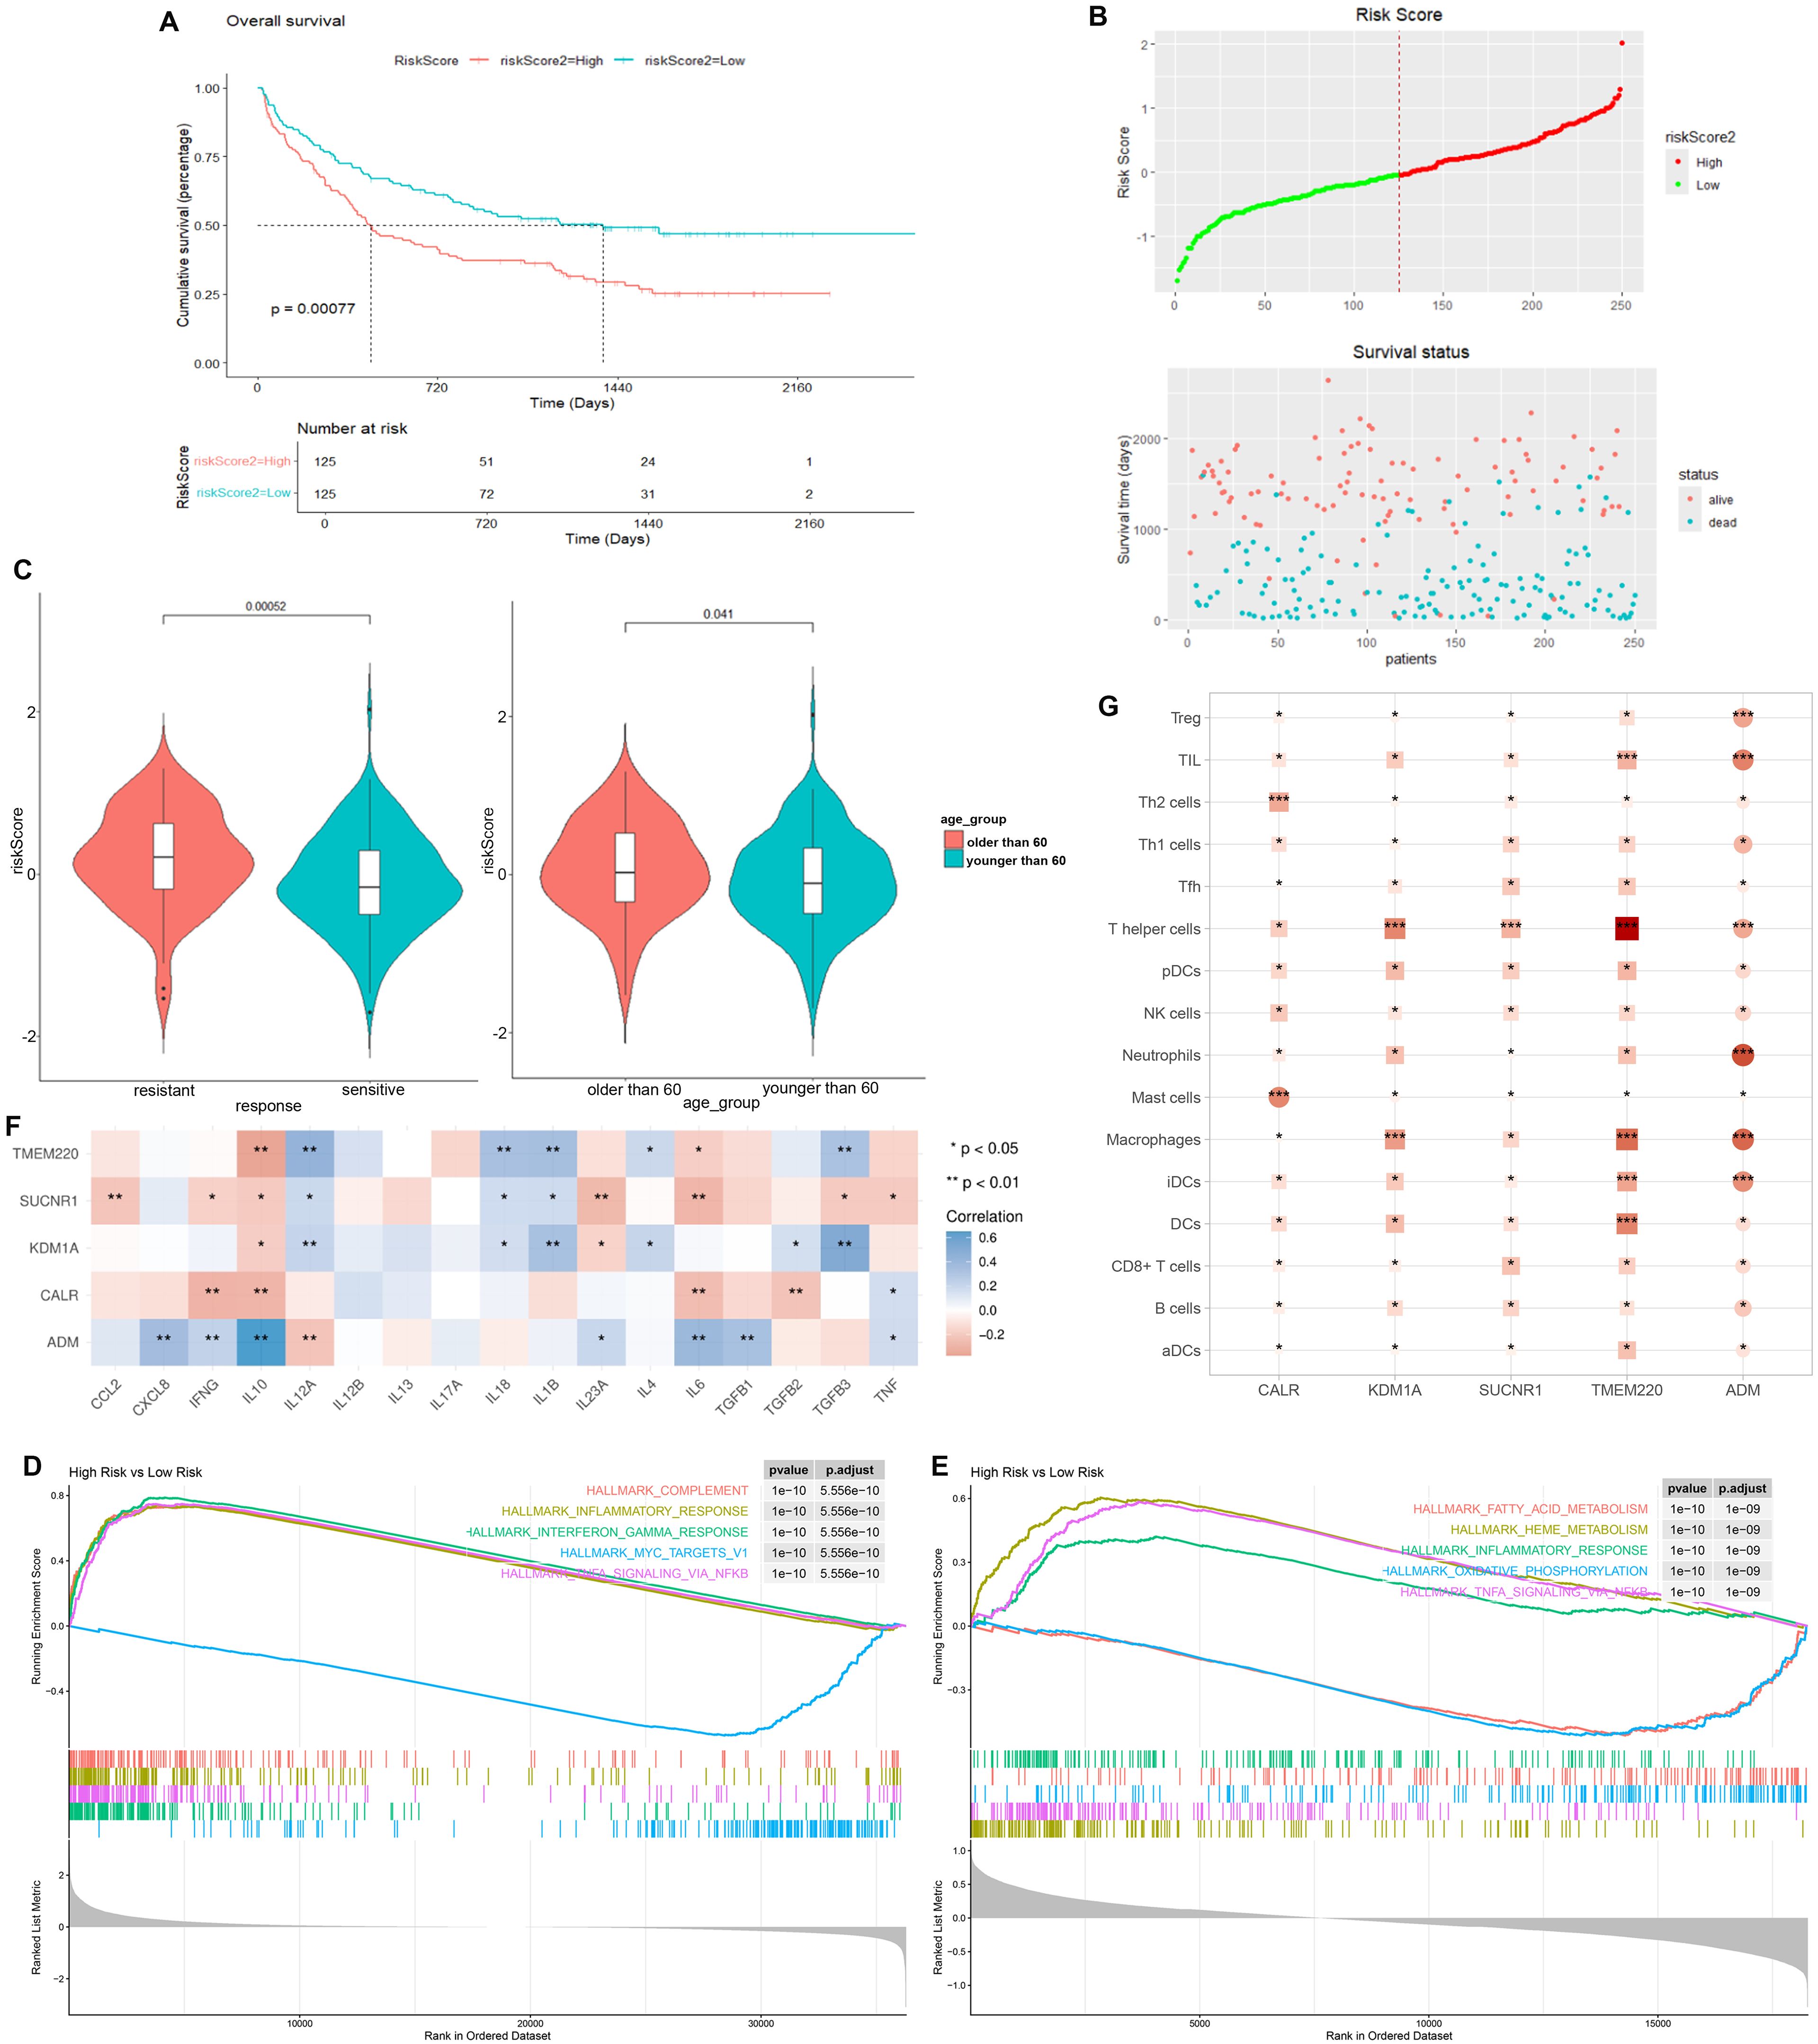
Figure 6. Validation of prognostic signature using GSE106291 dataset. (A) Kaplan–Meier curve result. (B) Risk survival status plot. (C) Risk score of AML patients who were drug resistant and sensitive, and AML patients older than 60 years and younger than 60 years. (D) GSEA analysis of risk-model-related genes in TCGA_LAML dataset. (E) GSEA analysis of risk-model-related genes in GSE106291 dataset. (F) Correlation analysis between five identified signature genes and inflammatory-related using TCGA-LAML dataset. (G) Correlation analysis between five identified signature genes and immune cells using TCGA-LAML dataset. *p < 0.05, ** p < 0.01, *** p < 0.001.
Expression of prognostic-model-related genes in cell clusters
We then went back to the data of scRNA-seq to access the expression of genes in risk model, demonstrating that CALR and KDM1A were primary expressed in Mono/Macro, GMP, and HSC/Prog. SUCNR1, TMEM220, and ADM were primary expressed in GMP, HSC/Prog, and Mono/Macro, respectively (Figures 7A, B). The expression of both CALR and KDM1A in Mono/Macro, GMP, and HSC/Prog decreased gradually across patients from group 0 to group 3 (Figure 7C).
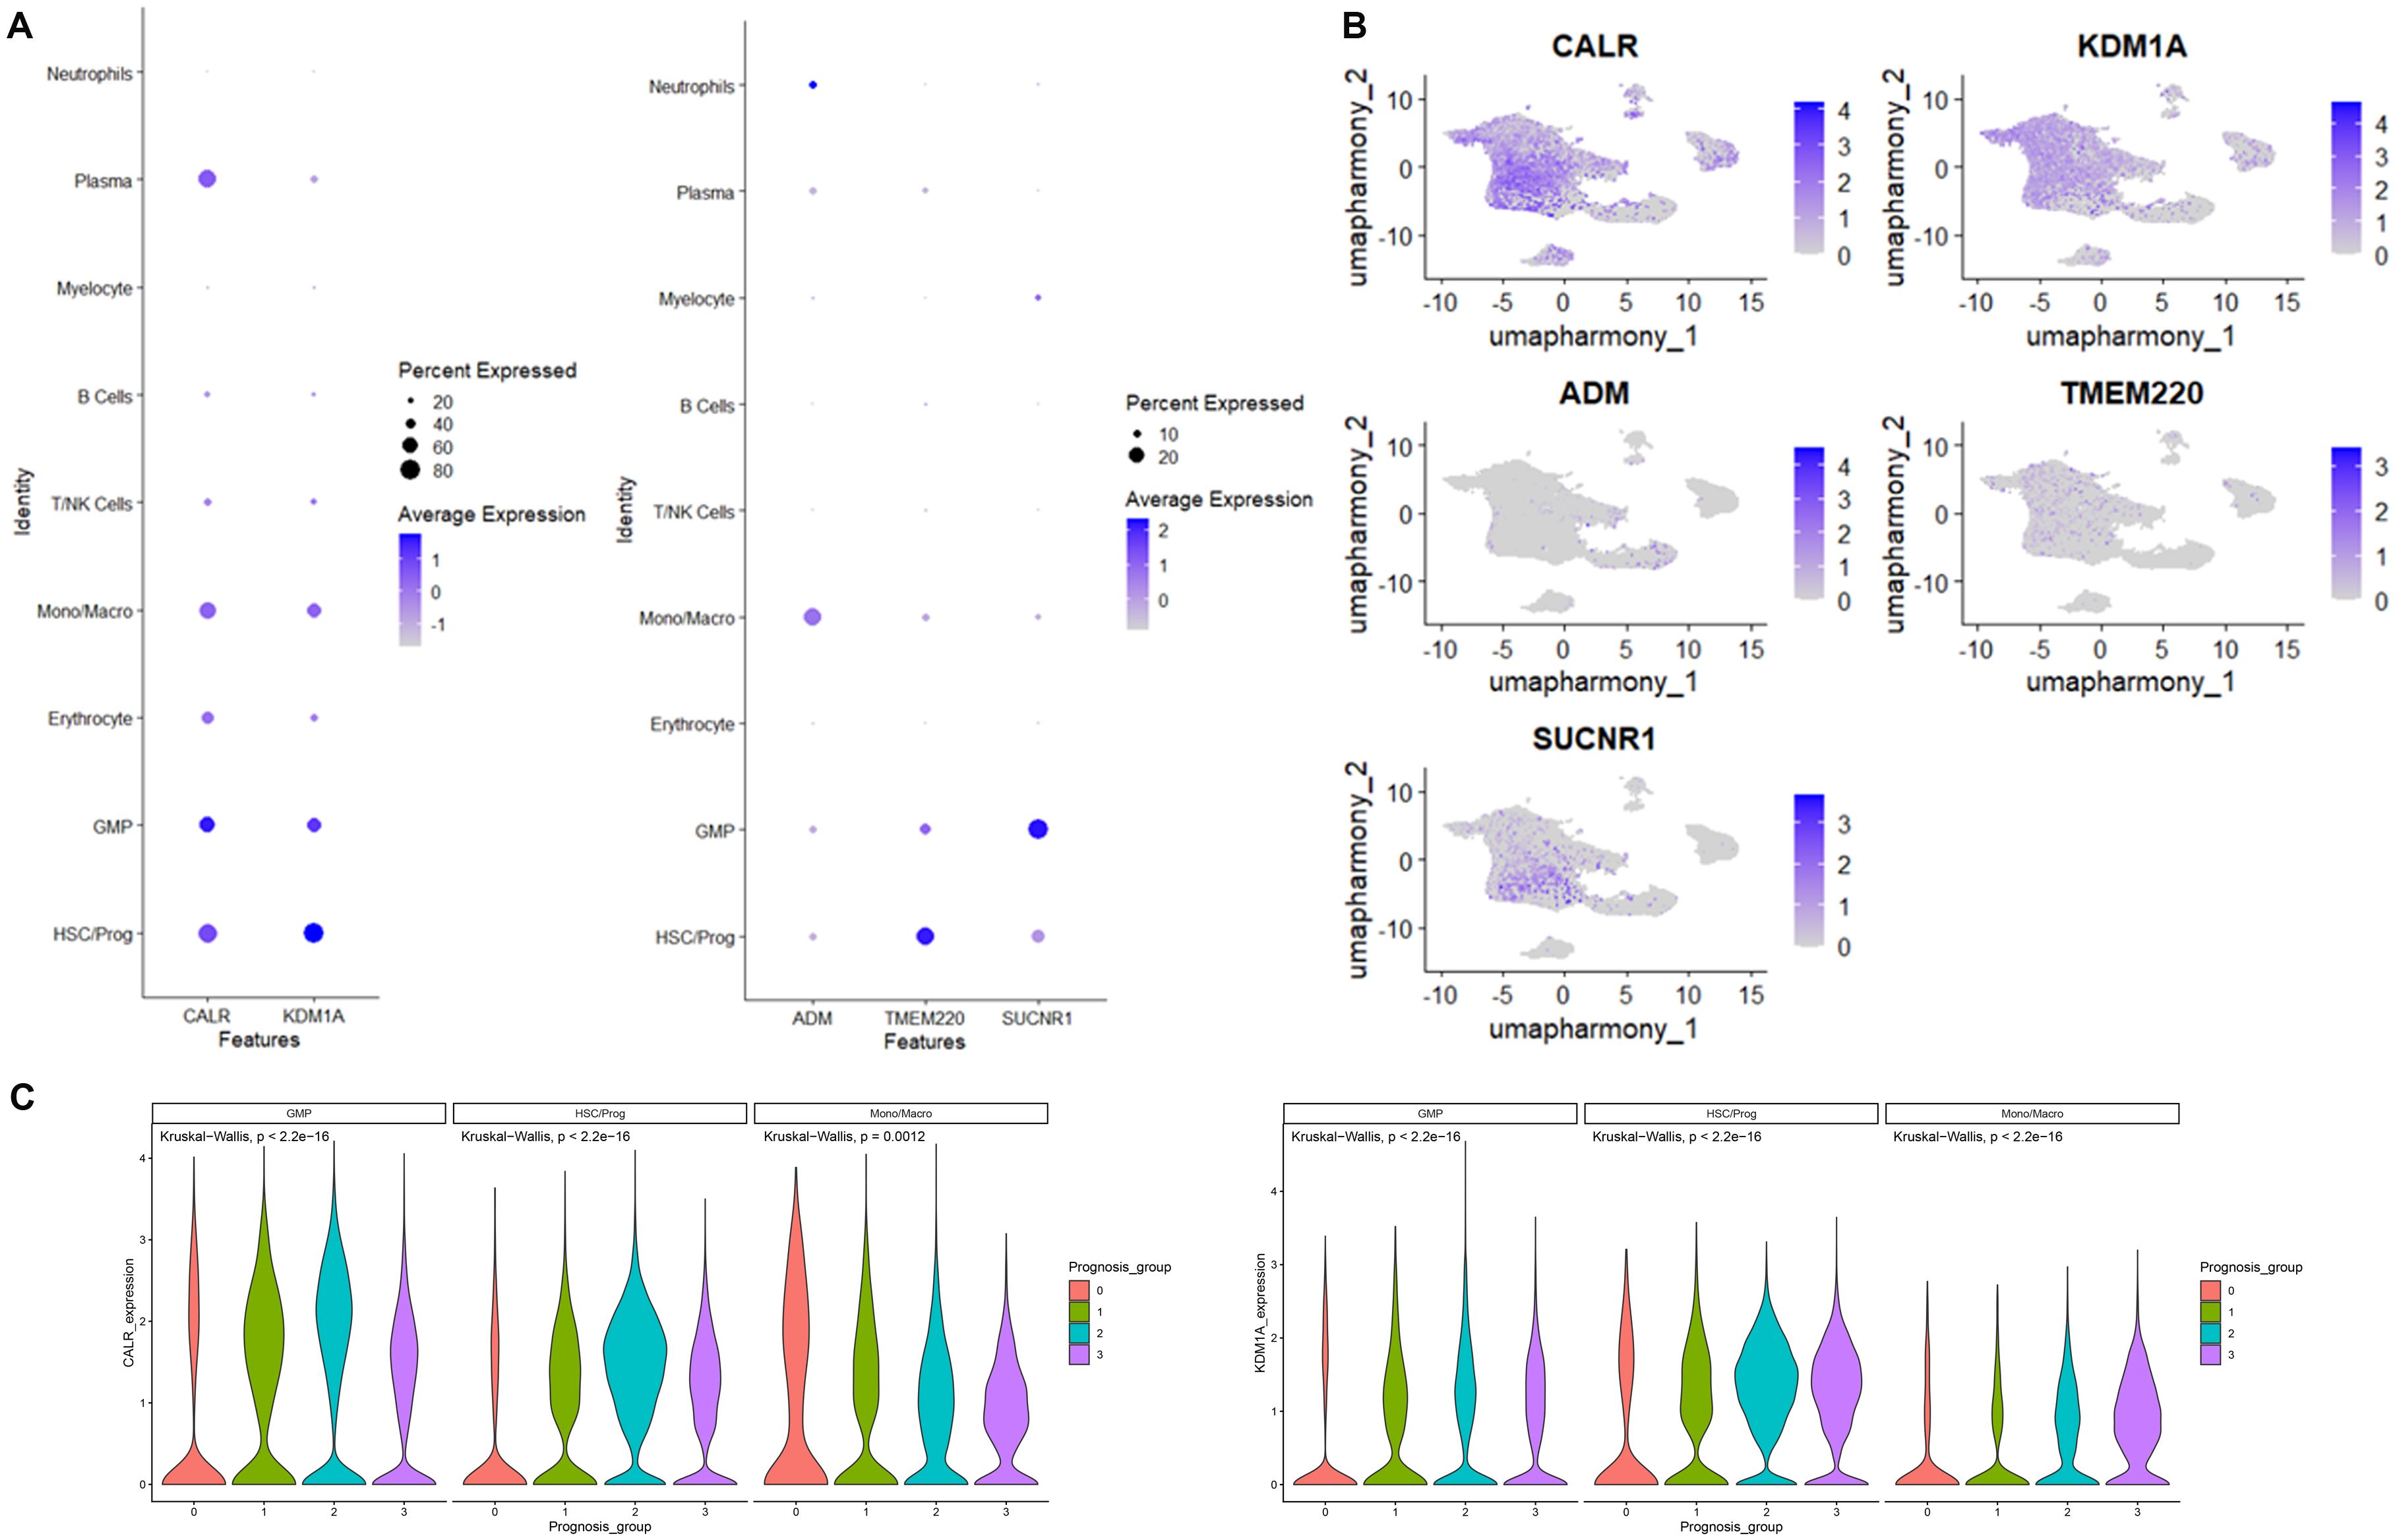
Figure 7. CALR, KDM1A, SUCNR1, TMEM220, and ADM expression distribution in cells identified using scRNA-seq. (A) Bubble diagram of CALR, KDM1A, SUCNR1, TMEM220, and ADM expression in cells. (B) The umap algorithm was employed to analyze the expression distribution of CALR, KDM1A, SUCNR1, TMEM220, and ADM. (C) The expression of CALR and KDM1A in immune cells.
Drug sensitivity analysis based on high− and low−risk groups
Drug sensitivity analysis of the prognostic signature showed that nine types of drugs represent significant IC50 differences between the high- and low-risk groups, including Vinblastine, Dactolisib, AZD8055, Paclitaxel, Dinaciclib, Bortezomib, CDK9, Vincristine, and Foretinib (Figure 8A). Notably, we observed that ADM are positively correlated with Foretinib, Bortezomib, and Paclitaxel, whereas KDM1A are negatively associated with Vincristine, Bortezomib, Dinaciclib, and Vinblastine (Figure 8B).
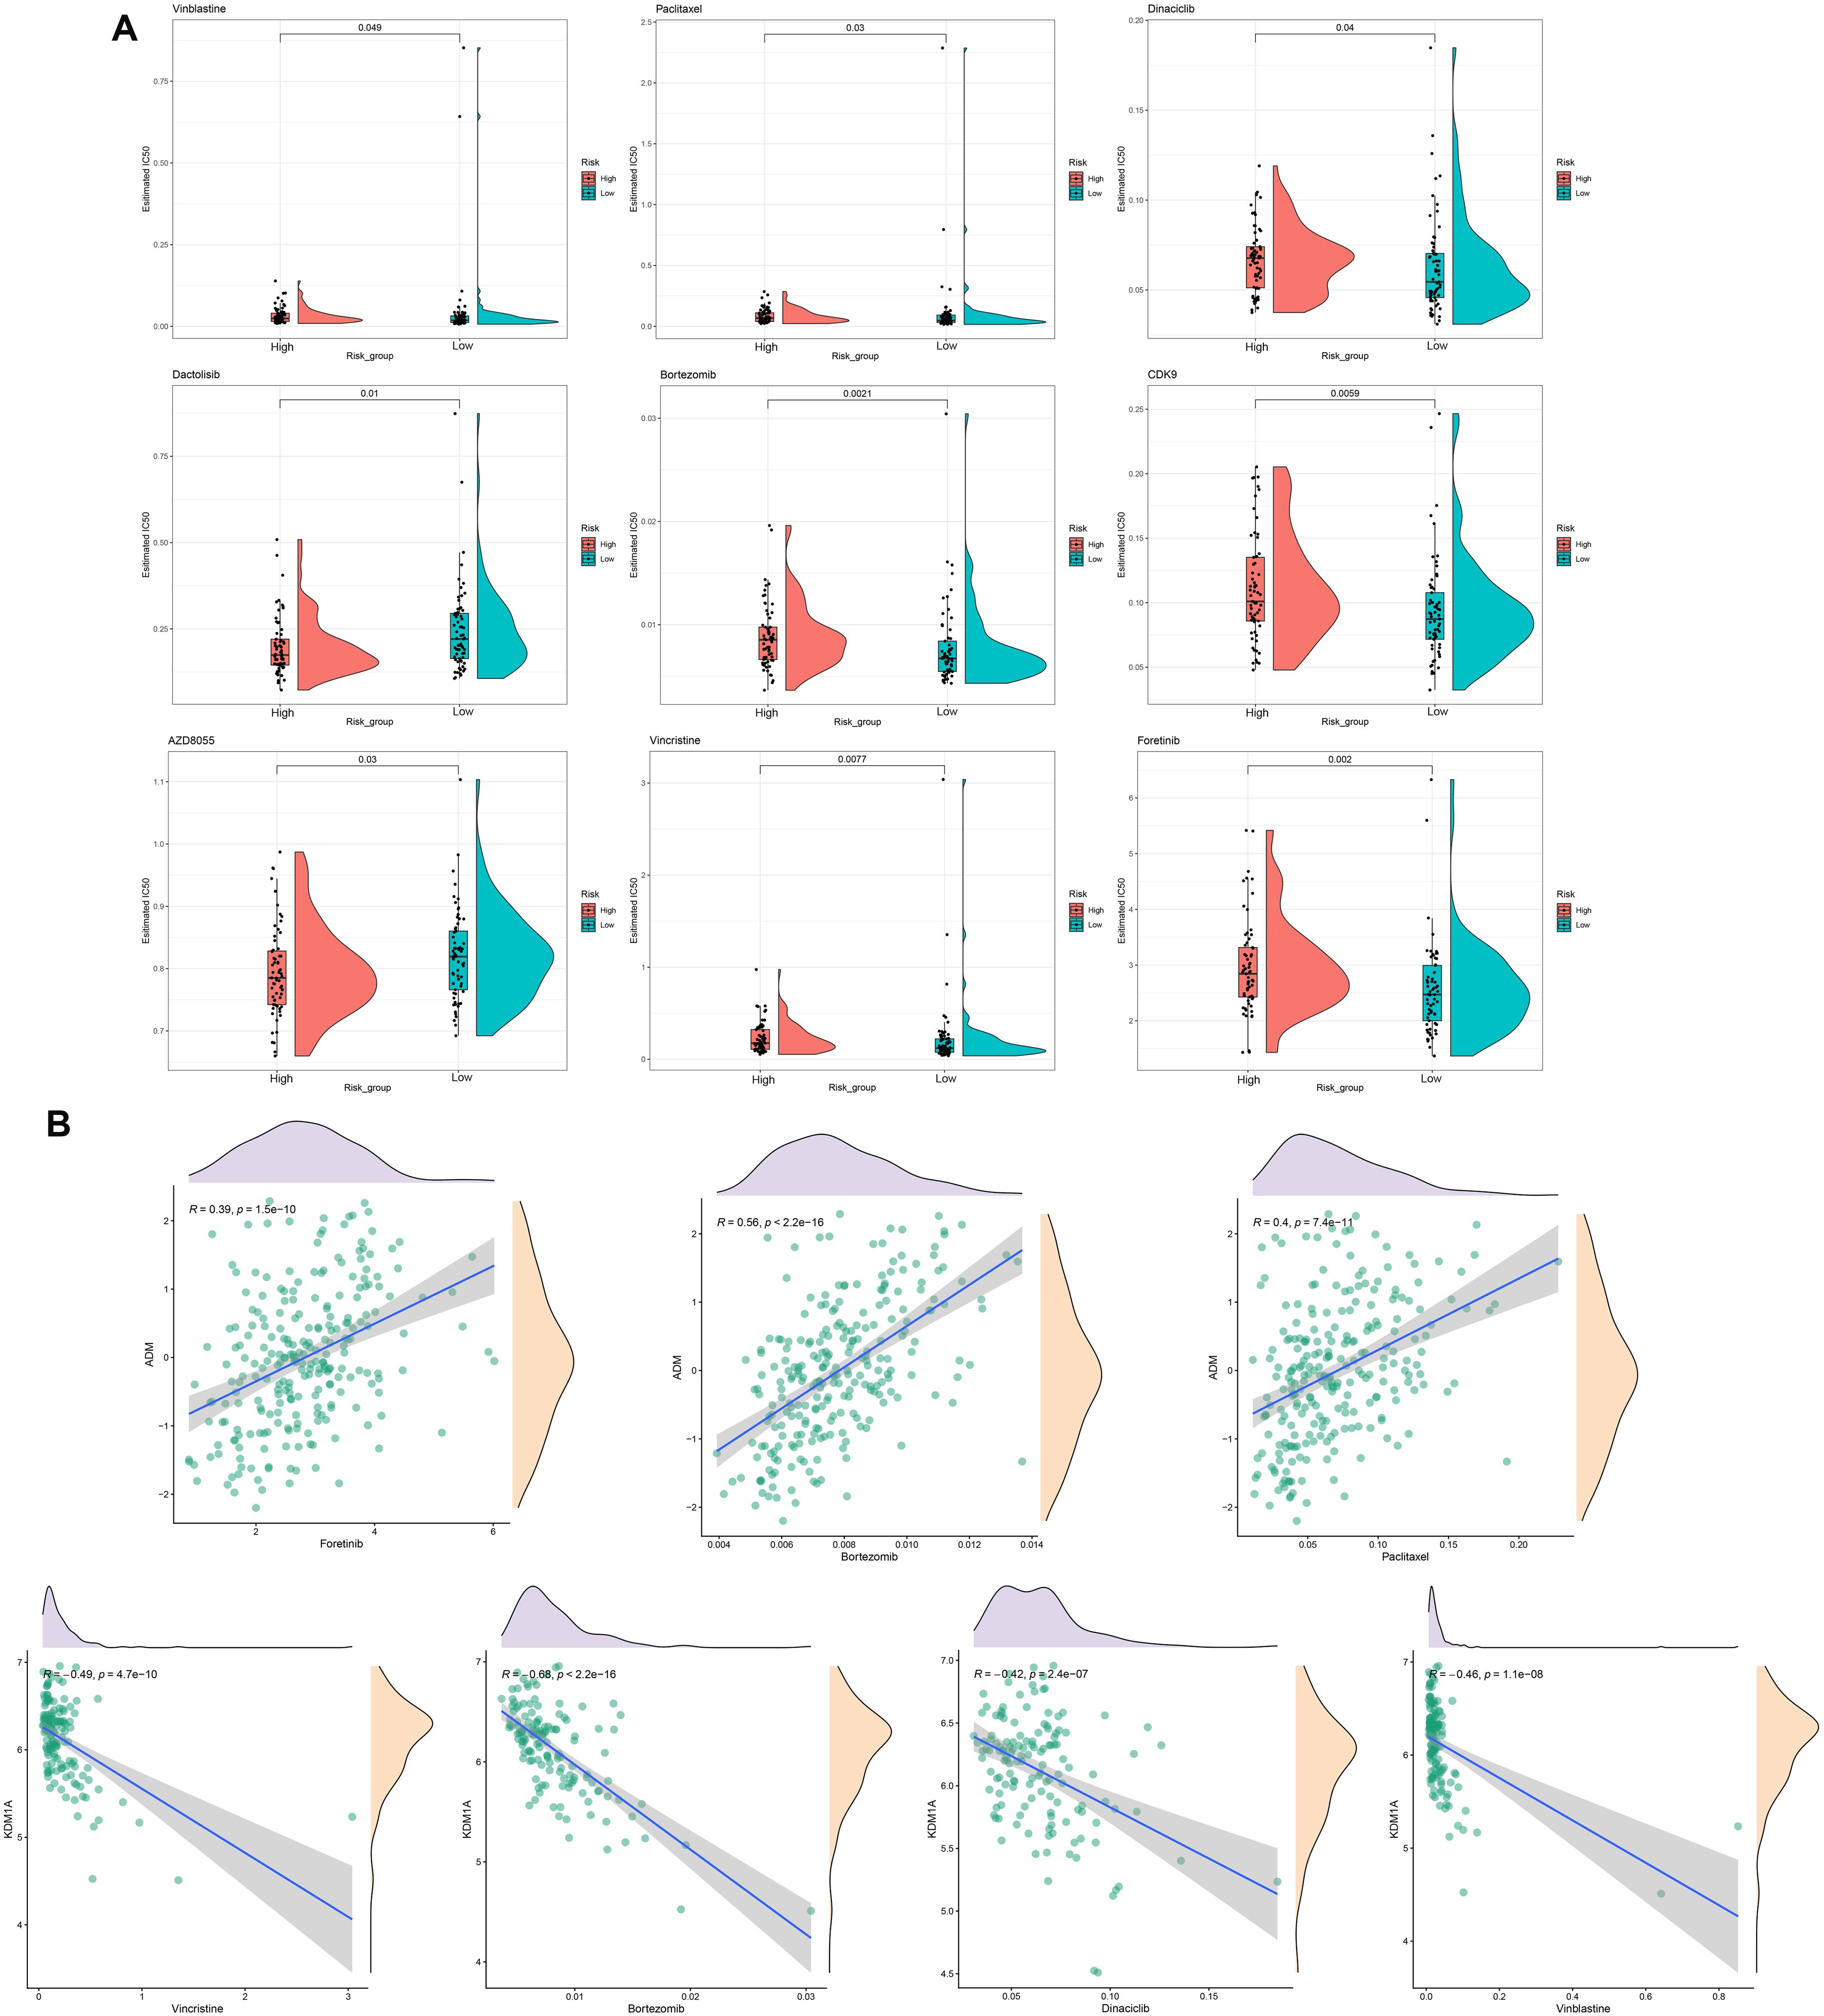
Figure 8. Drug sensitivity analysis. (A) Estimated IC50 for different drugs in high- and low-risk groups. (B) The correlations between ADM or KDM1A and drugs.
Discussion
The current study sought to construct a novel risk model for AML patient through comprehensive analysis of internal scRNA data and external bulk RNA data to optimize the precise treatment strategies for patients and improve prognosis. The cells detected using scRNA-seq were classified and annotated into nine clusters, including B cells, erythrocyte, GMP, HSC/Prog, Mono/Macro, myelocyte, neutrophils, plasma, and T/NK cells. The significantly different marker genes of each cell subtype were identified and were subjected to KEGG and GO enrichment. KEGG analysis showed that the maker gene of B cells, myelocyte, and neutrophils were enriched in leukocyte transendothelial migration. In terms of GO enrichment, the marker genes of Mono/Macro, T/NK cells, B cells, myelocyte, and neutrophils were enriched in several immune-response-related terms and leukocyte cell–cell adhesion. Leukocyte transendothelial migration is one of the most key steps in the initiation of an inflammatory immune response, which involves the rapid and transient delivery of preformed soluble elements in the blood to the site of injury, followed by a longer period of leukocyte delivery (12). Because leukocytes cannot swim, they are locally recruited to the site of inflammation through a series of adhesion steps that allow them to attach to the vessel wall, move along the wall to the endothelial border, cross the endothelial and subendothelial basement membranes, and migrate through interstitial tissues (13, 14). A previous study has suggested that inflammation is associated with development from myelodysplastic syndrome to AML (15). It has been considered as a global pathogenic factor in AML, which may involve in various aspects of AML, such as myelosuppression, chemoresistance, and disease progression (16). Inflammation that plays a vital function in the shaping of bone marrow microenvironment is a fundamental constituent of leukemogenesis in AML (17). An inflammation-related gene signature represented by Lasry et al. holds promise for defining risk stratification of AML patients (18). Collectively, our findings suggest the important role of inflammation immune response in the pathogenesis of AML, and the leukocyte transendothelial migration and adhesion in the process of inflammation should be noticed.
ssGSEA scores calculated showed that the scores of all the identified cell clusters between AML patients and control individuals are significantly different, especially GMP, HSC/Prog, Mono/Macro, and myelocyte, which are obviously downregulated in AML patients. Thus, these four cell types were regarded as core cells for subsequent analysis, which contains 1,594 marker genes. Furthermore, we identified AML-associated genes (2,067 genes) and DEGs (1,010 genes) between AML patients and controls using GSE114868 dataset. The overlapping genes of nuclear marker genes, AML-associated genes, and DEGs between AML patients and controls were selected as candidates. The final variables that were used for prognostic model construction were screened in the training set using univariate Cox regression analysis and LASSO regression analysis, including CALR, KDM1A, SUCNR1, TMEM220, and ADM. CALR is a highly conserved chaperone protein that resides primarily in the endoplasmic reticulum and is associated with various biological processes, among them, tumor calcification (19), cell adhesion (20), and immune response (21). Numerous studies have demonstrated the value of CALR in cancer prognostic evaluation. A risk model reported by Chen et. al., which contains CALR, IFNB1, and IFNG, showed a powerful function in bladder urothelial carcinoma prognosis and immune landscape determination (22). Fucikova et al. described that CALR exposure promotes the initiation of antitumor immunity in patients with AML, and it is a reliable prognostic biomarker for AML patients (23). KDM1A is a type of histone lysine demethylase, which has already been found to be associated with a variety of biological processes, such as epithelial–mesenchymal transformation (24, 25) and inflammatory response (26). KDM1A dysfunction was linked to the progression of AML, and inhibitors of KDM1A showed promising therapeutic effect in AML patients (27, 28). SUCNR1 is found in the plasma membrane of multiple cells types, and its activation has been associated with energy metabolism (29) and anti-inflammatory responses (30). Studies of TMEM220 are relatively rare. Limited coverage revealed that TMEM220 is downregulated in hepatocellular carcinoma, and several prognostic signatures contrasted by markers including TMEM220 displayed excellent prognostic prediction effect for hepatocellular carcinoma (31–33). ADM belongs to the amylin/calcitonin gene-related peptide super-family, which has been involved in multiple physiological processes, containing cell migration (34), differentiation (35), and apoptosis (36), and angiogenesis (34). ADM can exert local and systemic anti-inflammatory actions through modulating immune system properties and cytokine secretion (37). As reported by Simonetti et al., the secretion of ADM contributed to the maintenance of an inflammatory phenotype in leukemic cell, therefore leading to relapse and drug resistance of AML patients (38). Moreover, we constructed a prognostic signature based on CALR, KDM1A, SUCNR1, TMEM220, and ADM, which demonstrated a remarkable prognostic value. Further GSEA analysis of risk-model-related genes revealed the significant differences in inflammatory response between high- and low-risk groups. Further correlation analysis revealed significant correlations between hub genes and IL6, IL10, and multiple immune cells. IL-6 has been considered as key pro-inflammatory cytokines impacting the function of hematopoietic cells and promoting inflammatory diseases. IL-6 plays a central role in AML progression by directly stimulating leukemogenic processes, reshaping the inflammatory tumor microenvironment, and orchestrating immunosuppressive mechanisms (39, 40). Its levels serve as a prognostic biomarker, while targeting the IL-6 signaling pathway offers novel therapeutic directions for improving AML treatment (41, 42). IL-10, a key immunomodulatory cytokine secreted by activated immune cells, functions as a regulatory checkpoint, exerting negative feedback regulation to maintain immunological homeostasis and suppress excessive inflammatory activation (43). IL-10 drives AML progression through dual mechanisms. On the one hand, IL-10 suppresses innate immune responses by inhibiting macrophages from releasing pro-inflammatory cytokines (e.g., TNF-α, IL-6) and reducing their antigen-presenting capacity (44). In the AML microenvironment, IL-10 increases the proportion of Breg cells, promotes the secretion of immunosuppressive factors (including IL-10 itself and TGF-β), and suppresses effector T-cell function, thereby facilitating tumor immune escape (45). On the other hand, elevated IL-10 levels in the bone marrow microenvironment of AML patients correlate with increased Treg cell infiltration. These Treg cells further sustain the stemness of leukemia stem cells (LSCs) through IL-10 secretion, driving disease progression and poor prognosis (46). IL-10 levels can serve as a prognostic biomarker and are emerging as a critical therapeutic target for novel immunotherapies, such as CAR-T and IDO1 inhibitors (45, 47). Collectively, the hub genes identified in this study may influence AML patient prognosis by modulating inflammatory responses through complex regulatory interactions with IL-6, IL-10, and immune cells.
In conclusion, our current results emphasized the important function of inflammation immune response in the pathogenesis of AML, and the leukocyte transendothelial migration and adhesion in the process of inflammation should be noticed. In addition, we constructed an inflammation-related risk model that can accurately distinguish survival outcomes in AML patients. However, we have only generalized the role of inflammation in the development of AML, and the specific molecular mechanisms need to be further investigated. Additionally, although the prognostic signature was validated using online dataset, further validation with a large, independent patient cohort is warranted to strengthen the reliability of the prognostic model. The development of novel prognostic signatures is critical for enhancing auxiliary diagnosis and optimized management in cancer patients (48–50). In summary, our current study not only complements the existing prognostic evaluation framework for AML but also extends its applicability.
Data availability statement
The raw data supporting the conclusions of this article will be made available by the authors, without undue reservation.
Ethics statement
This was approved by the Medical Ethics Committee of Yancheng No.1 People’s Hospital. The studies were conducted in accordance with the local legislation and institutional requirements. The participants provided their written informed consent to participate in this study.
Author contributions
YH: Data curation, Formal Analysis, Writing – original draft, Writing – review & editing. PY: Formal Analysis, Writing – original draft, Writing – review & editing. YW: Data curation, Formal Analysis, Writing – review & editing. LW: Data curation, Formal Analysis, Writing – review & editing. YQC: Data curation, Formal Analysis, Writing – review & editing. JL: Data curation, Formal Analysis, Writing – review & editing. KF: Conceptualization, Writing – review & editing. YXC: Conceptualization, Writing – review & editing. YM: Conceptualization, Writing – review & editing.
Funding
The author(s) declare that financial support was received for the research and/or publication of this article. This work was supported by the 2024 Open Research Initiative of Jiangsu Provincial Key Laboratory for Higher Education Institutions at Xuzhou Medical University (Grant No. XZSYSKF2024002), in conjunction with the Yancheng Municipal Health Commission’s Medical Research Funding Program (Project Code: YK2024093).
Acknowledgments
We thank all the patients and their families who accepted to participate in this research.
Conflict of interest
Authors PY and KF are employed by Wuhan Kindstar Medical Laboratory Co., Ltd.
The remaining authors declare that the research was conducted in the absence of any commercial or financial relationships that could be construed as a potential conflict of interest.
Generative AI statement
The author(s) declare that no Generative AI was used in the creation of this manuscript.
Publisher’s note
All claims expressed in this article are solely those of the authors and do not necessarily represent those of their affiliated organizations, or those of the publisher, the editors and the reviewers. Any product that may be evaluated in this article, or claim that may be made by its manufacturer, is not guaranteed or endorsed by the publisher.
References
1. Siegel RL, Giaquinto AN, and Jemal A. Cancer statistics, 2024. CA: A Cancer J Clinicians. (2024) 74:12–49. doi: 10.3322/caac.21820
2. Kantarjian HM, DiNardo CD, Kadia TM, Daver NG, Altman JK, Stein EM, et al. Acute myeloid leukemia management and research in 2025. CA Cancer J Clin. (2024) 75:46–67. doi: 10.3322/caac.21873
3. Shimony S, Stahl M, and Stone RM. Acute myeloid leukemia: 2023 update on diagnosis, risk-stratification, and management. Am J Hematol. (2023) 98:502–26. doi: 10.1002/ajh.26822
4. Li M, Ye J, Xia Y, Li M, Li G, Hu X, et al. METTL3 mediates chemoresistance by enhancing AML homing and engraftment via ITGA4. Leukemia. (2022) 36:2586–95. doi: 10.1038/s41375-022-01696-w
5. Bonev B, Castelo-Branco G, Chen F, Codeluppi S, Corces MR, Fan J, et al. Opportunities and challenges of single-cell and spatially resolved genomics methods for neuroscience discovery. Nat Neurosci. (2024) 27:2292–309. doi: 10.1038/s41593-024-01806-0
6. Xu X, Wen Q, Lan T, Zeng L, Zeng Y, Lin S, et al. Time-resolved single-cell transcriptomic sequencing. Chem Sci. (2024) 15:19225–46. doi: 10.1039/D4SC05700G
7. Kumar B, Singh A, Basar R, Uprety N, Li Y, Fan H, et al. BATF is a major driver of NK cell epigenetic reprogramming and dysfunction in AML. Sci Transl Med. (2024) 16:eadp0004. doi: 10.1126/scitranslmed.adp0004
8. Tian Y, Guo J, Mao L, Chen Z, Zhang X, Li Y, et al. Single-cell dissection reveals promotive role of ENO1 in leukemia stem cell self-renewal and chemoresistance in acute myeloid leukemia. Stem Cell Res Ther. (2024) 15:347. doi: 10.1186/s13287-024-03969-w
9. Wang H, Xiong A, Chen X, Guo J, Tang Z, Wu C, et al. CXCR1(+) neutrophil infiltration orchestrates response to third-generation EGFR-TKI in EGFR mutant non-small-cell lung cancer. Signal Transduct Target Ther. (2024) 9:342. doi: 10.1038/s41392-024-02045-2
10. Pan B, Yao P, Ma J, Lin X, Zhou L, Lin C, et al. Identification of key biomarkers related to fibrocartilage chondrocytes for osteoarthritis based on bulk, single-cell transcriptomic data. Front Immunol. (2024) 15:1482361. doi: 10.3389/fimmu.2024.1482361
11. Li K, Du Y, Cai Y, Liu W, Lv Y, Huang B, et al. Single-cell analysis reveals the chemotherapy-induced cellular reprogramming and novel therapeutic targets in relapsed/refractory acute myeloid leukemia. Leukemia. (2023) 37:308–25. doi: 10.1038/s41375-022-01789-6
12. Muller WA. Mechanisms of leukocyte transendothelial migration. Annu Rev Pathol. (2011) 6:323–44. doi: 10.1146/annurev-pathol-011110-130224
13. Muller WA. Leukocyte-endothelial-cell interactions in leukocyte transmigration and the inflammatory response. Trends Immunol. (2003) 24:327–34. doi: 10.1016/S1471-4906(03)00117-0
14. Ley K, Laudanna C, Cybulsky MI, and Nourshargh S. Getting to the site of inflammation: the leukocyte adhesion cascade updated. Nat Rev Immunol. (2007) 7:678–89. doi: 10.1038/nri2156
15. Barreyro L, Chlon TM, and Starczynowski DT. Chronic immune response dysregulation in MDS pathogenesis. Blood. (2018) 132:1553–60. doi: 10.1182/blood-2018-03-784116
16. Recher C. Clinical implications of inflammation in acute myeloid leukemia. Front Oncol. (2021) 11:623952. doi: 10.3389/fonc.2021.623952
17. Chen DW, Fan JM, Schrey JM, Mitchell DV, Jung SK, Hurwitz SN, et al. Inflammatory recruitment of healthy hematopoietic stem and progenitor cells in the acute myeloid leukemia niche. Leukemia. (2024) 38:741–50. doi: 10.1038/s41375-024-02136-7
18. Lasry A, Nadorp B, Fornerod M, Nicolet D, Wu H, Walker CJ, et al. An inflammatory state remodels the immune microenvironment and improves risk stratification in acute myeloid leukemia. Nat Cancer. (2023) 4:27–42. doi: 10.1038/s43018-023-00518-x
19. Bai S, Chen H, Fu S, Liu C, Gao X, Li S, et al. Bioinspired tumor calcification-guided early diagnosis and eradication of hepatocellular carcinoma. Adv Mater. (2024) 36:e2310818. doi: 10.1002/adma.202310818
20. Liu X, Xie P, Hao N, Zhang M, Liu Y, Liu P, et al. HIF-1-regulated expression of calreticulin promotes breast tumorigenesis and progression through Wnt/beta-catenin pathway activation. Proc Natl Acad Sci U S A. (2021) 118:e2109144118. doi: 10.1073/pnas.2109144118
21. Schcolnik-Cabrera A, Oldak B, Juarez M, Cruz-Rivera M, Flisser A, and Mendlovic F. Calreticulin in phagocytosis and cancer: opposite roles in immune response outcomes. Apoptosis. (2019) 24:245–55. doi: 10.1007/s10495-019-01532-0
22. Chen L, Lin J, Wen Y, Chen Y, and Chen CB. Development and validation of a model based on immunogenic cell death related genes to predict the prognosis and immune response to bladder urothelial carcinoma. Front Oncol. (2023) 13:1291720. doi: 10.3389/fonc.2023.1291720
23. Fucikova J, Truxova I, Hensler M, Becht E, Kasikova L, Moserova I, et al. Calreticulin exposure by Malignant blasts correlates with robust anticancer immunity and improved clinical outcome in AML patients. Blood. (2016) 128:3113–24. doi: 10.1182/blood-2016-08-731737
24. Lin T, Ponn A, Hu X, Law BK, and Lu J. Requirement of the histone demethylase LSD1 in Snai1-mediated transcriptional repression during epithelial-mesenchymal transition. Oncogene. (2010) 29:4896–904. doi: 10.1038/onc.2010.234
25. Ferrari-Amorotti G, Fragliasso V, Esteki R, Prudente Z, Soliera AR, Cattelani S, et al. Inhibiting interactions of lysine demethylase LSD1 with snail/slug blocks cancer cell invasion. Cancer Res. (2013) 73:235–45. doi: 10.1158/0008-5472.CAN-12-1739
26. Liu Y, Chen Y, Batzorig U, Li J, Fernandez-Mendez C, Mahapatra S, et al. The transcription regulators ZNF750 and LSD1/KDM1A dampen inflammation on the skin's surface by silencing pattern recognition receptors. Immunity. (2024) 57:2296–2309 e5. doi: 10.1016/j.immuni.2024.09.002
27. Fang Y, Liao G, and Yu B. LSD1/KDM1A inhibitors in clinical trials: advances and prospects. J Hematol Oncol. (2019) 12:129. doi: 10.1186/s13045-019-0811-9
28. Maes T, Mascaro C, Tirapu I, Estiarte A, Ciceri F, Lunardi S, et al. ORY-1001, a potent and selective covalent KDM1A inhibitor, for the treatment of acute leukemia. Cancer Cell. (2018) 33:495–511 e12. doi: 10.1016/j.ccell.2018.02.002
29. Villanueva-Carmona T, Cedo L, Madeira A, Ceperuelo-Mallafre V, Rodriguez-Pena MM, Nunez-Roa C, et al. SUCNR1 signaling in adipocytes controls energy metabolism by modulating circadian clock and leptin expression. Cell Metab. (2023) 35:601–619 e10. doi: 10.1016/j.cmet.2023.03.004
30. Keiran N, Ceperuelo-Mallafre V, Calvo E, Hernandez-Alvarez MI, Ejarque M, Nunez-Roa C, et al. SUCNR1 controls an anti-inflammatory program in macrophages to regulate the metabolic response to obesity. Nat Immunol. (2019) 20:581–92. doi: 10.1038/s41590-019-0372-7
31. Li T, Guan L, Tang G, He B, Huang L, Wang J, et al. Downregulation of TMEM220 promotes tumor progression in Hepatocellular Carcinoma. Cancer Gene Ther. (2022) 29:835–44. doi: 10.1038/s41417-021-00370-0
32. Zhu L, Sun H, Tian G, Wang J, Zhou Q, Liu P, et al. Development and validation of a risk prediction model and nomogram for colon adenocarcinoma based on methylation-driven genes. Aging (Albany NY). (2021) 13:16600–19. doi: 10.18632/aging.203179
33. Rong H, Li Y, Hu S, Gao L, Yi T, Xie Y, et al. Prognostic signatures and potential pathogenesis of eRNAs-related genes in colon adenocarcinoma. Mol Carcinog. (2022) 61:59–72. doi: 10.1002/mc.23359
34. Nikitenko LL, MacKenzie IZ, Rees MC, and Bicknell R. Adrenomedullin is an autocrine regulator of endothelial growth in human endometrium. Mol Hum Reprod. (2000) 6:811–9. doi: 10.1093/molehr/6.9.811
35. Hinson JP, Kapas S, and Smith DM. Adrenomedullin, a multifunctional regulatory peptide. Endocr Rev. (2000) 21:138–67. doi: 10.1210/edrv.21.2.0396
36. Uzan B, Villemin A, Garel JM, and Cressent M. Adrenomedullin is anti-apoptotic in osteoblasts through CGRP1 receptors and MEK-ERK pathway. J Cell Physiol. (2008) 215:122–8. doi: 10.1002/jcp.v215:1
37. Wu R, Zhou M, and Wang P. Adrenomedullin and adrenomedullin binding protein-1 downregulate TNF-alpha in macrophage cell line and rat Kupffer cells. Regul Pept. (2003) 112:19–26. doi: 10.1016/S0167-0115(03)00018-1
38. Simonetti G, Angeli D, Petracci E, Fonzi E, Vedovato S, Sperotto A, et al. Adrenomedullin expression characterizes leukemia stem cells and associates with an inflammatory signature in acute myeloid leukemia. Front Oncol. (2021) 11:684396. doi: 10.3389/fonc.2021.684396
39. de Jong MME, Chen L, Raaijmakers M, and Cupedo T. Bone marrow inflammation in haematological Malignancies. Nat Rev Immunol. (2024) 24:543–58. doi: 10.1038/s41577-024-01003-x
40. Mei Y, Ren K, Liu Y, Ma A, Xia Z, Han X, et al. Bone marrow-confined IL-6 signaling mediates the progression of myelodysplastic syndromes to acute myeloid leukemia. J Clin Invest. (2022) 132:e152673. doi: 10.1172/JCI152673
41. Zhang C, Li W, Wu F, Lu Z, Zeng P, Luo Z, et al. High expression of Malic enzyme 1 predicts adverse prognosis in patients with cytogenetically normal acute myeloid leukaemia and promotes leukaemogenesis through the IL-6/JAK2/STAT3 pathways. Ther Adv Hematol. (2024) 15:20406207241301948. doi: 10.1177/20406207241301948
42. Stevens AM, Miller JM, Munoz JO, Gaikwad AS, and Redell MS. Interleukin-6 levels predict event-free survival in pediatric AML and suggest a mechanism of chemotherapy resistance. Blood Adv. (2017) 1:1387–97. doi: 10.1182/bloodadvances.2017007856
43. Moore KW, de Waal Malefyt R, Coffman RL, and O'Garra A. Interleukin-10 and the interleukin-10 receptor. Annu Rev Immunol. (2001) 19:683–765. doi: 10.1146/annurev.immunol.19.1.683
44. Ip WKE, Hoshi N, Shouval DS, Snapper S, and Medzhitov R. Anti-inflammatory effect of IL-10 mediated by metabolic reprogramming of macrophages. Science. (2017) 356:513–9. doi: 10.1126/science.aal3535
45. Yao Y, Liu YY, Li JF, Chen YS, Shi L, Shen Y, et al. Indoleamine 2,3-dioxygenase 1 alters the proportions of B cell subpopulations in the microenvironment of acute myeloid leukemia. Mol Biomed. (2025) 6:23. doi: 10.1186/s43556-025-00262-x
46. Xu Y, Mou J, Wang Y, Zhou W, Rao Q, Xing H, et al. Regulatory T cells promote the stemness of leukemia stem cells through IL10 cytokine-related signaling pathway. Leukemia. (2022) 36:403–15. doi: 10.1038/s41375-021-01375-2
47. Chen N, Xu Y, Mou J, Rao Q, Xing H, Tian Z, et al. Targeting of IL-10R on acute myeloid leukemia blasts with chimeric antigen receptor-expressing T cells. Blood Cancer J. (2021) 11:144. doi: 10.1038/s41408-021-00536-x
48. Chen S, Huang M, Zhang L, Huang Q, Wang Y, and Liang Y. Inflammatory response signature score model for predicting immunotherapy response and pan-cancer prognosis. Comput Struct Biotechnol J. (2024) 23:369–83. doi: 10.1016/j.csbj.2023.12.001
49. Mallardo D, Fordellone M, White A, Vowinckel J, Bailey M, Sparano F, et al. A combined proteomic and transcriptomic signature is predictive of response to anti-PD-1 treatment: A retrospective study in metastatic melanoma patients. Int J Mol Sci. (2024) 25:9345. doi: 10.3390/ijms25179345
Keywords: acute myeloid leukemia, ScRNA-seq, bulk RNA-seq, prognostic signature, inflammation
Citation: Huang Y, Yi P, Wang Y, Wang L, Cao Y, Lu J, Fang K, Cheng Y and Miao Y (2025) Construction of a novel inflammatory-related prognostic signature of acute myelocytic leukemia based on conjoint analysis of single-cell and bulk RNA sequencing. Front. Immunol. 16:1565954. doi: 10.3389/fimmu.2025.1565954
Received: 13 February 2025; Accepted: 05 May 2025;
Published: 10 June 2025.
Edited by:
Sonali P. Barwe, Alfred I. duPont Hospital for Children, United StatesReviewed by:
Chunjie Yu, University of Florida, United StatesDomenico Mallardo, G. Pascale National Cancer Institute Foundation (IRCCS), Italy
Copyright © 2025 Huang, Yi, Wang, Wang, Cao, Lu, Fang, Cheng and Miao. This is an open-access article distributed under the terms of the Creative Commons Attribution License (CC BY). The use, distribution or reproduction in other forums is permitted, provided the original author(s) and the copyright owner(s) are credited and that the original publication in this journal is cited, in accordance with accepted academic practice. No use, distribution or reproduction is permitted which does not comply with these terms.
*Correspondence: Kun Fang, ZmFuZ2t1bkBraW5kc3Rhci5jb20uY24=; Yuexin Cheng, eWN5eWN5eDY4QDE2My5jb20=; Yuqing Miao, bWlhb21pYW9teXFAMTYzLmNvbQ==
†These authors have contributed equally to this work