 Chiara Bungaro
 Michele Guida
 Benedetta Apollonio
- Rare Tumors and Melanoma Unit, IRCCS Istituto Tumori “Giovanni Paolo II”, Bari, Italy
Over the past years, cancer research has transitioned from a ‘cancer cell-centered’ focus to a more integrative view of tumors as dynamic ecosystems. This paradigm shift emphasizes the tumor microenvironment (TME) as a complex network of interacting cellular and acellular components, where tumor cells orchestrate a supportive environment that facilitates progression, metastasis, and immune evasion. Understanding the spatial organization of these components within the TME is crucial, as the positioning and interactions between cancerous and non-cancerous cells significantly influence tumor behavior and therapy response. Spatial proteomics has emerged as a powerful tool for TME analysis, enabling the detection and quantification of proteins within intact tissue architecture at subcellular resolution. This approach provides insights into cellular interactions, signaling pathways, and functional states, facilitating the discovery of novel biomarkers and therapeutic targets linked to specific tissue regions and cellular contexts. Translating spatial proteomics into clinical practice requires overcoming challenges related to technology refinement, standardization of workflows, and adaptation to routine pathology settings. Melanoma is an aggressive, highly immunogenic malignancy with variable response rates to existing immunotherapies. Given that over half of patients treated with immune checkpoint inhibitors (ICIs) fail to respond or experience disease progression, the identification of novel biomarkers and therapeutic targets to enhance current therapies is urgently required. Spatial imaging technologies are increasingly being utilized to dissect the complex interplay between stroma, melanoma, and immune cell types within the TME to address this need. This review examines key spatial proteomics methods, their applications in melanoma biology, and associated image analysis pipelines. We highlight the current limitations, and future directions, emphasizing the potential for clinical translation to guide personalized treatment strategies, inform prognosis, and predict therapeutic response.
Introduction
Over the last few decades, cancer research has undergone a significant paradigm shift: from a ‘cancer-centered’ view, primarily focused on the genomic aberrations of neoplastic cells, to a more comprehensive understanding of tumors as complex ecosystems. In this new framework, tumors are seen as dynamic entities where both cellular and acellular components form an intricate network of co-evolving interactions—the tumor microenvironment (TME) (1). This holistic perspective recognizes that tumor cells act not in isolation but as central orchestrators of a tumor-supportive environment, actively recruiting and reprogramming non-immune and immune cells, remodeling the vasculature, and altering the extracellular matrix to support progression and metastasis.
Mapping the spatial location of the different cellular components is crucial as the TME is a highly organized, structured environment where the positioning of different cell types is essential for their function. For this reason, the spatial relationships between tumor cells, immune cells, stromal cells, and blood vessels are fundamental to tumor progression, immune evasion, and therapy resistance.
While tissue studies remain crucial for cancer diagnosis, patient stratification, and treatment recommendations, the techniques routinely used for these investigations (e.i. immunohistochemistry) are limited to the low number of markers that can be simultaneously visualized. In the past few years, more studies have been focused on the development of new multiplexed technologies and analysis methods aimed at preserving tissue architecture by spatially resolving the complexity of the TME, mapping different cell types, and understanding their reciprocal interactions and their function.
Among them, spatial proteomics, which allows the detection and quantification of proteins within the context of tissue architecture, has been recognized as one of the most promising methods for TME analysis (2). By mapping protein expression patterns at subcellular resolution, spatial proteomics provides insights into cellular interactions, signaling pathways, and functional states of cells within the TME. This new set of information could be used for the discovery of novel biomarkers and therapeutic targets that are tightly linked to specific tissue regions and cellular contexts. It also opens the door to identifying novel therapeutic combinations, as spatial proteomics can reveal how different treatment modalities may alter the spatial dynamics of the TME. However, while spatial proteomics offers immense potential for understanding cancer biology, its translation into clinical practice remains a challenge. It is critical to develop methods and platforms that can be easily adapted to routine pathology labs and clinical settings. This requires not only refining technologies for better sensitivity and resolution but also developing standardized workflows and protocols that can be widely adopted in clinical practice. The goal is to provide pathologists and clinicians with actionable approaches that can guide personalized treatment strategies, inform prognosis, and predict response to therapies.
Over the past few years, spatial proteomics has significantly advanced our understanding of the melanoma TME. Although melanoma is highly immunogenic and several immunotherapy-based treatments are available, a significant proportion of patients, particularly those with late-stage disease, still fail to achieve durable responses or experience disease progression (3–6). This clinical challenge underscores the urgent need to identify novel biomarkers for predicting treatment outcomes and to discover new therapeutic targets that can improve the effectiveness of current immunotherapies. To address this critical knowledge gap, spatial imaging technologies have shown critical potential.
In this review, we examine the key methods used in spatial proteomics, their applications in melanoma biology, and the image processing and analysis pipelines associated with these technologies. We also address the current limitations and outline future directions for advancing spatial proteomics.
Spatial proteomics methods
While the core principle of antibody-staining remains consistent across most spatial proteomic approaches, they differ in detection methods. Different moieties attached to the (primary/secondary) antibodies used for protein target detection act as signal amplifiers or identifiers, and are based on enzymes, fluorescence, or mass spectrometry (Figure 1, Table 1).
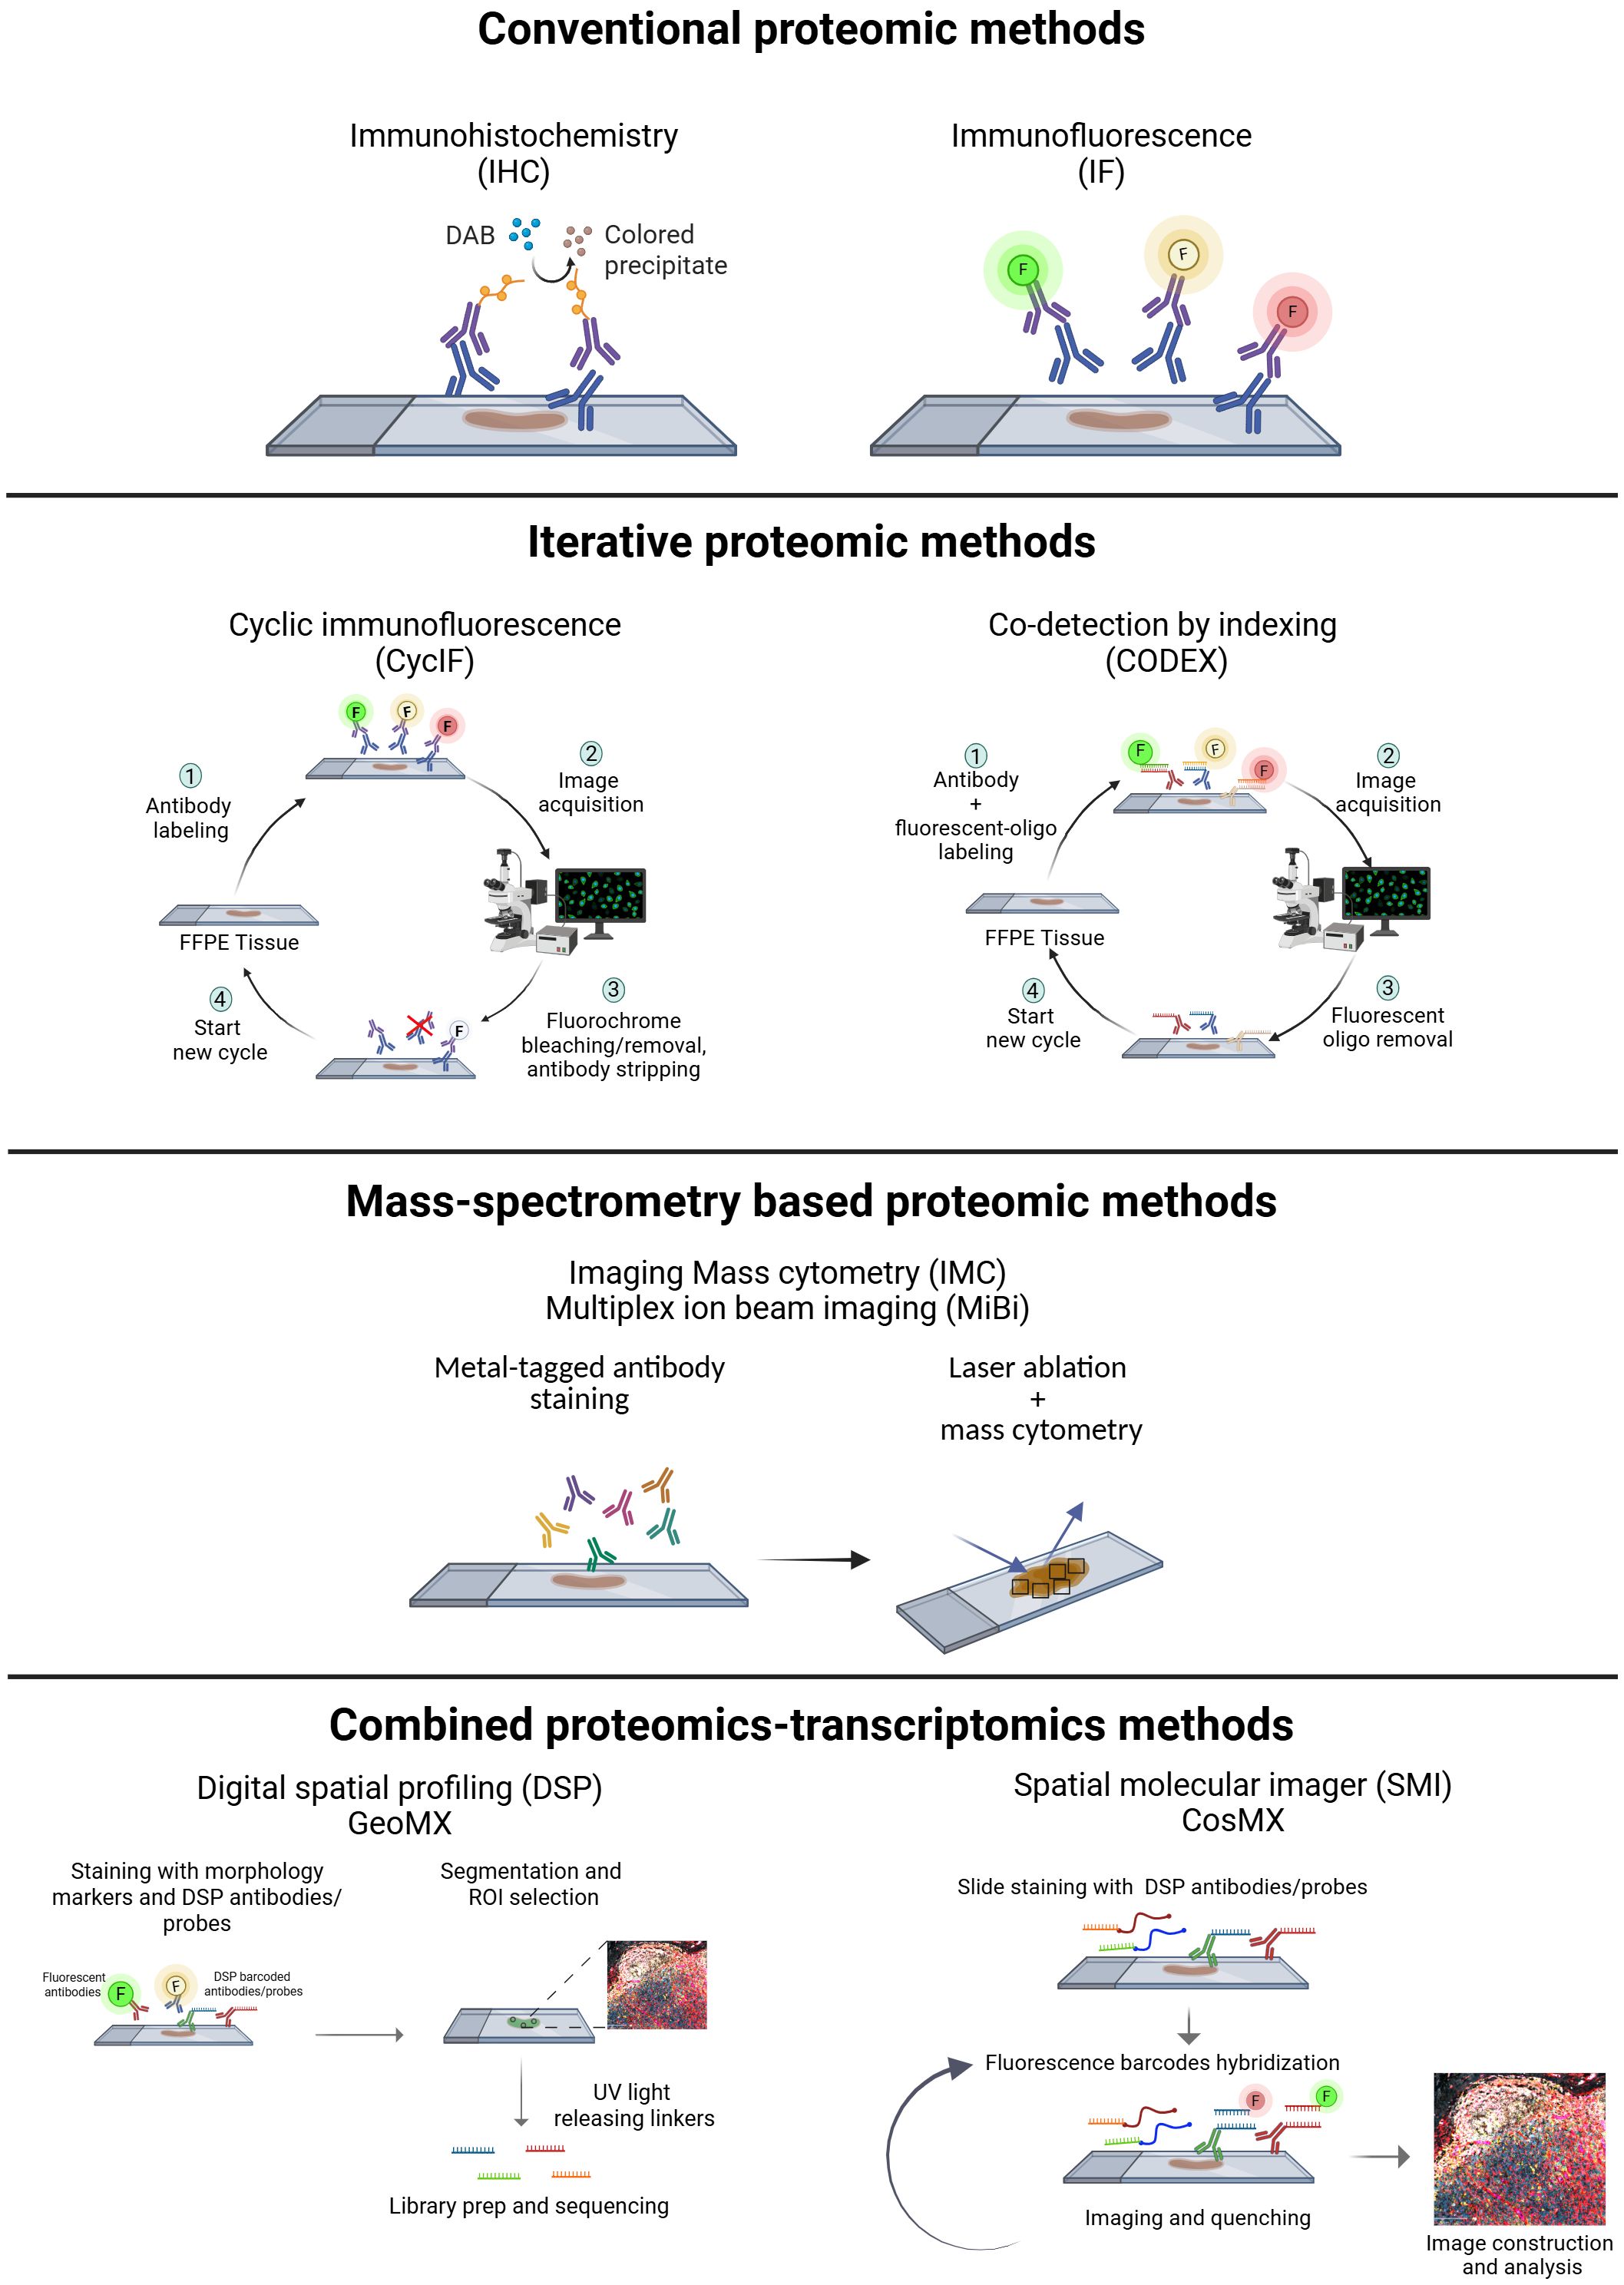
Figure 1. Experimental workflow of the available spatial proteomics technologies: conventional [IHC (immunohistochemistry), IF (immunofluorescence)], iterative [CyCIF/HIFI (cyclic immunofluorescence, hyperplexed immunofluorescence imaging), CODEX (Co-detection by indexing)], mass spectrometry based [IMC (imaging mass cytometry), MiBi (multiplex ion beam imaging)], and methods that combine proteomics and transcriptomics [DSP (digital spatial profiling-GeoMX) and SMI (spatial molecular imager-CosMX)]. Created in https://BioRender.com.
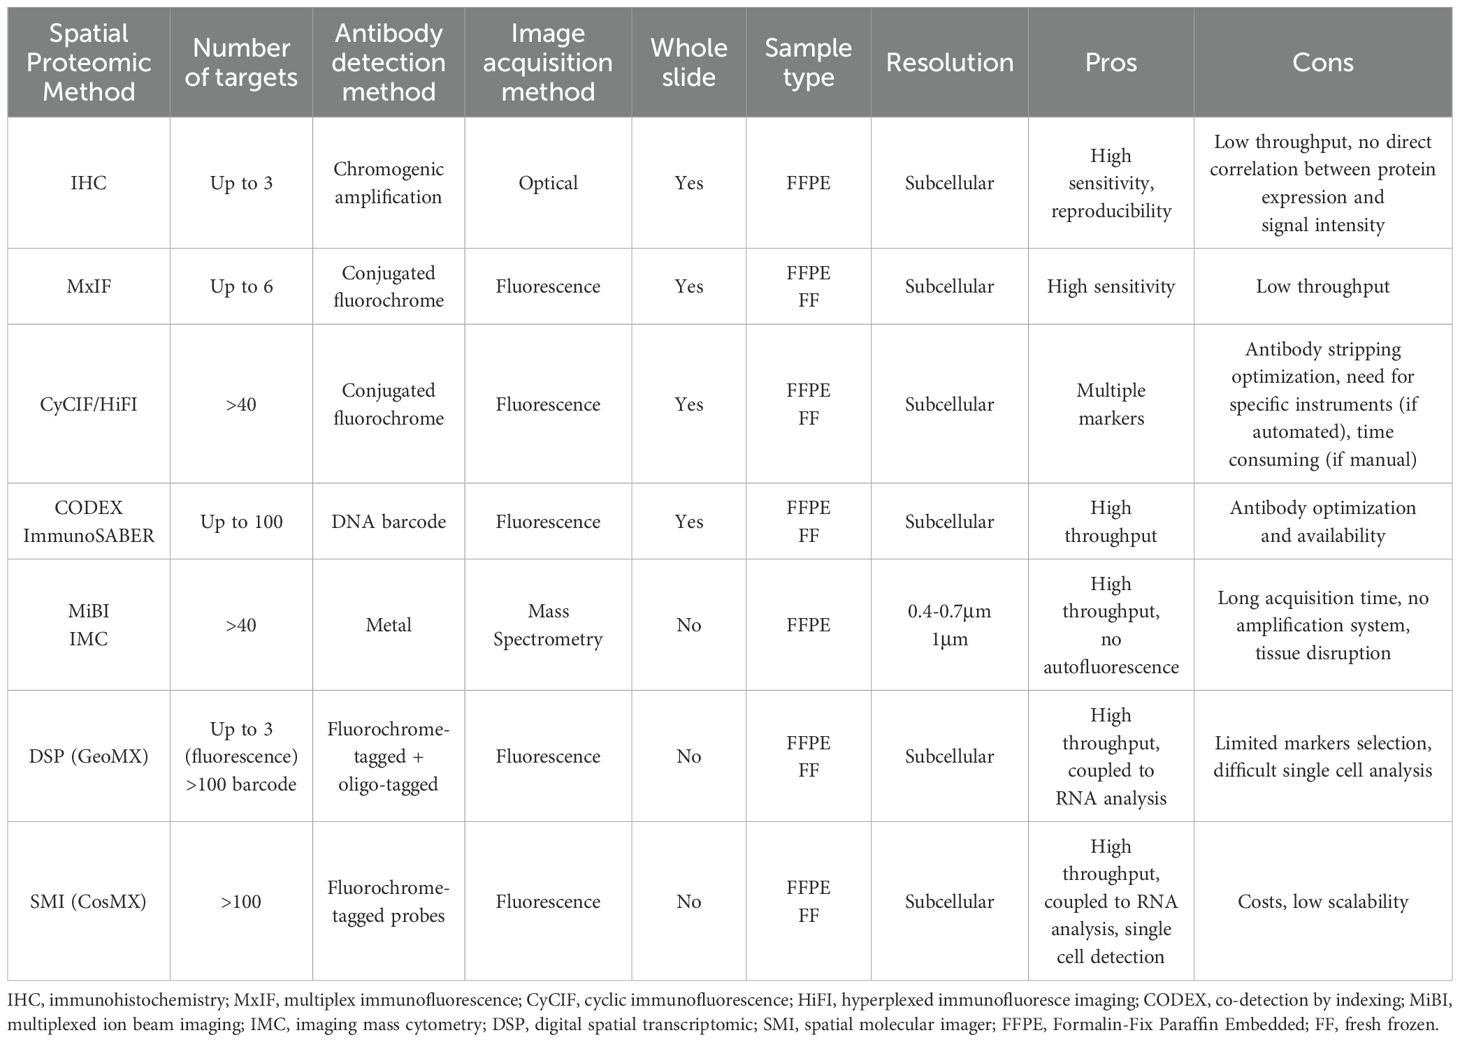
Table 1. Summary of methods applied in spatial proteomics.
Conventional immunohistochemistry (IHC) is widely used in routine pathology for tumor diagnosis and classification. It is based on the simultaneous use of up to two antibodies directed against specific markers, and an enzyme-based detection through horseradish peroxidase or alkaline phosphatase (7). This approach has high sensitivity and is well-established, but it is limited in the number of proteins simultaneously detected. To overcome this limitation multiplex IHC (mIHC) protocols, based on multiplexing sequential staining strategies, have been optimized. mIHC can be based on two main approaches: (i) same-slide iterative labeling, digital scanning, and antibody stripping; (ii) sequential tissue slices staining with one/two antibodies simultaneously (8), digital scanning, and images overlapping (9).
These techniques expand the number of detected markers but, as chromogenic amplification provides a non-linear correlation with protein expression levels, they lack a direct correlation between protein expression level and signal intensity. Additionally, the use of sequential tissue slice staining introduces challenges in maintaining cell identity and consistency across slices.
Multiplex immunofluorescence (MxIF) allows the simultaneous detection of different protein targets at the cellular level. Fluorescence spectral overlap limits detection to a maximum of 4 or 5 markers, or up to 6 if using maximum laser number coupled with deconvolution algorithms.
The number of detectable markers can be increased using Cyclic Immunofluorescence (CyCIF), which is based on the same antibody staining cycle principle employed in mIHC (10). Signal removal between staining cycles can be achieved by either stripping the antibody or its label, or through fluorophore photobleaching, such as Iterative Bleaching Extends Multiplexity (IBEX) (11). While these methods enable the detection of a greater number of markers compared to conventional immunofluorescence (IF), they require careful optimization of the antibody staining sequence. Additionally, they often depend on specialized automated systems that minimize handling time and improve efficiency, although at high costs.
Recent studies have introduced a new pipeline for cyCIF, called hyperplexed immunofluorescence imaging (HIFI), which employs a manual, cost-effective, and instrument-free approach (12, 13). This method enables high-throughput data acquisition using standard benchtop reagents and conventional slide-scanning microscopes, facilitating the democratization of high-throughput spatial proteomics. However, despite their accessibility and whole-slide imaging capabilities, manual HIFI methods are time-consuming compared to platform-dependent proteomic techniques. They require continuous operator presence, optimization of antibody panels (to avoid antigen damage during elution), and protocol durations that vary with the number of staining rounds. Additionally, the analysis pipelines for these methods are not yet fully standardized.
Co-detection by indexing (CODEX) is another cyclic imaging technique that involves staining with antibodies conjugated to oligonucleotide tags with 5’ overhangs of varying lengths. This is followed by multiple imaging cycles, enabling the detection of up to 100 markers (14). The signal from DNA-labeled antibodies can be further amplified using sequential hybridization reactions, such as Immuno-SABER. While these methods enable maximal multiplexing and offer a powerful tool for spatial proteomics, they come with certain limitations. One of the challenges is the need for additional antibody validation after the conjugation step to ensure that the conjugated oligonucleotide tags do not interfere with antibody binding. Moreover, the absence of an amplification system for the antibody tags themselves means that lowly or diffusely expressed markers are difficult to detect, as the signal from these markers may not be strong enough to distinguish from background noise.
Currently, CODEX-based imaging has been used in numerous studies to achieve high-plex imaging of whole tissue samples. However, the costs associated with this technology present a challenge to its widespread application. Other multiplex approaches are based on the use of metal-tagged antibodies, which provide unmatched protein identification capabilities and can quantify more than 40 proteins simultaneously. They are based on Time-of-flight (TOF) mass spectrometry and differ in how metals are extracted from the tissue: using either secondary ionization [MiBi-Multiplexed ion beam imaging (15)] or laser ablation [IMC-imaging mass cytometry (16)].
While these approaches do not require multiple tissue slices or cycles of antibody staining/stripping, they do not have an amplification system and require long time for image acquisition. Moreover, secondary ionization and laser ablation cause tissue destruction, and samples cannot be used for downstream applications (e.g. digital spatial profiling).
Other methods combine the simultaneous detection of spatial proteome and transcriptome to achieve a more detailed tissue resolution. The Digital Spatial Profiler (DSP) GeoMX employs fluorochrome-tagged antibodies (morphology markers) for cell identification, alongside DSP antibody tagged with unique barcoded photocleavable oligonucleotide linkers. Fluorescence-based imaging is used for the segmentation of the cell types of interest with morphology markers. Tissues are then exposed to UV light which releases the photocleavable linkers. Subsequent library construction and sequencing allow for digital readout and spatial mapping of the protein targets. Notably, DSP also includes RNA probes, offering in situ transcriptomic mapping (17). Compared to other spatial proteomics approaches, DSP increases the number and variety of spatially resolved targets, however it does not achieve single-cell resolution.
In contrast, the Spatial molecular imager (SMI) CosMx utilizes a high-plex in situ fluorescence-based imaging approach for the concurrent detection of both RNA and protein. Tissues are incubated with oligonucleotide-tagged antibodies (for proteins) and probes (for RNA). Fluorescent reporters with unique barcodes are sequentially hybridized and imaged, with the signal quenched after each round. This cyclic process builds a unique fluorescent signature for each protein and RNA target, allowing for its identification and quantification at a precise location (18).
Despite its high throughput and resolution capabilities, CosMX experiments can be considerably expensive, potentially restricting its accessibility for some research groups or larger-scale studies.
Application of spatial proteomics to melanoma tumor microenvironment
Characterizing the melanoma TME, its cellular composition, and the spatial relationships between its cellular components is increasingly vital, especially in the era of immunotherapy. Understanding cell phenotypes, their precise location, and interactions within the TME can provide critical insights into how tumors evade immune surveillance and respond to treatment (Table 2).
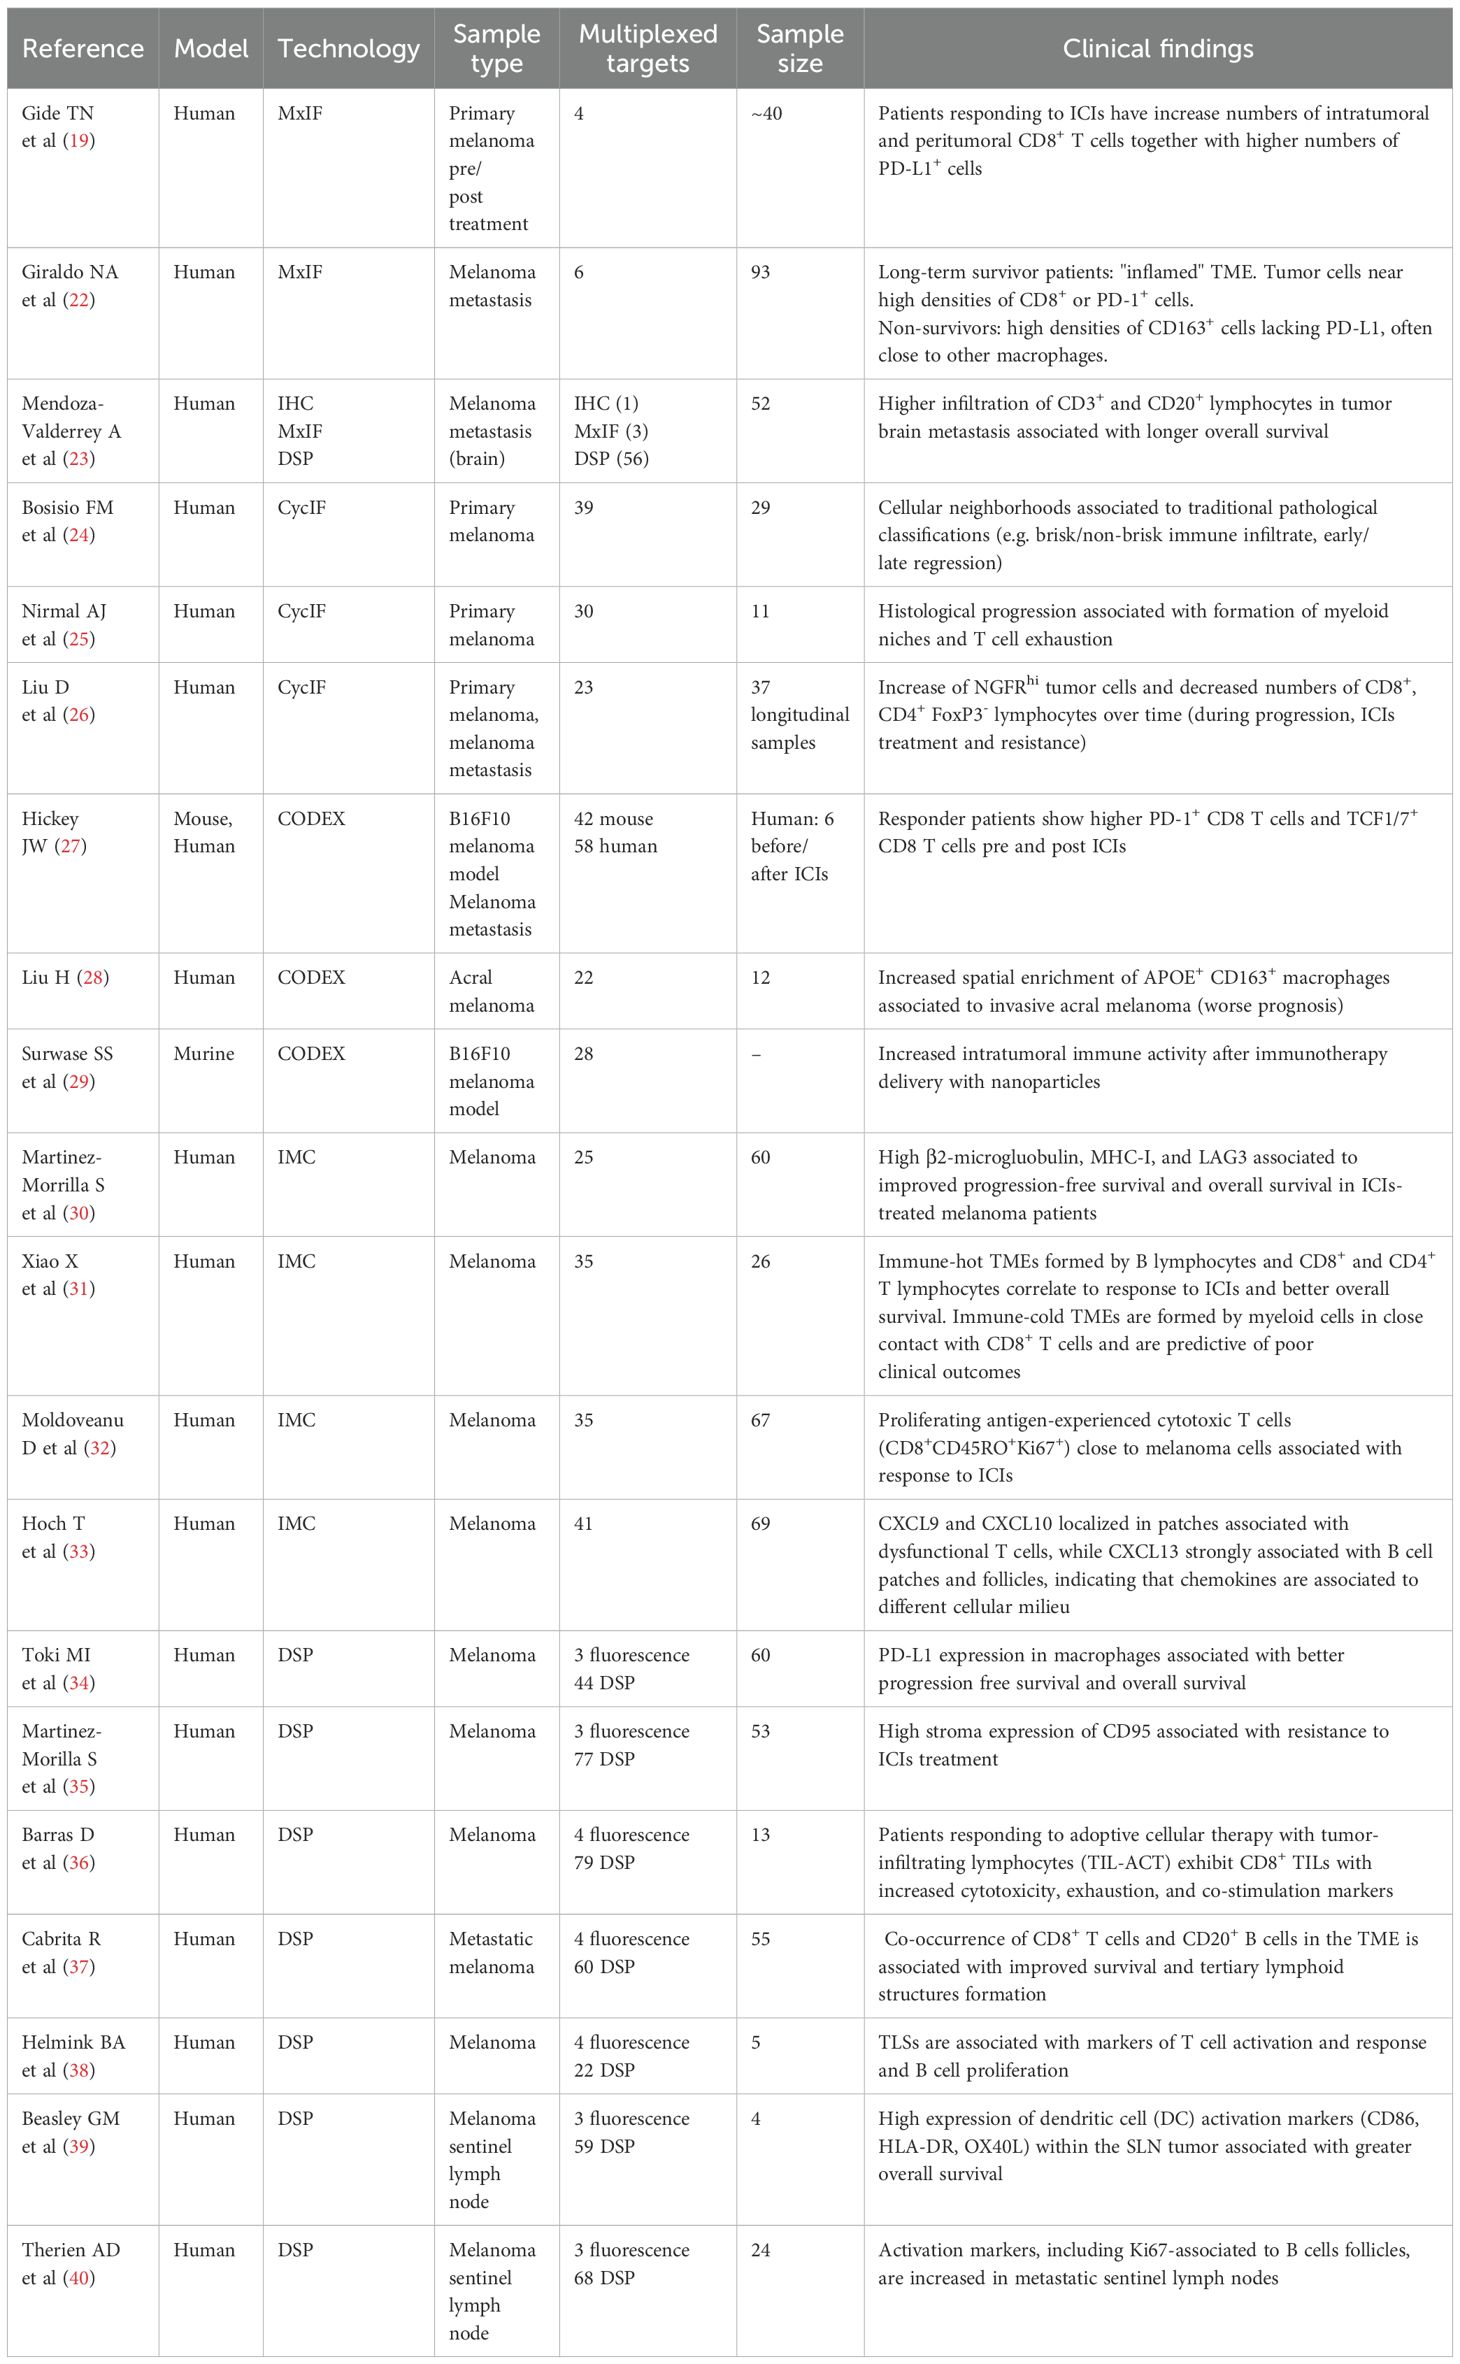
Table 2. Application of spatial proteomics for the study of melanoma TME.
Gide et al. (19) used MxIF to quantify densities and spatial locations of T cells and PD-L1 in the TME of melanoma patients treated with immunotherapy (both single agent and combination ICIs). They used the Opal technology coupled to the Vectra 3.0 slide scanner to obtain a 5 colors whole slide image of FFPE primary tumors and to identify area of interest (tumoral and peritumoral) that were then imaged at higher resolution (20x), and analyzed using the scanner proprietary software. They found that patients responding to ICIs had increased numbers of intratumoral and peritumoral CD8+ T cells together with higher numbers of PD-L1+ cells, both before therapy and in tumor biopsies collected early after therapy, thus confirming data obtained with IHC (20, 21). They also observed an increase of CD8+ expressing granzyme B, EOMES (Eomesodermin), and TBET (T-box expressed in T cells) in responder patients at early stages of treatment, indicating that effector T cells are needed for an optimal anti-tumor immune response.
However, there were some limitations in the methodology that may have restricted the depth of analysis. The study did not use multiplex immunofluorescence to differentiate between cells expressing multiple markers. Instead, authors quantified cells expressing a single marker, potentially overlooking important cell subpopulations, such as exhausted T cells which could have been characterized by co-expression of inhibitory receptors (e.g., PD-1, TIM-3). Therefore, the lack of multi-marker analysis limited the potential for identifying more immune cell phenotypes. Furthermore, the study did not incorporate spatial analysis of the immune microenvironment.
A 6plex MxIF was used to define the immune landscape of melanoma metastasis (22). Interestingly, immune cell neighborhoods were defined using an unsupervised flow cytometry-like workflow which identified spatial immune signatures associated with prognosis.
In brain melanoma metastasis, MxIF was used to confirm digital spatial transcriptomic data and to map the neural-immune architecture of the TME. The data confirmed that patients with tumor brain metastasis infiltrated with higher number of CD3+ and CD20+ lymphocytes (presumably corresponding to tertiary lymphoid structures) experienced longer overall survival, suggesting that more organized immune infiltrates can foster active anti-tumor immune responses or restrict tumor expansion (23).
These studies only partially leveraged the potential of MxIF, limiting the number of markers analyzed and thus hindering the exploration of cellular heterogeneity within the TME.
CycIF with the MILAN (multiple iterative labelling by antibody neodeposition) method (which uses a combination of a detergent and a reducing agent to remove antibodies) has been used to dissect TME cell phenotypes in a small cohort of primary cutaneous melanoma (24). Authors identified 47 functional cell populations (corresponding to tumor, epithelial, and immune cells) and different cellular neighborhoods characterized by interactions between activated and/or exhausted immune cells. These interactions were linked to traditional pathological classifications (e.g. brisk/non-brisk immune infiltrate, early/late regression), offering functional insights into classical pathological features commonly used in melanoma staging.
A recent study employing 20–30 plex CyCIF provided a more detailed characterization of primary melanoma, examining its cellular composition and structural organization (25). Through spatial analysis, the authors identified the presence of recurrent cellular neighborhoods (RCNs), spatial clusters of different cell types that change during disease progression. Specifically, the study uncovered how initial anti-tumor immune responses were progressively hindered as myeloid niches formed, leading to T cell exhaustion and eventually immune suppression. As melanoma acquires invasive properties, these changes in cellular microenvironments facilitate tumor progression. Furthermore, by integrating spatial proteomics with spatial transcriptomics, the researchers were able to identify distinct molecular programs tied to disease progression, thereby advancing our understanding of melanoma biology. This integrative approach also uncovered potential therapeutic targets that could be leveraged for future immunotherapy strategies.
CyCIF has also been used to assess melanoma evolution in longitudinal samples collected across 9 years from a single patient initially responding to ICIs and subsequently experiencing late recurrence and death (26). These studies allowed the spatial characterization of tumor-immune interactions occurring during response vs late ICIs resistance and at different metastatic sites, allowing a deeper understanding of the evolution of resistance and tumor microenvironmental heterogeneity, offering a rationale to improve combination therapies and to identify new targets.
Additional studies have utilized CODEX to investigate TME evolution during adoptive T cell therapy in mouse models of melanoma. A 42-plex antibody panel targeting immune, tumor, and stromal cells, along with functional markers (primarily checkpoints), was employed to examine immune cell infiltration and tumor inflammation dynamics in a syngeneic B16F10 model of antigen-specific T cell therapy (27). The authors reconstructed the timeline of the anti-tumor immune response, visualizing different cell neighborhoods at various stages of inflammation and tumor attack. Their findings revealed that therapeutic T cells not only target tumor cells but can also induce a shift in tumor cell phenotypes, converting them into an inflamed, anti-proliferative state. Moreover, T cells were shown to mediate the formation of both productive and unproductive tumor-immune neighborhoods, which affect therapy responses. A similar evolution of cellular neighborhoods was observed in human melanoma samples stained with a 58-plex panel, comparing responder vs non-responder patients to ICIs. Results show that greater abundance of PD-1+ CD8 T cells and TCF1/7+ CD8 T cells pre and post ICIs was associated with response to treatment. Responders also showed spatial reorganization of the TME after ICIs treatment, with the formation of tumor-immune neighborhoods highly enriched in Immune Infiltrate cellular neighbourhoods (27). These data underscore the importance of considering T cells influence on the structural reprogramming of the TME, as this process can significantly impact the magnitude and effectiveness of anti-tumor immune responses and tumor eradication. Therefore, these findings suggest that immunotherapy strategies should incorporate factors capable of restructuring the TME to enhance therapeutic outcomes.
More recently, CODEX was employed in a multi-omics study to define and functionally assess the transition from in situ to invasive acral melanoma. By integrating genomic sequencing with various transcriptomic approaches and a 22-plex CODEX panel, the authors identified molecular tumor subtypes characterized by increased epithelial-mesenchymal transition and spatial enrichment of APOE+ CD163+ macrophages as markers of invasive acral melanoma, with a worse prognosis (28). A recent study has also shown the applicability of the CODEX technology to study TME changes in animal models treated with novel combination therapies (29).
In addition to CODEX, IMC has also been used to stratify patient responses to immunotherapy. In a study using a 26-plex panel on 60 melanoma samples from ICI-treated patients, the application of the AQUA software, which calculates the cumulative signal intensity per unit compartment area, identified beta-2-microglobulin expression as a predictor of ICI response (30). In addition, Xiao and colleagues used a 35-plex and identified 6 different patient archetypes (spatial cellular neighborhoods) predictive of anti-PD-1 responses. In line with other spatial proteomics studies (25, 27), they observed that immune-hot TMEs are formed by CD8+ T cells surrounded by CD4+ and B lymphocytes, and correlate to response to ICIs and better overall survival. On the other hand, immune-cold archetypes are characterized by myeloid cells in close contact with CD8+ T cells and are predictive of poor clinical outcomes (31). Another IMC study quantifying the expression of 35 protein markers in 67 pre-treatment melanomas, demonstrated that the abundance of proliferating antigen-experienced cytotoxic T cells (CD8+CD45RO+Ki67+) and their proximity to melanoma cells were associated with positive response to ICIs (32).
Other IMC-based studies have employed modified protocols to simultaneously detect protein markers and mRNA targets for chemokines, enabling a more comprehensive analysis of T lymphocytes activation and/or dysfunction and their patterns of interaction in the TME (33).
Digital Spatial Profiling (DSP) GeoMX has been applied in melanoma biology to discover predictive markers for immunotherapy response in metastatic patients. Two independent studies identified PD-L1 expression in macrophages, but not tumor cells, as the strongest predictor of response to ICIs, while CD95 expression in immune cells was associated with immunotherapy resistance (34, 35). In a phase I study of metastatic melanoma patients treated with adoptive cellular therapy with tumor-infiltrating lymphocytes (TIL-ACT), DSP analysis revealed distinct immune profiles in responders. At baseline, responder patients exhibited CD8+ TILs with increased cytotoxicity, exhaustion, and costimulation markers, while myeloid cells showed elevated type I interferon signaling (36). DSP has also been used to identify and characterize tertiary lymphoid structures (TLS) within the melanoma TME. Two separate studies revealed differential expression of various activation and response markers in T lymphocytes residing within TLS compared to those outside, which exhibited a dysfunctional phenotype (37, 38).
DSP studies in melanoma have also been extended to the characterization of sentinel lymph nodes (SLNs). Beasley et al. demonstrated an association between dendritic cell (DC) activation markers (CD86, HLA-DR, OX40L) within the SLN tumor and overall survival (OS), with lowest expression in patients with OS < 1 year and highest in those with OS > 8 years (39). Another study utilizing a 68-antibody DSP panel to analyze B cell follicles in melanoma SLNs revealed significantly higher expression of multiple activation markers, including Ki-67, within B cell regions of metastatic SLNs compared to non-metastatic SLNs. These findings suggest that B cell follicles within SLNs could be involved in orchestrating effective adaptive immune responses in melanoma even at early stages of lymph node involvement, characterized by low tumor cell infiltration (40).
In summary, spatial proteomics has significantly advanced our understanding of the melanoma TME, shedding light on its heterogeneity in relation to prognosis, its evolution during immunotherapy response or resistance, and its distinct organization across different metastatic sites. However, additional work is required to translate these insights into clinical applications and diagnostic tools.
Image analysis workflow for spatial proteomics
Extracting meaningful biological insights from the complex amount of data obtained with the different spatial proteomics methods requires a well-defined analytical workflow which involves four key pillars: (i) image pre-processing to correct variation in image quality, (ii) cell segmentation to identify individual cells, (iii) cell phenotyping to classify cells and reveal their functional states, and (iv) spatial neighborhood analysis to delve into the intricate communication networks between cell populations. To streamline this complex workflow and empower researchers, a series of software tools have been developed (Figure 2, Table 3).
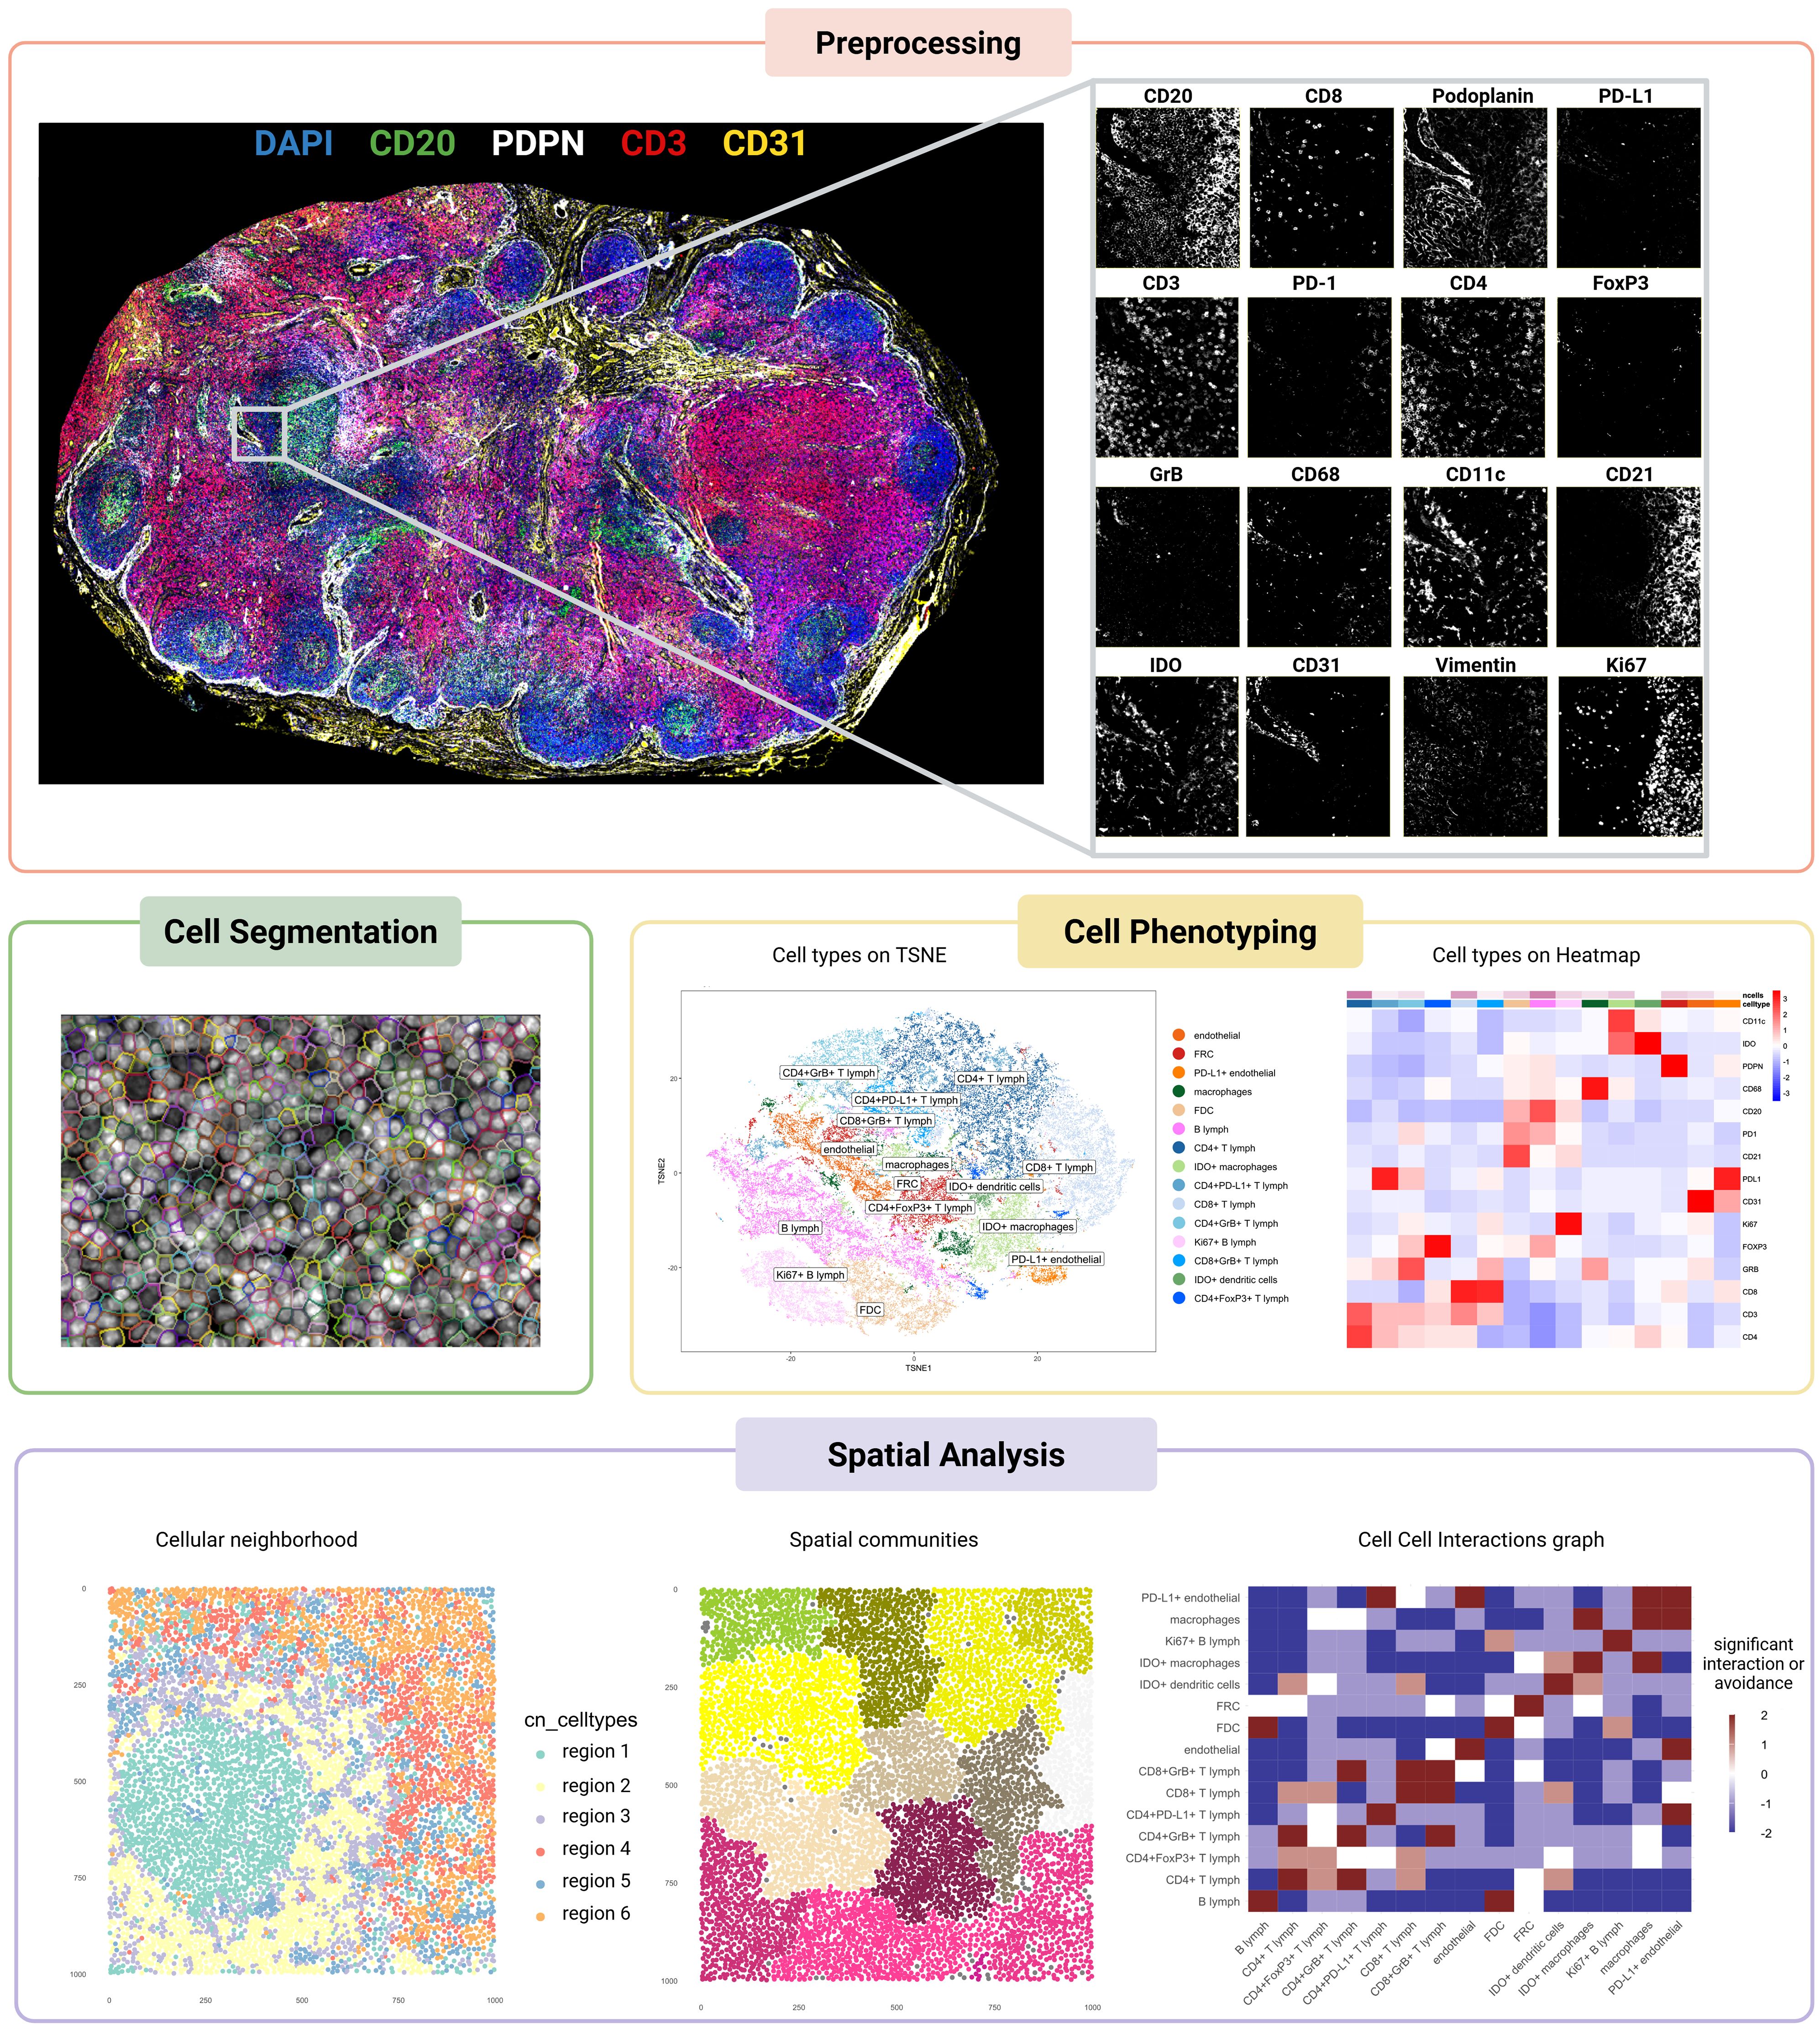
Figure 2. Workflow of spatial proteomics analysis applied to a multiplexed image of a metastasis-free melanoma sentinel lymph node. The pipeline includes key analytical steps, each illustrated with representative outputs. Preprocessing: image registration using the VALIS algorithm ensures alignment across imaging channels. Cell segmentation: nuclei and cytoplasmic boundaries are segmented using Cellpose. Cell phenotyping: t-SNE plot and heatmap display the results of phenotypic clustering performed with PhenoGraph. Spatial analysis: cellular neighborhood analysis, spatial community detection, and cell–cell interaction inference were carried out using the imcRtools package. Created in https://BioRender.com.
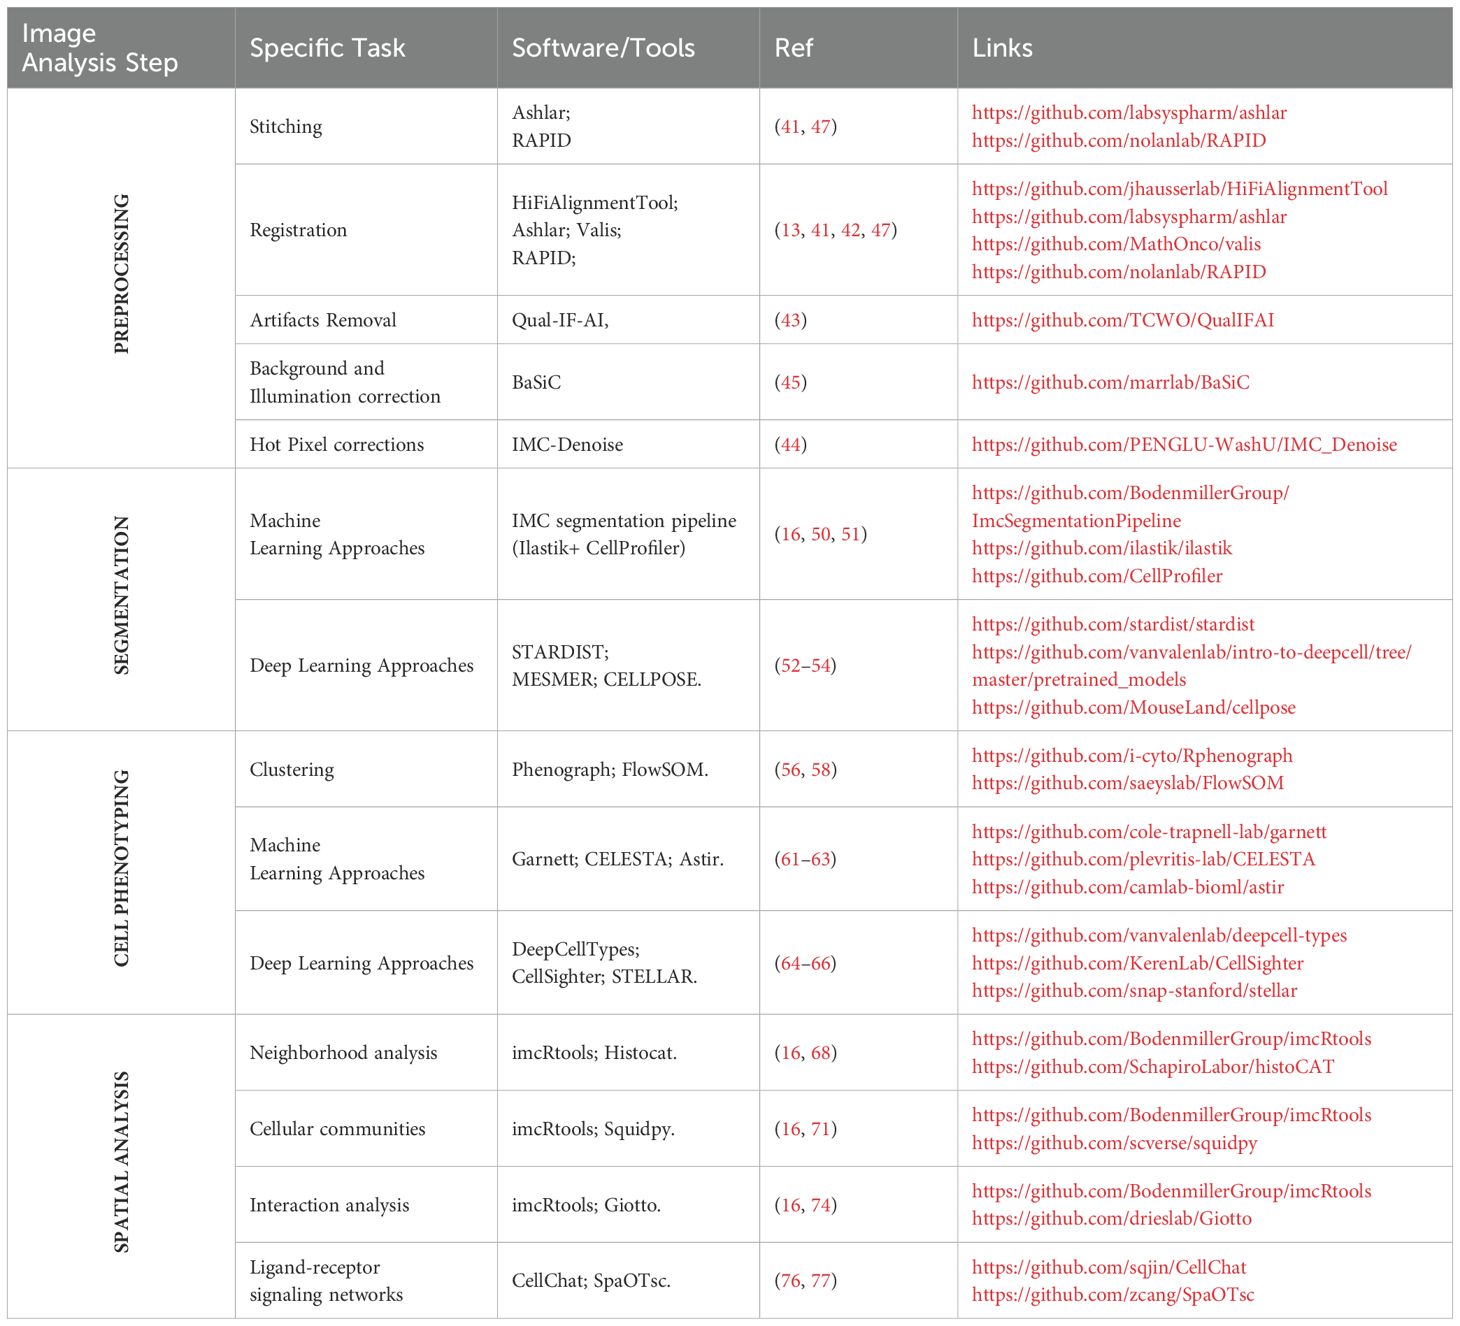
Table 3. Tools and software commonly used in spatial proteomics analysis workflow.
Preprocessing
Multiplex imaging techniques produce rich datasets that require rigorous preprocessing to ensure data quality, consistency, and accurate downstream analysis. This step involves addressing artifacts, aligning multi-tile or multi-round images, and optimizing overall image quality to overcome the technical challenges inherent in spatial proteomic methods. For tiled imaging techniques, stitching and registration play a crucial role in ensuring accurate and comprehensive datasets. Stitching assembles individual image tiles into a cohesive dataset, while registration aligns images across different cycles for the same tissue slide and between sequential slides to a common spatial framework. Tools like ASHLAR (Alignment by Simultaneous Harmonization of Layer/Adjacency Registration) (41) excel in both tasks by leveraging iterative optimization algorithms to achieve subpixel accuracy. Designed specifically for cyclic imaging workflows, ASHLAR addresses common issues like misalignment between imaging cycles or shifts in tissue position, ensuring a seamless composite that faithfully represents the original tissue. Similarly, VALIS (Virtual Alignment of Pathology Image Series) (42) offers a flexible and scalable approach to aligning multi-gigapixel whole-slide images and provides a modality-agnostic solution, supporting both immunofluorescence and brightfield datasets. Its unique groupwise registration method is particularly beneficial for datasets with high variability in staining or tissue distortion, as VALIS can integrate both rigid and non-rigid transformations to accommodate stretching, folding, or other deformations.
Beyond alignment, preprocessing tackles artifacts that compromise image quality. These include folding, air bubbles, dust, lint, out-of-focus areas, and uneven illumination, all of which can distort quantitative results. Automated tools such as QUAL-IF-AI (Quality Control of ImmunoFluorescence Images using Artificial Intelligence) (43) leverage deep learning to detect and correct these issues efficiently, offering a reproducible alternative to labor-intensive manual corrections. For IMC datasets, hot pixels—high intensity signals uncorrelated to any biological structures — are removed using intensity thresholding or spatial filters (median, Gaussian filter) or some specific pipeline such as IMC-Denoise (44).
In immunofluorescence workflows, background subtraction and illumination correction are essential to minimize signal interference and standardize intensity across the image. Techniques such as BaSiC algorithm (45) provide robust solutions for correcting uneven illumination patterns, improving the consistency of fluorescence signals across tiles and within imaging cycles. Autofluorescence, a persistent challenge in older or archival tissues, can be mitigated using spectral unmixing or model-based approaches.
Ultimately, preprocessing pipelines like MCMICRO (Multiple-choice microscopy pipeline) (46) or RAPID (a Real-time, GPU-Accelerated Parallelized Image processing software for large-scale multiplexed fluorescence microscopy Data) (47) are indispensable for high-throughput multiplex imaging. They streamline workflows by automating quality control, stitching, and registration, while facilitating reproducibility and scalability. For instance, the MCMICRO pipeline has been successfully applied to investigate the spatial landscape of progression and immunoediting in primary melanoma (25). By addressing both general and modality-specific challenges, preprocessing enables accurate feature extraction and sets the stage for robust spatial and molecular analyses.
Segmentation
Following image processing and alignment, cell segmentation emerges as a crucial step in analyzing cellular features. During segmentation, individual cell boundaries are computationally identified, generating binary masks that represent single cells within the image. The accuracy of cell segmentation significantly impacts the quantification of multicellular properties, such as protein expression and cell morphology. An ideal cell segmentation algorithm should effectively segment cells of different sizes and shapes within various tissue types, regardless of cell density. Additionally, it should accurately delineate both the membrane and internal compartments like the nucleus and cytoplasm. Techniques like watershed segmentation (48), are effective for isolating individual cells, however they show some limitations in accurately segmenting overlapping cells or cells with complex morphologies, which can lead to cell’s over-segmentation (49). Therefore, more advanced segmentation algorithms, such as machine learning and deep learning models, are often necessary to achieve accurate cell segmentation in complex tissues.
Machine learning-based approaches, such as random forest classifiers, have gained traction for segmentation tasks. A common workflow, IMCSegmentation Pipeline (16), involves tools like Ilastik (50), which enables pixel-based classification to distinguish between nuclei, membranes, and background regions, generating probability maps. These maps can then be processed in CellProfiler (51) to produce segmentation masks. However, these methods require extensive manual effort and parameter optimization, and their accuracy relies heavily on the quality and volume of the training dataset.
In contrast, deep learning-based models represent a transformative advance, offering superior accuracy and robustness with minimal user intervention. Models like StarDist (52), Mesmer (53), and Cellpose (54) have redefined cell segmentation, particularly in challenging tissue contexts. StarDist leverages a star-convex polygonal representation (55) to segment individual cells, particularly excelling in identifying nuclei of various shapes and sizes. Its unique approach models each nucleus as a star-shaped object, which enables robust segmentation even in dense tissues or images with overlapping cells. StarDist’s adaptability to both 2D and 3D data makes it highly versatile for a range of imaging modalities. Mesmer incorporates pre-trained convolutional neural networks (CNNs) optimized for multiplexed tissue images. It seamlessly segments both nuclei and cytoplasmic compartments, ensuring robust performance across diverse tissue types without the need for manual annotations. Mesmer’s pre-training on extensive datasets allows it to generalize effectively, reducing the need for user intervention and overcoming limitations posed by traditional algorithms. Similarly, Cellpose introduces a generalist deep learning framework capable of segmenting cells with varied shapes, sizes, and densities. Unlike many task-specific algorithms, Cellpose employs a flow-based representation to predict directional flows of pixels toward cell centers, enabling accurate boundary delineation. Its ability to handle highly heterogeneous datasets, including images from fluorescent, brightfield, and phase contrast microscopy, makes it particularly powerful for real-world applications where cell morphology is highly variable.
The adoption of these deep learning models has significantly improved segmentation accuracy in challenging tissue microenvironments, surpassing traditional and machine learning-based methods. By automating feature extraction and learning complex relationships in image data, these models not only streamline the segmentation workflow but also enhance the precision of downstream analyses, such as cell phenotyping and spatial analysis. These advances are crucial for extracting biologically relevant insights from high-dimensional imaging datasets in biomedical research.
Cell phenotyping
Advancements in computational methods have significantly refined cell phenotyping. Clustering techniques, for instance, have become essential tools for grouping cells based on molecular profiles. One prominent method, PhenoGraph (56), constructs a weighted graph of cellular neighborhoods by identifying k-nearest neighbors in expression space and quantifying overlap using the Jaccard similarity coefficient (57). The graph is then partitioned into clusters, enabling the detection of subtle subpopulations in tissues. This approach has been widely applied to imaging datasets such as IMC, offering a robust framework for clustering. Another impactful technique, FlowSOM (58), utilizes self-organizing maps (SOMs) (59) for dimensionality reduction and clustering. It incorporates meta-clustering via minimal spanning trees, achieving results that are not only highly accurate but also orders of magnitude faster than traditional algorithms like SPADE (Sequential PAttern Discovery using Equivalence classes) (60). These methods provide scalable alternatives to manual gating, especially for high-dimensional dataset. Notably, several studies on melanoma (24, 33) have leveraged PhenoGraph, either alone or in combination with FlowSOM, for cell type identification, highlighting the power of these algorithms in unraveling tumor heterogeneity.
Machine learning further enhances phenotyping by incorporating prior biological knowledge and leveraging spatial context. Garnett (61), for example, is an interpretable framework that enables the rapid annotation of cells across tissues and species, even supporting hierarchical classification of subtypes. Garnett does not require prior clustering, making it adaptable to various datasets. CELESTA (62) expands on this approach by integrating spatial information into the classification process. It assigns cell types to “anchor cells” based on marker profiles and refines the phenotyping of ambiguous “non-anchor cells” using spatial relationships with neighboring cells. By employing probabilistic models and spatial scoring functions, CELESTA excels in classifying cells with uncertain identities. Astir (63), instead, takes a complementary approach by using deep recognition neural networks to assign probabilistic cell type identities from predefined marker sets. It is especially effective in scaling to massive datasets, delivering results with remarkable speed and precision.
Deep learning methods have revolutionized phenotyping by exploiting the detailed spatial and molecular features of multiplexed imaging data. For example, DeepCellTypes (64) combines visual encoders, language encoders, and channel-wise transformers to generalize across diverse datasets, seamlessly adapting to different imaging modalities and marker panels. CellSighter (65), another deep-learning-based pipeline, employs convolutional neural networks to classify cells probabilistically across imaging platforms, achieving inter-observer-level concordance in accuracy. Going further, STELLAR (SpaTial cELl LeARning) (66) utilizes geometric deep learning to analyze spatially resolved single-cell datasets. It integrates spatial and molecular features through graph convolutional neural networks, identifying known cell types from annotated reference datasets and discovering novel phenotypes in unannotated datasets. By leveraging spatial proximity and molecular expression, STELLAR provides a powerful tool for cell-type discovery and tissue structure analysis.
Collectively, these advanced methods have propelled cell phenotyping to new levels of accuracy and efficiency. They enable researchers to unravel the complexity of tissue organization and cellular interactions, seamlessly integrating phenotyping with spatial analysis to uncover deeper biological insights.
Spatial analysis
Spatial analysis plays a pivotal role in uncovering the intricate organization of tissues and the dynamics of cellular interactions in multiplex imaging datasets. Building upon the foundational steps of preprocessing, segmentation, and cell phenotyping, it provides profound insights into tissue architecture and intercellular communication. Techniques such as neighborhood analysis, cellular community detection, and interaction modeling are particularly valuable in this context.
Neighborhood analysis focuses on understanding how different cell types are spatially distributed and interact within the tissue microenvironment. By evaluating spatial proximity, this approach can reveal critical insights into phenomena like immune infiltrates in tumors or the relationships between stromal and epithelial cells (67). Tools like HistoCAT (Histology Topography Cytometry Analysis Toolbox) (68) provide an accessible interface for exploring these spatial relationships in IMC data, allowing researchers to visualize cell phenotypes and compute interaction maps. The practical feasibility of HistoCAT has been demonstrated in clinical research: for instance, it was used by Xiao et al. (31) to identify spatially defined tumor-immune microenvironments associated with response to anti-PD-1 therapy in melanoma patients, and to classify distinct TME archetypes predictive of treatment outcome. Similarly, Martinez-Morilla et al. (30) employed IMC for biomarker discovery in metastatic melanoma, complementing spatial data analysis with quantitative methods to identify predictive markers such as beta2-microglobulin (B2M), supporting the potential of spatial proteomics for clinical stratification. Furthermore, Cytomapper (69), an R/Bioconductor package, offers powerful visualization capabilities for highly multiplexed imaging data, enabling researchers to generate informative spatial maps and explore cellular neighborhoods in detail, complementing the analytical strengths of HistoCAT. Meanwhile, R-based tools such as imcRtools (16) offer deeper statistical capabilities for calculating interaction probabilities and visualizing spatial patterns. This framework can be extended to analyze more general spatial patterns using packages like Spatstat (70) for advanced statistical assessments of spatial clustering and randomness.
Detecting cellular communities adds another layer of complexity by identifying clusters of cells that form functional units, such as immune niches or tumor microenvironments. Leveraging the same robust framework provided by imcRtools, researchers can cluster and characterize cellular communities in IMC data, integrating spatial metrics with phenotypic profiles. Additionally, software like Squidpy (71), which utilizes spatial neighborhood graphs, enables classification of cells into communities while incorporating multi-omic data such as gene or protein expression. These analyses can highlight patterns like immune deserts or coordinated interactions between stromal and immune cells, with Squidpy’s visualization tools offering an intuitive way to explore these relationships. The feasibility of Squidpy-based pipelines in clinical research is illustrated by Coullomb et al. (72), who developed MOSNA, a spatial omics analysis framework compatible with Squidpy, to uncover spatial features predictive of immunotherapy response and survival across cancer cohorts. By integrating spatial proteomics data with clinical metadata, their study demonstrates how cell interaction patterns and tissue architecture can inform patient stratification and treatment outcomes.
Interaction analysis delves deeper into the mechanisms of cell-cell communication by quantifying and modeling direct or indirect interactions. This is crucial for understanding how cells influence each other’s functions within their spatial context. imcRtools facilitates the computation of interaction frequencies and enrichment scores to identify preferential or avoided interactions between cell types (73). Advanced tools like Giotto (74) complement these efforts by detecting spatial dependencies that extend beyond mere proximity, helping to elucidate the spatial organization of functional phenotypes.
An important resource for the scientific community is Aquila (75), a spatial omics database and analysis platform that aims to centralize data, analysis tools, and visualizations, facilitating sharing and discovery in this rapidly growing field. This database could be invaluable for melanoma researchers seeking publicly available spatial proteomics datasets and tools for comparative analyses.
As spatial analysis techniques continue to evolve, integrative approaches are emerging that bridge spatial organization with molecular communication. Tools such as CellChat (76) and SpaOTsc (Spatial Optimal Transport for single-cell transcriptomics data) (77) model ligand-receptor signaling networks, offering a functional perspective on cell-cell interactions (78) These advancements not only enhance our understanding of tissue architecture but also open new avenues for exploring pathological processes.
Looking ahead, the field is poised for innovations that will improve scalability and interoperability across platforms, enabling researchers to tackle increasingly large and complex datasets. By synthesizing spatial metrics with molecular data, future studies promise to unveil deeper insights into the interplay between spatial organization and tissue functionality.
Data integration for spatial analysis
Integration of spatial proteomics with other tissue imaging approaches
While single imaging modalities can yield valuable information, integrating data across multiple platforms enables a more holistic view of the tissue microenvironment. This approach introduces challenges such as spatial misalignment (79) due to differences in platform resolution, data normalization, and the choice of integration methodologies.
Among integrative approaches, combining IF with hematoxylin and eosin (H&E) staining represents a straightforward but effective strategy (80). While H&E provides fundamental morphological information such as cell shapes, sizes, and tissue organization, IF enables visualization of multiple fluorescent markers within individual cells, offering molecular and structural insights. Tools like the Orion (81) or HIPI (H&E Image Interpretation and Protein Expression Inference) platform (82) take this integration further by seamlessly combining multiplex fluorescence with histological data, facilitating a comprehensive understanding of both cellular and tissue-level features.
The integration of IF with IMC (83, 84) exemplifies a more advanced approach, leveraging the strengths of both modalities while mitigating their individual limitations. By integrating IF and IMC, researchers can align high-resolution imaging capabilities with comprehensive molecular profiling, creating a synergistic workflow. This integration addresses the limitations of each technique: IF compensates for IMC lower resolution, while IMC extends IF multiplexing capacity. Computational advances, including multimodal image co-registration and machine learning, now enable pixel-level alignment of IF and IMC datasets, linking cellular phenotypes with molecular signatures in unprecedented details.
These integrative strategies have been transformative in practical applications. In tumor microenvironment studies, IF provides precise mapping of immune-tumor boundaries and structural features like vascular networks, while IMC captures phenotypic diversity and functional pathways in immune subsets and stromal compartments. This dual-layer analysis not only enhances our understanding of spatially resolved phenotypes but also identifies potential therapeutic targets by linking molecular mechanisms to tissue architecture.
Despite their transformative potential, integrating multiplex platforms introduces challenges, including data complexity, the need for standardized workflows, and alignment of modalities with varying spatial resolutions. However, ongoing advancements in computational tools and reproducibility standards are addressing these hurdles, ensuring that integrative approaches are both scalable and reproducible. As a result, the integration of multiplex imaging technologies is becoming a cornerstone of spatial biology, unlocking unprecedented insights into tissue architecture, cellular interactions, and functional diversity.
Integration of spatial proteomics with other multi-omic approaches
Multi-omic data integration leverages computational advancements to analyze individual biomolecules within single cells. Each omics technique, such as RNA-seq, DNA methylation, and metabolite profiling, provides deeper insights into cellular interactions within their environment. However, each omics approach focuses on different aspects of cellular identity, with distinct strengths and weaknesses. Multi-omics integration offers a powerful method for robust and sensitive cell type/state identification, enhancing our understanding of cellular differentiation, gene regulatory networks, cell-cell interactions, microenvironmental organization, cellular lineages, and clonal dynamics. Meaningful integration of high-dimensional data, however, requires the development of computational and statistical models that account for the technical and biological complexities of these technologies (85). Argelaguet et al. (86), recently categorized data integration strategies into three main categories based on the anchors used to link different data modalities. Horizontal integration relies on common data features measured across different datasets, such as integrating across batches or technologies measuring the same analyte. Vertical integration involves parallel measurements of non-overlapping data features within the same cells, while diagonal integration is used when neither cells nor common features are available to serve as anchors. Although multimodal integration is advancing biomedical research, its clinical application is still in the early stages. Challenges include the high costs of multi-omics technologies, the need for specialized computational tools, and the requirement for rigorous clinical validation, which can be time-consuming and expensive. Despite these obstacles, multimodal integration holds great promise for enhancing our understanding of complex diseases and improving patient care in the future (87).
Spatial proteomics: limitations and future outlook
Spatial proteomics has significantly advanced our understanding of melanoma TME by providing detailed, spatially resolved maps of the complex interactions between tumor cells, immune cells, and stromal components. These approaches have illuminated how cell-to-cell interactions influence key aspects of cancer biology, including disease progression, metastatization, and therapeutic response.
In melanoma, spatial proteomics has refined our understanding of the relationship between ICIs responses and the conventional pathology assessments of PD-1/PD-L1 expression, as well as the prognostic significance of “brisk” versus “non-brisk” immune infiltration. By identifying spatial patterns within the TME and characterizing specific cellular functional states, these techniques have elucidated the TME evolution during disease progression and identified elements associated with increased invasiveness and response to immunotherapies. Furthermore, mapping the spatial context of tumor-infiltrating immune cells, their interactions with tumor cells, and the expression of key immune checkpoint markers has advanced the concept of precision oncology.
As spatial proteomics continues to evolve, it is gradually emerging as new tool to be integrated into clinical practice, holding transformative potential for pathology and its application in cancer diagnosis, prognostication, and treatment.
Studies in melanoma have demonstrated the potential of spatial proteomics to inform clinical decision-making across various aspects of melanoma management, including: identifying prognostic biomarkers of survival (22, 23, 28, 31, 34, 37, 39); predicting response to immunotherapy (19, 27, 30, 32, 35, 36), characterizing patterns of disease progression (24, 25, 28); and uncovering novel mechanisms to optimize future immunotherapies (29, 33, 38).
Despite the recent advances, spatial proteomics has several limitations, and further improvements are still needed (88).
All the multiplex approaches developed so far offer cellular maps of the TME, however, they often overlook key factors such as the extracellular matrix (ECM) and soluble molecules (e.g. cytokines, chemokines, and metabolites) that directly influence the formation of specific cellular neighborhoods within the TME. New technologies, such as Deep Visual Proteomics (DVP), are addressing these limitations by combining the strengths of digital pathology with high-sensitivity mass spectrometry (MS). DVP enables the selective capture of cells for in-depth analysis, facilitating a more comprehensive comparison of relevant cellular states at higher throughput. Unlike traditional methods, DVP is not limited by antibody availability, allowing for the quantification of up to 10,000 proteins. Additionally, super-resolution protein imaging in DVP allows for detailed examination of protein localization at the subcellular level, providing insights into how proteins function in both health and disease. In melanoma, the application of DVP to classify cell states based on proteomic profiles has uncovered spatial proteome changes that occur during melanoma progression (89). This capability could uncover new therapeutic targets, advancing drug discovery and treatment strategies (90).
Tissues are inherently heterogeneous, and most of the spatial proteomic approaches have largely relied on the analysis of 2D specimens from single tissue slices. To better capture the complexity and diversity of tissues, various research groups are working to develop 3D spatial proteomic workflows. Most of them are based on sequential slide staining coupled with tissue reconstruction (91) or on tissue clearing protocols combined with multiplex staining (92, 93).
Another limitation of spatial proteomics is the large volume of data it generates, which often requires several days for thorough analysis. The development of rapid, automated data storage platforms and more efficient analysis pipelines could greatly accelerate data processing, enabling faster insights and enhancing the overall utility of spatial proteomics in research and clinical applications. This advancement would not only accelerate results but also pave the way for the clinical application of spatial proteomics, potentially revolutionizing pathology.
The integration of artificial intelligence (AI) with multiplex imaging, traditional digital pathology approaches (94), and spatial analysis represents a transformative opportunity for spatial proteomics.
AI-driven approaches, particularly in computer vision, could revolutionize how we analyze complex datasets, enabling real-time pattern recognition and spatial mapping that surpass human capabilities. These techniques could also refine traditional digital pathology by enhancing the consistency and resolution of image analysis, enabling more detailed tissue characterization. AI could interpret the intricate spatial relationships within the tumor microenvironment, identifying biomarkers and predicting responses to immunotherapies with unparalleled precision (95). Emerging tools (46), promise to unify tasks like segmentation, classification, and phenotyping into streamlined pipelines, significantly enhancing both the accuracy and efficiency of spatial data analysis (96). Looking forward, AI-powered platforms could offer intuitive, query-based interfaces for integrating imaging data with clinical and molecular profiles, paving the way for new biological insights and personalized treatment strategies. Such innovations would not only accelerate data processing but also address the inherent limitations of human subjectivity, unlocking the full potential of multiplexed spatial proteomics in research and clinical practice.
There is a significant global effort to create comprehensive human atlases of cell networks and neighborhoods, spanning a wide range of tissue types and disease states. These atlases aim to map the intricate cellular interactions and spatial organization within different tissues, providing a rich resource for understanding human biology in health and disease (97–99).
In addition, recognizing the systemic nature of cancer, where tumor-induced perturbations extend beyond the local TME, future spatial proteomic studies should be integrated with analyses of cancer-mediated changes occurring at the systemic level, such as those observed in peripheral blood. This integrated approach could help to identify soluble factor signatures (e.g. metabolites, proteins) indicative of the TME that are amenable to detection in liquid biopsies.
To conclude, the integration of spatial multi-omics represents a frontier in biomedical research, offering unprecedented opportunities to uncover the spatial and functional complexity of biological systems. Future efforts will likely focus on refining computational frameworks, reducing technological costs, and bridging the gap toward clinical applications. By addressing these challenges, spatial multi-omics could transform our understanding of tissue organization and disease mechanisms, paving the way for personalized diagnostics and therapeutics.
Author contributions
CB: Writing – original draft, Writing – review & editing. MG: Writing – original draft, Writing – review & editing. BA: Writing – original draft, Writing – review & editing.
Funding
The author(s) declare that financial support was received for the research and/or publication of this article. The project was supported by the Italian Ministry of Health – RC2025.
Conflict of interest
The authors declare that the research was conducted in the absence of any commercial or financial relationships that could be construed as a potential conflict of interest.
Generative AI statement
The author(s) declare that no Generative AI was used in the creation of this manuscript.
Publisher’s note
All claims expressed in this article are solely those of the authors and do not necessarily represent those of their affiliated organizations, or those of the publisher, the editors and the reviewers. Any product that may be evaluated in this article, or claim that may be made by its manufacturer, is not guaranteed or endorsed by the publisher.
Author disclaimer
The authors affiliated to the IRCCS Istituto Tumori “Giovanni Paolo II”, Bari are responsible for the views expressed in this article which do not necessarily represent the Institute.
References
1. de Visser KE and Joyce JA. The evolving tumor microenvironment: From cancer initiation to metastatic outgrowth. Cancer Cel. (2023) 41:374–403. doi: 10.1016/j.ccell.2023.02.016
2. Method of the Year 2024: spatial proteomics. Nat Method. (2024) 21:2195–6. doi: 10.1038/s41592-024-02565-3
3. Larkin J, Chiarion-Sileni V, Gonzalez R, Grob JJ, Rutkowski P, Lao CD, et al. Five-year survival with combined nivolumab and ipilimumab in advanced melanoma. N Engl J Me. (2019) 381:1535–46. doi: 10.1056/NEJMoa1910836
4. Eggermont AM, Kicinski M, Blank CU, Mandala M, Long GV, Atkinson V, et al. Seven-year analysis of adjuvant pembrolizumab versus placebo in stage III melanoma in the EORTC1325/KEYNOTE-054 trial. Eur J Cancer. (2024) 211:114327. doi: 10.1016/j.ejca.2024.114327
5. Blank CU, Rozeman EA, Fanchi LF, Sikorska K, van de Wiel B, Kvistborg P, et al. Neoadjuvant versus adjuvant ipilimumab plus nivolumab in macroscopic stage III melanoma. Nat Me. (2018) 24:1655–61. doi: 10.1038/s41591-018-0198-0
6. Lodde GC, Zhao F, Herbst R, Terheyden P, Utikal J, Pföhler C, et al. Early versus late response to PD-1-based immunotherapy in metastatic melanoma. Eur J Cancer. (2024) 210:114295. doi: 10.1016/j.ejca.2024.114295
7. Magaki S, Hojat SA, Wei B, So A, and Yong WH. An introduction to the performance of immunohistochemistry. Methods Mol Bio. (2019) 1897:289–98. doi: 10.1007/978-1-4939-8935-5_25
8. Tsujikawa T, Kumar S, Borkar RN, Azimi V, Thibault G, Chang YH, et al. Quantitative multiplex immunohistochemistry reveals myeloid-inflamed tumor-immune complexity associated with poor prognosis. Cell Re. (2017) 19:203–17. doi: 10.1016/j.celrep.2017.03.037
9. Remark R, Merghoub T, Grabe N, Litjens G, Damotte D, Wolchok JD, et al. In-depth tissue profiling using multiplexed immunohistochemical consecutive staining on single slide. Sci Immuno. (2016) 1:aaf6925. doi: 10.1126/sciimmunol.aaf6925
10. Sims Z, Mills GB, and Chang YH. MIM-CyCIF: masked imaging modeling for enhancing cyclic immunofluorescence (CyCIF) with panel reduction and imputation. Commun Bio. (2024) 7:409. doi: 10.1038/s42003-024-06110-y
11. Radtke AJ, Chu CJ, Yaniv Z, Yao L, Marr J, Beuschel RT, et al. IBEX: an iterative immunolabeling and chemical bleaching method for high-content imaging of diverse tissues. Nat Proto. (2022) 17:378–401. doi: 10.1038/s41596-021-00644-9
12. Hsu J, Nguyen KT, Bujnowska M, Janes KA, and Fallahi-Sichani M. Protocol for iterative indirect immunofluorescence imaging in cultured cells, tissue sections, and metaphase chromosome spreads. STAR Proto. (2024) 5:103190. doi: 10.1016/j.xpro.2024.103190
13. Watson SS, Duc B, Kang Z, de Tonnac A, Eling N, Font L, et al. Microenvironmental reorganization in brain tumors following radiotherapy and recurrence revealed by hyperplexed immunofluorescence imaging. Nat Commu. (2024) 15:3226. doi: 10.1038/s41467-024-47185-9
14. Black S, Phillips D, Hickey JW, Kennedy-Darling J, Venkataraaman VG, Samusik N, et al. CODEX multiplexed tissue imaging with DNA-conjugated antibodies. Nat Proto. (2021) 16:3802–35. doi: 10.1038/s41596-021-00556-8
15. Keren L, Bosse M, Thompson S, Risom T, Vijayaragavan K, McCaffrey E, et al. MIBI-TOF: A multiplexed imaging platform relates cellular phenotypes and tissue structure. Sci Ad. (2019) 5:eaax5851. doi: 10.1126/sciadv.aax5851
16. Windhager J, Zanotelli VRT, Schulz D, Meyer L, Daniel M, Bodenmiller B, et al. An end-to-end workflow for multiplexed image processing and analysis. Nat Proto. (2023) 18:3565–613. doi: 10.1038/s41596-023-00881-0
17. Merritt CR, Ong GT, Church SE, Barker K, Danaher P, Geiss G, et al. Multiplex digital spatial profiling of proteins and RNA in fixed tissue. Nat Biotechno. (2020) 38:586–99. doi: 10.1038/s41587-020-0472-9
18. He S, Bhatt R, Brown C, Brown EA, Buhr DL, Chantranuvatana K, et al. High-plex imaging of RNA and proteins at subcellular resolution in fixed tissue by spatial molecular imaging. Nat Biotechno. (2022) 40:1794–806. doi: 10.1038/s41587-022-01483-z
19. Gide TN, Quek C, Menzies AM, Tasker AT, Shang P, Holst J, et al. Distinct immune cell populations define response to anti-PD-1 monotherapy and anti-PD-1/anti-CTLA-4 combined therapy. Cancer Cel. (2019) 35:238–55 e6. doi: 10.1016/j.ccell.2019.01.003
20. Fortman D, Karunamurthy A, Hartman D, Wang H, Seigh L, Abukhiran I, et al. Automated quantitative CD8+ Tumor-infiltrating lymphocytes and tumor mutation burden as independent biomarkers in melanoma patients receiving front-line anti-PD-1 immunotherapy. Oncologist. (2024) 29:619–28. doi: 10.1093/oncolo/oyae054
21. Doroshow DB, Bhalla S, Beasley MB, Sholl LM, Kerr KM, Gnjatic S, et al. PD-L1 as a biomarker of response to immune-checkpoint inhibitors. Nat Rev Clin Onco. (2021) 18:345–62. doi: 10.1038/s41571-021-00473-5
22. Giraldo NA, Berry S, Becht E, Ates D, Schenk KM, Engle EL, et al. Spatial UMAP and image cytometry for topographic immuno-oncology biomarker discovery. Cancer Immunol Re. (2021) 9:1262–9. doi: 10.1158/2326-6066.CIR-21-0015
23. Mendoza-Valderrey A, Dettmann E, Hanes D, Kessler DM, Danilova L, Rau K, et al. Immunogenomics and spatial proteomic mapping highlight distinct neuro-immune architectures in melanoma vs. non-melanoma-derived brain metastasis. BJC Re. (2024) 2:38. doi: 10.1038/s44276-024-00060-y
24. Bosisio FM, Antoranz A, van Herck Y, Bolognesi MM, Marcelis L, Chinello C, et al. Functional heterogeneity of lymphocytic patterns in primary melanoma dissected through single-cell multiplexing. Elif. (2020) 9. doi: 10.7554/eLife.53008
25. Nirmal AJ, Maliga Z, Vallius T, Quattrochi B, Chen AA, Jacobson CA, et al. The spatial landscape of progression and immunoediting in primary melanoma at single-cell resolution. Cancer Disco. (2022) 12:1518–41. doi: 10.1158/2159-8290.CD-21-1357
26. Liu D, Lin JR, Robitschek EJ, Kasumova GG, Heyde A, Shi A, et al. Evolution of delayed resistance to immunotherapy in a melanoma responder. Nat Me. (2021) 27:985–92. doi: 10.1038/s41591-021-01331-8
27. Hickey JW, Haist M, Horowitz N, Caraccio C, Tan Y, Rech AJ, et al. T cell-mediated curation and restructuring of tumor tissue coordinates an effective immune response. Cell Re. (2023) 42:113494. doi: 10.1016/j.celrep.2023.113494
28. Liu H, Gao J, Feng M, Cheng J, Tang Y, Cao Q, et al. Integrative molecular and spatial analysis reveals evolutionary dynamics and tumor-immune interplay of in situ and invasive acral melanoma. Cancer Cel. (2024) 42:1067–85.e11. doi: 10.1016/j.ccell.2024.04.012
29. Surwase SS, Zhou XMM, Luly KM, Zhu Q, Anders RA, Green JJ, et al. Highly multiplexed immunofluorescence phenoCycler panel for murine formalin-fixed paraffin-embedded tissues yields insight into tumor microenvironment immunoengineering. Lab Invest. (2025) 105:102165. doi: 10.1016/j.labinv.2024.102165
30. Martinez-Morilla S, Villarroel-Espindola F, Wong PF, Toki MI, Aung TN, Pelekanou V, et al. Biomarker discovery in patients with immunotherapy-treated melanoma with imaging mass cytometry. Clin Cancer Re. (2021) 27:1987–96. doi: 10.1158/1078-0432.CCR-20-3340
31. Xiao X, Guo Q, Cui C, Lin Y, Zhang L, Ding X, et al. Multiplexed imaging mass cytometry reveals distinct tumor-immune microenvironments linked to immunotherapy responses in melanoma. Commun Med (Lond). (2022) 2:131. doi: 10.1038/s43856-022-00197-2
32. Moldoveanu D, Ramsay L, Lajoie M, Anderson-Trocme L, Lingrand M, Berry D, et al. Spatially mapping the immune landscape of melanoma using imaging mass cytometry. Sci Immuno. (2022) 7:eabi5072. doi: 10.1126/sciimmunol.abi5072
33. Hoch T, Schulz D, Eling N, Gomez JM, Levesque MP, and Bodenmiller B. Multiplexed imaging mass cytometry of the chemokine milieus in melanoma characterizes features of the response to immunotherapy. Sci Immuno. (2022) 7:eabk1692. doi: 10.1126/sciimmunol.abk1692
34. Toki MI, Merritt CR, Wong PF, Smithy JW, Kluger HM, Syrigos KN, et al. High-plex predictive marker discovery for melanoma immunotherapy-treated patients using digital spatial profiling. Clin Cancer Re. (2019) 25:5503–12. doi: 10.1158/1078-0432.CCR-19-0104
35. Martinez-Morilla S, Moutafi M, Fernandez AI, Jessel S, Divakar P, Wong PF, et al. Digital spatial profiling of melanoma shows CD95 expression in immune cells is associated with resistance to immunotherapy. Oncoimmunology. (2023) 12:2260618. doi: 10.1080/2162402X.2023.2260618
36. Barras D, Ghisoni E, Chiffelle J, Orcurto A, Dagher J, Fahr N, et al. Response to tumor-infiltrating lymphocyte adoptive therapy is associated with preexisting CD8. Sci Immuno. (2024) 9:eadg7995. doi: 0.1126/sciimmunol.adg7995
37. Cabrita R, Lauss M, Sanna A, Donia M, Skaarup Larsen M, Mitra S, et al. Tertiary lymphoid structures improve immunotherapy and survival in melanoma. Nature. (2020) 577:561–5. doi: 10.1038/s41586-019-1914-8
38. Helmink BA, Reddy SM, Gao J, Zhang S, Basar R, Thakur R, et al. B cells and tertiary lymphoid structures promote immunotherapy response. Nature. (2020) 577:549–55. doi: 10.1038/s41586-019-1922-8
39. Beasley GM, Therien AD, Holl EK, Al-Rohil R, Selim MA, Farrow NE, et al. Dissecting the immune landscape of tumor draining lymph nodes in melanoma with high-plex spatially resolved protein detection. Cancer Immunol Immunother. (2021) 70:475–83. doi: 10.1007/s00262-020-02698-2
40. Therien AD, Beasley GM, Rhodin KE, Farrow NE, Tyler DS, Boczkowski D, et al. Spatial biology analysis reveals B cell follicles in secondary lymphoid structures may regulate anti-tumor responses at initial melanoma diagnosis. Front Immuno. (2022) 13:952220. doi: 10.3389/fimmu.2022.952220
41. Muhlich JL, Chen YA, Yapp C, Russell D, Santagata S, and Sorger PK. Stitching and registering highly multiplexed whole-slide images of tissues and tumors using ASHLAR. Bioinformatics. (2022) 38:4613–21. doi: 10.1093/bioinformatics/btac544
42. Gatenbee CD, Baker AM, Prabhakaran S, Swinyard O, Slebos RJC, Mandal G, et al. Virtual alignment of pathology image series for multi-gigapixel whole slide images. Nat Commu. (2023) 14:4502. doi: 10.1038/s41467-023-40218-9
43. Andhari MD, Rinaldi G, Nazari P, Shankar G, Dubroja N, Vets J, et al. Quality control of immunofluorescence images using artificial intelligence. Cell Rep Phys Sc. (2024) 5(10):2024. doi: 10.1101/2024.01.26.577391
44. Lu P, Oetjen KA, Bender DE, Ruzinova MB, Fisher DAC, Shim KG, et al. IMC-Denoise: a content aware denoising pipeline to enhance Imaging Mass Cytometry. Nat Commu. (2023) 14:1601. doi: 10.1038/s41467-023-37123-6
45. Peng T, Thorn K, Schroeder T, Wang L, Theis FJ, Marr C, et al. A BaSiC tool for background and shading correction of optical microscopy images. Nat Commu. (2017) 8:14836. doi: 10.1038/ncomms14836
46. Schapiro D, Sokolov A, Yapp C, Chen YA, Muhlich JL, Hess J, et al. MCMICRO: a scalable, modular image-processing pipeline for multiplexed tissue imaging. Nat Method. (2022) 19:311–5. doi: 10.1038/s41592-021-01308-y
47. Lu G, Baertsch MA, Hickey JW, Goltsev Y, Rech AJ, Mani L, et al. A real-time GPU-accelerated parallelized image processor for large-scale multiplexed fluorescence microscopy data. Front Immuno. (2022) 13:981825. doi: 10.3389/fimmu.2022.981825
48. Gamarra M, Zurek E, Escalante HJ, Hurtado L, and San-Juan-Vergara H. Split and Merge Watershed: a two-step method for cell segmentation in fluorescence microscopy images. BioMed Signal Process Control. (2019) 53. doi: 10.1016/j.bspc.2019.101575
49. Wen T, Tong B, Liu Y, Pan T, Du Y, Chen Y, et al. Review of research on the instance segmentation of cell images. Comput Methods Programs Biome. (2022) 227:107211. doi: 10.1016/j.cmpb.2022.107211
50. Berg S, Kutra D, Kroeger T, Straehle CN, Kausler BX, Haubold C, et al. ilastik: interactive machine learning for (bio)image analysis. Nat Method. (2019) 16:1226–32. doi: 10.1038/s41592-019-0582-9
51. Stirling DR, Swain-Bowden MJ, Lucas AM, Carpenter AE, Cimini BA, and Goodman A. CellProfiler 4: improvements in speed, utility and usability. BMC Bioin. (2021) 22:433. doi: 10.1186/s12859-021-04344-9
52. Stevens M, Nanou A, Terstappen LWMM, Driemel C, Stoecklein NH, and Coumans FAW. StarDist image segmentation improves circulating tumor cell detection. Cancers (Basel). (2022) 14. doi: 10.3390/cancers14122916
53. Greenwald NF, Miller G, Moen E, Kong A, Kagel A, Dougherty T, et al. Whole-cell segmentation of tissue images with human-level performance using large-scale data annotation and deep learning. Nat Biotechno. (2022) 40:555–65. doi: 10.1038/s41587-021-01094-0
54. Stringer C, Wang T, Michaelos M, and Pachitariu M. Cellpose: a generalist algorithm for cellular segmentation. Nat Method. (2021) 18:100–6. doi: 10.1038/s41592-020-01018-x
55. Zhao Y, Fu C, Zhang W, Ye C, Wang Z, and Ma HF. Automatic segmentation of cervical cells based on star-convex polygons in pap smear images. Bioengineering. (2023) 10:47. doi: 10.3390/bioengineering10010047
56. Levine JH, Simonds EF, Bendall SC, Davis KL, Amir e-A, Tadmor MD, et al. Data-driven phenotypic dissection of AML reveals progenitor-like cells that correlate with prognosis. Cell. (2015) 162:184–97. doi: 10.1016/j.cell.2015.05.047
57. Shi R, Ngan KN, and Li S. “Jaccard index compensation for object segmentation evaluation.” In: 2014 IEEE International Conference on Image Processing (ICIP), Paris, France. (2014), pp. 4457–61. doi: 10.1109/ICIP.2014.7025904
58. Quintelier K, Couckuyt A, Emmaneel A, Aerts J, Saeys Y, and Van Gassen S. Analyzing high-dimensional cytometry data using FlowSOM. Nat Proto. (2021) 16:3775–801. doi: 10.1038/s41596-021-00550-0
59. Villmann T and Bauer H-U. Applications of the growing self-organizing map. Neurocomputing. (1998) 21(1-3):91–100. doi: 10.1016/S0925-2312(98)00037-X
60. Zaki MJ. SPADE: an efficient algorithm for mining frequent sequences. Mach Lear. (2001) 42:31–60. doi: 10.1023/A:1007652502315
61. Pliner HA, Shendure J, and Trapnell C. Supervised classification enables rapid annotation of cell atlases. Nat Method. (2019) 16:983–6. doi: 10.1038/s41592-019-0535-3
62. Zhang W, Li I, Reticker-Flynn NE, Good Z, Chang S, Samusik N, et al. Identification of cell types in multiplexed in situ images by combining protein expression and spatial information using CELESTA. Nat Method. (2022) 19:759–69. doi: 10.1038/s41592-022-01498-z
63. Geuenich MJ, Hou J, Lee S, Ayub S, Jackson HW, and Campbell KR. Automated assignment of cell identity from single-cell multiplexed imaging and proteomic data. Cell Sys. (2021) 12:1173–86.e5. doi: 10.1016/j.cels.2021.08.012
64. Wang XJ, Dilip R, Bussi Y, Brown C, Pradhan E, Jain Y, et al. Generalized cell phenotyping for spatial proteomics with language-informed vision models. bioRxi. (2024). doi: 10.1101/2024.11.02.621624
65. Amitay Y, Bussi Y, Feinstein B, Bagon S, Milo I, and Keren L. CellSighter: a neural network to classify cells in highly multiplexed images. Nat Commu. (2023) 14:4302. doi: 10.1038/s41467-023-40066-7
66. Brbić M, Cao K, Hickey JW, Tan Y, Snyder MP, Nolan GP, et al. Annotation of spatially resolved single-cell data with STELLAR. Nat Method. (2022) 19:1411–8. doi: 10.1038/s41592-022-01651-8
67. Xia Y, Ma J, Yang X, Liu D, Zhu Y, Zhao Y, et al. Identifying the spatial architecture that restricts the proximity of CD8. Cancers. (2024) 16(7):1434. doi: 10.3390/cancers16071434
68. Schapiro D, Jackson HW, Raghuraman S, Fischer JR, Zanotelli VRT, Schulz D, et al. histoCAT: analysis of cell phenotypes and interactions in multiplex image cytometry data. Nat Method. (2017) 14:873–6. doi: 10.1038/nmeth.4391
69. Eling N, Damond N, Hoch T, and Bodenmiller B. cytomapper: an R/Bioconductor package for visualization of highly multiplexed imaging data. Bioinformatic. (2021) 36:5706–8. doi: 10.1093/bioinformatics/btaa1061
70. B A, Rubak E, and T R. Spatial Point Patterns: Methodology and Applications with. London: Chapman and Hall/CRC Press (2015).
71. Palla G, Spitzer H, Klein M, Fischer D, Schaar AC, Kuemmerle LB, et al. Squidpy: a scalable framework for spatial omics analysis. Nat Metho. (2022) 19:171–8. doi: 10.1038/s41592-021-01358-2
72. Coullomb A, Monsarrat P, and Pancaldi V. Reveals different types of cellular interactions predictive of response to immunotherapies and survival in cancer. bioRx. (2024). doi: 10.1101/2023.03.16.532947
73. Lingegowda H, Zutautas KB, Wei Y, Yolmo P, Sisnett DJ, McCallion A, et al. Endocannabinoids and their receptors modulate endometriosis pathogenesis and immune response. Elif. (2024) 13. doi: 10.7554/eLife.96523
74. Dries R, Zhu Q, and Dong R. Giotto: a toolbox for integrative analysis and visualization of spatial expression data. Genome Bio. (2021) 22:78. doi: 10.1186/s13059-021-02286-2
75. Zheng Y, Chen Y, Ding X, Wong KH, and Cheung E. Aquila: a spatial omics database and analysis platform. Nucleic Acids Re. (2023) 51:D827–D34. doi: 10.1093/nar/gkac874
76. Jin S, Guerrero-Juarez CF, Zhang L, Chang I, Ramos R, Kuan CH, et al. Inference and analysis of cell-cell communication using CellChat. Nat Commu. (2021) 12:1088. doi: 10.1038/s41467-021-21246-9
77. Cang Z and Nie Q. Inferring spatial and signaling relationships between cells from single cell transcriptomic data. Nat Commu. (2020) 11:2084. doi: 10.1038/s41467-020-15968-5
78. Ma Q, Li Q, Zheng X, and Pan J. CellCommuNet: an atlas of cell-cell communication networks from single-cell RNA sequencing of human and mouse tissues in normal and disease states. Nucleic Acids Re. (2024) 52:D597–606. doi: 10.1093/nar/gkad906
79. Stanojevic S, Li Y, Ristivojevic A, and Garmire LX. Computational methods for single-cell multi-omics integration and alignment. Genomics Proteomics Bioin. (2022) 20:836–49. doi: 10.1016/j.gpb.2022.11.013
80. Burlingame E, Ternes L, Lin JR, Chen YA, Kim EN, Gray JW, et al. 3D multiplexed tissue imaging reconstruction and optimized region of interest (ROI) selection through deep learning model of channels embedding. Front Bioinfor. (2023) 3:1275402. doi: 10.3389/fbinf.2023.1275402
81. Lin JR, Chen YA, Campton D, Cooper J, Coy S, Yapp C, et al. High-plex immunofluorescence imaging and traditional histology of the same tissue section for discovering image-based biomarkers. Nat Cancer. (2023) 4:1036–52. doi: 10.1038/s43018-023-00576-1
82. Zeira R, Anavy L, Yakhini Z, Rivlin E, and Freedman D. HIPI: Spatially resolved multiplexed protein expression inferred from H&E WSIs. PloS Comput Bio. (2024) 20:e1012501. doi: 10.1371/journal.pcbi.1012501
83. Kim EN, Chen PZ, Bressan D, Tripathi M, Miremadi A, di Pietro M, et al. Dual-modality imaging of immunofluorescence and imaging mass cytometry for whole-slide imaging and accurate segmentation. Cell Rep Method. (2023) 3:100595. doi: 10.1016/j.crmeth.2023.100595
84. Marlin MC, Stephens T, Wright C, Smith M, Wright K, and Guthridge JM. A novel process for H&E, immunofluorescence, and imaging mass cytometry on a single slide with a concise analytics pipeline. Cytometry A. (2023) 103:1010–8. doi: 10.1002/cyto.a.24789
85. Vandereyken K, Sifrim A, Thienpont B, and Voet T. Methods and applications for single-cell and spatial multi-omics. Nat Rev Gene. (2023) 24:494–515. doi: 10.1038/s41576-023-00580-2
86. Argelaguet R, Cuomo ASE, Stegle O, and Marioni JC. Computational principles and challenges in single-cell data integration. Nat Biotechno. (2021) 39:1202–15. doi: 10.1038/s41587-021-00895-7
87. Fan R. Integrative spatial protein profiling with multi-omics. Nat Method. (2024) 21:2223–5. doi: 10.1038/s41592-024-02533-x
88. Bodenmiller B. Highly multiplexed imaging in the omics era: understanding tissue structures in health and disease. Nat Method. (2024) 21:2209–11. doi: 10.1038/s41592-024-02538-6
89. Mund A, Coscia F, Kriston A, Hollandi R, Kovacs F, Brunner AD, et al. Deep Visual Proteomics defines single-cell identity and heterogeneity. Nat Biotechno. (2022) 40:1231–40. doi: 10.1038/s41587-022-01302-5
90. Strack R. Subcellular spatial proteomics. Nat Method. (2024) 21:2227. doi: 10.1038/s41592-024-02546-6
91. Kuett L, Catena R, Ozcan A, Pluss A, Cancer Grand Challenges IC, Schraml P, et al. Three-dimensional imaging mass cytometry for highly multiplexed molecular and cellular mapping of tissues and the tumor microenvironment. Nat Cancer. (2022) 3:122–33. doi: 10.1038/s43018-021-00301-w
92. Shi L, Wei M, Miao Y, Qian N, Shi L, Singer RA, et al. Highly-multiplexed volumetric mapping with Raman dye imaging and tissue clearing. Nat Biotechno. (2022) 40:364–73. doi: 10.1038/s41587-021-01041-z
93. Zheng J, Wu YC, Phillips EH, Cai X, Wang X, and Seung-Young Lee S. Increased multiplexity in optical tissue clearing-based three-dimensional immunofluorescence microscopy of the tumor microenvironment by light-emitting diode photobleaching. Lab Invest. (2024) 104:102072. doi: 10.1016/j.labinv.2024.102072
94. Comes MC, Fucci L, Strippoli S, Bove S, Cazzato G, Colangiuli C, et al. An artificial intelligence-based model exploiting H&E images to predict recurrence in negative sentinel lymph-node melanoma patients. J Transl Me. (2024) 22:838. doi: 10.1186/s12967-024-05629-2
95. Bussi Y and Keren L. Multiplexed image analysis: what have we achieved and where are we headed? Nat Method. (2024) 21:2212–5. doi: 10.1038/s41592-024-02539-5
96. Quail DF and Walsh LA. Revolutionizing cancer research with spatial proteomics and visual intelligence. Nat Method. (2024) 21:2216–9. doi: 10.1038/s41592-024-02542-w
97. Quardokus EM, Saunders DC, McDonough E, Hickey JW, Werlein C, Surrette C, et al. Organ Mapping Antibody Panels: a community resource for standardized multiplexed tissue imaging. Nat Method. (2023) 20:1174–8. doi: 10.1038/s41592-023-01846-7
98. Jain S, Pei L, Spraggins JM, Angelo M, Carson JP, Gehlenborg N, et al. Advances and prospects for the human bioMolecular atlas program (HuBMAP). Nat Cell Bio. (2023) 25:1089–100. doi: 10.1038/s41556-023-01194-w
Keywords: spatial proteomics, tumor microenvironment, melanoma, immunolocalization, mapping & localization
Citation: Bungaro C, Guida M and Apollonio B (2025) Spatial proteomics of the tumor microenvironment in melanoma: current insights and future directions. Front. Immunol. 16:1568456. doi: 10.3389/fimmu.2025.1568456
Received: 29 January 2025; Accepted: 25 April 2025;
Published: 15 May 2025.
Edited by:
Suhendan Ekmekcioglu, University of Texas MD Anderson Cancer Center, United StatesReviewed by:
Ankush Sharma, Oslo University Hospital, NorwayGiuseppina Arbore, San Raffaele Hospital (IRCCS), Italy
Copyright © 2025 Bungaro, Guida and Apollonio. This is an open-access article distributed under the terms of the Creative Commons Attribution License (CC BY). The use, distribution or reproduction in other forums is permitted, provided the original author(s) and the copyright owner(s) are credited and that the original publication in this journal is cited, in accordance with accepted academic practice. No use, distribution or reproduction is permitted which does not comply with these terms.
*Correspondence: Benedetta Apollonio, Yi5hcG9sbG9uaW9Ab25jb2xvZ2ljby5iYXJpLml0