 Junhong Shi
 Lan Chen2
 Yu Huang
 Bingjie Wang
 Fangyou Yu
- 1Department of Clinical Laboratory, Shanghai Pulmonary Hospital, School of Medicine, Tongji University, Shanghai, China
- 2Department of Clinical Laboratory Medicine, The First Affiliated Hospital of Ningbo University, Ningbo, Zhejiang, China
- 3Department of Respiratory Medicine, The First Affiliated Hospital of Wenzhou Medical University, Wenzhou, China
Staphylococcus aureus (S. aureus) bloodstream infection is often life-threatening, and increasing in incidence. We identified 63 differentially expressed genes (DEGs) in the GSE33341 S. aureus infection samples. Subsequently, intersecting the 63 DEGs with 950 genes from the blue module through weighted gene co-expression network analysis (WGCNA) yielded 38 genes. We leveraged Boruta and least absolute shrinkage and selection operator (LASSO) algorithms and identified5 diagnostic genes (DRAM1, UPP1, IL18RAP, CLEC4A, and PGLYRP1). Comparative analysis revealed that Extreme Gradient Boosting (XGBoost) surpassed SVM-RFE and Random Forest models, demonstrating superior diagnostic performance for S. aureus bloodstream infection (mean AUC for XGBoost =0.954; mean AUC for SVM-RFE =0.93275; mean AUC for Random Forest =0.94625). The XGBoost Diagnostic Score correlated with multiple immune cells to varying degrees, manifesting significant negative associations with CD8 T cells and CD4 naive T cells in both human and mouse samples. The diagnostic power of the Diagnostic Score was further validated by RT-qPCR results obtained from both mouse and patient samples, as well as RNA-Seq analysis conducted on mouse samples. XGBoost Diagnostic Score, consisting of DRAM1, UPP1, IL18RAP, CLEC4A, and PGLYRP1, may serve as a Diagnostic tool for S. aureus bloodstream infection.
Introduction
Staphylococcus aureus (S. aureus) was a common pathogen causing both community and hospital infections (1, 2). S. aureus can lead to acute and chronic infections in various parts of the body, including the bloodstream, respiratory tract, bone marrow, and other parts of the body (3–5). Among these, bloodstream infection was particularly harmful and had a higher incidence rate (6–8). Clinically, S. aureus bloodstream infection is defined clinically by positive S. aureus blood cultures from patients exhibiting signs and symptoms of systemic infection (9).
Once S. aureus entered the bloodstream, it triggered the recruitment of circulating neutrophils and the production of inflammatory cytokines (10, 11). CD4 naive T cells proliferated strongly in response to superantigens such as staphylococcal enterotoxin B (SEB) (12). Superantigens are bacterial virulence factors that induce a state of immune hyperactivation by forming a bridge between certain subsets of T cell receptor (TCR) β chains on T lymphocytes, and class II major histocompatibility complex (MHC-II) molecules (13, 14). Zhang et al. found that in the face of superantigens induced immune hyperactivation, an intact bacterium-specific CD4+ T cell response can be mounted (15). Cytotoxic CD8+ T cells eliminated target cells by recognizing homologous epitopes presented by MHC class I (MHC-I) molecules, playing a role in clearing intracellular bacteria in murine models of bacterial infection (16–18). Alexeev confirmed that cytotoxic CD8+ T cells recognized S. aureus-infected Recessive dystrophic epidermolysis bullosa keratinocytes and responded by producing interleukin-2 (IL-2) and IFNγ and degranulating and cytotoxically killing infected cells (19). Yi et al. discovered that the potential T-cell antigens of S. aureus, EsxA and EsxB, can play a critical role in stimulating T helper 1 immunity by activating IgG2a and CD8(+) T cells (20). S. aureus can exhibit a high bacterial burden during endovascular infection through foci formation that adhere to vessel walls (3). Therefore, the internalization and the persistence of S. aureus within host cells allowed the bacteria to evade these responses.
Methods for identifying disease-associated modules and genes were increasingly being developed, which can be effective in searching for diagnostic markers in clinical practice (21, 22). Diagnostic biomarkers are defined as indicators that can detect or confirm the presence of a disease or condition, or identify individuals with specific disease subtypes (23). These biomarkers serve not only to diagnose patients but also to refine the classification and understanding of diseases. Recent research into diagnostic biomarkers has increasingly emphasized the usage of advanced methodologies to boost predictive accuracy and improve patient outcomes. For instance, weighted gene co-expression network analysis (WGCNA) was widely recognized as a robust method for uncovering relationships between genes and clinical features (24–26). On top of that, Extreme Gradient Boosting (XGBoost) was efficient, flexible, and lightweight, and has been widely used in data mining, recommender systems, and other fields (27). Among various machine learning algorithms, XGBoost has demonstrated superior performance in medical applications. Recent studies have indicated that the XGBoost algorithm exhibits enhanced predictive power compared to alternative algorithms. For instance, Shen et al. developed an XGBoost-based machine learning model that showed superior performance compared with the other three machine learning algorithms in predicting lobar pneumonia in children with Community-acquired pneumonia (28). In addition, among the seven machine learning predictive models incorporating non-high-density lipoprotein cholesterol to high-density lipoprotein cholesterol ratio, the XGBoost algorithm exhibited the highest predictive performance, with an area under the curve (AUC) of 0.828 (29).
In conclusion, this study comprehensively investigated the predictive diagnosis of S. aureus bloodstream infection deploying an ensemble machine-learning approach. The Diagnostic Score, constructed by combining the biomarkers DRAM1, UPP1, IL18RAP, CLEC4A, and PGLYRP1 harnessing the XGBoost algorithm, demonstrated superior diagnostic performance. Bioinformatic analysis combined with experimental validation provided a solid foundation for predicting S. aureus bloodstream infection. These findings were anticipated to offer new approaches for the diagnosis and treatment of S. aureus bloodstream infection.
Methods
Public gene expression datasets
Access to the Gene Expression Omnibus (GEO) database (https://www.ncbi.nlm.nih.gov/geo/), a public repository of high-throughput gene expression data, chips, and microarrays, was adopted for data collection. We queried the GEO database with the keywords “Staphylococcus aureus” [MeSH Terms] and “Bloodstream infection” [All Fields]. None of the included samples were concerned with any other diseases. The sample size of both the pediatric sepsis group and the normal group was greater than 10. Ultimately, GSE33341-human was selected as the training dataset, and GSE33341-mice served as the test dataset (30). Datasets GSE65088 (31) and GSE16129 (32) were employed for validation.
Weighted correlation network analysis
WGCNA is a genomics research method that facilitates the identification of gene clusters with high relatedness (24, 33, 34). This approach constructs a coexpression network using the “WGCNA” R package, focusing on the top 7500 genes exhibiting the highest variance. The network enables systematic gene screening to identify potential biomarkers or therapeutic targets. Hierarchical clustering identifies modules of genes according to their expression patterns, grouping those with similar patterns into distinct modules. This process categorizes tens of thousands of genes into multiple modules, adopting correlation and correlation coefficients as key measures.
Evaluation of functional enrichment
Gene Ontology (GO) and the Kyoto Encyclopedia of Genes and Genomes (KEGG) pathway enrichment analyses were conducted via the “clusterProfiler” (35) package in R to explore possible biological features of blue modules. Additionally, Gene set enrichment analysis (GSEA) (36) was performed via the “clusterProfiler” package in R to investigate the enrichment pathways.
Identification of the differentially expressed genes
The Wilcoxon test was utilized to identify differentially expressed genes (DEGs) between the S. aureus bloodstream infection group and the control group in the GSE33341 dataset. A P-value < 0.05 and |log2FC| > 1 were set as the cutoffs for DEGs.
Construction of diagnostic models for S. aureus bloodstream infection
Firstly, up-regulated genes in the human and mice S. aureus infection groups from GSE33341 were intersected to acquire 63 DEGs associated with S. aureus bloodstream infection. Afterward, these genes intersected with 950 genes from the blue module identified by WGCNA, resulting in 38 genes. Boruta and least absolute shrinkage and selection operator (LASSO) logistic regression were then applied separately to identify biomarkers, ultimately selecting five genes. Boruta algorithm is a full correlation analysis screening feature algorithm for identifying and selecting the set of features that are relevant to the dependent variable. It can select the essential features from the original feature set while excluding the features that do not have a significant impact on the model predictions (37). LASSO logistic regression is a penalized regression method that forces some coefficients to zero, effectively reducing variables and improving model achievement when the number of predictors exceeds the sample size (38). Diagnostic Score models were constructed by deploying these five genes through XGBoost, Support Vector Machine-Recursive Feature Elimination (SVM-RFE), and Random Forest (RF) algorithms. XGBoost is a decision-tree-based ensemble algorithm that ameliorates model performance by optimizing the loss function through gradient boosting and introducing regularization to improve generalization (39), with the following hyperparameters: eta = 0.01, max_depth = 2, min_child_weight = 3, subsample = 0.5, colsample_bytree = 0.6. SVM-RFE is a boundary-based supervised learning algorithm effective for classification tasks by constructing hyperplanes in high-dimensional space to maximize the margin between classes (40). RF is an ensemble learning technique that improves predictive accomplishment by constructing multiple decision trees and integrating their outcomes (41). The predictive power of the Diagnostic Score was evaluated using the receiver operating characteristic (ROC) curve and calculating the area under the curve (AUC). After comparing the mean AUC in four datasets, the XGBoost model (mean AUC for XGBoost =0.954; mean AUC for SVM-RFE =0.93275; mean AUC for Random Forest =0.94625) (mean accuracy for XGBoost =0.84; mean accuracy for SVM-RFE =0.7825; mean accuracy for Random Forest =0.7425), which demonstrated the best performance, was selected for in-depth analysis.
We utilized SHAP values to assess the overall feature importance in the XGBoost model. SHAP, a recent advancement in making tree-based models more interpretable, employs a game-theoretic method that aggregates the local contributions of individual features to explain the model’s behavior on a global scale. This approach is considered superior to other global approximation methods. The algorithm not only provides a measure of feature importance across the model but also offers insights into the role of each feature in specific predictions.
Sensitivity is the proportion of true positives tests out of all patients with a condition (42). In other words, it is the ability of a test or instrument to yield a positive result for a subject that has that disease. The ability to correctly classify a test is essential, and the equation for sensitivity is the following: Sensitivity=(True Positives (A))/(True Positives (A)+False Negatives (C)).
Specificity is the percentage of true negatives out of all subjects who do not have a disease or condition. In other words, it is the ability of the test or instrument to obtain normal range or negative results for a person who does not have a disease (43). The formula to determine specificity is the following: Specificity=(True Negatives (D))/(True Negatives (D)+False Positives (B)).
Assessment of immune cell infiltration
Immune cell infiltration was assessed by computing the differential infiltration of 22 immune cells exploiting the CIBERSORT (44) algorithm in the human samples and 36 immune cells using the ImmuCellAI (45) algorithm in the mouse samples. These algorithms are computational methods that depend on gene expression data to estimate the relative abundance of various cell types within a sample. The correlation between gene expression and immune cells was evaluated using Pearson’s correlation coefficients, with correlation plots produced utilizing the “ggpubr” R package.
Clinical blood samples
Whole blood samples were collected from five patients diagnosed with S. aureus bloodstream infection and from five healthy controls at the Shanghai Pulmonary Hospital, School of Medicine, Tongji University, Shanghai, China, for RNA extraction and subsequent RT-qPCR analysis. The blood samples used in this study were by-products of routine care in the department of clinical laboratory.
Establishment of a mouse model for S aureus bloodstream infection
The Methicillin-sensitive Staphylococcus aureus (MSSA) Newman strain was cultured for 16 hours in TSB medium at 37°C. Overnight cultures were centrifuged at 2683g (RCF) for 5 minutes at room temperature and secondarily adjusted to a concentration of 2 × 10⁹ CFU/mL with the help of phosphate-buffered saline (PBS). Succeeding this, female Balb/c mice were injected via the tail vein with 100 μL PBS containing 2 × 10⁸ CFU bacterial cells suspended. At eight hours post-infection, the mice were anesthetized with 2,2,2-tribromoethanol (5 mg/25 g). Surgical scissors were operated to remove mouse whiskers; thereafter, tweezers were leveraged to clamp the eyeball and swiftly excise it, allowing blood to flow from the eye socket into the EP tube. The collected blood sample was immediately placed in liquid nitrogen and stored at −80°C until RNA extraction.
RNA extraction and real-time polymerase chain reaction
Total RNA from patients and mice blood samples were isolated using the RNA Prep Pure Blood kit (Tiangen Biotech Co.; Ltd.) following the manufacturer’s protocol. RNA was then reverse transcribed into cDNA utilizing the PrimeScript RT reagent kit with gDNA Eraser (Takara). Real-time quantitative PCR (RT-qPCR) was performed using TB GreenTM Premix Ex TaqTM II (Takara) on QuantStudioTM 5 Real-Time PCR System (Applied Biosystems). The expression levels of DRAM1, UPP1, IL18RAP, CLEC4A, and PGLYRP1 genes normalized to GAPDH were calculated using the formula 2−ΔΔCt. All primers used in this study were listed in Supplementary Table S1. Each reaction was performed thrice.
Statistical analysis
All statistical analyses and graphical representations were conducted using R version 4.3.1 except for RT-qPCR results which were analyzed through GraphPad Prism version 9 (GraphPad Software Inc. San Diego, CA, USA). Statistical significance was determined by a two-tailed test with a P value of less than 0.05. *P < 0.05, **P < 0.01, ****P < 0.0001.
Results
Establishment of WGCNA and detection of key modules
Figure 1 illustrated the research design of this study. PRISMA methodology was utilized for extensive identification of public datasets (Supplementary Figure S1). To precisely identify the central genes connected with the S. aureus infection phenotype, we constructed a gene co-expression network adopting the WGCNA algorithm. The results from hierarchical clustering analysis demonstrated robust clustering among the samples, with no significant outliers observed (Figure 2A). The trends in Scale Independence and Mean Connectivity as functions of Soft Threshold (power) are illustrated in Figure 2B. The construction of the final scale-free network was depicted in Figure 2C, where the left panel presented a histogram of network connectivity while the right panel displayed a log-log plot corresponding to this histogram. A high R² value of 0.88 indicated an approximate scale-free topology (Figure 2C). A gene hierarchy clustering dendrogram was generated following gene correlations, resulting in the identification of eleven similar gene modules (Figure 2D). Branches of the dendrogram (the modules) were grouped together based on the correlation of eigengenes (Figure 2E). Interaction connections among the eleven modules were analyzed, leading to the creation of a network heatmap presented in Figure 2F. As portrayed in Figure 2G, there existed a highest positive correlation between the blue module and S. aureus infection, implying that this module may foster disease progression related to S. aureus infection. Furthermore, Figure 2H illustrated that expression levels of feature vector genes ME showed a strong correlation with expressions within all genes comprising this module; thus, expression values for characteristic genes can be considered representative profiles for their respective modules. Given that the blue module correlates positively with S. aureus infection, its constituent genes were selected for subsequent KEGG and GO analyses GO enrichment analysis revealed that genes within blue modules were enriched in processes such as proteasome-mediated Ubiquitin-dependent protein, catabolic process energy derivation by oxidation of organic compounds, and cellular respiration (Figure 2I). Likewise, KEGG analysis for genes in blue modules was associated with Pathways related to neurodegeneration-multiple diseases, Amyotrophic lateral sclerosis, Alzheimer disease, Parkinson disease, and Chemical carcinogenesis-reactive oxygen species (Figure 2J).
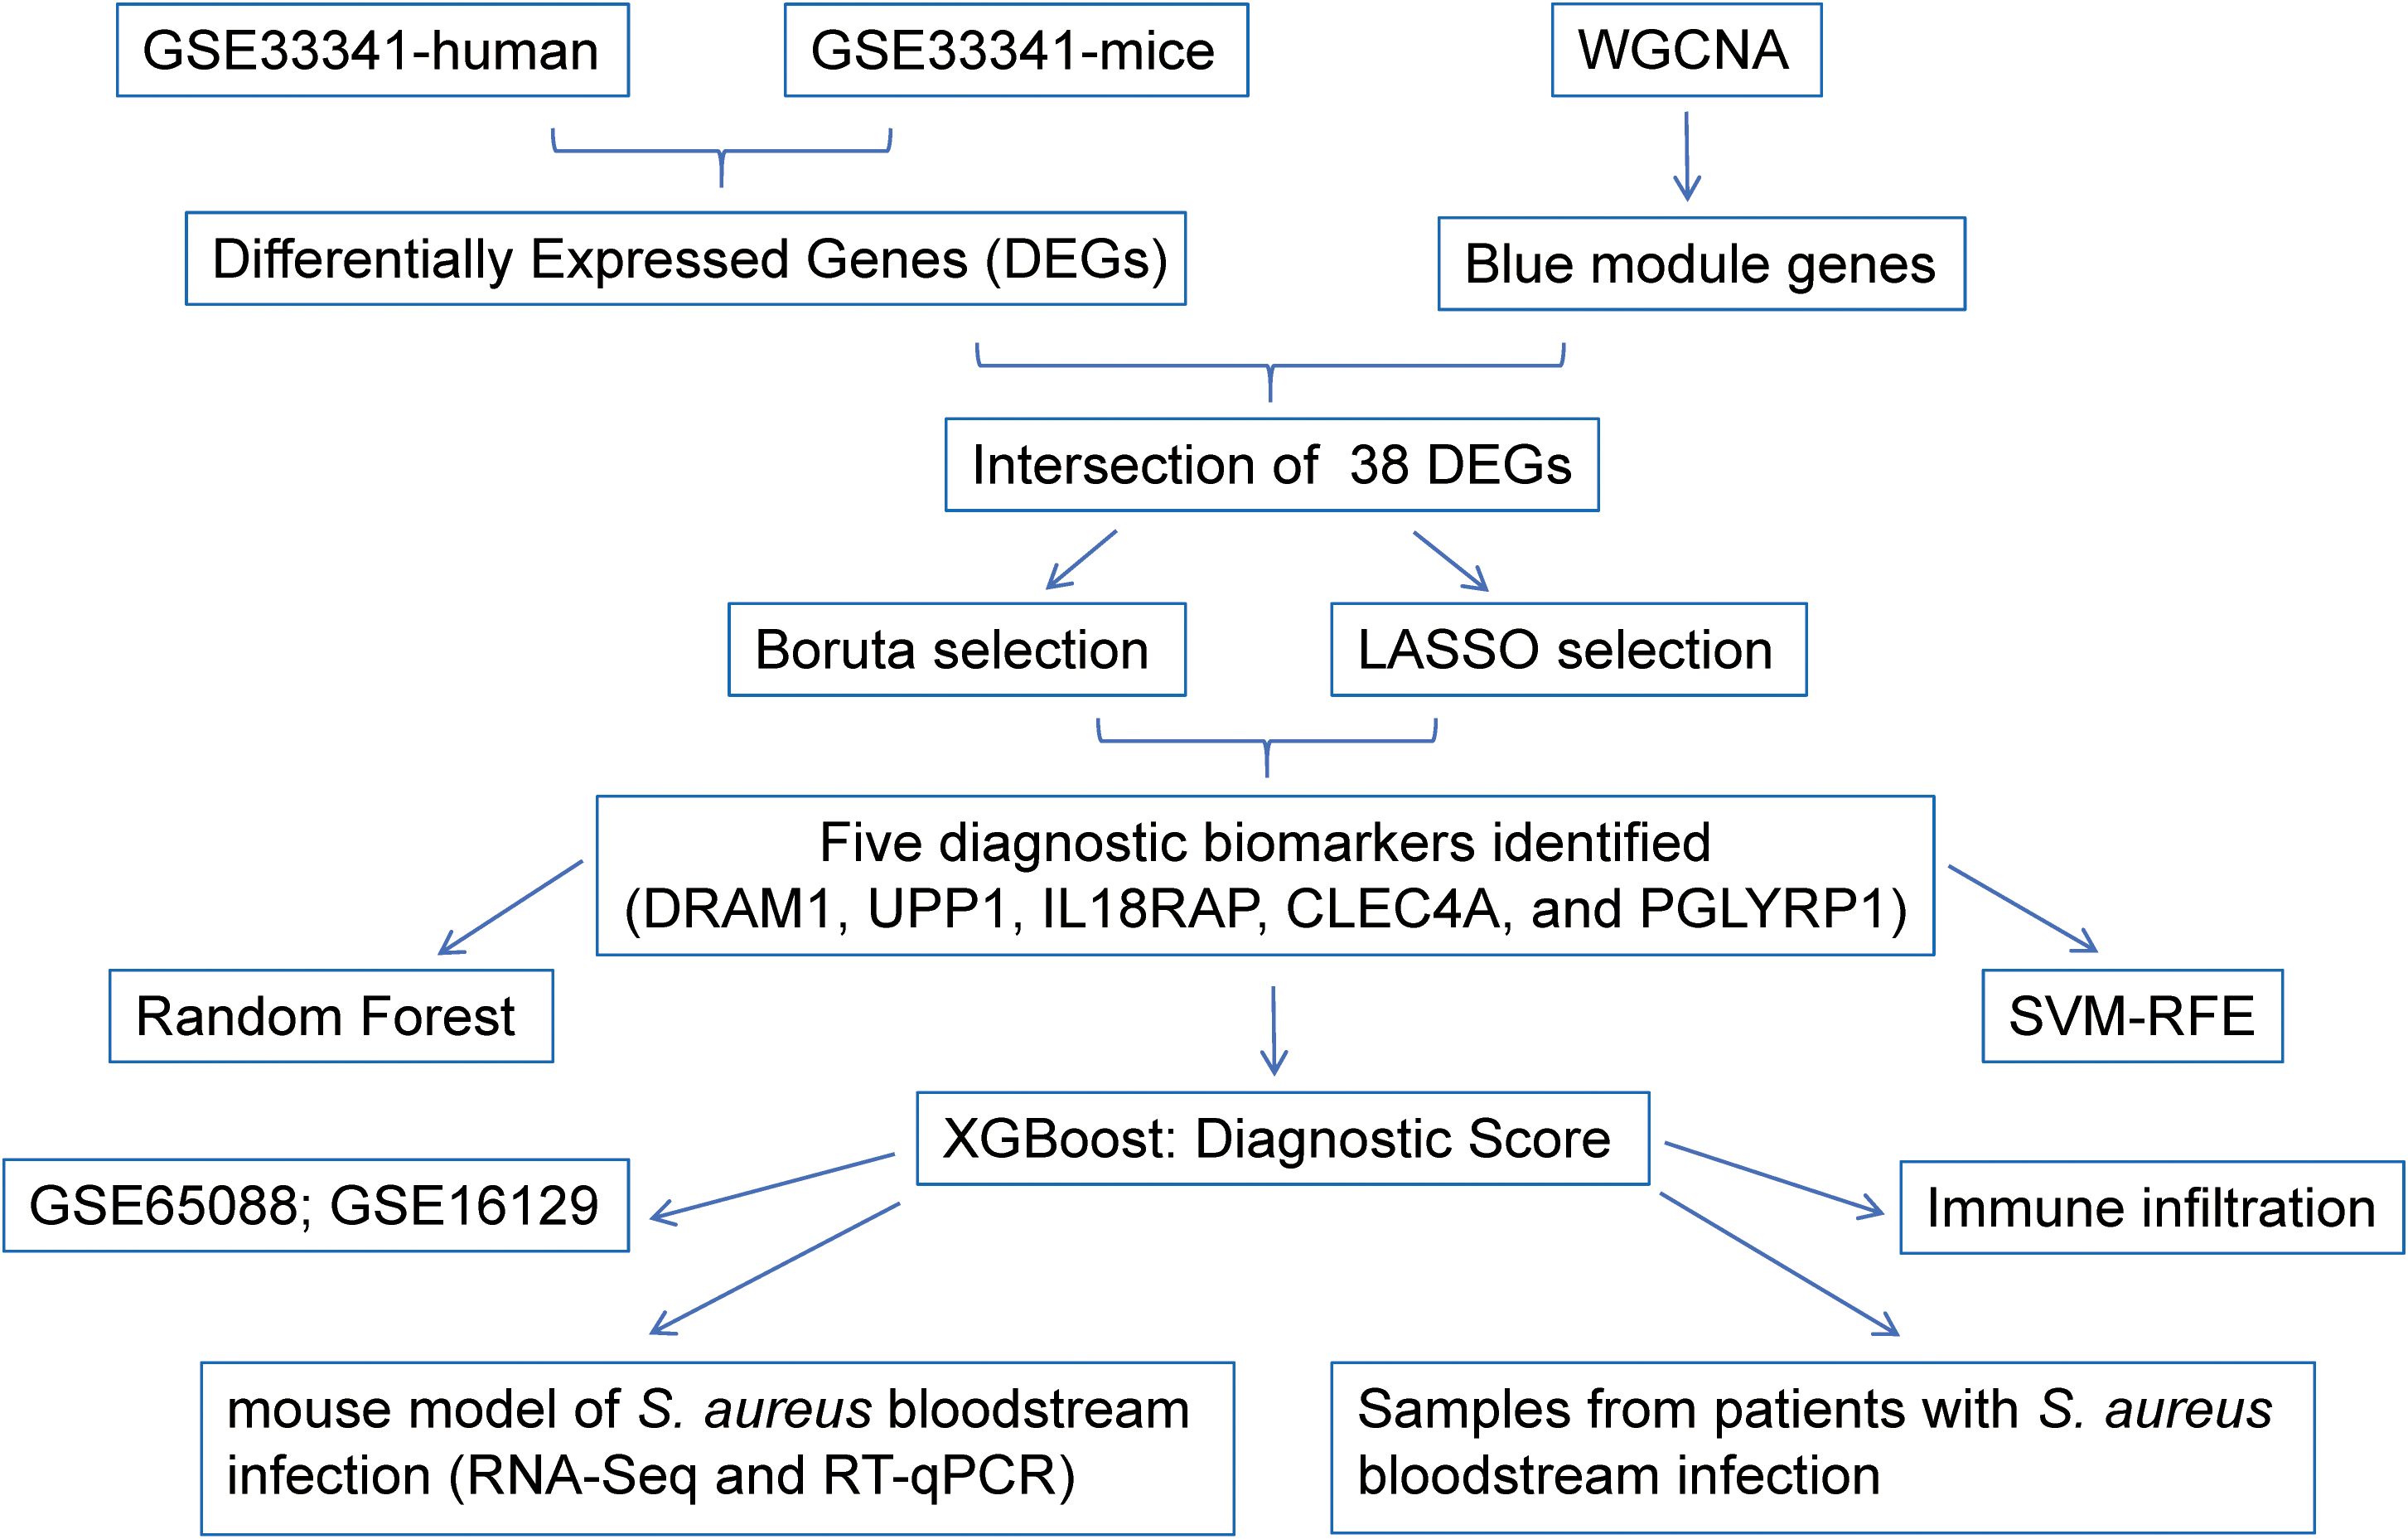
Figure 1. Schematic presentation of the analysis process.
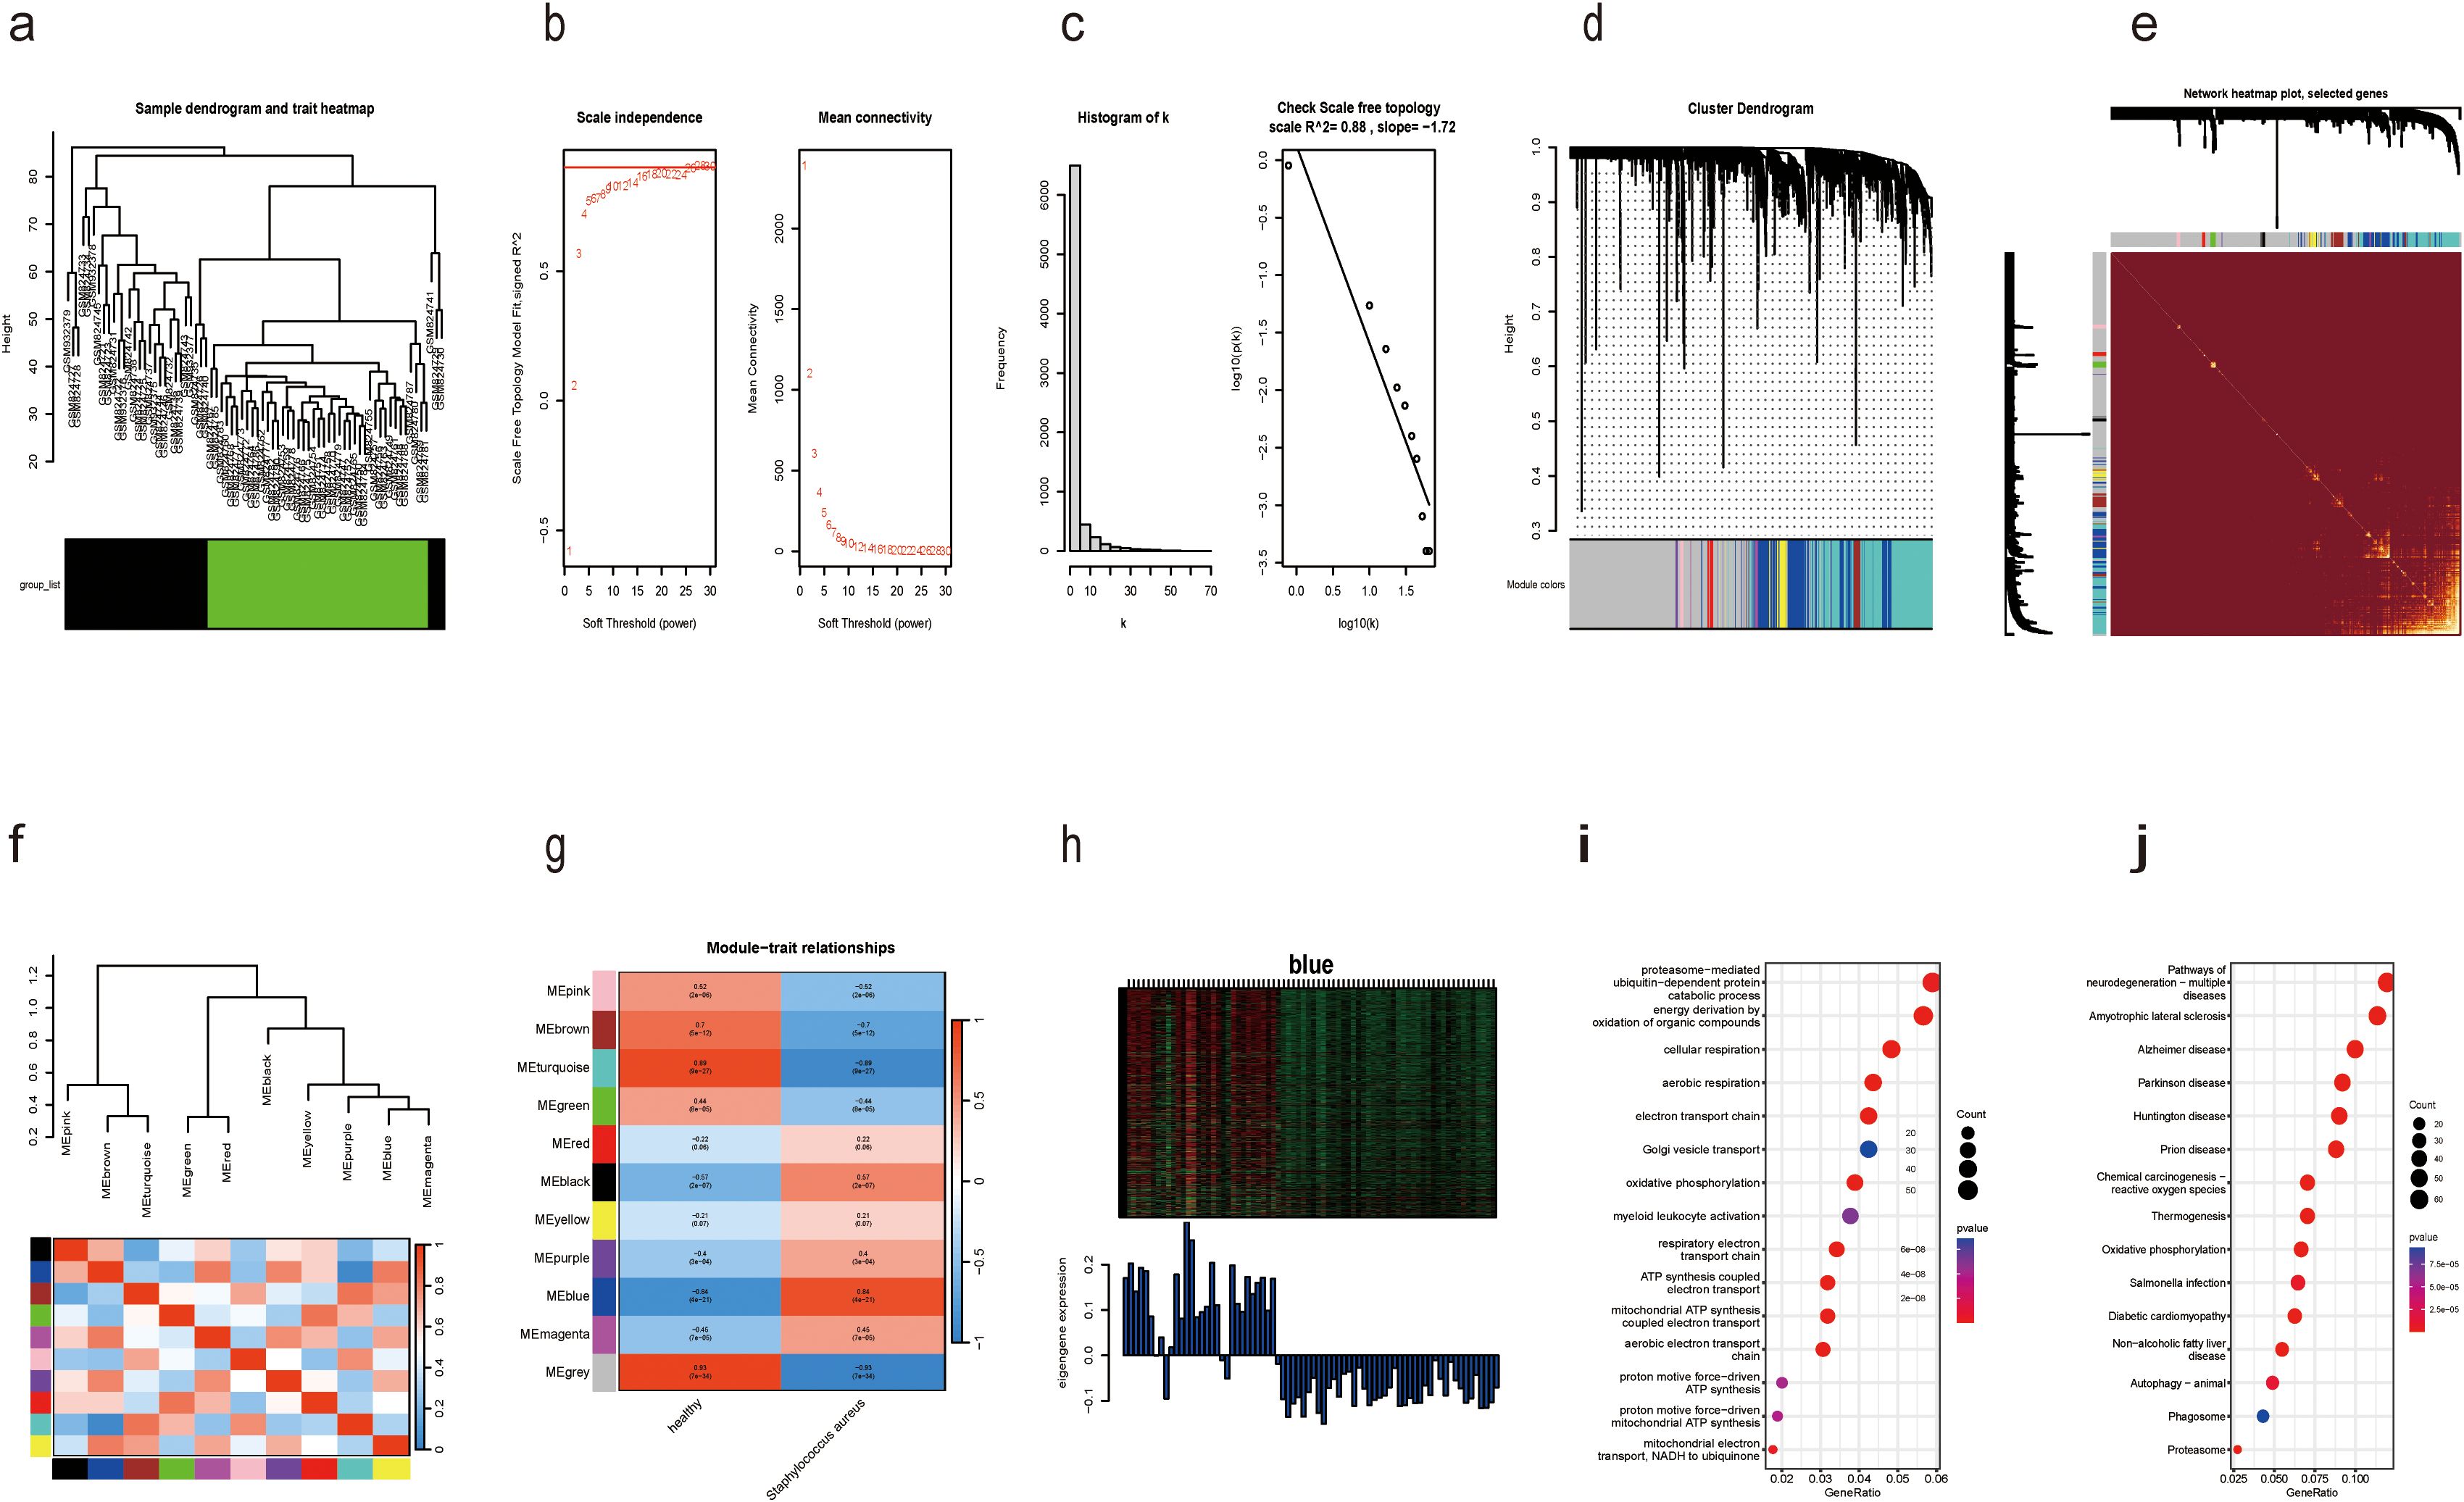
Figure 2. Identification of modules associated with S. aureus bloodstream infection using WGCNA. (a) Dendrogram of sample clustering; (b) Soft threshold selection in the WGCNA. Scale independence and mean connectivity were used for soft threshold selection in WGCNA; (c) Distribution of nodes with the degree of connection, (k) Correlation of log (k) and log [P(k)]; (d) Hierarchical cluster trees showing coexpression modules identified by WGCNA; (e) Interaction relationship analysis of coexpressed genes. Different colors of the horizontal and vertical axes represent different modules. The brightness line in the middle represents the degree of connectivity of different modules; (f) Hierarchical clustering dendrogram of module eigengenes with color labels; (g) Module–trait relationships. Each cell contains the corresponding correlation and p-value. The table is color-coded by correlation according to the color legend; (h) Expression heatmap of the blue module and feature vector gene histogram of the blue module; (i) GO analysis of the enriched genes in the blue module; (j) The KEGG pathways of the enriched genes in the blue module.
The diagnostic score of S. aureus bloodstream infection constructed by XGBoost exhibited the most superior diagnostic capacity
The clinical characteristics of the two sample groups are detailed in Supplementary Table S2. Human blood samples from GSE33341 included 31 S. aureus infection samples and 43 control samples; mouse blood samples from GSE33341 comprised 103 S. aureus infection samples and 64 control samples. The up-regulated genes in the human and mice S. aureus infection groups facilitated the identification of 63 DEGs. An intersection of these DEGs with the 950 genes identified in the blue module via WGCNA yielded a total of 38 overlapping genes (Figure 3A). We further employed Boruta and LASSO algorithms to identify feature genes (Figures 3B, C). Eventually, both algorithms pinpointed DRAM1, UPP1, IL18RAP, CLEC4A, and PGLYRP1 as potential diagnostic markers (Figures 3D, E).
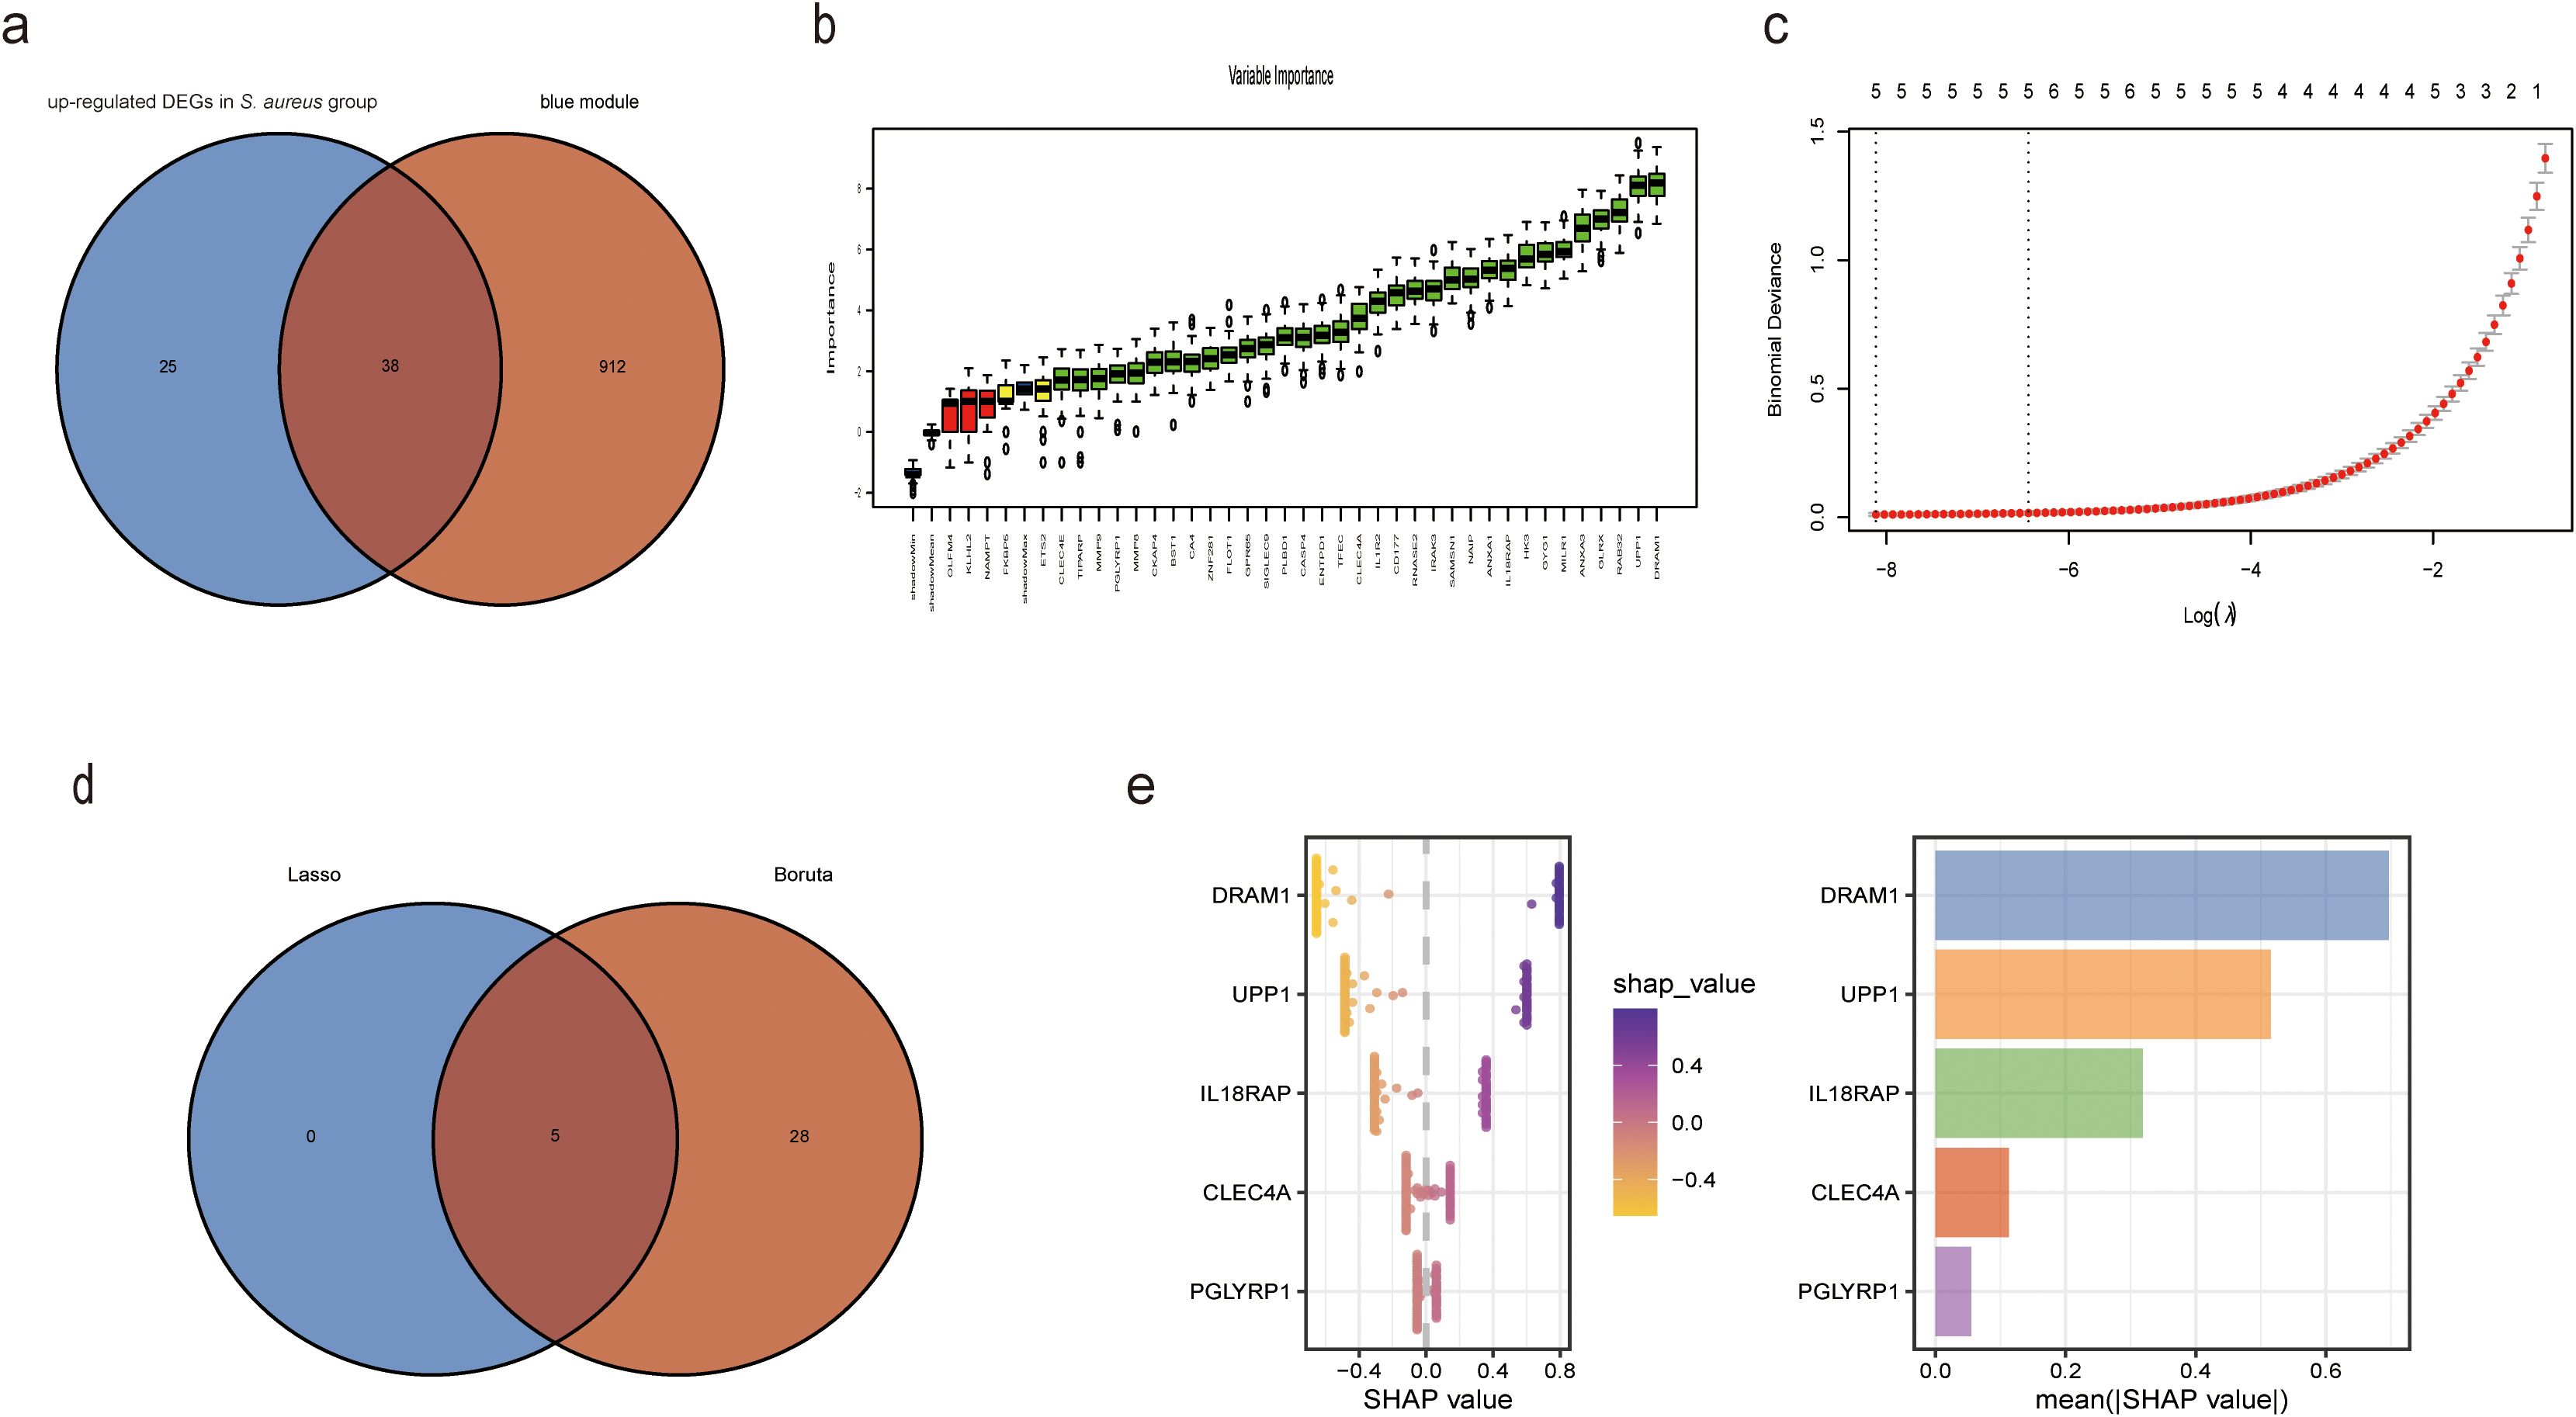
Figure 3. XGBoost algorithm was employed to generate the Diagnostic Score for S. aureus bloodstream infection. (a) Venn plot of the intersected genes that were obtained by DEGs in S. aureus bloodstream group and blue module; (b) Based on Boruta to screen biomarkers; (c) Based on LASSO regression analysis to screen biomarkers; (d) Venn diagram showing the intersection of diagnostic markers obtained by the two algorithms; (e) In accordance with their mean absolute values, SHAP beeswarm plot for the five features demonstrate the relationship between these features and S. aureus bloodstream infection. Each point represents one patient. High values of the features were shown in red and low values were shown inblue. SHAP analysis exhibits the average impact on model output.
To originate a Diagnostic Score for S. aureus bloodstream infection utilizing these five identified genes, we applied XGBoost alongside SVM-RFE and RF algorithms. In Figures 4E-H and Figure 5, ROC curves derived from four datasets were presented separately for XGBoost algorithm, SVM-RFE, and RF analyses; notably, the XGBoost algorithm exhibited the highest mean AUC values (mean AUC for XGBoost =0.954; mean AUC for SVM-RFE =0.93275; mean AUC for RF =0.94625). Consequently, we confirmed that the diagnostic model constructed by XGBoost demonstrated exceptional diagnostic capability regarding S. aureus bloodstream infection.
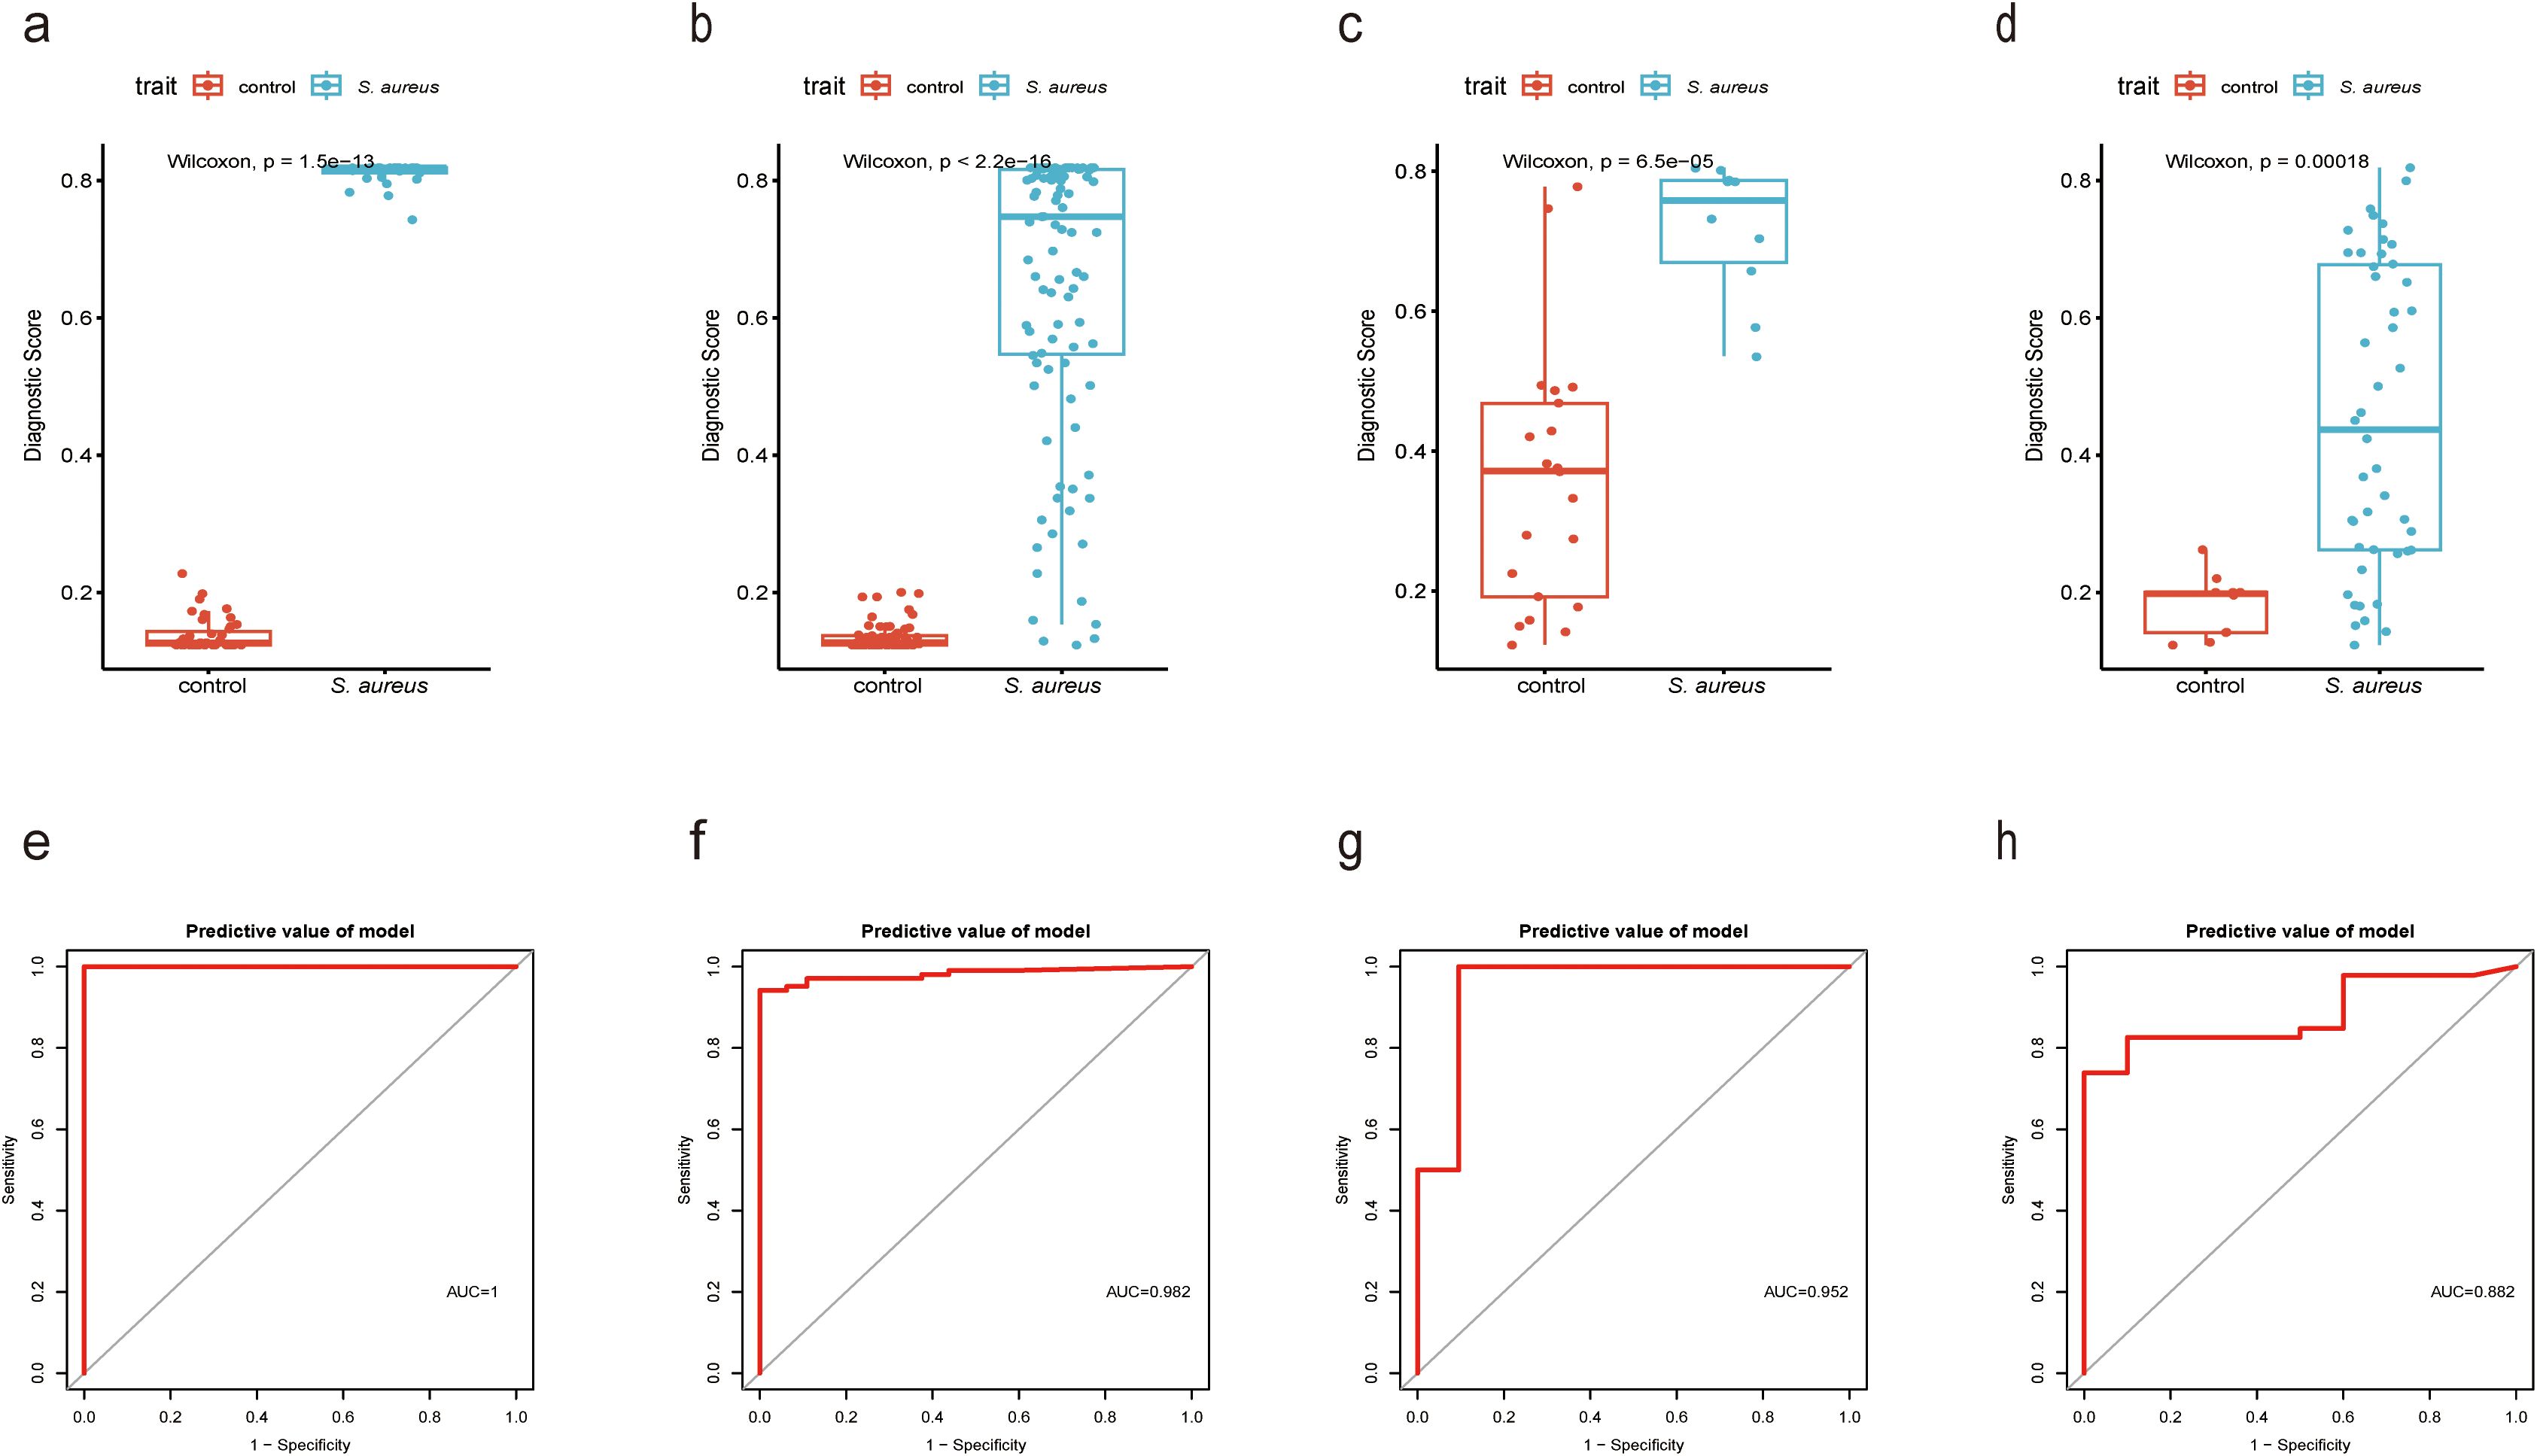
Figure 4. Performance of XGBoost evaluation on training and validation datasets. (a) Boxplot showed the expression of Diagnostic Score between the S. aureus infection group and control group in GSE33341 human group by XGBoost; (b) Boxplot showed the expression of Diagnostic Score between the S. aureus infection group and control group in GSE33341 mice group by XGBoost; (c) Boxplot showed the expression of Diagnostic Score between the S. aureus infection group and control group in GSE65088 by XGBoost; (d) Boxplot showed the expression of Diagnostic Score between the S. aureus infection group and control group in GSE16129 by XGBoost; (e) The ROC curve of the diagnostic efficacy verification of Diagnostic Score between the S. aureus infection group and control group in GSE33341 human group by XGBoost; (f) The ROC curve of the diagnostic efficacy verification of Diagnostic Score between the S. aureus infection group and control group in GSE33341 mice group by XGBoost; (g) The ROC curve of the diagnostic efficacy verification of Diagnostic Score between the S. aureus infection group and control group in GSE65088 by XGBoost; (h) The ROC curve of the diagnostic efficacy verification of Diagnostic Score between the S. aureus infection group and control group in GSE16129 by XGBoost.
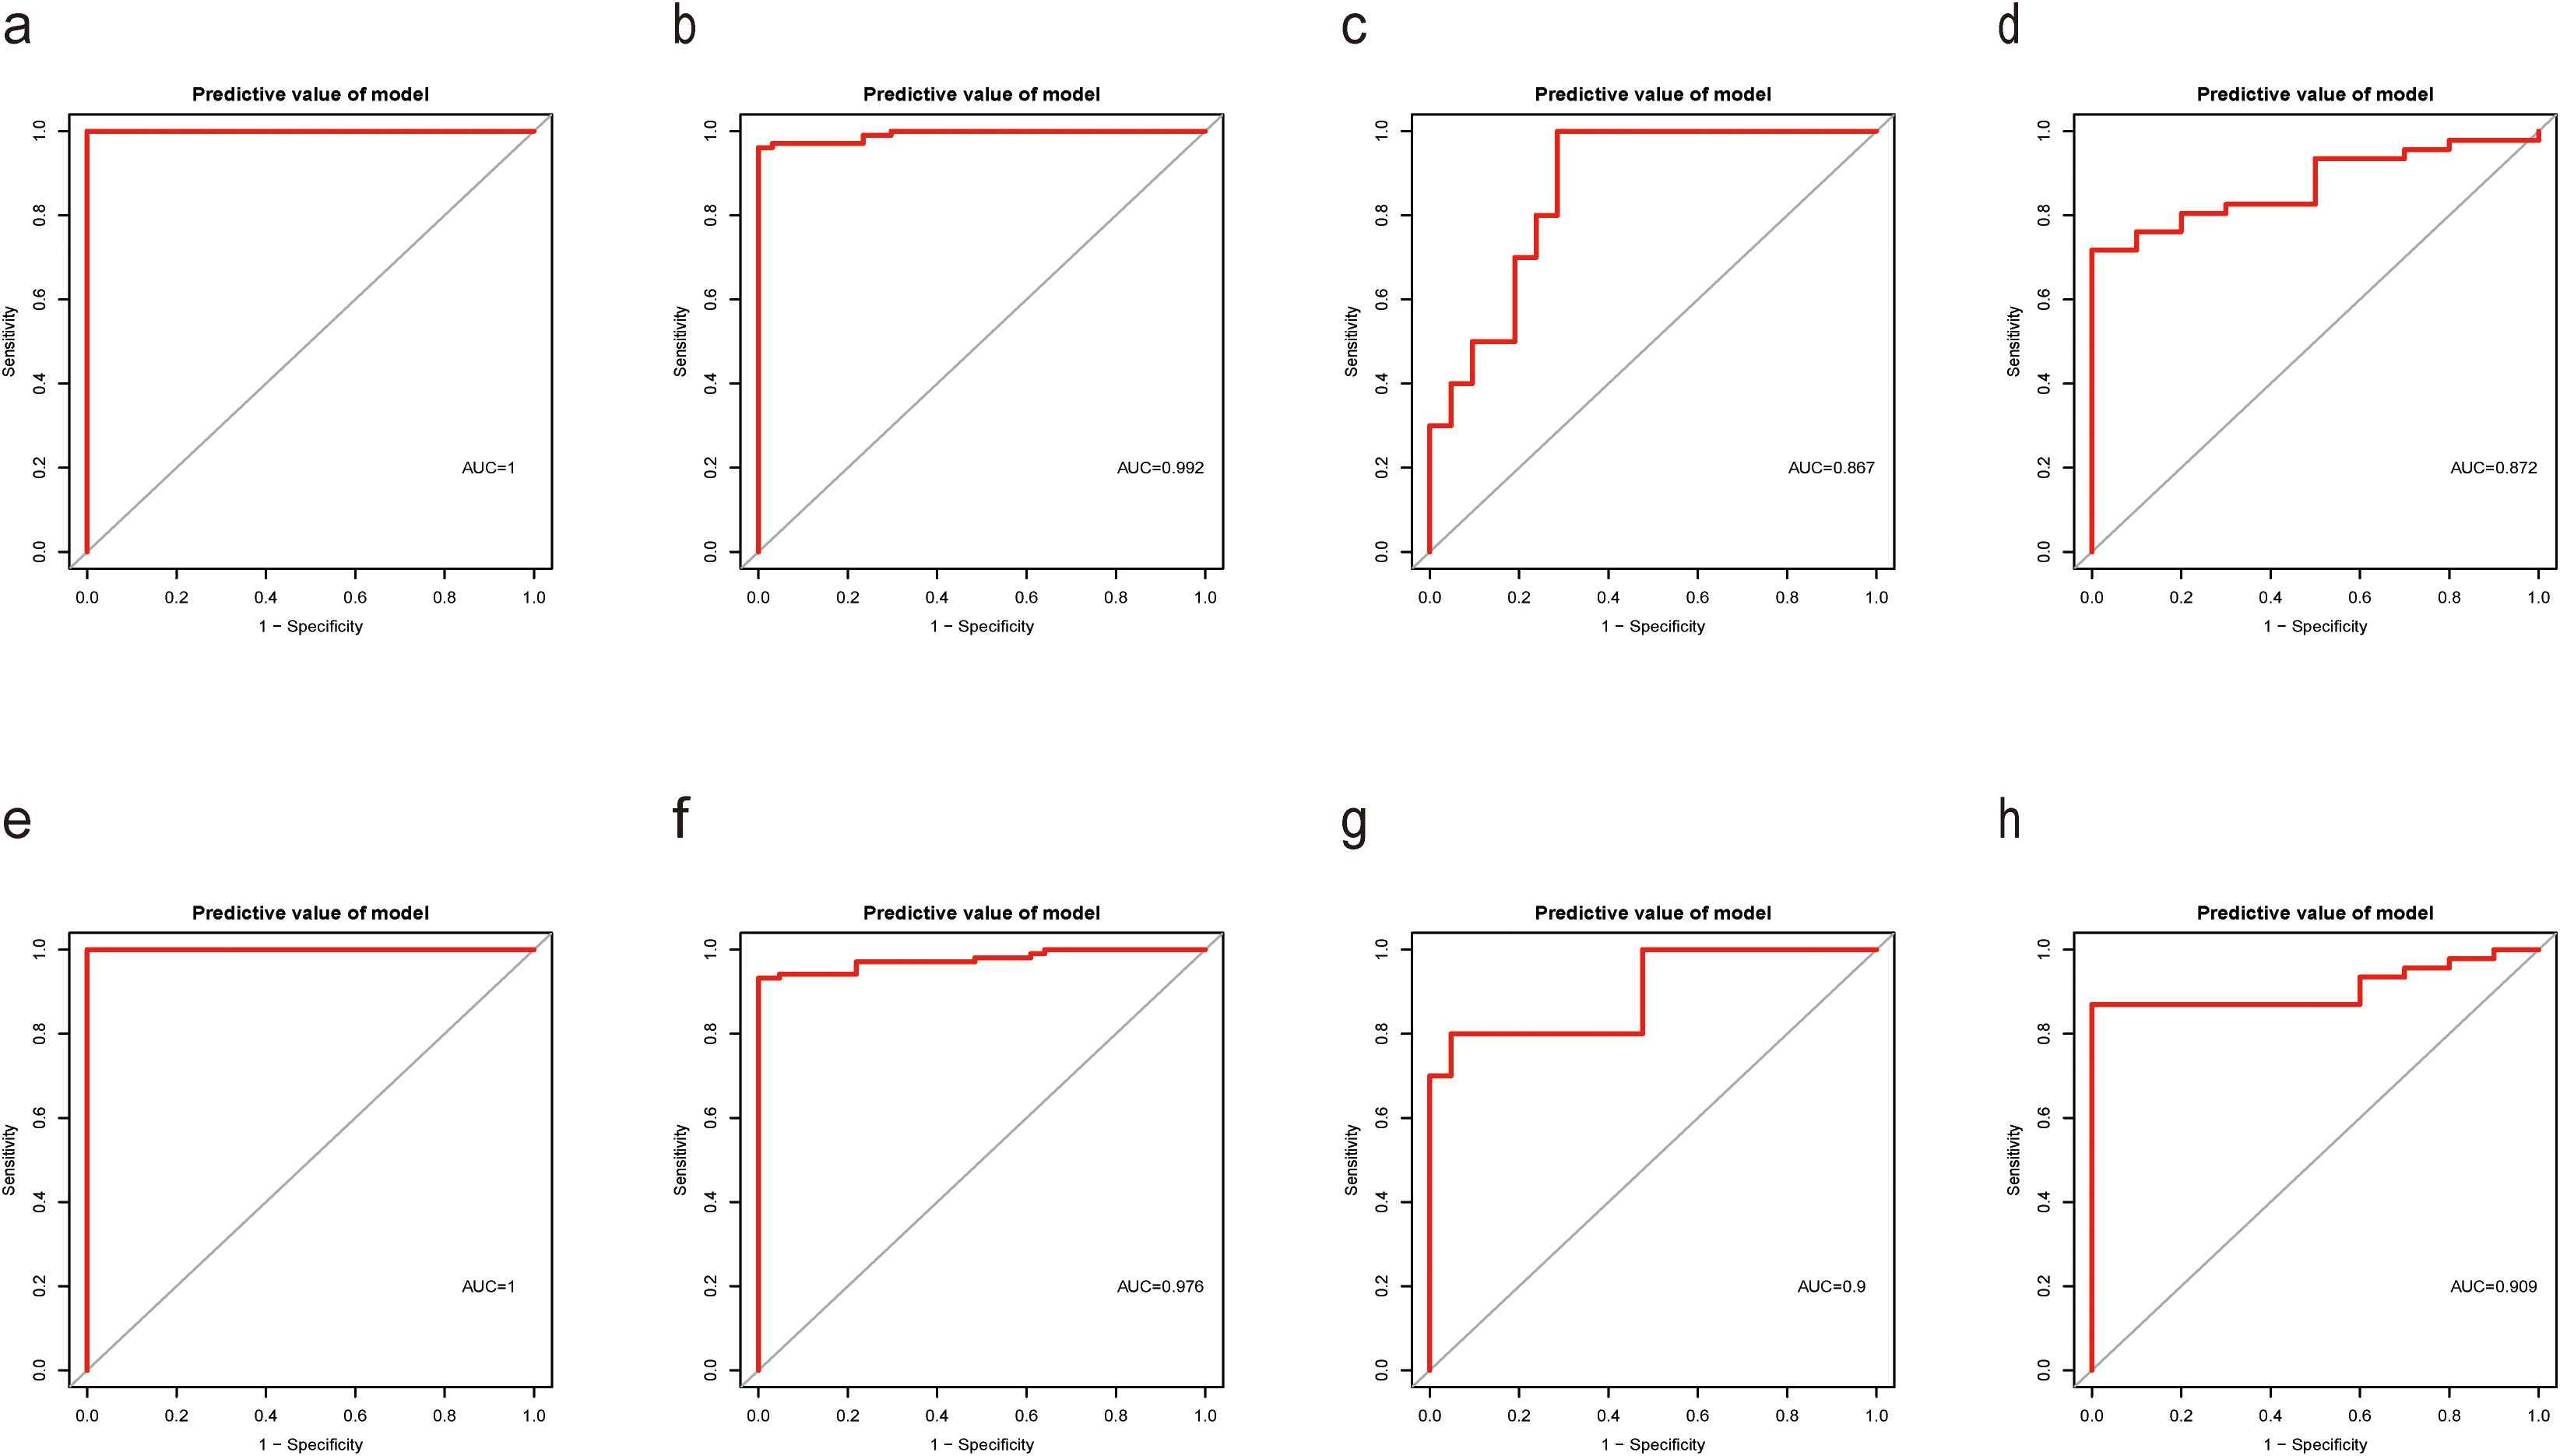
Figure 5. Performance of SVM-RFE and RF models on training and validation datasets. (a) The ROC curve of the diagnostic efficacy verification of Diagnostic Score between the S. aureus infection group and control group in GSE33341 human group by SVM-RFE; (b) The ROC curve of the diagnostic efficacy verification of Diagnostic Score between the S. aureus infection group and control group in GSE33341 mice group by SVM-RFE; (c) The ROC curve of the diagnostic efficacy verification of Diagnostic Score between the S. aureus infection group and control group in GSE65088 by SVM-RFE; (d) The ROC curve of the diagnostic efficacy verification of Diagnostic Score between the S. aureus infection group and control group in GSE16129 by SVM-RFE; (e) The ROC curve of the diagnostic efficacy verification of Diagnostic Score between the S. aureus infection group and control group in GSE33341 human group by RF; (f) The ROC curve of the diagnostic efficacy verification of Diagnostic Score between the S. aureus infection group and control group in GSE33341 mice group by RF; (g) The ROC curve of the diagnostic efficacy verification of Diagnostic Score between the S. aureus infection group and control group in GSE65088 by RF; (h) The ROC curve of the diagnostic efficacy verification of Diagnostic Score between the S. aureus infection group and control group in GSE16129 by RF.
In addition, in the GSE33341 human and mouse groups, the Diagnostic Score was not only highly expressed in the S. aureus infection group (Figures 4A, B) but also demonstrated good diagnostic efficacy between S. aureus and the control group (Figures 4E, F). Besides, GSE65088 and GSE16129 were acquired to validate the above findings. A significantly elevated Diagnostic Score in the S. aureus group was observed (Figures 4C, D), accompanied by high AUC values (Figures 4G, H), indicating that the Diagnostic Score possessed considerable predictive power.
Assessment of immune cell infiltration
To evaluate the difference in immune cell infiltration between the S. aureus infection group and the control group, we availed the CIBERSORT algorithm to calculate the infiltration of 22 immune cell types for human samples from GSE33341, while using ImmuCellAI to analyze the infiltration of 36 immune cells for mouse samples from GSE33341.
Boxplots were constructed to represent each sample based on distinct subpopulation infiltrations The boxplots revealed significant infiltration of monocytes, neutrophils, and M2 macrophages within both human and mouse samples from the S. aureus group. In contrast, higher infiltration of CD4 naive T cells, CD8 T cells, and Tregs was noted in both human and mouse control groups (Figures 6A, D). For human samples from GSE33341, the analysis implied that activated NK cells exhibited a strong positive relevance with activated mast cells; nevertheless, CD4 naive T cells displayed a notable negative association with neutrophils (Figure 6B). Similarly, relationships among immune cells derived from mouse samples highlighted that CD4 T cells showed strong positive correlations with both CD4 Tm cells as well as CD4 naive T cells; conversely, macrophages exhibited a marked negative association with T cell populations (Figure 6E).
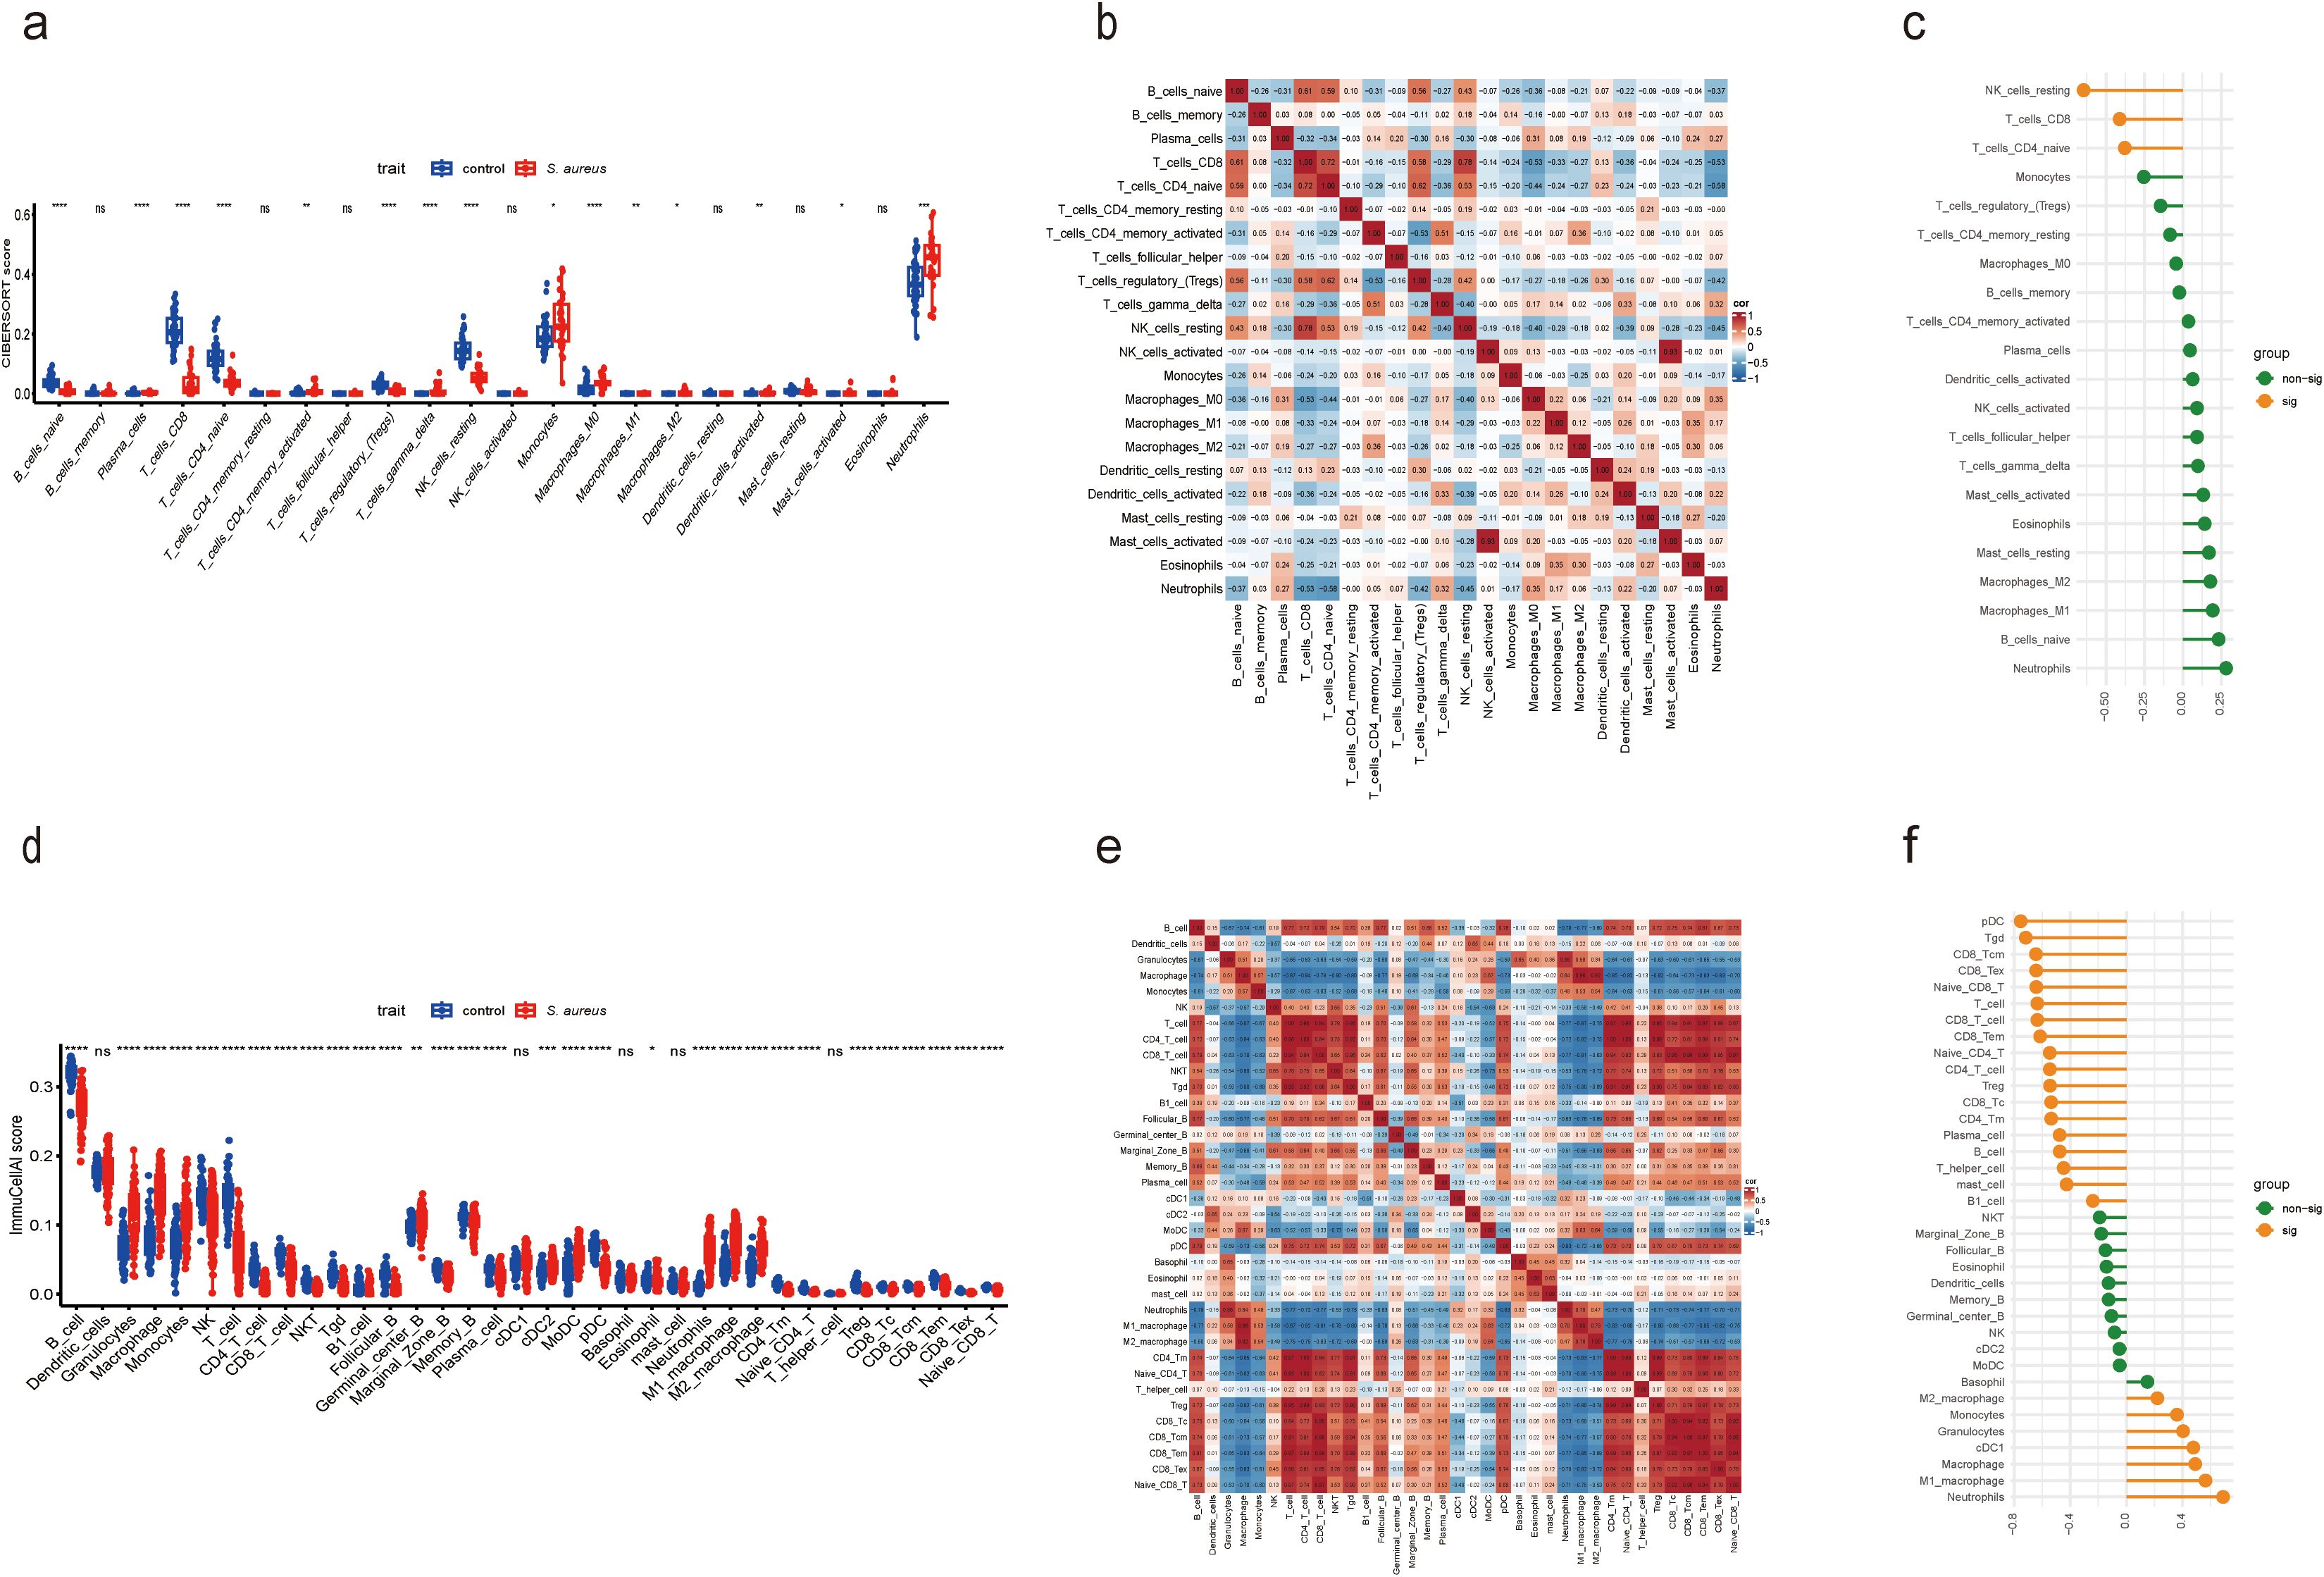
Figure 6. Compared and correlated in immune cell infiltration. (a) Boxplot showed the distinct fractions compared to each immune cell between the S. aureus and control group in GSE33341 human samples. (b) Analysis of correlations among 22 immune cell subtypes in GSE33341 human samples. The horizontal and vertical axes represented the names of immune cells, and the values stood for the correlation coefficients between immune cells. Red denoted a positive correlation, while blue denoted a negative correlation. (c) Correlation between Diagnostic Score and immune cells in GSE33341 human samples. (d) Boxplot showed the distinct fractions compared to each immune cell between the S. aureus and control group in GSE33341 mouse samples. (e) Analysis of correlations among 36 immune cell subtypes in GSE33341 mouse samples. The horizontal and vertical axes represented the names of immune cells, and the values stood for the correlation coefficients between immune cells. Red denoted a positive correlation, while blue denoted a negative correlation. (f) Correlation between Diagnostic Score and immune cells in GSE33341 mouse samples. *P < 0.05, **P < 0.01, ***P < 0.001, ****P < 0.0001, ns, not significant.
By coincidence, we ascertained that the Diagnostic Score was significantly negatively germane to CD8 T cells and CD4 naive T cells in human samples from GSE33341 (Figure 6C), which was highly consistent with the results in mouse samples from GSE33341 (Figure 6F). Meanwhile, the human data manifested a notable negative correlation between the Diagnostic Score and resting NK cells as well. In addition, our analysis reflected that the Diagnostic Score for mouse samples was notably positively correlated with neutrophils, macrophages, cDC1, granulocytes, and monocytes. However, there was a significant negative association between the Diagnostic Score and various immune cell types including pDCs, Tgd cells, B cells, T cells, Tregs, as well as both CD8 Tcm and naive CD8 T cells (Figure 6F).
The aforementioned analytical results suggest that the Diagnostic Score was significantly negatively associated with both CD8 T cells and CD4 naive T cells across human and mouse samples. The development of immunological prophylaxis and therapy targeting S. aureus represents an appealing objective. Our findings endorsed a pragmatic application of the Diagnostic Score for identifying potential patients at risk for S. aureus bloodstream infection who may benefit from immunotherapy. The relationship between these genes and immune infiltrating cells underscores their potential role in the pathogenesis of S. aureus bloodstream infection while offering new insights for early detection and treatment strategies.
Validation for the expression difference and diagnostic value of the diagnostic score by a mouse model and patient samples
To further validate the diagnostic utility of the Diagnostic Score, we established a mouse model of S. aureus bloodstream infection and collected blood samples for RNA-Seq analysis in our previous study (46)and RT-qPCR experiments. The choice of the S. aureus Newman strain was based on its characterization as a hypervirulent strain that has been extensively utilized in various models involving S. aureus infections. The results from RNA-Seq analysis corroborated our previous findings (Figure 7A), with ROC curve analyses indicating a high diagnostic value for the Diagnostic Score (Figure 7D). Furthermore, RT-qPCR results proved that the expression levels associated with the Diagnostic Score were significantly elevated in the S. aureus Newman treatment group compared to those in the control group (Figure 7B), thereby reinforcing its diagnostic significance (Figure 7E). Most importantly, the analysis of clinical samples collected by our team confirmed that Diagnostic Score was significantly overexpressed in patients with S. aureus bloodstream infection (Figure 7C), demonstrating high diagnostic value (Figure 7F).
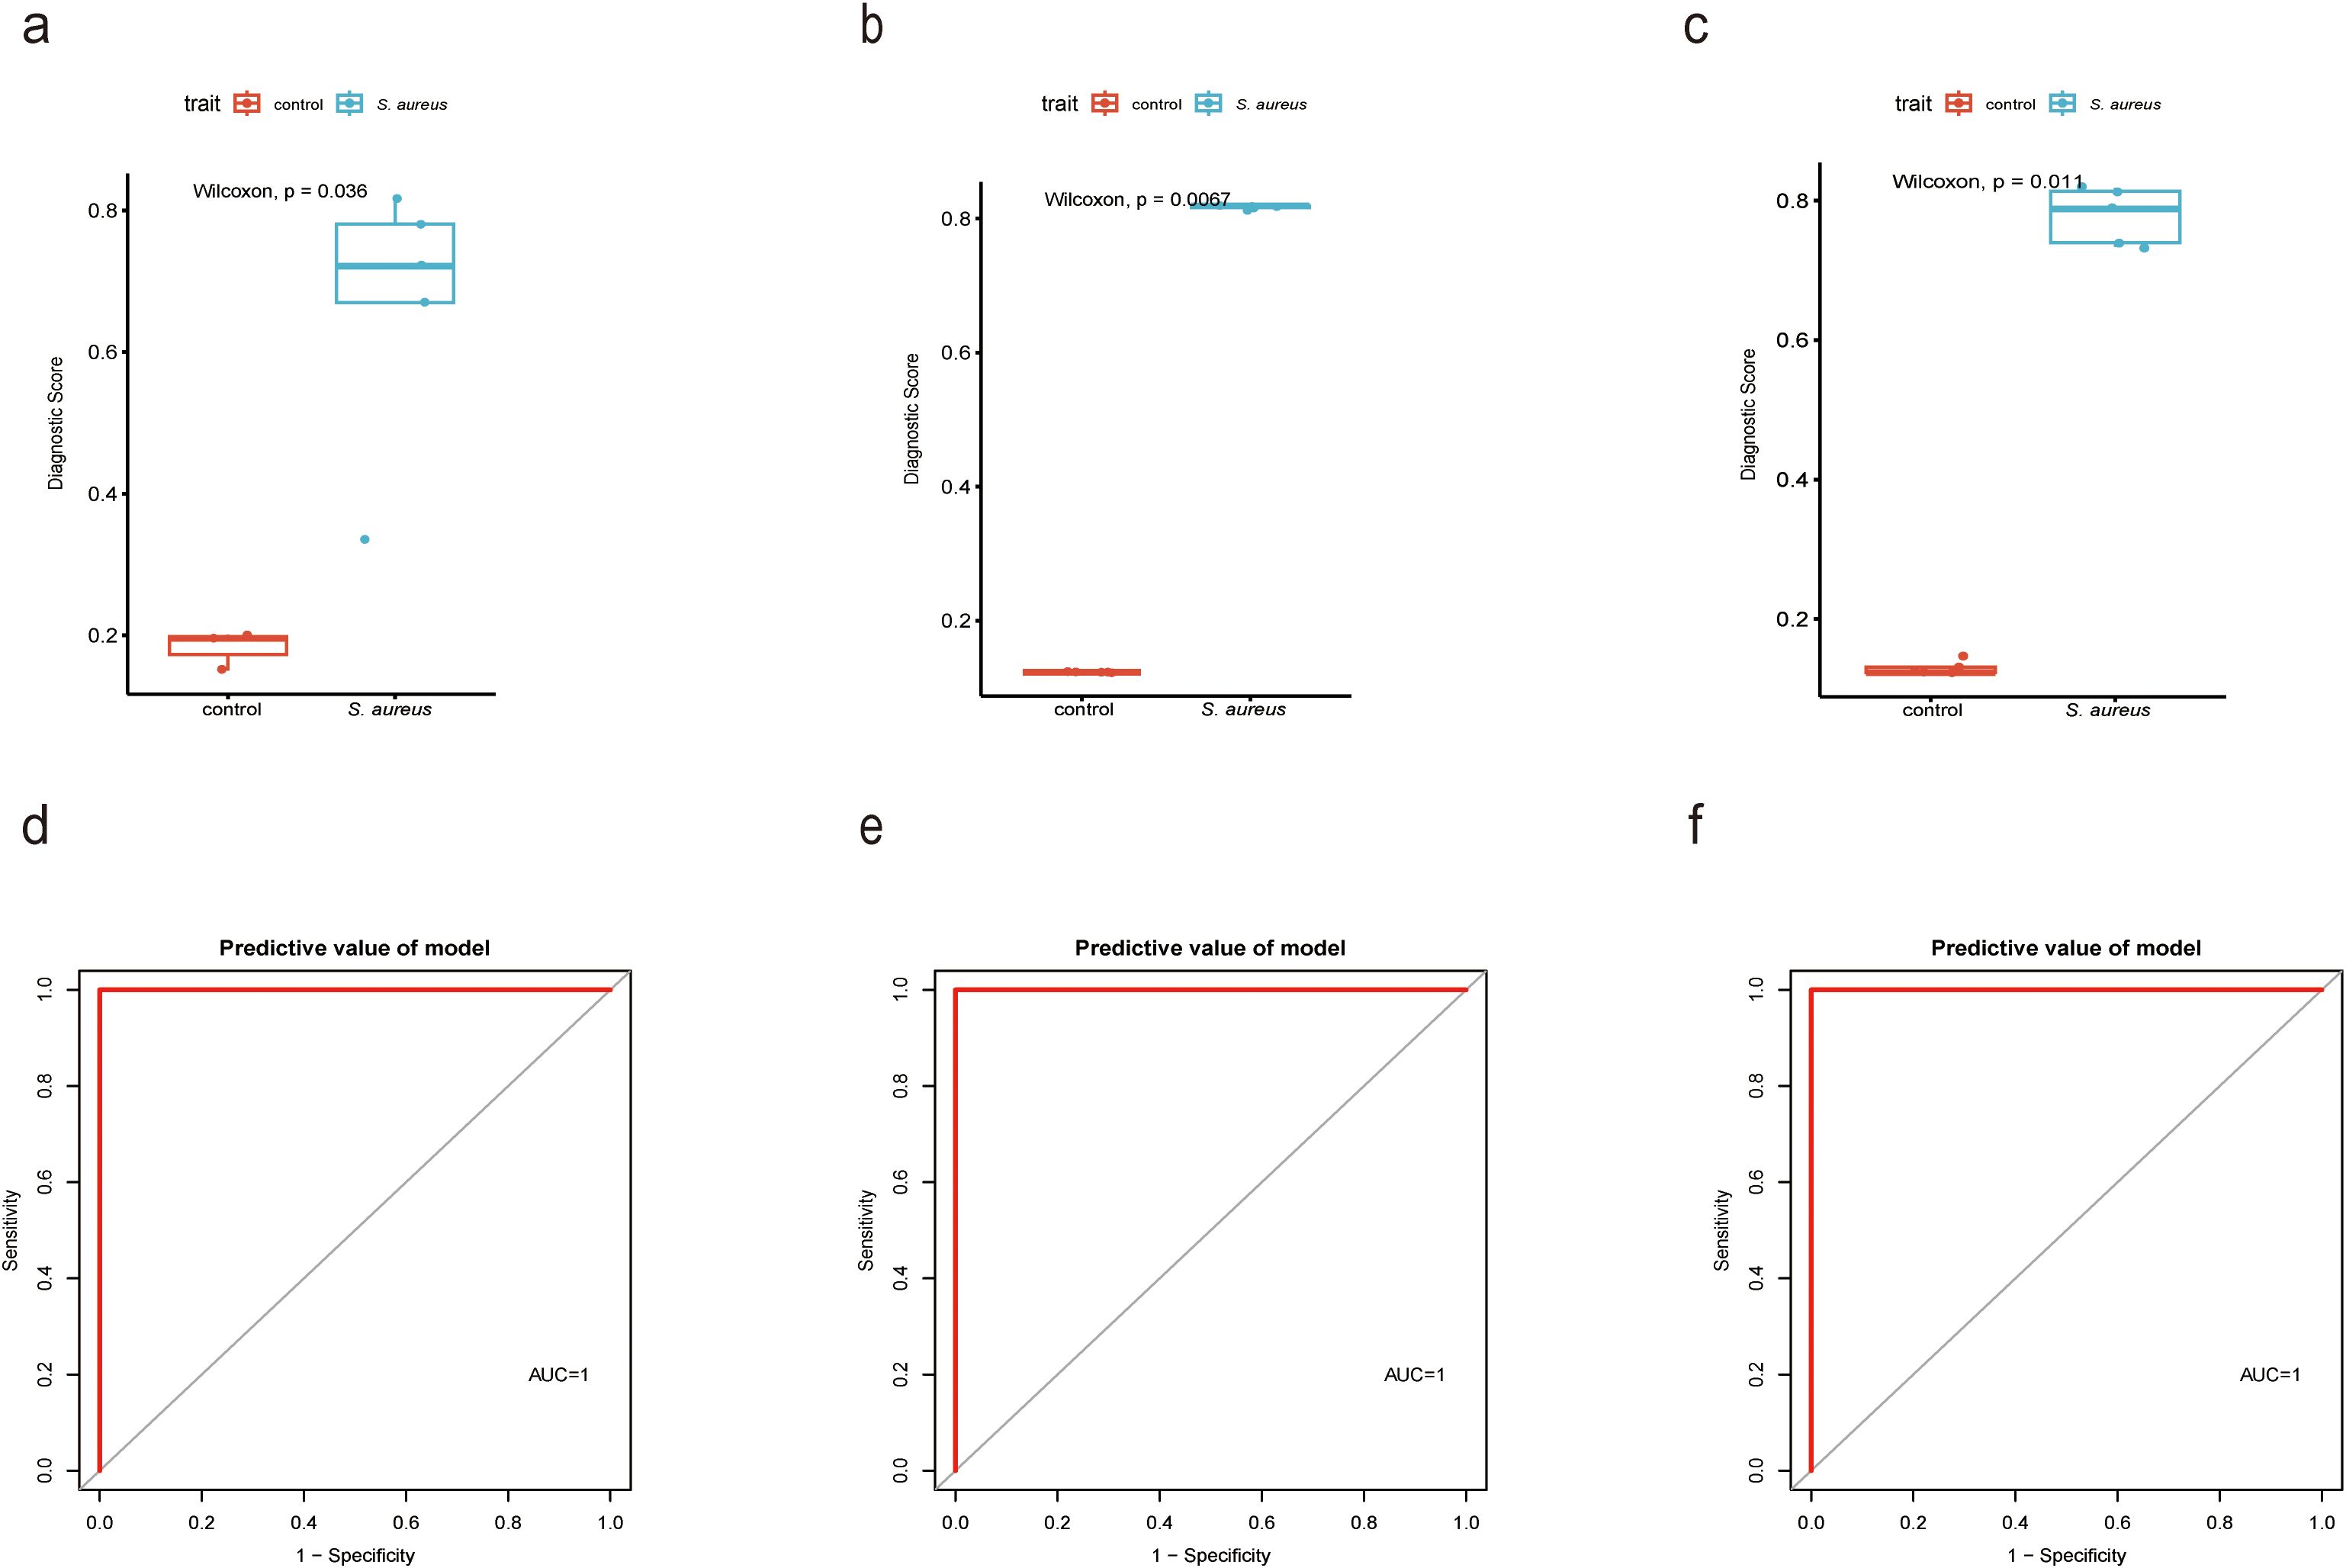
Figure 7. Validation for the diagnostic value of the Diagnostic Score by a mouse model and patient samples. (a) Boxplot showed the expression of Diagnostic Score between the S. aureus infection group and control group in RNAseq analysis by XGBoost; (b) Boxplot showed the expression of Diagnostic Score between the S. aureus infection group and control group in RT-qPCR results from mouse samples by XGBoost; (c) Boxplot showed the expression of Diagnostic Score between the S. aureus infection group and control group in RT-qPCR results from patients samples by XGBoost; (d) The ROC curve of the diagnostic efficacy verification of Diagnostic Score between the S. aureus infection group and control group in RNAseq analysis by XGBoost. (e) The ROC curve of the diagnostic efficacy verification of Diagnostic Score between the S. aureus infection group and control group in RT-qPCR results from mouse samples by XGBoost; (f) The ROC curve of the diagnostic efficacy verification of Diagnostic Score between the S. aureus infection group and control group in RT-qPCR results from patients samples by XGBoost.
Discussion
S. aureus is a prevalent bacterial pathogen responsible for bloodstream infection, with an annual incidence ranging from 12 to 18 cases per 100,000 populations (47–49). Despite a decline in the case fatality rate associated with S. aureus bloodstream infection over the past three decades, this rate remains alarmingly high at approximately 27% within three months post-infection (50–52). In the realm of sepsis management, advanced machine-learning approaches have been shown to significantly improve the accuracy of short-term outcome predictions, such as 30-day mortality rates, thereby underscoring their potential advantages over traditional models (53). To provide more comprehensive diagnostic information and optimize diagnostic precision, this study harnessed machine-learning integration methods aimed at optimizing predictive model presentation through the utilization of multiple algorithms.
To accurately identify key genes associated with the S. aureus infection phenotype, we constructed a gene co-expression network adopting the WGCNA algorithm. By intersecting genes from the blue module identified through WGCNA screening with up-regulated DEGs in S. aureus infection samples, we obtained a total of 38 candidate genes. Subsequently, two algorithms including Boruta and LASSO regression analysis, were employed to pinpoint DRAM1, UPP1, IL18RAP, CLEC4A, and PGLYRP1 as potential diagnostic markers. Most importantly, we applied XGBoost alongside SVM-RFE and RF algorithms to derive Diagnostic Scores for S. aureus bloodstream infection based on these five identified genes. Comparative analyses revealed that XGBoost outperformed other models and exhibited exceptional diagnostic capabilities for detecting S. aureus bloodstream infection. To conclude, we designated the XGBoost algorithm as instrumental in defining five genes as part of our proposed Diagnostic Score for S. aureus bloodstream infection. In summary, the XGBoost Diagnostic Score represents a novel approach to diagnosing S. aureus bloodstream infection that holds considerable clinical promise.
In recent years, many studies in the field of bacterial infection immunology have focused on the five genes mentioned above. DNA damage-regulated autophagy regulator 1 (DRAM1) is a stress-induced regulator that regulates autophagy and cell death (54). A study published in Nature suggested that DRAM1 was relevant to interferon-induced expression signature in tuberculosis patients (55). Vaart et al. confirmed that DRAM1 linked mycobacterial recognition via TLR-MYD88 to autophagic defense (56). Uridine phosphorylase 1 (UPP1) encodes uridine phosphorylase, a key enzyme that regulates intracellular uridine and 2’-deoxyuridine metabolism (57). Research conducted by Hamasaki et al. revealed that UPP1 was upregulated in all three brain regions of sepsis-associated encephalopathy samples (58). Moreover, Fan et al. identified UPP1 as a notable diagnostic marker for pediatric septic shock (59). Interleukin 18 receptor accessory protein (IL18RAP) encodes the accessory subunit of the heterodimeric receptor for interleukin 18 (IL18), a proinflammatory cytokine involved in inducing cell-mediated immunity (60). This protein enhances the IL18-binding activity of the IL18 receptor and plays a role in signaling by IL18 (61). Chen et al. disclosed that IL18RAP might be closely linked with Escherichia coli (E. coli)-induced sepsis (62). A study conducted by Vaher pointed out that the NLRP1-dependent inflammasome could be activated in the skin by S. aureus, which may lead to increased levels of the IL-18 and IL-1b cytokines in the skin and thereby contribute to the development of atopic dermatitis, especially in more susceptible individuals with respective sequence variants in the IL18RAP gene (63). Apart from that, C-type lectin domain family 4 member A (CLEC4A) encodes a member of the C-type lectin/C-type lectin-like domain (CTL/CTLD) superfamily. Members of this family share a common protein fold and have diverse functions, such as cell adhesion, cell-cell signaling, glycoprotein turnover, and roles in inflammation and immune response (64). Zhang et al. identified CLEC4A as a potential prognostic marker for Chronic lymphocytic leukemia (65). The research of Uto et al. supported that CLEC4A was a potential target for immune checkpoint blockade in tumor immunotherapy (64). Peptidoglycan recognition protein 1 (PGLYRP1) Enables several functions, including Hsp70 protein binding activity; peptidoglycan binding activity; and peptidoglycan immune receptor activity (66). Involved in antimicrobial humoral immune response mediated by antimicrobial peptide and defense response to Gram-positive bacterium (67, 68). Chen et al. confirmed that the expression of PGLYRP1 protein in S. aureus-induced mastitis tissues was significantly higher than that in healthy tissues (69). Gong et al. identified PGLYRP1 as critical in sepsis and sepsis-related Acute respiratory distress syndrome (ARDS) by bioinformatic analysis (70). Zhang et al. found that PGLYRP1 was upregulated, which may result in dysfunction of immune response in sepsis (71). The above results suggested the importance of these five genes in the field of bacterial infection. Similarly, the high expression levels associated with the Diagnostic Score constructed by these five genes were validated in our mouse bloodstream infection model and clinical patient samples, demonstrating that these five genes have good diagnostic value for S. aureus bloodstream infection.
Neutrophils are key players in the host defense against S. aureus. These cells circulate in the bloodstream and are recruited to tissues by locally produced chemoattractants following S. aureus infection (72). Although CD4 T naive cells do not directly participate in bacterial killing, they can promote S. aureus clearance by increasing the recruitment of phagocytic cells to the site of infection and by augmenting their antimicrobial activity via the production of cytokines (73, 74). During S. aureus skin infections, the bacterium stimulates the proliferation of CD8+ cytotoxic T lymphocytes (CTLs) via activation of LN-resident dendritic cells (75). Immune infiltration analysis indicated significant alterations in the immune microenvironment between S. aureus and healthy groups. Notably, the Diagnostic Score was discovered to be significantly negatively correlated with both CD8 T cells and naive CD4 T cells across human and mouse samples. Therefore, the Diagnostic Score had the potential as a biomarker for predicting responses to immunotherapy, facilitating personalized treatment strategies that mitigate unnecessary burdens on patients due to inappropriate therapies. In spite of that, this study had certain limitations. Although we have collected clinical samples from patients with S. aureus bloodstream infection for verification, the number of samples was not large enough, and more samples need to be collected for validation. Furthermore, animal and cellular models will be established to investigate the molecular mechanisms underlying S. aureus induced bloodstream infection in greater depth.
In summary, this study thoroughly investigated predictive diagnostics for S. aureus bloodstream infection using an integrated machine-learning approach. The findings accentuated that the Diagnostic Score derived from the XGBoost algorithm, incorporating five genes (DRAM1, UPP1, IL18RAP, CLEC4A, and PGLYRP1), showed promising diagnostic efficiency for bloodstream infection caused by S. aureus. These findings promise novel avenues for diagnosing and treating S. aureus bloodstream infection while contributing significantly to early diagnosis and intervention efforts aimed at improving patient outcomes through targeted therapeutic approaches.
Data availability statement
The datasets analyzed during this study are available in the GEO database (https://www.ncbi.nlm.nih.gov/geo) (GSE33341, GSE65088, and GSE16129). Further inquiries can be directed to the corresponding author.
Ethics statement
This study was approved by the Ethics Committee of Shanghai Pulmonary Hospital, School of Medicine, Tongji University, Shanghai, China. All mice experiments were carried out under the guidelines approved by the Ethics Committee of the Shanghai Pulmonary Hospital of Tongji University School, Tongji University, Shanghai (Project number: K22-183Y).
Author contributions
JS: Conceptualization, Methodology, Validation, Writing – original draft, Writing – review & editing. LC: Data curation, Writing – original draft. XY: Writing – original draft. JY: Writing – original draft. YX: Writing – original draft. LS: Writing – original draft. YH: Writing – original draft. BW: Methodology, Writing – original draft. FY: Supervision, Writing – review & editing.
Funding
The author(s) declare that financial support was received for the research and/or publication of this article. This study was supported by a grant from the National Natural Science Foundation of China (NSFC) (Grant No. 82272394) and 2022 Development Discipline - Laboratory (202307-3179).
Acknowledgments
Thanks to Mr. Sun Liangdong for his irreplaceable help in my work, which greatly improved my understanding of academic writing and taught me a lot of specific research skills.
Conflict of interest
The authors declare that the research was conducted in the absence of any commercial or financial relationships that could be construed as a potential conflict of interest.
Generative AI statement
The author(s) declare that no Generative AI was used in the creation of this manuscript.
Publisher’s note
All claims expressed in this article are solely those of the authors and do not necessarily represent those of their affiliated organizations, or those of the publisher, the editors and the reviewers. Any product that may be evaluated in this article, or claim that may be made by its manufacturer, is not guaranteed or endorsed by the publisher.
Supplementary material
The Supplementary Material for this article can be found online at: https://www.frontiersin.org/articles/10.3389/fimmu.2025.1574003/full#supplementary-material
Supplementary Figure 1 | PRISMA workflow for datasets used in this study.
Supplementary Figure 2 | Validation of diagnostic markers using RT-qPCR. (a-e) Expression of five genes in patients with S. aureus bloodstream infection; (f-j) Expression of five genes in a mouse model of S. aureus bloodstream infection. *P < 0.05, **P < 0.01, ****P < 0.0001.
References
1. Lakhundi S, Zhang K. Methicillin-resistant staphylococcus aureus: molecular characterization, evolution, and epidemiology. Clin Microbiol Rev. (2018) 31(4):e00020-18. doi: 10.1128/CMR.00020-18
2. Laupland KB, Church DL. Population-based epidemiology and microbiology of community-onset bloodstream infections. Clin Microbiol Rev. (2014) 27:647–64. doi: 10.1128/CMR.00002-14
3. Kwiecinski JM, Horswill AR. Staphylococcus aureus bloodstream infections: pathogenesis and regulatory mechanisms. Curr Opin Microbiol. (2020) 53:51–60. doi: 10.1016/j.mib.2020.02.005
4. Jandeaux LM, Eischen A, Grillon A, Demiselle J. Bone marrow necrosis induced by massive Staphylococcus aureus infiltration. Intensive Care Med. (2022) 48:746–7. doi: 10.1007/s00134-022-06619-y
5. Rowe SE, Wagner NJ, Li L, Beam JE, Wilkinson AD, Radlinski LC, et al. Reactive oxygen species induce antibiotic tolerance during systemic Staphylococcus aureus infection. Nat Microbiol. (2020) 5:282–90. doi: 10.1038/s41564-019-0627-y
6. Verway M, Brown KA, Marchand-Austin A, Diong C, Lee S, Langford B, et al. Prevalence and mortality associated with bloodstream organisms: a population-wide retrospective cohort study. J Clin Microbiol. (2022) 60:e0242921. doi: 10.1128/jcm.02429-21
7. Diekema DJ, Hsueh PR, Mendes RE, Pfaller MA, Rolston KV, Sader HS, et al. The microbiology of bloodstream infection: 20-year trends from the SENTRY antimicrobial surveillance program. Antimicrob Agents Chemother. (2019) 63(7):e00355-19. doi: 10.1128/AAC.00355-19
8. Marra AR, Camargo LF, Pignatari AC, Sukiennik T, Behar PR, Medeiros EA, et al. Nosocomial bloodstream infections in Brazilian hospitals: analysis of 2,563 cases from a prospective nationwide surveillance study. J Clin Microbiol. (2011) 49:1866–71. doi: 10.1128/JCM.00376-11
9. Viscoli C. Bloodstream Infections: The peak of the iceberg. Virulence. (2016) 7:248–51. doi: 10.1080/21505594.2016.1152440
10. Gupta E, Kumar S, Srivastava VK, Saxena J, Siddiqui AJ, Mehta S, et al. Unravelling the Differential Host Immuno-Inflammatory Responses to Staphylococcus aureus and Escherichia coli Infections in Sepsis. Vaccines (Basel). (2022) 10(10):1648. doi: 10.3390/vaccines10101648
11. Howden BP, Giulieri SG, Wong Fok Lung T, Baines SL, Sharkey LK, Lee JYH, et al. Staphylococcus aureus host interactions and adaptation. Nat Rev Microbiol. (2023) 21:380–95. doi: 10.1038/s41579-023-00852-y
12. Wang JK, Zhu B, Ju ST, Tschopp J, Marshak-Rothstein A. CD4+ T cells reactivated with superantigen are both more sensitive to FasL-mediated killing and express a higher level of FasL. Cell Immunol. (1997) 179:153–64. doi: 10.1006/cimm.1997.1159
13. Fraser JD, Proft T. The bacterial superantigen and superantigen-like proteins. Immunol Rev. (2008) 225:226–43. doi: 10.1111/j.1600-065X.2008.00681.x
14. Herman A, Kappler JW, Marrack P, Pullen AM. Superantigens: mechanism of T-cell stimulation and role in immune responses. Annu Rev Immunol. (1991) 9:745–72. doi: 10.1146/annurev.iy.09.040191.003525
15. Zhang H, Monk IR, Braverman J, Jones CM, Brooks AG, Stinear TP, et al. Staphylococcal superantigens evoke temporary and reversible T cell anergy, but fail to block the development of a bacterium specific cellular immune response. Nat Commun. (2024) 15:9872. doi: 10.1038/s41467-024-54074-8
16. Levine MM, Tacket CO, Sztein MB. Host-Salmonella interaction: human trials. Microbes Infect. (2001) 3:1271–9. doi: 10.1016/S1286-4579(01)01487-3
17. Stenger S, Hanson DA, Teitelbaum R, Dewan P, Niazi KR, Froelich CJ, et al. An antimicrobial activity of cytolytic T cells mediated by granulysin. Science. (1998) 282:121–5. doi: 10.1126/science.282.5386.121
18. Friot A, Djebali S, Valsesia S, Parroche P, Dubois M, Baude J, et al. Antigen specific activation of cytotoxic CD8(+) T cells by Staphylococcus aureus infected dendritic cells. Front Cell Infect Microbiol. (2023) 13:1245299. doi: 10.3389/fcimb.2023.1245299
19. Alexeev V, Huitema L, Phillips T, Cepeda R, de Los Cobos D, Perez RIM, et al. T-cell activation and bacterial infection in skin wounds of recessive dystrophic epidermolysis bullosa patients. Exp Dermatol. (2022) 31:1431–42. doi: 10.1111/exd.14615
20. Yi Y, Wang H, Su L, Wang H, Zhang B, Su Y. A comparative investigation on the role and interaction of EsxA and EsxB in host immune response. Microb Pathog. (2021) 154:104843. doi: 10.1016/j.micpath.2021.104843
21. Shi X, Ni H, Tang L, Li M, Wu Y, Xu Y. Identification of molecular subgroups in osteomyelitis induced by staphylococcus aureus infection through gene expression profiles. BMC Med Genomics. (2023) 16:149. doi: 10.1186/s12920-023-01568-x
22. Xing Y, Tang Y, Chen Q, Chen S, Li W, Mi S, et al. The role of RNA epigenetic modification-related genes in the immune response of cattle to mastitis induced by Staphylococcus aureus. Anim Biosci. (2024) 37:1141–55. doi: 10.5713/ab.23.0323
23. Robb MA, McInnes PM, Califf RM. Biomarkers and surrogate endpoints: developing common terminology and definitions. Jama. (2016) 315:1107–8. doi: 10.1001/jama.2016.2240
24. Langfelder P, Horvath S. WGCNA: an R package for weighted correlation network analysis. BMC Bioinf. (2008) 9:559. doi: 10.1186/1471-2105-9-559
25. Zhang X, Cui Y, Ding X, Liu S, Han B, Duan X, et al. Analysis of mRNA−lncRNA and mRNA−lncRNA-pathway co−expression networks based on WGCNA in developing pediatric sepsis. Bioengineered. (2021) 12:1457–70. doi: 10.1080/21655979.2021.1908029
26. Liu R, Liu J, Cao Q, Chu Y, Chi H, Zhang J, et al. Identification of crucial genes through WGCNA in the progression of gastric cancer. J Cancer. (2024) 15:3284–96. doi: 10.7150/jca.95757
27. Wang Z, Gu Y, Huang L, Liu S, Chen Q, Yang Y, et al. Construction of machine learning diagnostic models for cardiovascular pan-disease based on blood routine and biochemical detection data. Cardiovasc Diabetol. (2024) 23:351. doi: 10.1186/s12933-024-02439-0
28. Shen L, Wu J, Lu M, Jiang Y, Zhang X, Xu Q, et al. Advancing risk factor identification for pediatric lobar pneumonia: the promise of machine learning technologies. Front Pediatr. (2025) 13:1490500. doi: 10.3389/fped.2025.1490500
29. Lin L, Xie Y, Lin Z, Lin C, Yang Y. Machine learning for predicting metabolic-associated fatty liver disease including NHHR: a cross-sectional NHANES study. PloS One. (2025) 20:e0319851. doi: 10.1371/journal.pone.0319851
30. Ahn SH, Tsalik EL, Cyr DD, Zhang Y, van Velkinburgh JC, Langley RJ, et al. Gene expression-based classifiers identify Staphylococcus aureus infection in mice and humans. PloS One. (2013) 8:e48979. doi: 10.1371/journal.pone.0048979
31. Dix A, Hünniger K, Weber M, Guthke R, Kurzai O, Linde J, et al. Biomarker-based classification of bacterial and fungal whole-blood infections in a genome-wide expression study. Front Microbiol. (2015) 6:171. doi: 10.3389/fmicb.2015.00171
32. Ardura MI, Banchereau R, Mejias A, Di Pucchio T, Glaser C, Allantaz F, et al. Enhanced monocyte response and decreased central memory T cells in children with invasive Staphylococcus aureus infections. PloS One. (2009) 4:e5446. doi: 10.1371/journal.pone.0005446
33. Xu M, Zhou H, Hu P, Pan Y, Wang S, Liu L, et al. Identification and validation of immune and oxidative stress-related diagnostic markers for diabetic nephropathy by WGCNA and machine learning. Front Immunol. (2023) 14:1084531. doi: 10.3389/fimmu.2023.1084531
34. Wang Z, Hu D, Pei G, Zeng R, Yao Y. Identification of driver genes in lupus nephritis based on comprehensive bioinformatics and machine learning. Front Immunol. (2023) 14:1288699. doi: 10.3389/fimmu.2023.1288699
35. Wu T, Hu E, Xu S, Chen M, Guo P, Dai Z, et al. clusterProfiler 4.0: A universal enrichment tool for interpreting omics data. Innovation (Camb). (2021) 2:100141. doi: 10.1016/j.xinn.2021.100141
36. Subramanian A, Tamayo P, Mootha VK, Mukherjee S, Ebert BL, Gillette MA, et al. Gene set enrichment analysis: a knowledge-based approach for interpreting genome-wide expression profiles. Proc Natl Acad Sci U S A. (2005) 102:15545–50. doi: 10.1073/pnas.0506580102
37. Zhang B, Guo B, Zou B, Wei W, Lei Y, Li T. Retrieving soil heavy metals concentrations based on GaoFen-5 hyperspectral satellite image at an opencast coal mine, Inner Mongolia, China. Environ Pollut. (2022) 300:118981. doi: 10.1016/j.envpol.2022.118981
38. Guo Y, Li L, Zheng K, Du J, Nie J, Wang Z, et al. Development and validation of a survival prediction model for patients with advanced non-small cell lung cancer based on LASSO regression. Front Immunol. (2024) 15:1431150. doi: 10.3389/fimmu.2024.1431150
39. Guan X, Du Y, Ma R, Teng N, Ou S, Zhao H, et al. Construction of the XGBoost model for early lung cancer prediction based on metabolic indices. BMC Med Inform Decis Mak. (2023) 23:107. doi: 10.1186/s12911-023-02171-x
40. Yang R, Xiong X, Wang H, Li W. Explainable machine learning model to prediction EGFR mutation in lung cancer. Front Oncol. (2022) 12:924144. doi: 10.3389/fonc.2022.924144
41. Hu J, Szymczak S. A review on longitudinal data analysis with random forest. Brief Bioinform. (2023) 24(2):bbad002. doi: 10.1093/bib/bbad002
42. Bolin E, Lam W. A review of sensitivity, specificity, and likelihood ratios: evaluating the utility of the electrocardiogram as a screening tool in hypertrophic cardiomyopathy. Congenit Heart Dis. (2013) 8:406–10. doi: 10.1111/chd.12083
43. Glaros AG, Kline RB. Understanding the accuracy of tests with cutting scores: the sensitivity, specificity, and predictive value model. J Clin Psychol. (1988) 44:1013–23. doi: 10.1002/1097-4679(198811)44:6<1013::AID-JCLP2270440627>3.0.CO;2-Z
44. Newman AM, Liu CL, Green MR, Gentles AJ, Feng W, Xu Y, et al. Robust enumeration of cell subsets from tissue expression profiles. Nat Methods. (2015) 12:453–7. doi: 10.1038/nmeth.3337
45. Miao YR, Zhang Q, Lei Q, Luo M, Xie GY, Wang H, et al. ImmuCellAI: A unique method for comprehensive T-cell subsets abundance prediction and its application in cancer immunotherapy. Adv Sci (Weinh). (2020) 7:1902880. doi: 10.1002/advs.201902880
46. Shi J, Shen L, Xiao Y, Wan C, Wang B, Zhou P, et al. Identification and validation of diagnostic biomarkers and immune cell abundance characteristics in Staphylococcus aureus bloodstream infection by integrative bioinformatics analysis. Front Immunol. (2024) 15:1450782. doi: 10.3389/fimmu.2024.1450782
47. Aung MS, Osada M, Urushibara N, Kawaguchiya M, Ohashi N, Hirose M, et al. Molecular characterization of methicillin-susceptible/resistant Staphylococcus aureus (MSSA/MRSA) from bloodstream infections in northern Japan: the dominance of CC1-MRSA-IV, the emergence of human-associated ST398 and livestock-associated CC20 and CC97 MSSA. J Glob Antimicrob Resist. (2024) 41:77–87. doi: 10.1016/j.jgar.2024.12.010
48. Schöneweck F, Schmitz RPH, Rißner F, Scherag A, Löffler B, Pletz MW, et al. The epidemiology of bloodstream infections and antimicrobial susceptibility patterns in Thuringia, Germany: a five-year prospective, state-wide surveillance study (AlertsNet). Antimicrob Resist Infect Control. (2021) 10:132. doi: 10.1186/s13756-021-00997-6
49. Fadel HJ, Patel R, Vetter EA, Baddour LM. Clinical significance of a single Staphylococcus lugdunensis-positive blood culture. J Clin Microbiol. (2011) 49:1697–9. doi: 10.1128/JCM.02058-10
50. Bai AD, Lo CKL, Komorowski AS, Suresh M, Guo K, Garg A, et al. Staphylococcus aureus bacteraemia mortality: a systematic review and meta-analysis. Clin Microbiol Infect. (2022) 28:1076–84. doi: 10.1016/j.cmi.2022.03.015
51. Yukawa S, Noguchi T, Shinohara K, Tsuchido Y, Yamamoto M, Matsumura Y, et al. Characteristics and outcomes in adult patients with Staphylococcus lugdunensis bacteremia compared to patients with Staphylococcus epidermidis and Staphylococcus aureus bacteremia: a retrospective study in a 16-year period at the university hospital, Japan. BMC Infect Dis. (2023) 23:269. doi: 10.1186/s12879-023-08233-9
52. Go JR, Challener D, Corsini Campioli C, Sohail MR, Palraj R, Baddour LM, et al. Clinical significance of staphylococcus aureus in a single positive blood culture bottle. Open Forum Infect Dis. (2022) 9:ofab642. doi: 10.1093/ofid/ofab642
53. Hou N, Li M, He L, Xie B, Wang L, Zhang R, et al. Predicting 30-days mortality for MIMIC-III patients with sepsis-3: a machine learning approach using XGboost. J Transl Med. (2020) 18:462. doi: 10.1186/s12967-020-02620-5
54. Xie X, Le L, Fan Y, Lv L, Zhang J. Autophagy is induced through the ROS-TP53-DRAM1 pathway in response to mitochondrial protein synthesis inhibition. Autophagy. (2012) 8:1071–84. doi: 10.4161/auto.20250
55. Berry MP, Graham CM, McNab FW, Xu Z, Bloch SA, Oni T, et al. An interferon-inducible neutrophil-driven blood transcriptional signature in human tuberculosis. Nature. (2010) 466:973–7. doi: 10.1038/nature09247
56. van der Vaart M, Korbee CJ, Lamers GE, Tengeler AC, Hosseini R, Haks MC, et al. The DNA damage-regulated autophagy modulator DRAM1 links mycobacterial recognition via TLR-MYD88 to autophagic defense [corrected. Cell Host Microbe. (2014) 15:753–67. doi: 10.1016/j.chom.2014.05.005
57. Wang X, Wang Z, Huang R, Lu Z, Chen X, Huang D, et al. UPP1 promotes lung adenocarcinoma progression through epigenetic regulation of glycolysis. Aging Dis. (2022) 13:1488–503. doi: 10.14336/AD.2022.0218
58. Hamasaki MY, Severino P, Puga RD, Koike MK, Hernandes C, Barbeiro HV, et al. Short-term effects of sepsis and the impact of aging on the transcriptional profile of different brain regions. Inflammation. (2019) 42:1023–31. doi: 10.1007/s10753-019-00964-9
59. Fan J, Shi S, Qiu Y, Liu M, Shu Q. Analysis of signature genes and association with immune cells infiltration in pediatric septic shock. Front Immunol. (2022) 13:1056750. doi: 10.3389/fimmu.2022.1056750
60. Song T, Zou F, Xia Y, Xing J, Yu W. Prognostic and immunological roles of IL18RAP in human cancers. Aging (Albany NY). (2023) 15:9059–85. doi: 10.18632/aging.205017
61. Hedl M, Zheng S, Abraham C. The IL18RAP region disease polymorphism decreases IL-18RAP/IL-18R1/IL-1R1 expression and signaling through innate receptor-initiated pathways. J Immunol. (2014) 192:5924–32. doi: 10.4049/jimmunol.1302727
62. Li Y, Li T, Sun H, Tan C, Gao M. Identification of Potential Transcriptional Biomarkers Differently Expressed in Both S. aureus- and E. coli-Induced Sepsis via Integrated Analysis. BioMed Res Int. (2019) 2019:2487921. doi: 10.1155/2019/2487921
63. Kingo K, Kolberg P, Pook M, Raam L, Laanesoo A. Skin colonization with S. aureus can lead to increased NLRP1 inflammasome activation in patients with atopic dermatitis. J Invest Dermatol. (2023) 143:1268–1278.e1268. doi: 10.1016/j.jid.2023.01.013
64. Uto T, Fukaya T, Mitoma S, Nishikawa Y, Tominaga M, Choijookhuu N, et al. Clec4A4 acts as a negative immune checkpoint regulator to suppress antitumor immunity. Cancer Immunol Res. (2023) 11:1266–79. doi: 10.1158/2326-6066.CIR-22-0536
65. Zhang R, Guo S, Qu J. Exploring the prognostic value of T follicular helper cell levels in chronic lymphocytic leukemia. Sci Rep. (2024) 14:22443. doi: 10.1038/s41598-024-73325-8
66. Liu C, Xu Z, Gupta D, Dziarski R. Peptidoglycan recognition proteins: a novel family of four human innate immunity pattern recognition molecules. J Biol Chem. (2001) 276:34686–94. doi: 10.1074/jbc.M105566200
67. Park SY, Jing X, Gupta D, Dziarski R. Peptidoglycan recognition protein 1 enhances experimental asthma by promoting Th2 and Th17 and limiting regulatory T cell and plasmacytoid dendritic cell responses. J Immunol. (2013) 190:3480–92. doi: 10.4049/jimmunol.1202675
68. Liu C, Gelius E, Liu G, Steiner H, Dziarski R. Mammalian peptidoglycan recognition protein binds peptidoglycan with high affinity, is expressed in neutrophils, and inhibits bacterial growth. J Biol Chem. (2000) 275:24490–9. doi: 10.1074/jbc.M001239200
69. Chen Z, Xia H, Shen H, Xu X, Arbab AAI, Li M, et al. Pathological features of staphylococcus aureus induced mastitis in dairy cows and isobaric-tags-for-relative-and-absolute-quantitation proteomic analyses. J Agric Food Chem. (2018) 66:3880–90. doi: 10.1021/acs.jafc.7b05461
70. Gong F, Li R, Zheng X, Chen W, Zheng Y, Yang Z, et al. OLFM4 regulates lung epithelial cell function in sepsis-associated ARDS/ALI via LDHA-mediated NF-κB signaling. J Inflammation Res. (2021) 14:7035–51. doi: 10.2147/JIR.S335915
71. Zhang J, Cheng Y, Duan M, Qi N, Liu J. Unveiling differentially expressed genes upon regulation of transcription factors in sepsis. 3 Biotech. (2017) 7:46. doi: 10.1007/s13205-017-0713-x
72. Rigby KM, DeLeo FR. Neutrophils in innate host defense against Staphylococcus aureus infections. Semin Immunopathol. (2012) 34:237–59. doi: 10.1007/s00281-011-0295-3
73. Kolata JB, Kühbandner I, Link C, Normann N, Vu CH, Steil L, et al. The fall of a dogma? Unexpected high T-cell memory response to staphylococcus aureus in humans. J Infect Dis. (2015) 212:830–8. doi: 10.1093/infdis/jiv128
74. Montgomery CP, Daniels M, Zhao F, Alegre M, Chong A, Daum R, et al. Protective immunity against recurrent Staphylococcus aureus skin infection requires antibody and interleukin-17A. Infect Immun. (2014) 82:2125–34. doi: 10.1128/IAI.01491-14
Keywords: Staphylococcus aureus, bloodstream infection, WGCNA, Diagnostic Score, XGBoost
Citation: Shi J, Chen L, Yuan X, Yang J, Xu Y, Shen L, Huang Y, Wang B and Yu F (2025) A potential XGBoost Diagnostic Score for Staphylococcus aureus bloodstream infection. Front. Immunol. 16:1574003. doi: 10.3389/fimmu.2025.1574003
Received: 10 February 2025; Accepted: 31 March 2025;
Published: 22 April 2025.
Edited by:
Kuldeep Gupta, University of Arizona, United StatesReviewed by:
Isha Pandey, Rutgers University, Newark, United StatesShivang Sharma, Johns Hopkins University, United States
Copyright © 2025 Shi, Chen, Yuan, Yang, Xu, Shen, Huang, Wang and Yu. This is an open-access article distributed under the terms of the Creative Commons Attribution License (CC BY). The use, distribution or reproduction in other forums is permitted, provided the original author(s) and the copyright owner(s) are credited and that the original publication in this journal is cited, in accordance with accepted academic practice. No use, distribution or reproduction is permitted which does not comply with these terms.
*Correspondence: Bingjie Wang, d2FuZ2JpbmdqaWUyMDE3QDE2My5jb20=; Fangyou Yu, d3pqeHlmeUAxNjMuY29t