 Zhengrong Deng
 Yicong Xu
 Peidong Zhang
 Yixiang Peng5
 Jiaxing Tan
 Zihang Chen
 Yimei Ma
- 1Key Laboratory of Birth Defects and Related Diseases of Women and Children (Sichuan University) Ministry of Education, West China Second University Hospital of Sichuan University, Chengdu, China
- 2Department of Obstetrics and Gynecology, West China Second University Hospital of Sichuan University, Chengdu, China
- 3Department of Anesthesiology, West China Second University Hospital of Sichuan University, Chengdu, China
- 4State Key Laboratory of Biotherapy and Cancer Center, West China Hospital, Sichuan University, Chengdu, China
- 5Department of Computer Science and Technology, Civil Aviation University of China, Tianjin, China
- 6Division of Nephrology, Department of Medicine, West China Hospital, Sichuan University, Chengdu, China
- 7Department of Pathology, West China Hospital, Sichuan University, Chengdu, China
- 8Department of Hematology and Oncology, West China Second University Hospital of Sichuan University, Chengdu, China
Introduction: Ovarian cancer (OC) exhibits high mortality and chemoresistance rates, underscoring the urgent need for precise prognostic biomarkers and novel therapeutic targets. SUMOylation, crucial in cellular stress responses, is frequently dysregulated in various cancers. This study aims to characterize SUMOylation and its regulators in OC and identify potential biomarkers and therapeutic targets.
Methods: In this study, using multi-omics data, we characterized the unique features of SUMOylation in OC and revealed the association between SUMOylation-related genes (SRGs) and OC malignancy. We conducted integrated machine learning and single-cell RNA sequencing data analysis to identify key SRGs and explored their functional characteristics. The prognostic potential of these SRGs was confirmed in ID8 mouse models and in samples from 213 OC patients at West China Second Hospital.
Results: An integrated machine learning framework identified 22 prognostic-related SRGs from the TCGA-OV cohort. Further single-cell analysis refined these findings, pinpointing five SRGs as biomarkers closely associated with OC cell function, metabolism and the tumor microenvironment. In cancer cells, the expression of four SRGs (PI3, AUP1, CD200 and GNAS) is closely associated with epigenetic regulation and epithelial-mesenchymal signaling. Notably, we found that AUP1 overexpression may contribute to chemoresistance in OC. In the tumor microenvironment, CD8+ cytotoxic T cell with high CCDC80 (another SRG) expression exhibit inhibited cytotoxicity activity.
Discussion: Overall, five SRGs were identified and further evaluated as potential prognostic and therapeutic targets, offering deeper insights into precision oncology for OC.
1 Introduction
Ovarian cancer (OC) is a leading cause of gynecologic cancer-related mortality (1), with a poor prognosis and a 5-year survival rate of approximately 20% in advanced stages (2). Chemoresistance to standard platinum-based chemotherapy further contributes to poor survival, particularly in advanced cases (3, 4). Despite significant advances in targeted therapies, such as the combination of bevacizumab with carboplatin and paclitaxel, which has improved survival in stage IV patients (5), the high heterogeneity of ovarian cancer limits the overall response (6). Moreover, immunotherapy has shown only modest effectiveness in ovarian cancer and lacks FDA approval (7). Thus, studies on novel prognostic signatures and molecular biomarkers, with a focus on new molecular mechanisms, are urgently needed.
One such mechanism is posttranslational protein modification by small ubiquitin-like modifier (SUMO), termed SUMOylation, which plays a crucial role in cellular responses to stress and is altered in many cancers (8, 9). Inhibiting SUMOylation activity in acute myeloid leukemia can resensitize cancer cells to genotoxic chemotherapy (10). However, another study indicated that high levels of SUMOylation repress the effects of TGFβ signaling on E-cadherin expression, revealing a negative regulatory mechanism for epithelial–mesenchymal transition (EMT), thus inhibiting cancer progression and metastasis (11). Therefore, SUMOylation plays complex regulatory roles in protumorigenic signaling, gene regulatory networks, antitumor immunity and inflammatory cytokine production, exerting both agonistic and antagonistic effects depending on the pathway (8, 12). However, research investigating SUMOylation in ovarian cancer remains scarce.
Machine learning, a branch of artificial intelligence (AI) focused on predicting data patterns via algorithms, has long played a crucial role in cancer phenotyping, therapy and advanced techniques such as signature extraction and prognosis prediction (13). Many studies have used machine learning algorithms and TCGA data to pinpoint therapeutic targets to improve ovarian cancer prognosis (14). However, methods based on single-model pattern recognition fail to meet the growing demand for precision medicine, as they often lack in-depth consideration of target mechanisms and sufficient clinical validation, thereby limiting their clinical translation (15). Conversely, single-cell RNA sequencing has emerged as a powerful tool for delineating distinct functional states at the cellular level in ovarian cancer (16). Integrating multiple machine learning approaches with single-cell data holds promise for identifying more precise therapeutic targets and revealing intricate gene regulatory networks in ovarian cancer.
In this study, via multi-omics data, we revealed unique characteristic of SUMOylation in ovarian cancer and explored the potential association between SUMOylation-related genes and ovarian cancer malignancy. Through the application of integrated machine learning techniques and single-cell analysis, we further identified SRGs closely associated ovarian cancer cell function and the tumor immune microenvironment (TIME). Additionally, we identified a biomarker that may indicate poor postoperative chemotherapy prognosis. This work holds promise for improving therapeutic outcomes, enhancing patient prognosis and advancing precision medicine in oncology.
2 Materials and methods
2.1 Data collection and preprocessing
Publicly available gene expression profiles and complete clinical annotations for the TCGA-OV cohort were obtained from The Cancer Genome Atlas (TCGA) database (https://portal.gdc.cancer.gov/) using the TCGAbiolinks R package (version 2.34.0). Given that the TCGA-OV gene expression data are derived from high-throughput RNA sequencing (RNA-seq), we utilized fragments per kilobase of exon model per million mapped fragments (FPKM) values, as they are more comparable to microarray-derived expression data and facilitate cross-sample normalization. For microarray datasets, expression matrices and corresponding clinical data were retrieved from the Gene Expression Omnibus (GEO; https://www.ncbi.nlm.nih.gov/geo/) using the GEOquery package (version 2.70.0), specifically for the datasets GSE13876, GSE17260, GSE19829, and GSE26712. Gene annotation and probe ID conversion for these microarray platforms were performed using the tinyarray package (version 2.3.1). Additionally, single-cell RNA sequencing (scRNA-seq) data from ten patients with advanced ovarian cancer were obtained from the GSA-Human database (https://ngdc.cncb.ac.cn/gsa-human/) under the accession number PRJCA005422 and were reanalyzed in the present study. All the code generated for analysis is available through Zenodo, DOI: 10.5281/zenodo.13152228 (https://zenodo.org/records/13152229).
2.2 Analysis of scRNA-seq data
Single-cell RNA sequencing (scRNA-seq) data were processed and analyzed using the Seurat R package (version 4.4.0). Raw data were first converted into Seurat objects, followed by quality control to remove low-quality nuclei. Specifically, cells were excluded if they had fewer than 500 or more than 3,000 detected genes, or if more than 20% of total transcripts originated from mitochondrial or ribosomal genes. Data normalization was conducted using the NormalizeData function with default parameters. The 2,000 most variable genes were identified for principal component analysis (PCA), which was used for dimensionality reduction. To address batch effects across samples, the datasets were integrated using the FindIntegrationAnchors and IntegrateData functions. After integration, clustering analysis was conducted using the FindNeighbors and FindClusters functions. The resolution parameter was adjusted to optimize cluster granularity, enabling the identification of distinct cell populations. Clusters were visualized using uniform manifold approximation and projection (UMAP) based on the top principal components. Cell types were annotated according to canonical marker genes and supported by reference to previous studies. Differential gene expression between clusters or conditions was assessed using the FindMarkers function, applying the Wilcoxon rank-sum test. Genes with an absolute log2(fold change) greater than 0.1 and an adjusted p-value less than 0.05 were considered significantly differentially expressed.
2.3 Pathway analysis
Gene Ontology (GO) and Kyoto Encyclopedia of Genes and Genomes (KEGG) annotations were retrieved using the “org.Hs.eg.db” R package (version 3.17). Differentially expressed genes were subjected to functional enrichment analysis using the “clusterProfiler” package (version 3.14.3). Gene sets representing functional pathways were obtained from the Molecular Signatures Database (MSigDB). To assess pathway activity at the bulk RNA-seq level, Gene Set Variation Analysis (GSVA) was performed using the GSVA package (version 1.46.0). For single-cell RNA-seq data, pathway activity was evaluated using the AUCell package (version 3.16), with the parameter aucMaxRank set to 5% to determine the top-ranking genes contributing to each pathway activity score.
2.4 Identification of malignant epithelium and pseudotime trajectory analysis
Copy number variations (CNVs) were inferred using the CopyKAT R package, with normal epithelial cells designated as the reference population. CopyKAT was executed with default parameters to distinguish malignant from non-malignant epithelial cells based on large-scale chromosomal aneuploidy. The resulting copy number alterations (CNAs) were extracted and visualized as heatmaps using the pheatmap R package, in which genes were ordered according to chromosomal location and cells were grouped by cell type to enhance interpretability. Pseudotime trajectory analysis was conducted via the Monocle2 package (version 2.28.0). SUMOylation-related genes are temporal markers of differential expression.
2.5 Construction of integrated machine learning model
To identify prognostic SUMOylation-related genes (SRGs), univariate Cox regression analysis was first performed using the “survival” R package (version 3.5.7), with statistically significant SRGs selected based on a threshold of p < 0.05. Next, to construct a robust prognostic model, 80 algorithmic combinations derived from 10 distinct machine learning algorithms were applied to the selected SRGs within the TCGA-OV cohort. These algorithms included CoxBoost, elastic net (Enet), generalized boosted regression modeling (GBM), least absolute shrinkage and selection operator (Lasso), partial least squares regression for Cox (plsRcox), random survival forest (RSF), Ridge regression, supervised principal components (SuperPC), stepwise Cox regression, and survival support vector machine (survival-SVM). Specific hyperparameters for model training and fitting were as follows: RSF (ntree = 1000, nodesize = 4, splitrule = “logrank”); Enet (α values ranging from 0.1 to 0.9 with 0.1 increments, λ selected via 10-fold cross-validation); Lasso and Ridge (α = 1 and α = 0, respectively, with λ selected through 10-fold cross-validation); Stepwise Cox (three directions tested: forward, backward, and both); CoxBoost (number of boosting steps determined by 10-fold cross-validation); survival-SVM (gamma.mu = 1); GBM (n.trees = 10,000, interaction.depth = 3, shrinkage = 0.001, n.minobsinnode = 10); SuperPC (threshold determined by 10-fold cross-validation, s0.perc = 0.5); and plsRcox (number of components selected via 10-fold cross-validation).
To evaluate model performance, the average concordance index (C-index) across the training, test, and validation datasets was calculated for each algorithmic combination. The combination yielding the highest average C-index was considered optimal and selected for subsequent model development. Using the SRGs identified through this optimal combination, a multivariate Cox regression analysis was conducted via the “survival” R package to construct the final SUMOylation-related gene model (SRGM), defined by the formula: SRGM score = Σ(Ci × Ei), where Ci denotes the regression coefficient of each gene and Ei its expression level. The prognostic power of the SRGM was then validated across five independent ovarian cancer cohorts through Kaplan–Meier survival analyses.
In addition, previously published mRNA-based prognostic models for ovarian cancer were retrieved from PubMed up to September 2024. For each of these models, the corresponding risk scores were computed based on their reported formulae. Kaplan–Meier analysis was subsequently used to assess their prognostic significance across the training and validation cohorts. Finally, the C-index values of these models were compared with those of our SRGM in each cohort to comprehensively evaluate its predictive advantage.
2.6 NicheNet analysis
For NicheNet analysis, the normalized gene expression matrix was used as input. Ligand activity was predicted using the predict_ligand_activities function with default parameters, enabling the identification of potential ligand–receptor interactions and their downstream target genes. This analysis facilitated the inference of key signaling interactions between sender and receiver cell populations within the tumor microenvironment.
2.7 Immune microenvironment analysis and prediction of immunotherapy response
To evaluate immune infiltration between high- and low-SRGM score groups, single-sample Gene Set Enrichment Analysis (ssGSEA) was performed using predefined immune cell-type-specific gene signatures, as listed in Supplementary Table S9. The Tumor Immune Dysfunction and Exclusion (TIDE, http://tide.dfci.harvard.edu/) algorithm was applied to predict patient responses to immune checkpoint inhibitor (ICI) therapy based on the gene expression count matrix of the TCGA-OV cohort. A higher TIDE score was indicative of a better predicted response to immunotherapy. A score of 0 was used as the threshold to distinguish between predicted responders and non-responders.
2.8 Cell culture and transfection
The murine ovarian cancer cell line ID8 was cultured in Dulbecco’s modified Eagle medium (DMEM, Gibco) supplemented with 10% fetal bovine serum (FBS), 100 U/mL penicillin-streptomycin, and 2 mM L-glutamine. Primary ovarian cancer cells were isolated from tumor lesions following previously published protocols (17). For lentiviral transduction, viral particles were obtained from HANBIO (Shanghai, China). The overexpression vector was constructed as pHBLV-CMV-MCS-[Gene of Interest]-EF1-Luc-T2A-Puromycin, and the knockdown vector was based on pHBLV-U6-MCS-[Gene of Interest]-EF1-Luc-T2A-Puromycin. Transductions were performed according to the manufacturer’s instructions, and cells were selected with 4 μg/mL puromycin starting at 72 hours post-infection and maintained under selection until uninfected control cells were eliminated. Expression was confirmed by western blotting prior to further experiments.
2.9 Western blotting
Total protein was extracted from cells via RIPA buffer and subsequently separated via sodium dodecyl sulfate–polyacrylamide gel electrophoresis (SDS–PAGE). Following separation, the proteins were transferred to polyvinylidene fluoride (PVDF) membranes that had been preactivated with methanol. The membranes were incubated with blocking buffer at room temperature for 1 hour, followed by overnight incubation at 4°C with primary antibody mixture, which was diluted according to the manufacturer’s instructions. The next day, after washing with a mixture of tris-buffered saline and Tween 20 (TBST) four times for 15 minutes each, the membranes were incubated with an HRP-conjugated secondary antibody solution at room temperature for 50–70 minutes. Detection was performed via the use of an enhanced chemiluminescence (ECL) reagent according to the manufacturer’s protocol. Primary antibodies against the following targets were used: PI3 (Abcam, 1:1000, ab81681), AUP1 (Osenses, 1:100, OSU00005G), CD200 (Abcam, 1:1000, ab254193), GNAS (Abcam, 1:1000, ab204996), SUMO1 (Abcam, 1:1500, ab133352), and SUMO2/3 (Abcam, 1/1000, ab81371). All experiments were independently repeated three times with consistent results (trends).
2.10 Real-time quantitative polymerasechain reaction
Total RNA was isolated from frozen tumor tissues using TRIzol reagent (Invitrogen, CA, USA). Based on the RNA’s concentration and integrity, complementary DNA (cDNA) was synthesized using the PrimeScript™ RT Master Mix (#RR036A, Takara, Beijing, China). Quantitative real-time PCR (qPCR) was carried out on the 7500 Real-Time PCR System (Applied Biosystems, CA, USA) employing TB Green® Premix Ex Taq™ (#RR420B, Takara). Primer sequences, designed and synthesized by Sangon Biotech (Shanghai, China), are provided in Supplementary Table S16. The relative expression levels of the genes were calculated utilizing the 2–(ΔΔCT) method, with GAPDH serving as the internal reference gene for the PCR data.
2.11 In vivo animal studies
Five-week-old female C57BL/6 mice were purchased from GemPharmatech (Chengdu, China) and maintained under specific pathogen-free (SPF) conditions. After a 10-day acclimatization period, an intraperitoneal injection of 5 × 10⁶ lentivirus-transduced ID8 cells was performed. Mice were randomly assigned to groups. For SUMOylation inhibition experiments, mice received their first tail vein injection of TAK981 (7.5 mg/kg, MedChemExpress) or saline three days prior to tumor implantation, followed by weekly intravenous injections until the endpoint (30 days). For chemotherapy resistance experiments, a chemotherapy regimen of paclitaxel combined with carboplatin (TC) was used, consistent with the clinical cohorts. Starting from day 7 post-tumor implantation, mice received intraperitoneal injections of carboplatin (30 mg/kg, once weekly) and paclitaxel (8 mg/kg, twice weekly) or saline, continuing until the study endpoint. Tumor burden was monitored using the PerkinElmer IVIS Lumina III system.
2.12 Patients and clinical samples
The patient screening process is detailed in Supplementary Figures S6A, B. All patients were treated at West China Second University Hospital of Sichuan University, and the study was approved by the ethics committee (Approval No. 2024(085)), with informed consent obtained from each patient. The study does not involve clinical trials and did not impose any additional harm or burden on the patients. Formalin-fixed, paraffin-embedded (FFPE) tissue sections for immunohistochemistry were obtained from 60 ovarian cancer patients who underwent surgery between December 2017 and June 2019. Additionally, FFPE samples from 153 patients who underwent surgery between January 2014 and January 2017 were used to construct tissue microarrays and perform immunofluorescence staining. Primary ovarian cancer cells were extracted from fresh tumor samples of chemotherapy-naive patients who underwent surgery between February 2024 and May 2024.
2.13 Immunohistochemistry and Immunofluorescence
Tissue sections were deparaffinized with xylene and rehydrated through ethanol gradients. Antigen retrieval was performed in citrate buffer (pH 9.0) using a pressure cooker, followed by blocking with 5% BSA. The sections were incubated overnight at 4°C in a humidified chamber with primary antibody solution with dilution according to the manufacturer’s instructions. For IHC, the following day, sections were stained using DAB staining kit (Absin, Cat# abs9210) after washing. For IF, sections were incubated with a pre-prepared mixture of fluorescent secondary antibodies, then stained with DAPI. Prior to mounting, the sections were incubated with a tissue autofluorescence quenching agent (Servicebio, Cat# G1221). Primary antibodies: PI3 (Abcam, 1:800, ab81681), AUP1 (Osenses, 1:100, OSU00005G), CD200 (Abcam, 1:1000, ab254193), CCDC80 (Abcam, 1:100, ab224050), GNAS (Abcam, 1:1000, ab204996). Secondary antibodies: Goat Anti-Rabbit IgG H&L (HRP) (Abcam, 1:1000, ab6721), Goat Anti-Mouse IgG H&L (HRP) (Abcam, 1:3000, ab205719), Donkey Anti-Goat IgG H&L (HRP) (Abcam, 1:1500, ab6885). Panoramic images were obtained using the Pannoramic MIDI digital slide scanner system. Images were captured at 40× magnification using SlideViewer software and analyzed with ImageJ (version 1.8.0). The process was conducted under the guidance of two experienced pathologists.
2.14 Statistical analysis
All data processing, statistical analysis and plotting were conducted in R software (version 4.2.2). Correlations were assessed via Pearson’s correlation coefficients. The chi-square test was applied to compare categorical variables and continuous variables were compared through the Wilcoxon rank-sum test. Cox regression and Kaplan–Meier analyses were performed via the survminer package. The time-dependent area under the ROC curve (AUC) for survival variables was determined via the timeROC package (version 0.4.0). All the statistical tests were two-sided. The threshold for statistical significance was set at p <0.05. *, ** and *** indicate p <0.05, p <0.01 and p <0.001, respectively.
3 Results
3.1 Unique characteristics of SUMOylation in ovarian cancer
To explore the role of SUMOylation in ovarian cancer, we first obtained the gene set of SUMOylation regulators from MSigDB (Supplementary Table S1). Gene set variation analysis (GSVA) (18) was conducted to assess the expression levels of SUMOylation regulators in ovarian cancer and normal ovarian samples via the TCGA and GTEx databases (Figure 1A), revealing that the expression scores of SUMOylation regulators were relatively lower in ovarian cancer compared to normal ovarian tissues. Since the activity of SUMOylation regulators is closely associated with global SUMOylation levels, we performed IHC for SUMO1 and SUMO2/3 on FFPE tissue sections from ovarian cancer patients at different stages. The results revealed that the global level of SUMOylation was relatively lower in advanced ovarian cancer (Figure 1B).
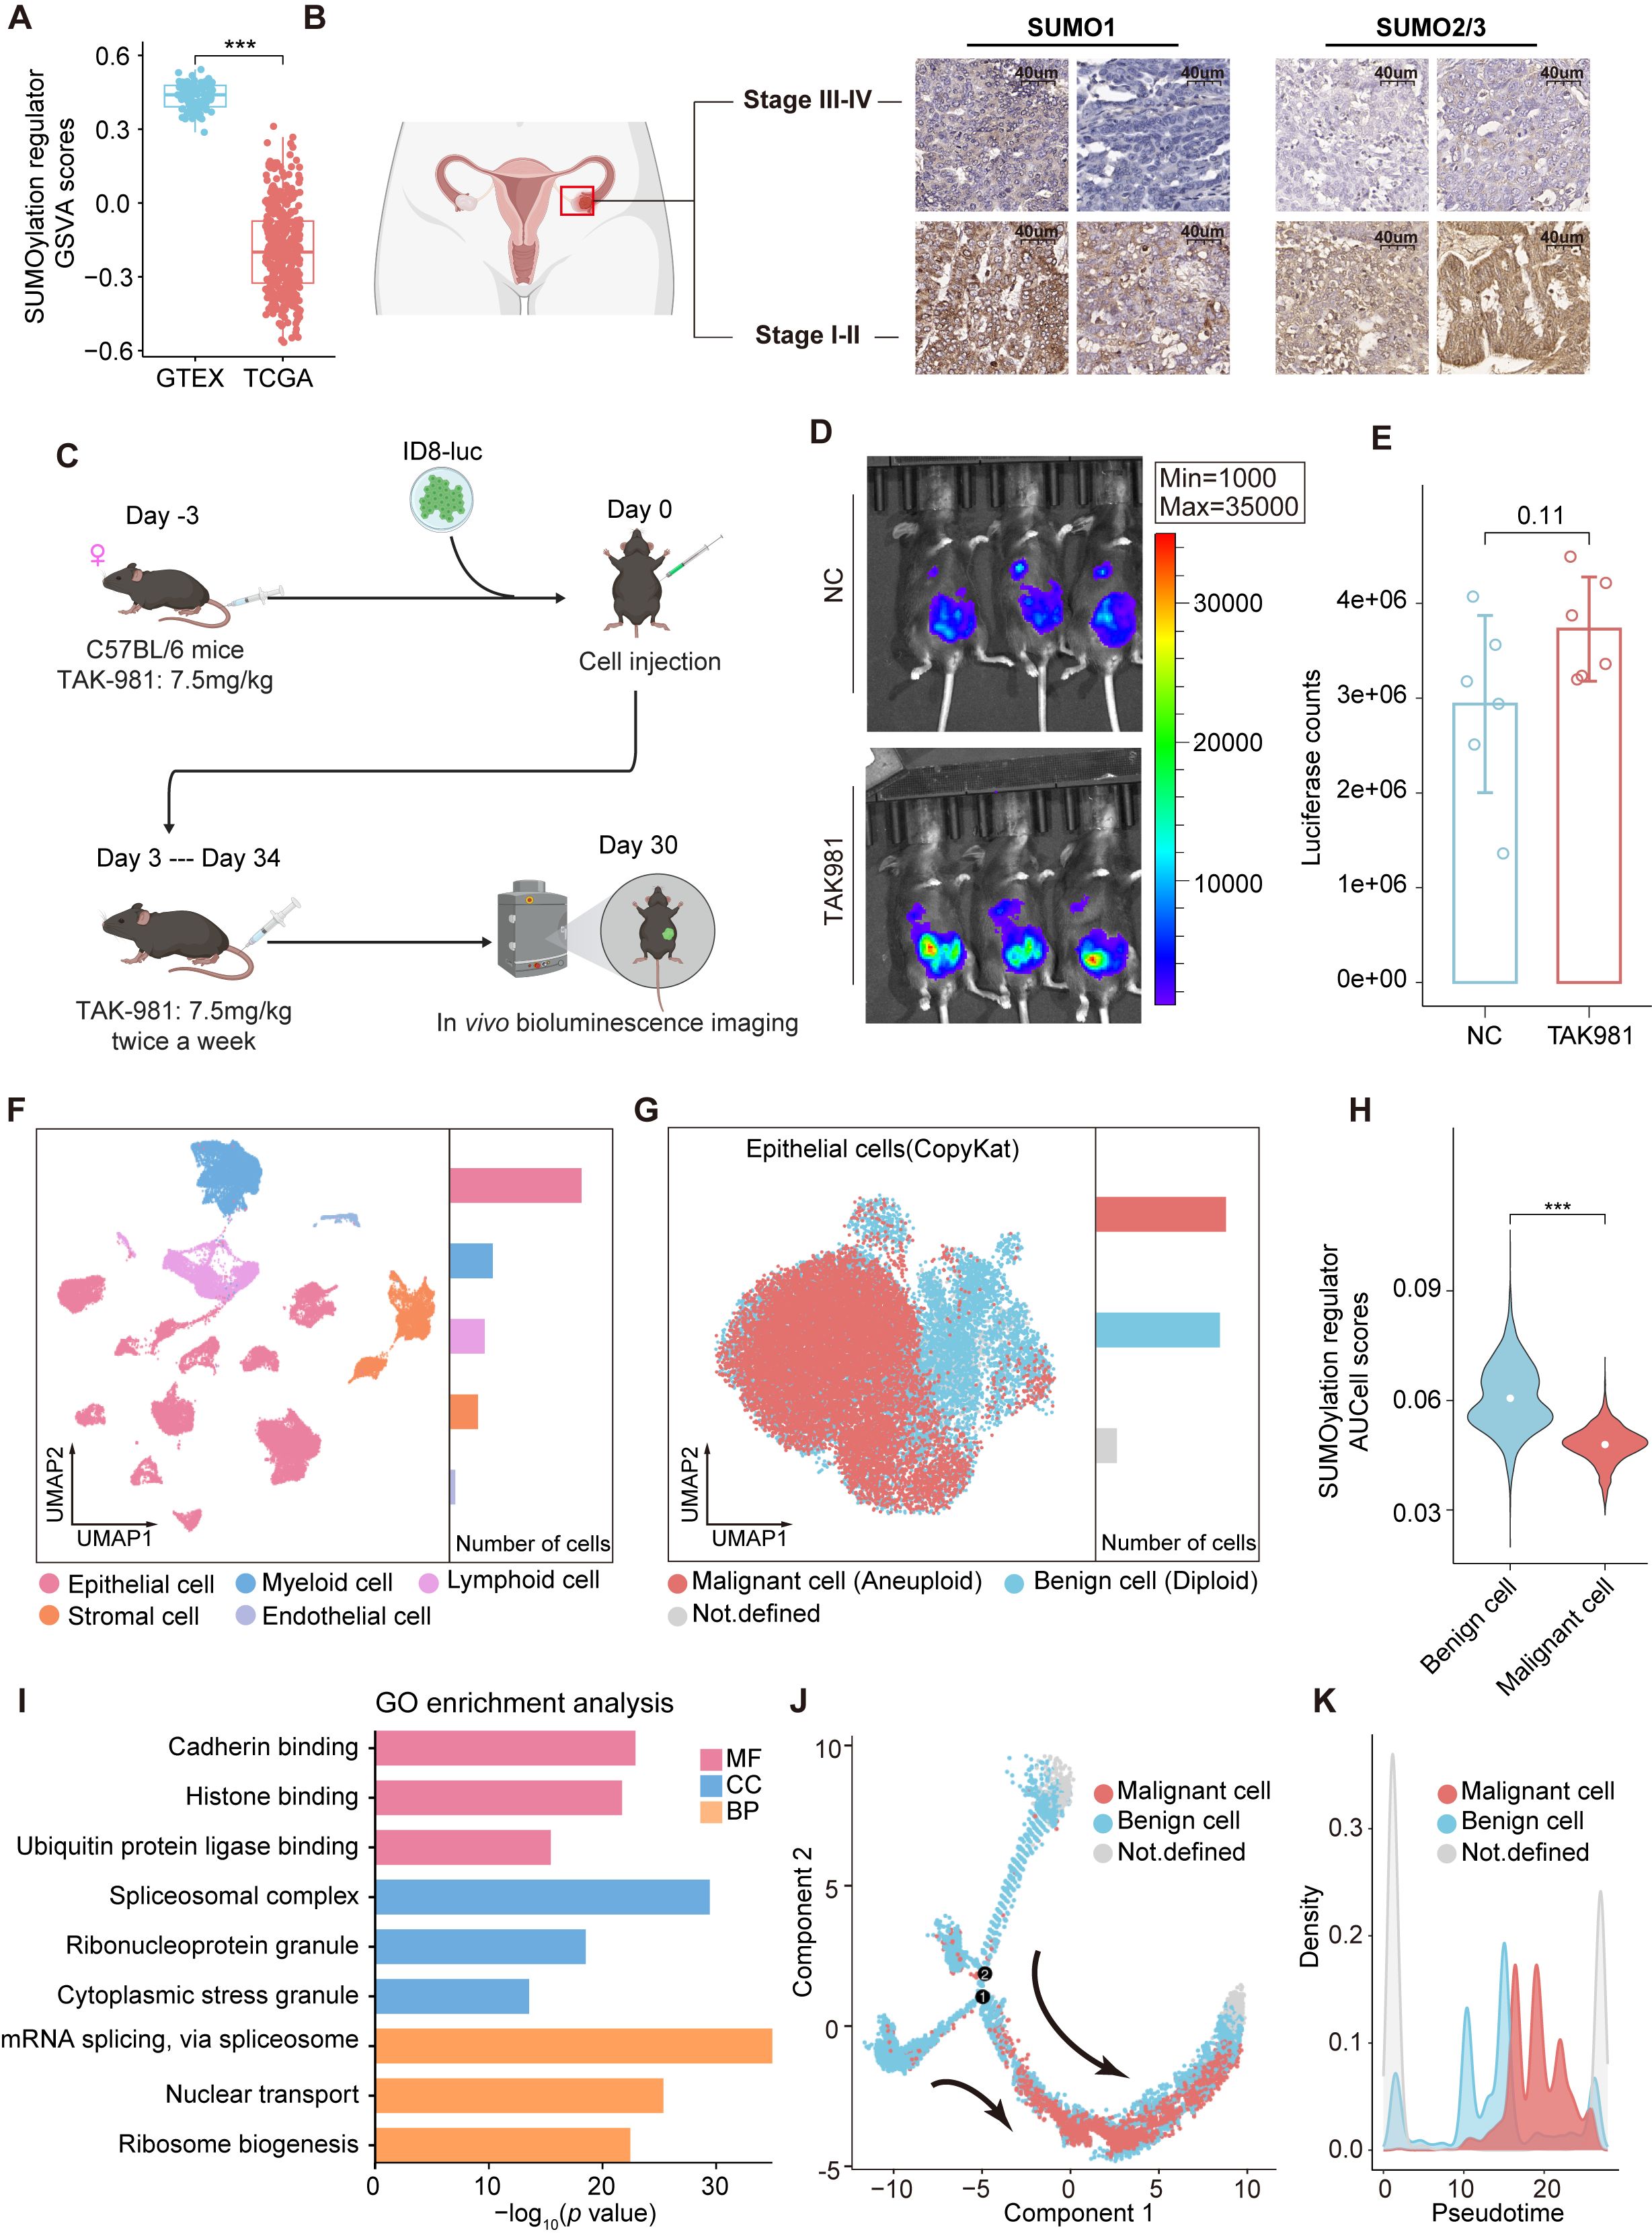
Figure 1. SUMOylation characteristic in ovarian cancer. (A) Boxplot comparing the GSVA scores of SUMOylation regulators between ovarian cancer and normal ovarian tissues. (B) Immunohistochemical staining of SUMO1 and SUMO2/3 in early and advanced stage ovarian cancer. (C) Design of the in vivo experiments. (D) Bioluminescence images showing the tumor burden of C57BL/6 mice following inoculation with luciferase tagged ID8 cells and subsequent treatment with TAK981 or saline. (E) The tumor burden was evaluated by quantification of total flux with Living Image software. (F) UMAP plot of 45146 cells from ovarian cancer (primary tumors) grouped into 5 clusters according to cell type. The bar chart on the right displays the relative abundance of each cell type. (G) Epithelial cells are reclustered and presented in UMAP plots. The CopyKAT algorithm was utilized to identify aneuploid (malignant) and diploid (benign) cells in ovarian cancer. (H) Violin plots representing the differences in the expression of SUMOylation regulators between malignant and benign epithelial cells. (I) GO analysis of the SRGs in epithelial cells. (J) Monocle trajectory analysis of epithelial cells. The arrow indicates the pseudotime trajectory of epithelial cells from a benign state to a malignant state. (K) The density plot reveals changes in the relative abundance of malignant and benign cells across pseudotime. ***, P < 0.001.
We then employed the widely used ID8 mouse model to evaluate the efficacy of SUMO inhibitors for ovarian cancer (Figure 1C), in which a total of 5×10⁶ ID8-luc cells were injected intraperitoneally into immunocompetent C57BL/6 mice. The mice were treated with the SUMOylation inhibitor TAK-981 (7.5 mg/kg) or saline (negative control, NC) starting prior to tumor implantation and continued twice weekly until the study endpoint, as TAK-981 has also been reported to effectively inhibit tumor growth in other cancers (19, 20). However, we found no significant differences at the endpoint and the tumor burden in the SUMOylation inhibition group showed an increasing trend compared to the NC group (Figures 1D, E).
To further explore the unique characteristics of SUMOylation in ovarian cancer, we analyzed scRNA-seq data from PRJCA005422 (21), comprising 45,146 cells from primary tumor samples of ten patients with advanced ovarian cancer (Figure 1F, Supplementary Figure S1). Five distinct cell clusters were identified and annotated according to the expression of classical marker genes (21), the cell types included epithelial cells, myeloid cells, lymphocytes, stromal cells and endothelial cells. We reclustered epithelial cells and distinguished malignant from normal cells based on copy number variations (CNVs) using the CopyKAT algorithm (Figure 1G). SUMOylation regulators’ expression was quantified via AUCell. Differential analysis revealed that malignant ovarian cancer cells presented relatively low SUMOylation regulators AUCell scores, which is consistent with our previous findings (Figures 1H, A).
We then performed differential expression analysis on epithelial cell groups with high and low expression of SUMOylation regulators and identified 2,538 SUMOylation-related genes (SRGs) (Supplementary Table S2). Gene Ontology (GO) enrichment analysis revealed that the SRGs were significantly enriched in pathways involved in protein synthesis and ubiquitin ligase activity regulation, underscoring the broad regulatory effect of SUMOylation on cellular metabolism and functions of ovarian cancer (Figure 1I). We analyzed the changes in epithelial cell features during cancer progression by inferring their state trajectories via Monocle, with SRGs used as temporal markers of differential expression. Two primary trajectories from benign to malignant cells were identified across pseudotime (Figures 1J, K), underscoring the close association of SRGs with the malignancy of ovarian epithelial cells.
Overall, although numerous studies have revealed the oncogenic effects of elevated SUMOylation in various hematologic (22, 23) and solid tumors (19, 24), SUMOylation inhibition therapy may not achieved the expected outcomes in ovarian cancer. Considering the close association between SRGs and the malignancy of ovarian epithelial cells, identifying potential therapeutic targets and prognostic biomarkers from SRGs may be a promising direction.
3.2 Integrated machine learning identified 22 prognostic SRGs
To identify key SRGs, particularly those with consistent roles across diverse cohorts of ovarian cancer patients, we analyzed five datasets comprising patients from different ethnic backgrounds. Genes with absolute z-scores greater than 0.01 across all datasets were intersected with SRGs, resulting in a total of 1,722 genes (Supplementary Figure S2A, Supplementary Table S3). Using survival data from TCGA-OV, we performed univariate Cox proportional hazards analysis and identified 124 SRGs potentially associated with ovarian cancer patient survival for further investigation (Supplementary Figure S2B, Supplementary Table S4).
We employed 80 combinations of ten machine learning algorithms (RSF, Enet, Lasso, Ridge, stepwise Cox, CoxBoost, plsRcox, SuperPC, GBMand survival-SVM) to assess the TCGA-OV cohort as the training set. Validation was conducted on the independent datasets GSE13876, GSE17260, GSE19829 and GSE26712 (Figure 2A, Supplementary Table S5). On the basis of the average C-index ranking, we identified the algorithmic pattern (Enet [α=0.2] and StepCOX [both]) with the highest average C-index (0.654). For Enet [α=0.2], the optimal λ was determined via the leave-one-out cross-validation (LOOCV) framework when the partial likelihood deviance reached its minimum. Thirty-eight genes with coefficients greater than 0.01 were subjected to stepwise Cox proportional hazards regression, which identified a final set of 22 SRGs. This model, the SUMOylation-related gene model (SRGM), was used to compute SRGM scores for each patient according to the expression of these 22 SRGs (ten risk genes: PI3, SOGA1, AUP1, CCDC80, FBLN1, TSC22D1, RPS12, LAMC1, RAB34 and MRPS12; 12 protective genes: HSP90AB1, LUC7L2, KLF5, CD44, SPON1, DAP, COA4, LAMC2, GNAS, MAGED2, MMP9 and CD200) and their weighted Cox model coefficients (Figure 2B, Supplementary Table S6). Risk factor association plots revealed that the high-SRGM score group had a shorter survival time and a higher mortality rate (Figure 2C).
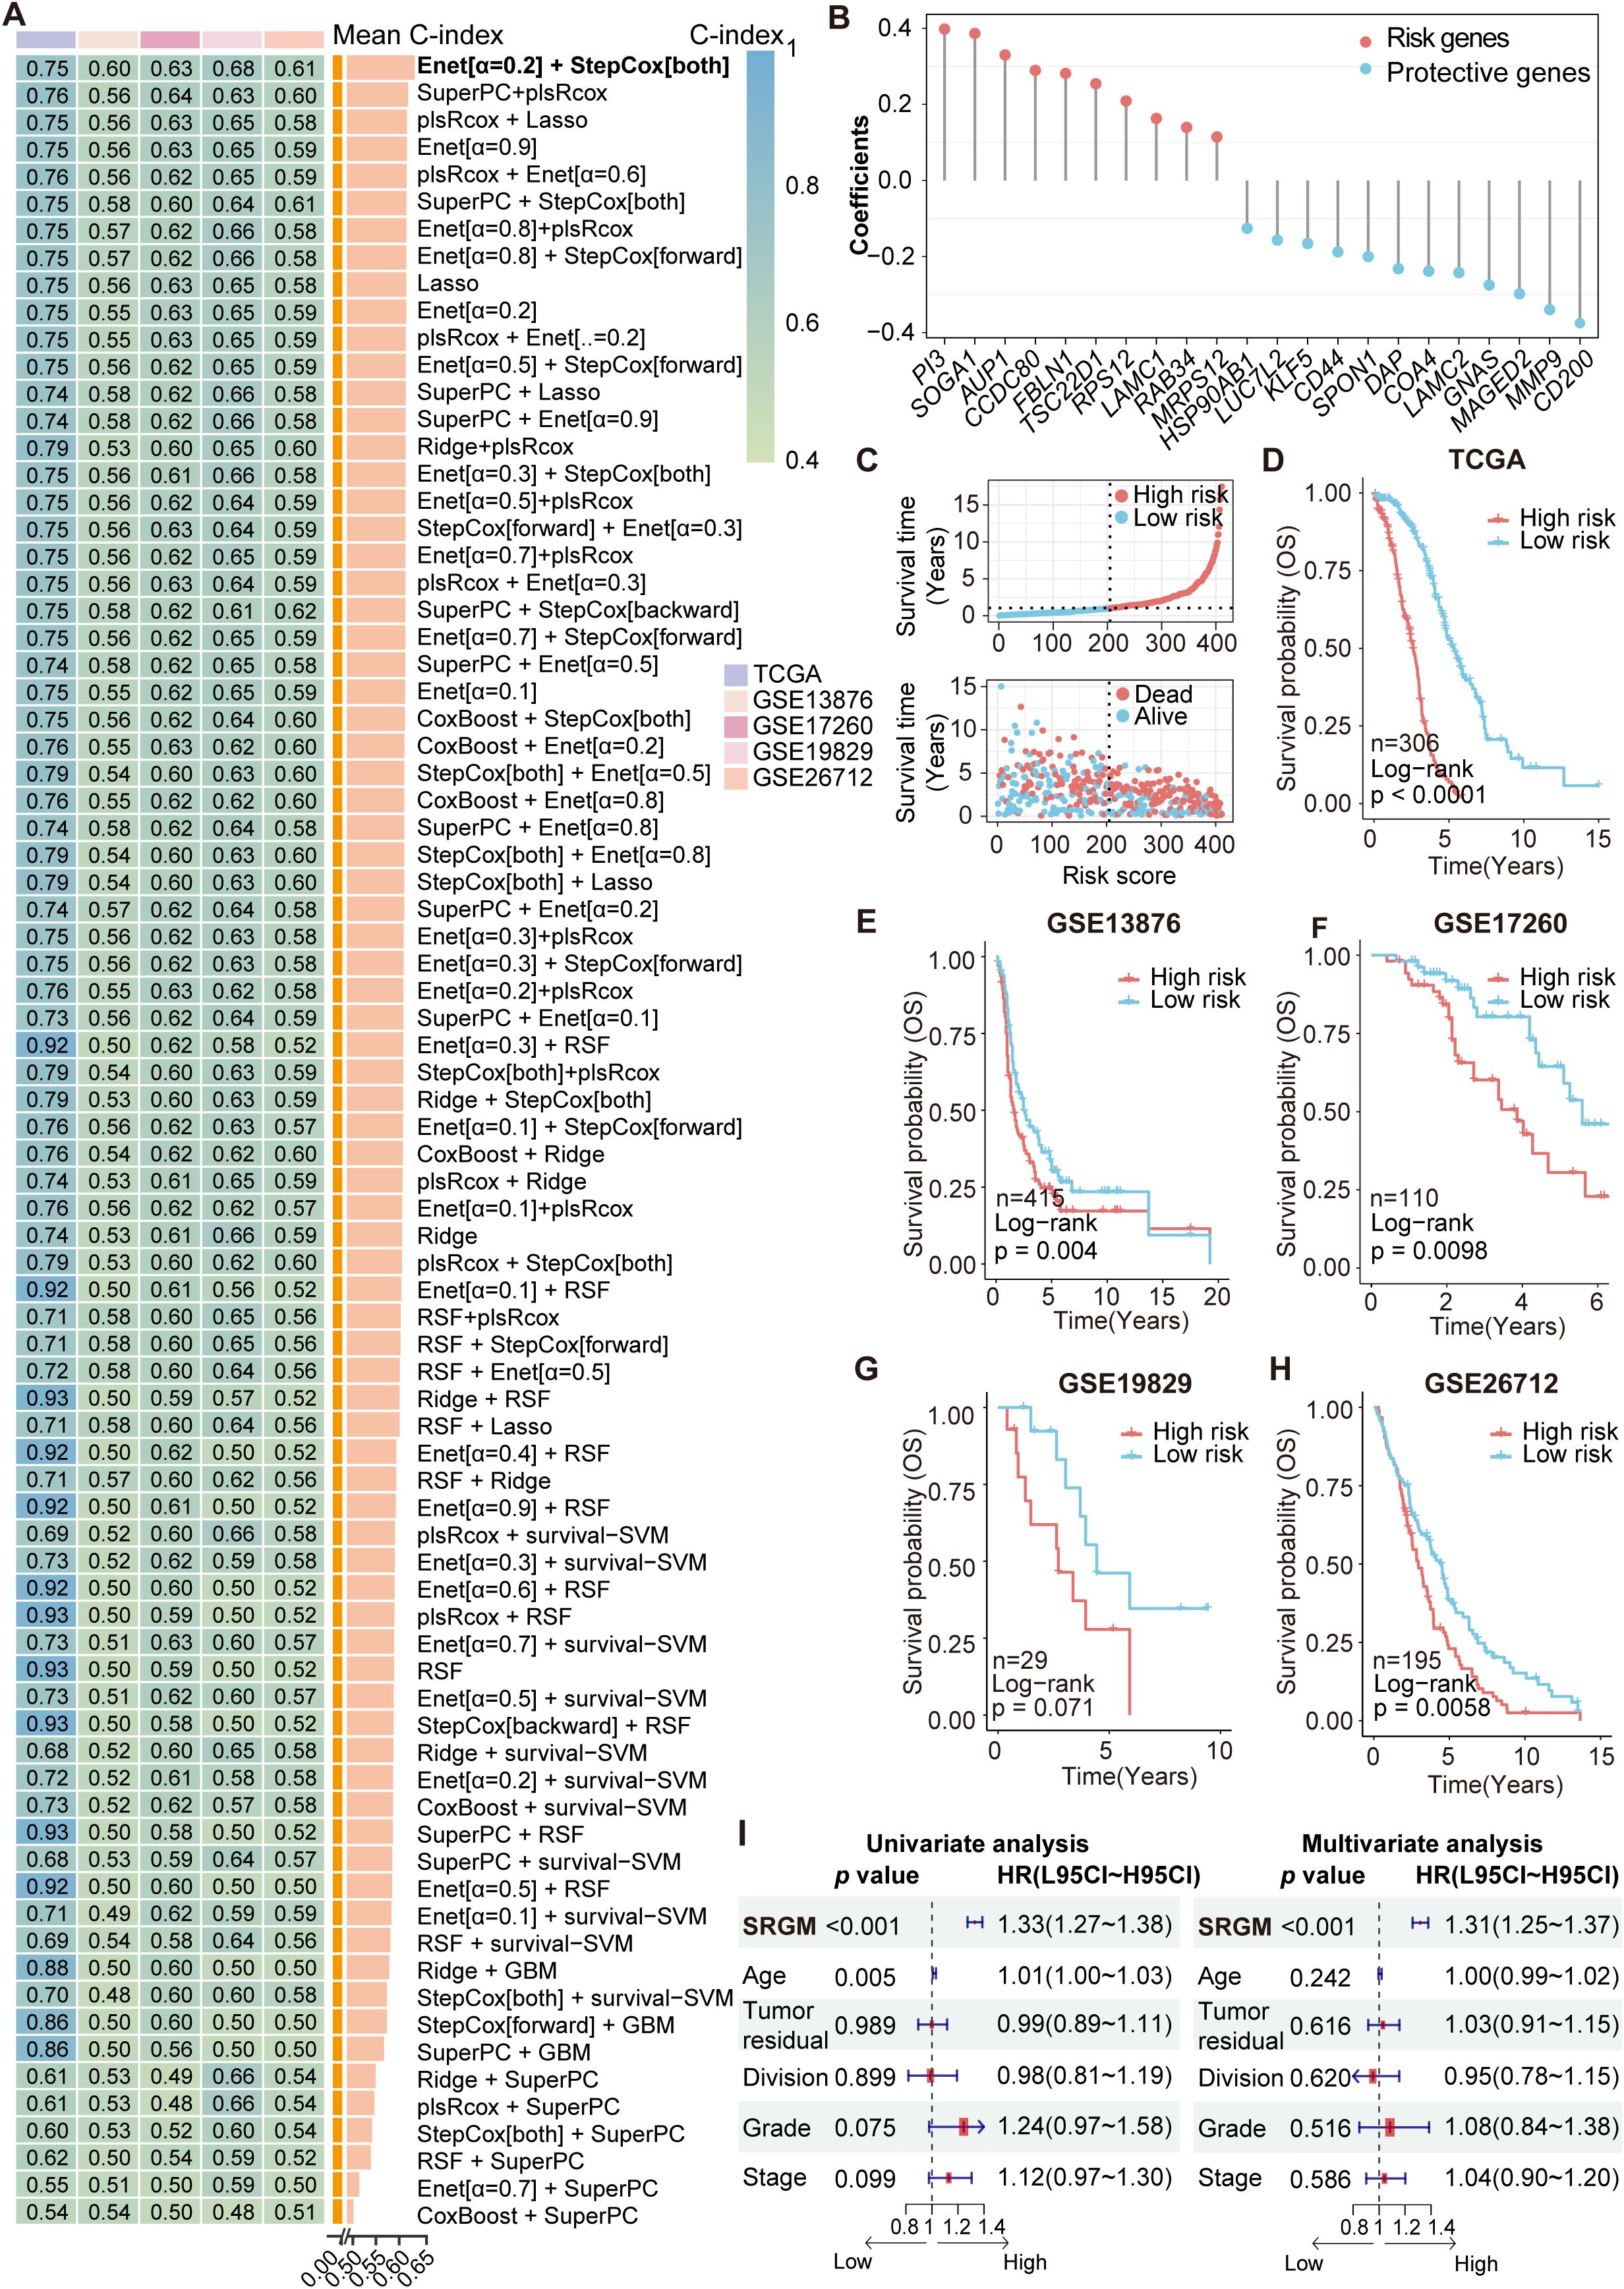
Figure 2. Construction and validation of a machine learning model to identify survival-associated SUMOylation-related genes. (A) A total of 80 kinds of prediction models were constructed via the LOOCV framework, and the C-index of each model across all the validation datasets was further calculated. (B) Coefficients of 22 SRGs ultimately obtained via Enet (α=0.2) and stepwise Cox regression (both). (C) Risk factor plot displaying the association between the SRGM score and survival. (D–H) Kaplan–Meier curves of overall survival according to the SRGM scores in the TCGA-OV (n=306, log-rank test: P < 0.0001) (D), GSE13876 (n=415, log-rank test: P = 0.0040) (E), GSE17260 (n=110, log-rank test: P = 0.0098) (F), GSE19829 (n=29, log-rank test: P = 0.071) (G), and GSE26712 (n=195, log-rank test: P = 0.0058) (H) cohorts. (I) Univariate and multivariate Cox regression analyses were performed to explore the prognostic value of the SRGs and clinicopathological features.
Additionally, Kaplan-Meier (KM) curves across the training and validation sets consistently demonstrated that patients with high SRGM score exhibited poorer survival, indicating the strong prognostic value and broad applicability of these 22 SRGs (Figures 2D-H). We stratified patients from the TCGA-OV cohort into various subgroups on the basis of their clinical information. We found that patients with high SRGM scores presented poorer prognoses across patients grouped by age, postoperative residual tumor status, tumor division, tumor stage and tumor grade (Supplementary Figure S3A). Univariate and multivariate Cox regression analyses were conducted to assess the predictive value of the SRGM score and clinical factors (Figure 2I). SRGM scores emerged as the sole significant predictor of ovarian cancer outcomes in both Cox regression models.
With the rapid advancement of big data technologies, including high-throughput sequencing and machine learning, an increasing number of prognostic features have been identified to facilitate precise medical management of cancer patients (25). To comprehensively compare the performance of the SRGM with other models to predict survival among ovarian cancer patients, we compiled information on 50 published prognostic gene signatures and computed their respective C-index values (Supplementary Figure S3B, Supplementary Table S7). The SRGM consistently exhibited superior performance across all five independent datasets, underscoring its superior predictive accuracy and broad applicability (Supplementary Table S8). These findings also suggest that among all the SRGs, 22 SRGs comprising the SRGM have the most significant impact on ovarian cancer prognosis.
3.3 SUMOylation inhibition regulates the expression of key SRGs
We first performed a differential analysis of the GSVA scores of SUMOylation regulators between patients with high and low SRGM scores in the TCGA-OV cohort (Figure 3A). The results indicated that patients with high SRGM scores exhibited significantly lower GSVA scores of SUMOylation regulators and SRGM scores were negatively correlated with these GSVA scores (Figure 3B). Additionally, SRGM scores showed a significant negative correlation with the expression of various key SUMOylation regulators (Figure 3C).
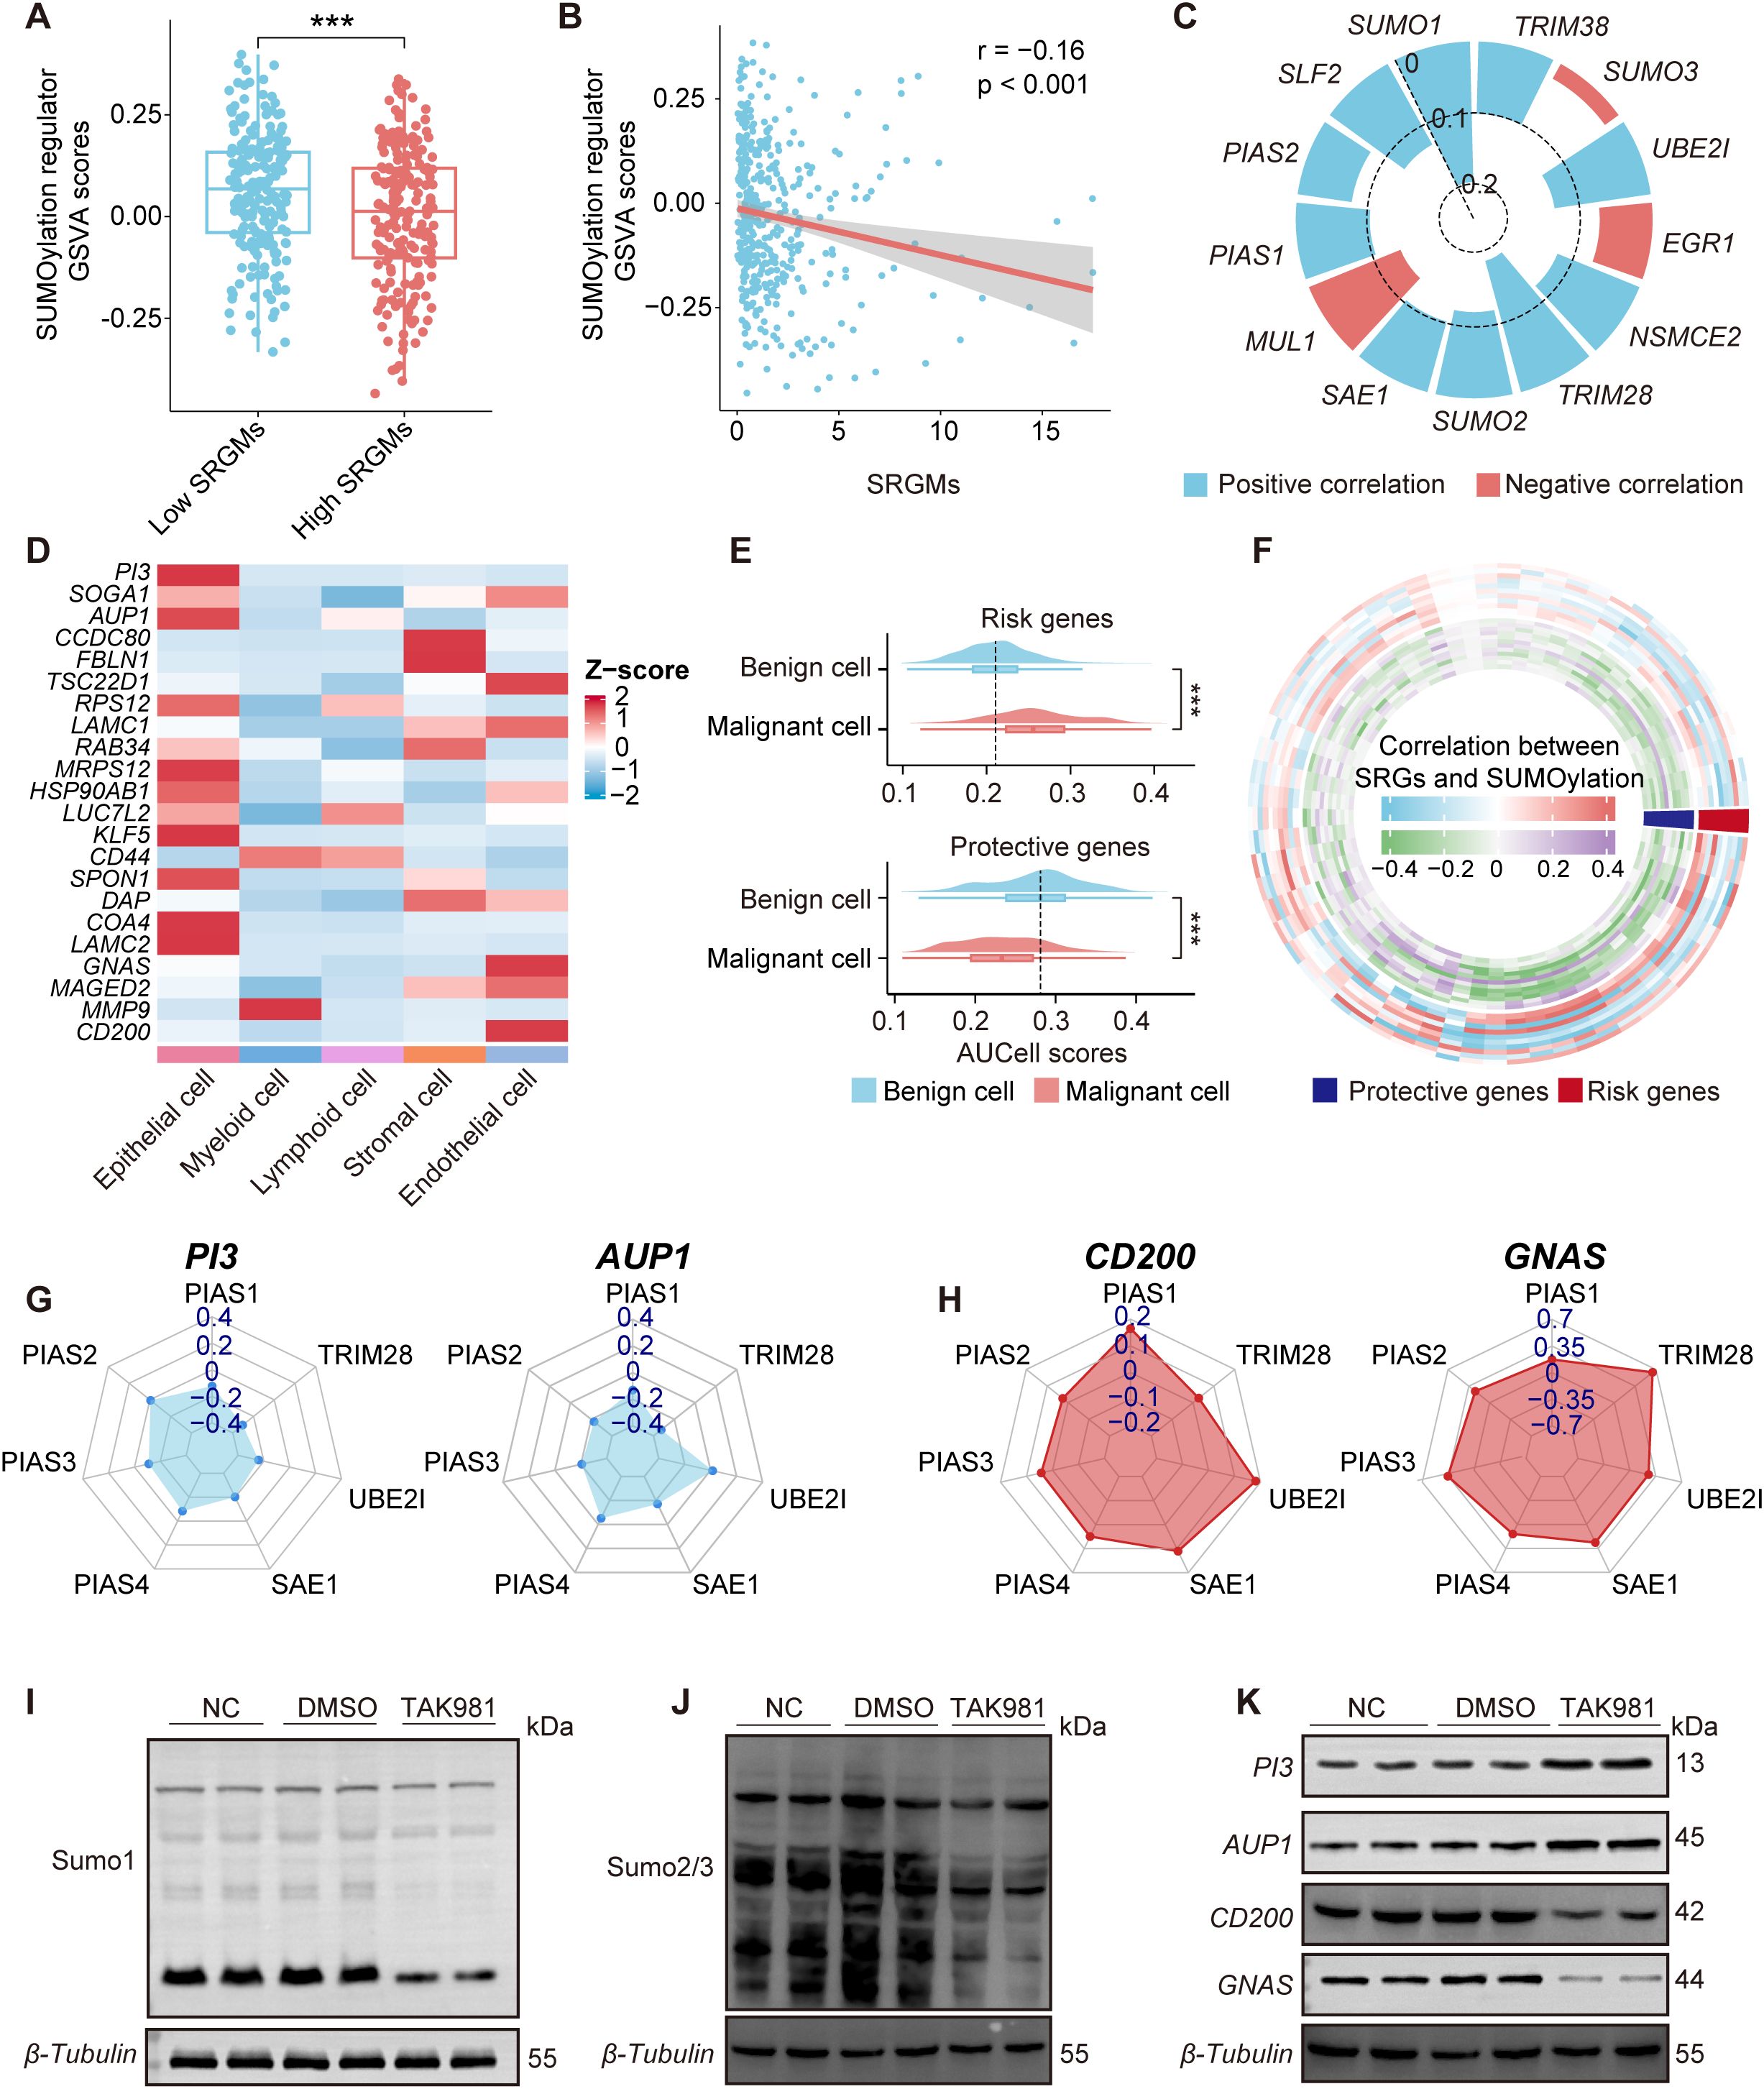
Figure 3. SUMOylation inhibition regulates the expression of key SRGs. (A) Boxplot comparing the GSVA scores of SUMOylation regulators between patients with high and low SRGM scores. (B) Scatterplots illustrating the correlation between GSVA scores of SUMOylation regulators and SRGM scores. (C) Circular bar plot showing Spearman correlation coefficients between the SRGM score and SUMOylation regulators expression, highlighting positive (red) and negative (blue) correlations. (D) Heatmap showing the distribution of the expression of 22 SRGs across five cell clusters. (E) Violin plots representing the differences in the expression of risk genes and protective genes between malignant and benign epithelial cells. (F) Ring heatmap showing Spearman correlations between SUMOylation regulators and key genes. Red indicates risk genes, and blue indicates protective genes. (G, H) Radar plot depicting the Spearman’s rank correlation coefficient between seven SUMOylation regulators and two risk genes (PI3 and AUP1) (G) and two protective genes (CD200 and GNAS) (H). (I-K) Western blot showing the changes in SUMO1 (I), SUMO2/3 (J), PI3, AUP1, CD200, and GNAS (K) expression in primary ovarian cancer cells after treatment with DMSO or TAK981. Each experiment was independently repeated three times. ***, P < 0.001.
To further explore the potential link between the expression of the 22 SRGs comprising the SRGM and SUMOylation levels at the single-cell level, we conducted expression profiling across five distinct cell clusters and normalized the data based on Z-scores (Figure 3D). Our analysis revealed that epithelial cells presented relatively higher expression levels of these 22 SRGs than other cell clusters did. Next, we employed AUCell to assess the expression of risk genes and protective genes in both benign and malignant epithelial cells (Figure 3E). Compared to benign cells, malignant cells presented higher risk gene scores and lower protective gene scores, which is consistent with the notion that risk genes promote cancer progression, whereas protective genes inhibit it.
SUMOylation can impact downstream gene expression through various mechanisms, such as altering the activity and localization of transcription factors, influencing chromatin structure and regulating signaling pathways. Therefore, we sought to further investigate whether SUMOylation inhibition in ovarian cancer could significantly influence, or more specifically regulate the expression levels of certain key SRGs. Correlation analysis further revealed potential associations between 68 SUMOylation regulators and 22 SRGs (Figure 3F). We found that four key SRGs—two risk genes PI3 and AUP1 and two protective genes CD200 and GNAS—are most significantly correlated with SUMOylation regulators. The expression of risk genes PI3 and AUP1 was negatively correlated with the expression of key SUMOylation regulators, particularly the genes encoding critical enzymes involved in the SUMOylation process such as SAE1 and UBE2I, whereas the expression of protective genes CD200 and GNAS was positively correlated with these regulators (Figures 3G, H, Supplementary Figure S4A). To validate our findings, in situ tumor samples were collected during surgery from ovarian cancer patients who had not undergone chemotherapy and primary cells were promptly extracted. We then inhibited overall SUMOylation in these primary cells via TAK-981 (5 µM/ml, 12h). The WB results demonstrated that the addition of TAK-981 led to decreased levels of SUMO1 and SUMO2/3 in primary ovarian cancer cells, increased the protein levels of PI3 and AUP1 and decreased the protein expression of CD200 and GNAS. We also performed qPCR analysis using RNA extracted from frozen tumor tissues of mice treated with TAK-981 or vehicle control. The results showed that the mRNA levels of PI3 and AUP1 were significantly upregulated in the TAK-981 group, while the expression levels of CD200 and GNAS were notably reduced, consistent with the results of the correlation analysis (Figures 3I-K, Supplementary Figure S4B).
These findings suggest that the expression levels of key SRGs in ovarian cancer, including PI3, AUP1, CD200 and GNAS, can be regulated by global SUMOylation levels.
3.4 Association between key SRGs and epithelial cell functional pathways and chemoresistance
To investigate the role of key SRGs in ovarian cancer, we performed a correlation analysis between the SRGM scores of each patient and the GSVA scores of tumor-associated functional pathways in TCGA-OV cohort (Figure 4A). The results revealed that SRGM scores were positively correlated with the activity of pathways such as epithelial-mesenchymal signaling and extracellular matrix assembly, while negatively correlated with the GSVA scores of various epigenetic processes, including histone binding and protein-DNA complex organization. Correlation analysis between the four key SRGs and these functional pathways revealed that the expression of risk genes PI3 and AUP1 was negatively correlated with the activity of these epigenetic processes, consistent with the findings based on SRGM scores. In contrast, the expression of protective genes CD200 and GNAS showed an opposite trend (Figure 4B). These findings were further validated in single-cell sequencing data (Figures 4C, D).
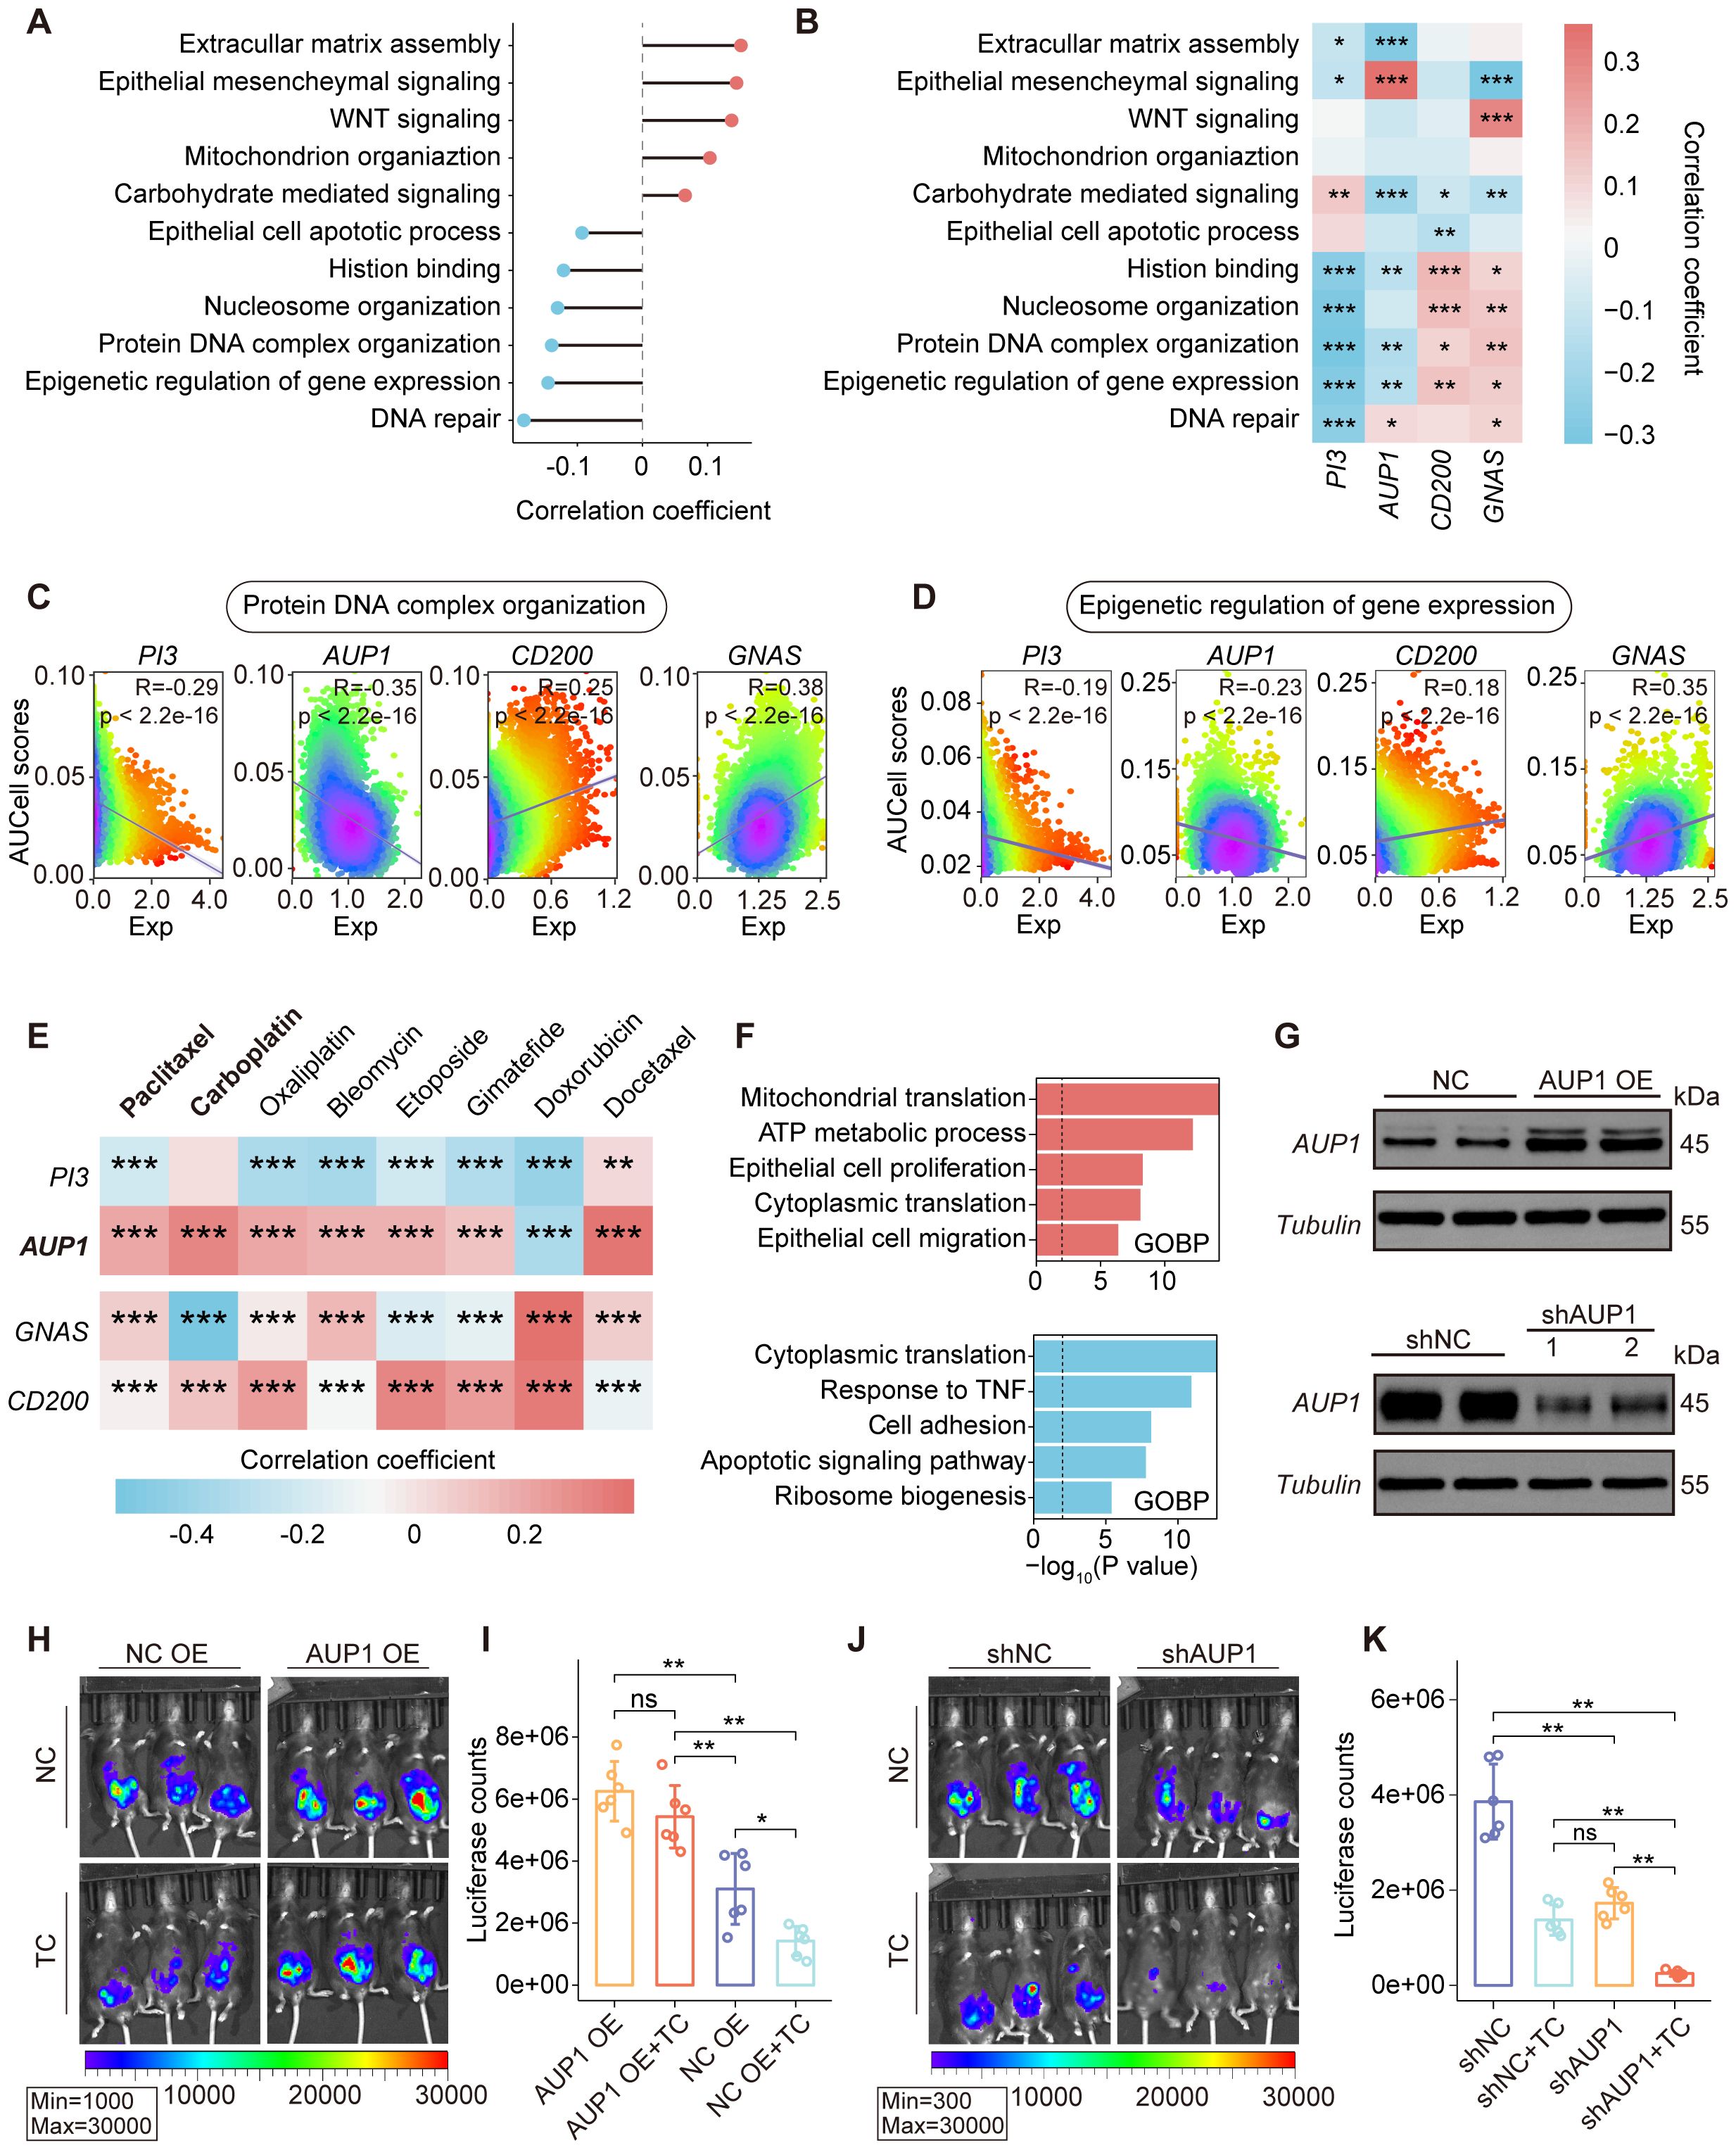
Figure 4. Association between the expression of key SRGs and epithelial cell functional pathways. (A) Correlations between SRGMs and GSVA scores of functional pathways in the TCGA-OV cohort. (B) Heatmap revealing the correlation between GSVA scores of functional pathways and the expression of PI3, AUP1, CD200 and GNAS. (C, D) Scatterplot showing the expression of PI3, AUP1, CD200 and GNAS in relation to the AUCell scores of the protein DNA complex organization pathway (C) and the epigenetic regulation of gene expression pathway (D) in epithelial cells. (E) Heatmap revealing the correlation between drug resistance scores and the expression of PI3, AUP1, CD200 and GNAS in epithelial cell. (F) Horizontal bar graphs representing the most differential pathways. Functional enrichment of genes with higher (up, red) and lower (down, blue) expression in high-AUP1 expression epithelial cells than in low-AUP1 expression epithelial cells. (G) AUP1 overexpression (top) and AUP1 knockdown (bottom) was confirmed by Western blotting. (H) Bioluminescence images showing the tumor burden of C57BL/6 mice following inoculation with AUP1 overexpression luciferase-tagged ID8 cells and subsequent treatment with TP. (I) The histogram showing the differences in tumor burden between the AUP1 OE group and the negative control NC group following TP treatment. (J) Bioluminescence images showing the tumor burden of C57BL/6 mice following inoculation with shAUP1 luciferase-tagged ID8 cells and subsequent treatment with TP. (K) The histogram showing the differences in tumor burden between the shAUP1 group and the negative control NC group following TP treatment. ns., not significant; *, P < 0.05; **, P < 0.01; ***, P < 0.001.
Epigenetic dysregulation is closely associated with the proliferation, invasion and chemoresistance of ovarian epithelial cells. Chemoresistance is one of the major factors contributing to poor prognosis in ovarian cancer patients. Using Beyondcell, a computational tool for predicting drug sensitivity in single-cell RNA-seq data, we assessed the resistance scores of each epithelial cell to commonly used chemotherapeutic agents in ovarian cancer and analyzed their correlation with gene expression (Figure 4E). We found that AUP1 expression was significantly positively correlated with resistance scores of paclitaxel and carboplatin. Further, based on AUP1 expression, we classified epithelial cells into two groups and performed differential enrichment analysis (Figure 4F). The results showed that epithelial cells with high AUP1 expression exhibited enhanced activities in epithelial cell proliferation, while exhibiting reduced activities in response to TNF.
Given the close association between AUP1 and epithelial cell proliferation and chemoresistance, we established the peritoneal ovarian cancer mouse model and conducted two groups of experiments. ID8 cells transfected with negative control (NC, overexpression or knockdown), AUP1 overexpression (AUP1 OE), or AUP1 knockdown (shAUP1) plasmids were intraperitoneally injected into mice (Figure 4G, Supplementary Figure S4C). The mice were treated with either the carboplatin-paclitaxel (TC) regimen or saline. We observed that mice injected with AUP1 OE ID8 cells exhibited a significantly higher tumor burden than the NC OE group. Although the NC OE group showed a marked reduction in tumor burden following TC treatment, the same regimen did not significantly reduce the tumor burden in AUP1 OE mice (Figures 4H, I). These findings suggest that AUP1 overexpression not only accelerates tumor progression but also promotes chemotherapy resistance. Conversely, mice injected with shAUP1 ID8 cells exhibited a significantly lower tumor burden compared to the shNC group, with further reduction after TC treatment (Figures 4J, K).
Overall, these findings suggest that the expression of key SRGs, including PI3, AUP1, CD200 and GNAS, is closely associated with the epigenetic regulation of epithelial cells. Among them, AUP1 overexpression may serve as a risk factor for chemoresistance and targeting AUP1 could potentially act as a therapeutic strategy to improve chemotherapy outcomes.
3.5 CD8+ cytotoxic T cells with high CCDC80 expression exhibits impaired anti-tumor function
The tumor immune microenvironment (TIME) refers to a complex network of tumor cells, immune cells, stromal components and secreted factors that plays a pivotal role in tumorigenesis, progression, immune evasion and therapeutic response (26). Interactions between immune cells and epithelial cells are bidirectional, mediated through mechanisms such as signal secretion and receptor activation, cell-cell contact and metabolic crosstalk (27).
To delve deeper into the association between key SRGs and TIME in ovarian cancer, we stratified patients from the TCGA-OV cohort on the basis of the SRGM score and conducted differential analysis, revealing 1,769 differentially expressed genes (Figure 5A). GO enrichment analysis of these genes revealed that immune-related pathways, such as lymphocyte-mediated immunity and leukocyte-mediated cytotoxicity, were significantly enriched among the downregulated genes (Figure 5B). Moreover, patients with high SRGM scores exhibited reduced tumor mutation burden (TMB) (Figure 5C). These findings suggest that patients with higher SRGM scores may experience suppressed antitumor immune function. Using the TIDE tool, we found that the high-SRGM score group presented a greater proportion of patients in this group demonstrated resistance to immunotherapy (Figure 5D).
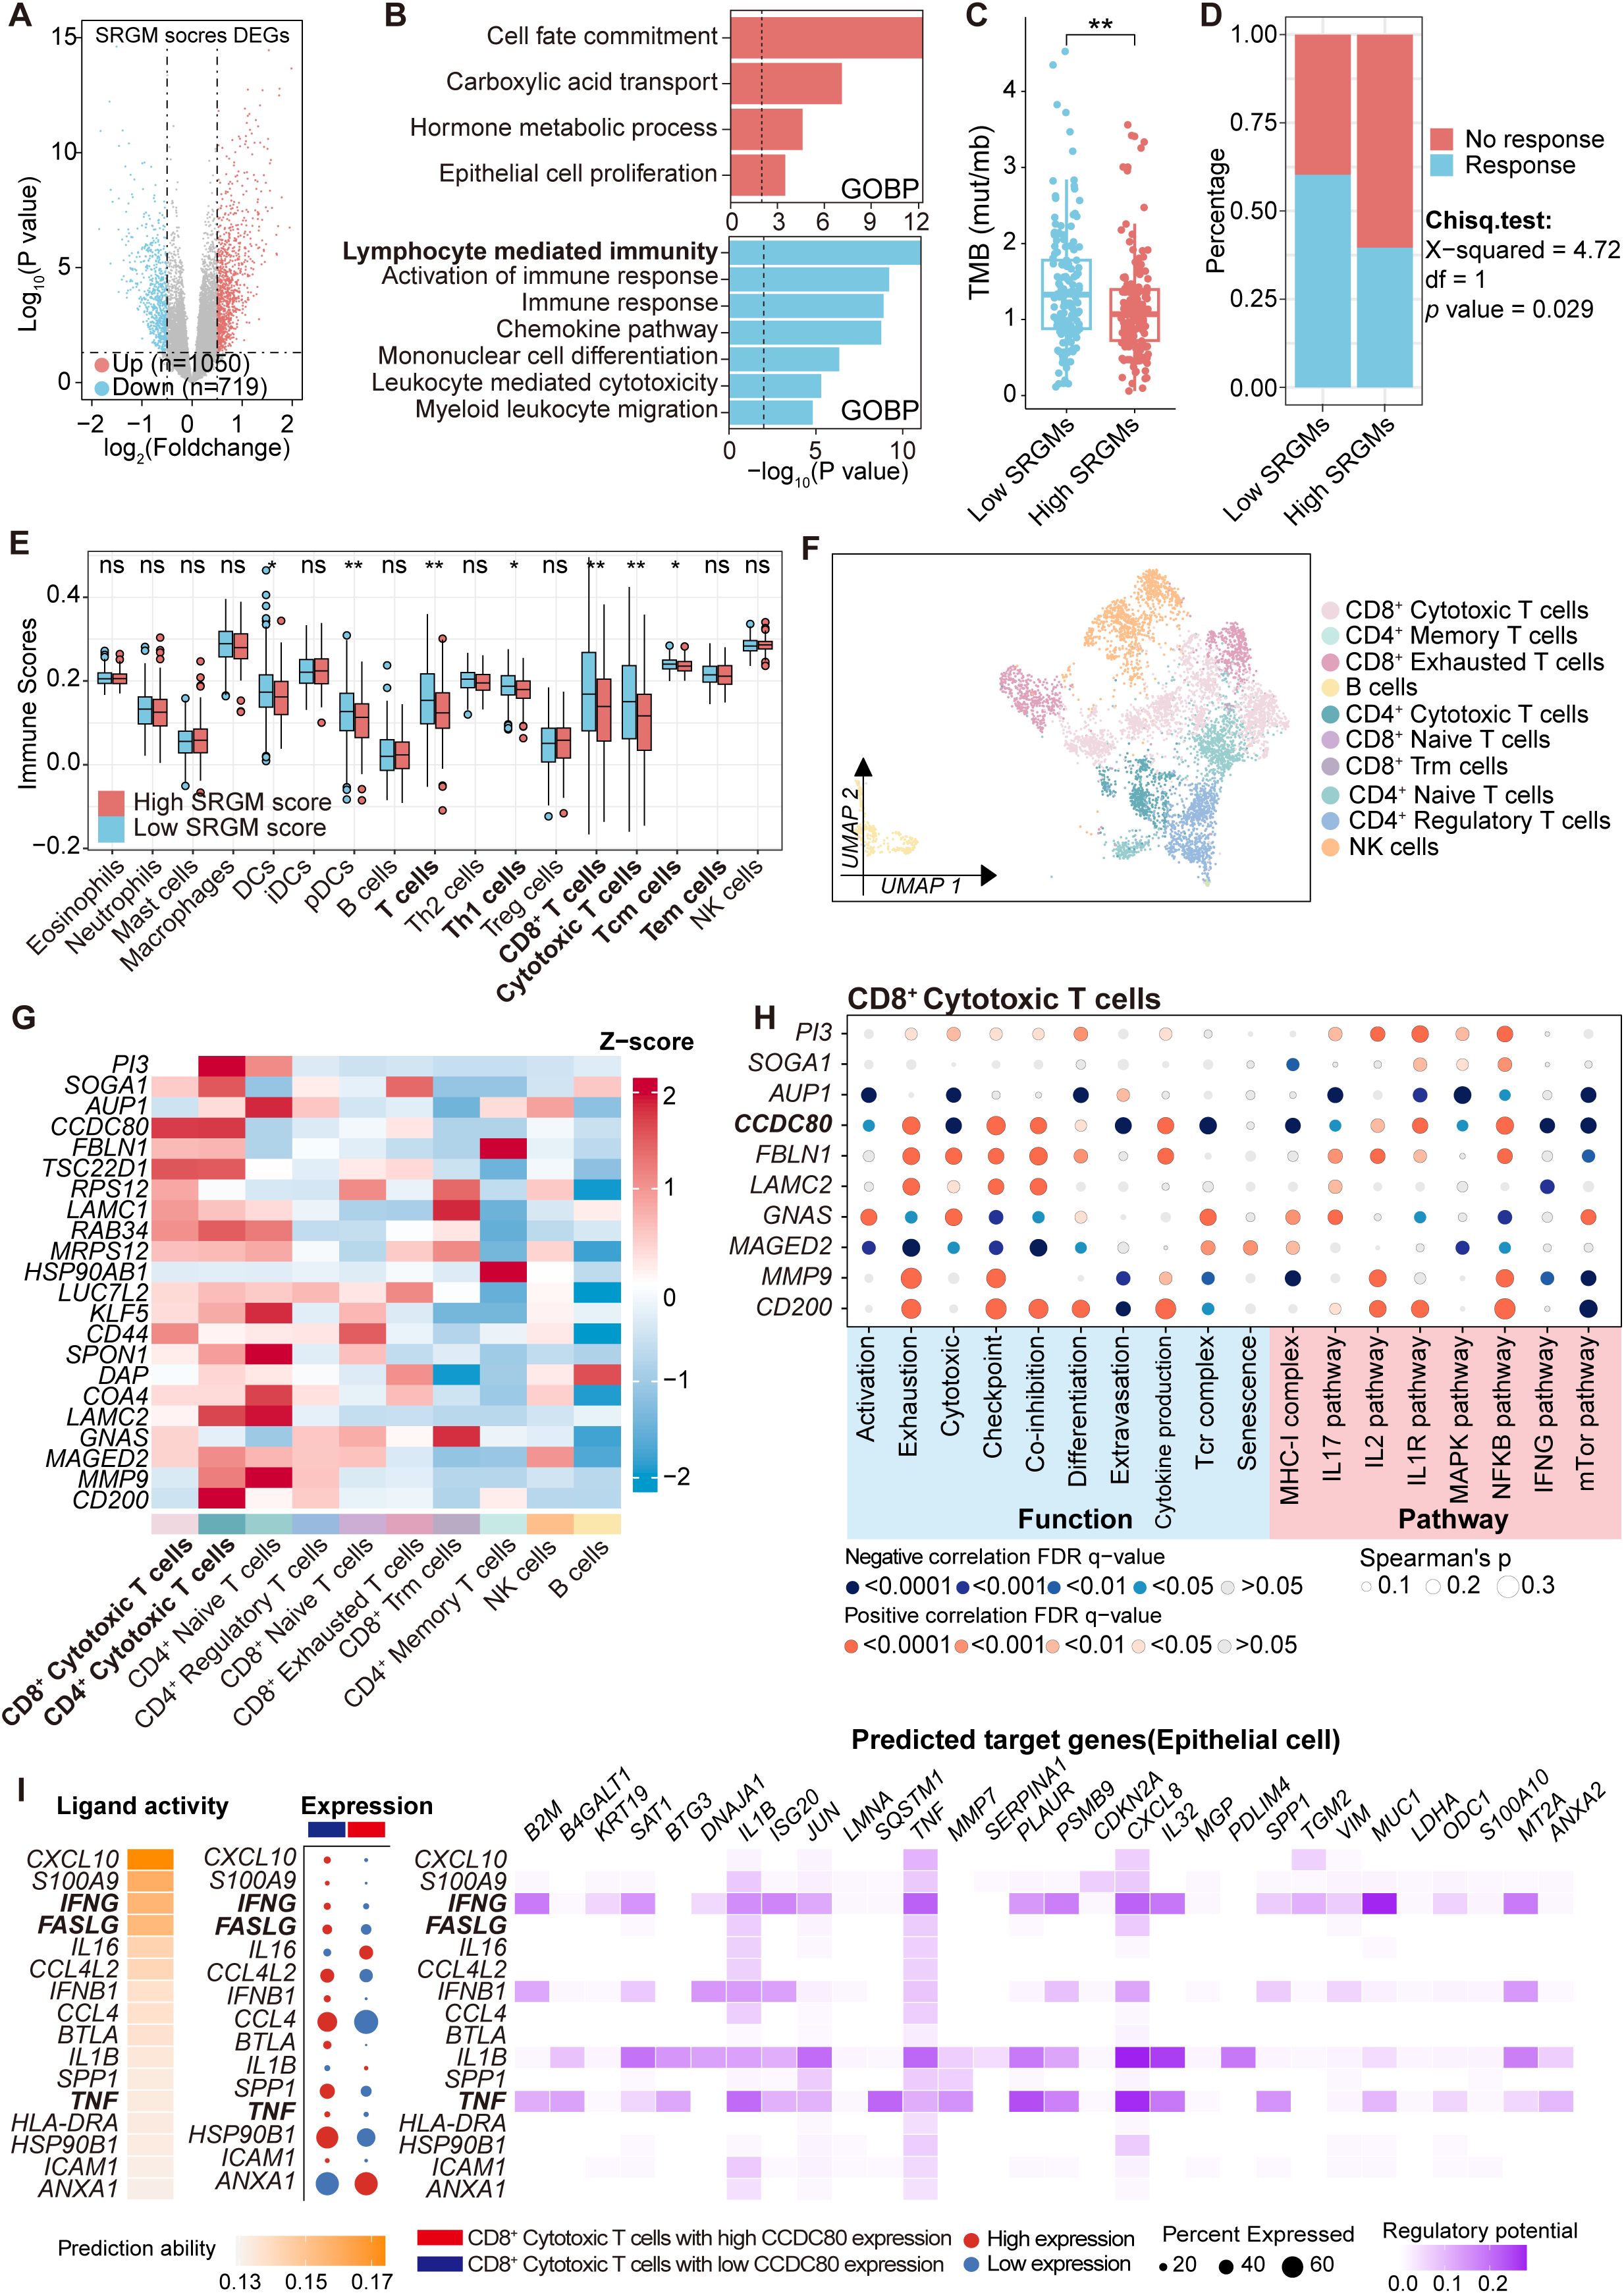
Figure 5. CD8+ cytotoxic T cells with high CCDC80 expression exhibited reduced anti-tumor function activities. (A) Volcano plot comparing differentially expressed genes between patients with high and low SRGM scores in the TCGA-OV cohort. (B) Horizontal bar graphs representing the most differential pathways. Functional enrichment of genes with higher (up, red) and lower (down, blue) expression in high-SRGM score patients than in low-SRGM score patients. (C) Comparison of TMB in the high- and low-SRGM score groups (n=306). (D) Predicted differences in the immunotherapy response between the high- and low-SRGM score groups according to the TIDE algorithm. (E) Comparisons of the abundances of 17 immune cells in the high- and low-SRGM score groups are shown in boxplots. (F) Lymphoid cells are reclustered and presented in UMAP plots. (G) Heatmap showing the distribution of the expression of 22 SRGs across the clusters. (H) Heatmap illustrating the Spearman correlation between the expression of SRGs (top five risk genes and top five protective genes) and the AUCell scores of cell functions, pathways, and metabolism across CD8+ cytotoxic T-cell clusters. (I) NicheNet was employed to analyze ligand and receptor expression, with the aim of elucidating how changes in CCDC80 expression in CD8+ cytotoxic T cells regulate intercellular communication patterns between epithelial cells and CD8+ cytotoxic T cells. ns., not significant; *, P < 0.05; **, P < 0.01.
We then performed single-sample gene set enrichment analysis (ssGSEA) to calculate immune scores for 17 common immune cell markers in each patient, which represented the abundance of these immune cells (Figure 5E, Supplementary Table S9). We found that lymphocyte populations, including T cells, CD8+ T cells and CD8+ cytotoxic T cells, were significantly lower in patients with high SRGM scores.
Single-cell data from ovarian cancer patients was utilized to perform a detailed analysis of the relationship between key genes and lymphocyte function. Lymphoid cells were reclustered into four main clusters: CD8+ T cells, CD4+ T cells, NK cells and B cells (Supplementary Table S10). Additionally, CD4+ T cells were subdivided into four clusters: CD4+ cytotoxic T cells, CD4+ naive T cells, CD4+ regulatory T cells and CD4+ memory T cells (Supplementary Table S11). Similarly, CD8+ T cells were divided into four clusters: CD8+ cytotoxic T cells, CD8+ naive T cells, CD8+ exhausted T cells and CD8+ Trm cells (Figure 5F, Supplementary Figure S5A, Supplementary Table S12) (17). We conducted expression profiling across ten distinct cell clusters. We observed that, compared with other subclusters of T cells, CD8+ cytotoxic T cells and CD4+ cytotoxic T cells presented the highest relative expression levels of 22 SRGs (Figure 5G). Additionally, CD8+ cytotoxic T cells constituted the largest proportion of all lymphocytes (Supplementary Figure S5B).
Previous studies have demonstrated that cytotoxic CD8+ T cells form the backbone of cancer immunotherapy and that their dysfunction can lead to poor responses to immunotherapy in solid tumors (28, 29). Therefore, we then focused on whether SRGs could influence the function of cytotoxic CD8+ T cells. The top five risk genes and five protective genes were selected and correlation analysis was performed between their expression and key functional and metabolic pathway AUCell scores in CD8+ cytotoxic T cells (Figure 5H, Supplementary Table S13). Importantly, the expression of CCDC80 was negatively correlated with activation and cytotoxicity but positively correlated with exhaustion and coinhibition. Subsequently, using Nichenet, we found that elevated expression of CCDC80 was found to reduce the activity of three critical signaling pathways involved in CD8+ T cell cytotoxic function: the FASLG, TNF and IFN-γ ligand–receptor pathways, leading to alterations in the expression of CXCL8 and MUC1 in epithelial cells (Figure 5I).
Overall, these results suggest that CD8+ cytotoxic T cells with high CCDC80 expression exhibit inhibited cytotoxicity activities against tumor cells, which may contribute to immune evasion and promote an immunosuppressive TIME.
3.6 Therapeutic potential and prognostic value of key SRGs in ovarian cancer patients
After comprehensively analyzing the effects of key SRGs on ovarian epithelial cells and the TIME, we aimed to validate the prognostic effect of these five candidate SRGs AUP1, PI3, CD200, GNAS and CCDC80. We collected FFPE samples from 60 patients who underwent surgical treatment at West China Second University Hospital between December 2017 and June 2019, tracking their recurrence events over a five-year follow-up period (Supplementary Figure S6A, Supplementary Table S14). We performed IHC staining for these five SRGs (Supplementary Figure S6A). The results revealed that the expression levels of PI3, AUP1 and CCDC80 were markedly increased in patients with recurrence than in those without recurrence, whereas the expression levels of CD200 and GNAS were lower in patients with recurrence (Figure 6A, Supplementary Figure S8A). Additionally, the Kaplan–Meier analysis indicated that patients with high expression levels of risk genes PI3, AUP1 and CCDC80 presented poorer progression-free survival (PFS) within five years, whereas those with high expression of protective genes CD200 and GNAS presented better PFS outcomes (Figure 6B).
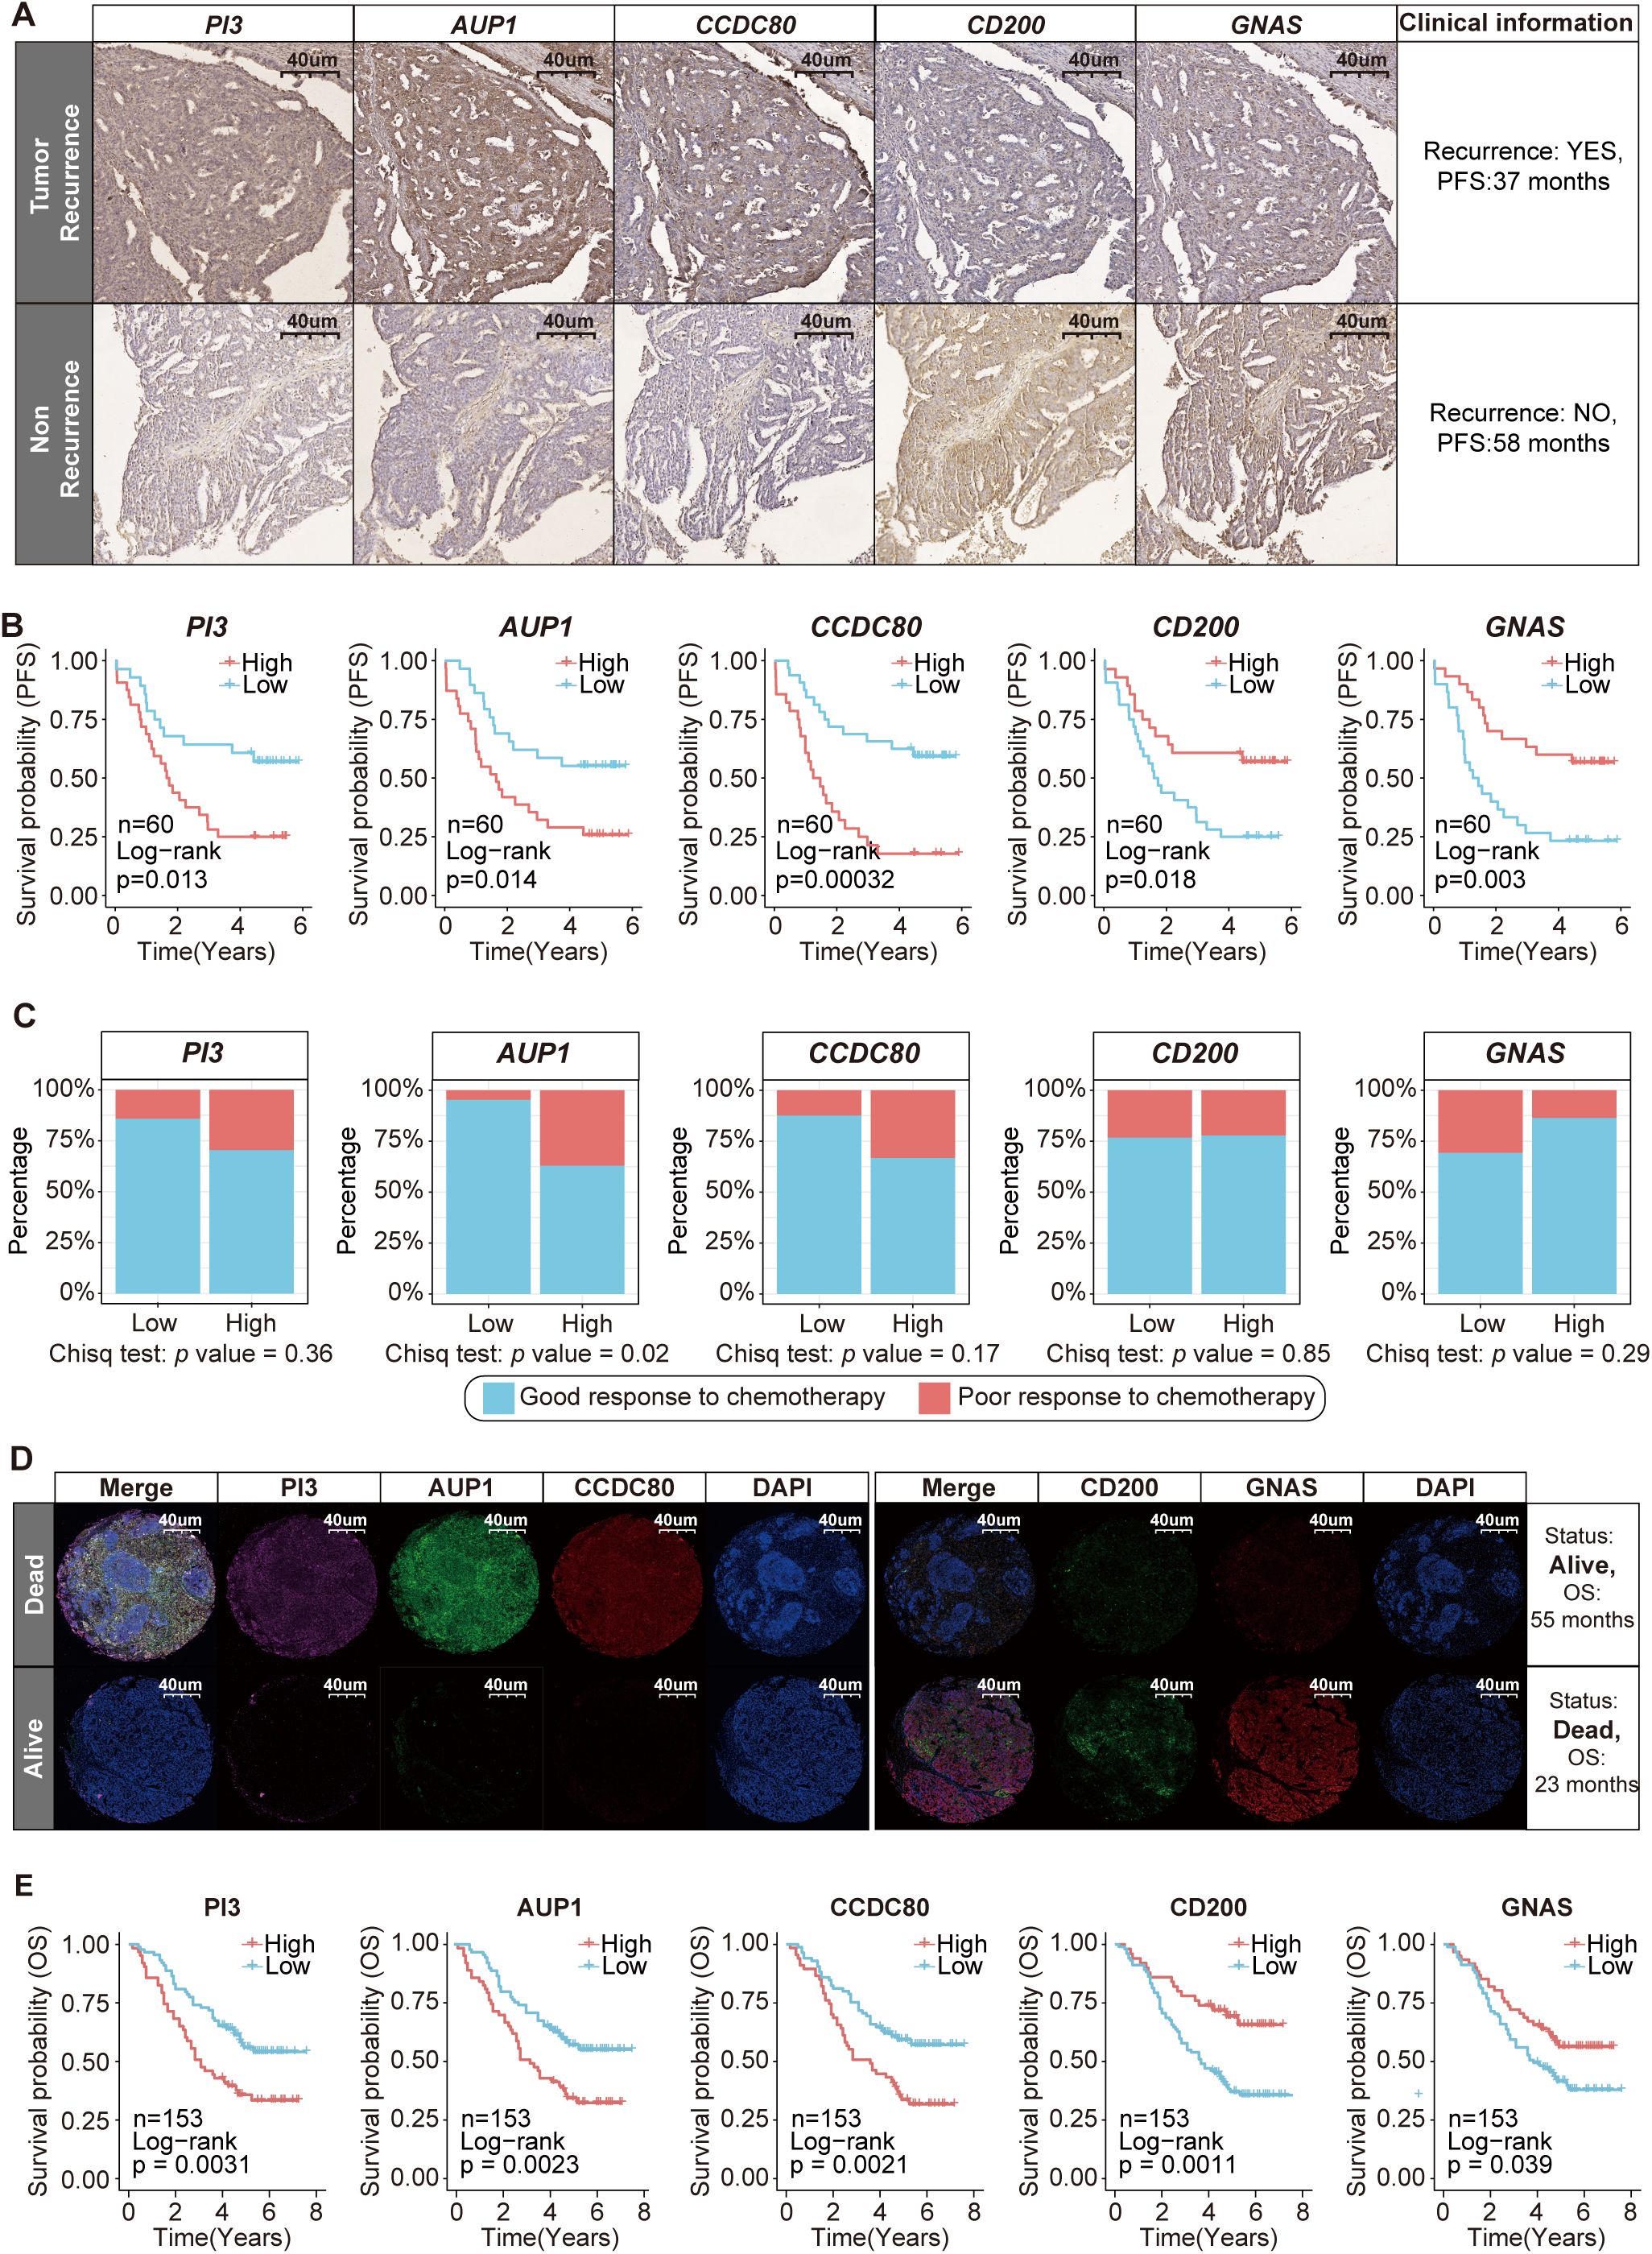
Figure 6. Clinical cohort validation of the prognostic value and therapeutic potential of five key SRGs. (A) Immunohistochemical staining of PI3, AUP1, CCDC80, CD200 and GNAS in patients with and without recurrence. (B) Kaplan–Meier curves of PFS according to the expression levels of PI3, AUP1, CCDC80, CD200 and GNAS (n=60). (C) The stacked bar chart illustrates the distribution differences in the chemotherapy response between the high- and low-expression groups of five key SRGs (n=60). (D) Immunofluorescence staining revealed differences in the expression of PI3, AUP1, CCDC80, CD200 and GNAS between deceased and surviving patients. (E) Kaplan–Meier curves of OS according to the expression levels of PI3, AUP1, CCDC80, CD200 and GNAS (n=153).
The established standard chemotherapy regimen currently consists of a combination of carboplatin and paclitaxel. Among the 60 patients included in the study, 50 received this carboplatin–paclitaxel regimen. Among these 50 patients, three experienced disease progression during chemotherapy, while eight patients relapsed within six months after completing treatment. Both scenarios are classified as indicative of a poor response to chemotherapy (2). We found that patients with high AUP1 expression were more likely to experience a poor response to chemotherapy (Figure 6C).
Subsequently, we aimed to explore the association between the five key SRGs and overall survival (OS) in another clinical cohort. This cohort consists of 153 ovarian cancer patients in total who underwent surgical treatment without neoadjuvant therapy at West China Second University Hospital between January 2014 and January 2017, with a maximum follow-up period of 91 months (Supplementary Figure S6B, Supplementary Table S15). FFPE samples from these patients were used to construct tissue microarrays and subjected to immunofluorescence staining (Supplementary Figures S6B, C). The results showed that compared to surviving patients, deceased patients presented higher immunofluorescence staining intensity for risk genes PI3, AUP1 and CCDC80 and lower staining intensity for protective genes CD200 and GNAS, with statistically significant differences (Figure 6D, Supplementary Figure S8B). Furthermore, patients with high AUP1 expression were older and presented with more advanced disease stages, highlighting the close association between AUP1 and clinical risk factors in ovarian cancer patients (Supplementary Figure S8C). Most importantly, we found that patients with high expression of the risk genes PI3, AUP1 and CCDC80 had shorter survival times, whereas those with elevated expression of the protective genes CD200 and GNAS demonstrated better clinical prognosis (Figure 6E).
On the whole, our study identified five key SRGs, including the risk genes AUP1, PI3 and CCDC80, as well as the protective genes CD200 and GNAS and elucidated their prognostic potential in ovarian cancer.
4 Discussion
Ovarian cancer is the third most common gynecologic malignancy worldwide but has the highest mortality rate among these cancers (30). Treatment primarily relies on debulking surgery to achieve no residual disease and platinum-based chemotherapy. While these treatments have led to a reduction in OC-related mortality to some extent, patient outcomes remained unfavorable, highlighting the urgent need to develop new develop new prognostic signatures and molecular biomarkers (7).
SUMOylation, a posttranslational modification, has been implicated in the initiation and progression of various cancers. SUMOylation modulates gene expression through multiple mechanisms, including the alteration of the activity, localization and stability of transcription factors, coactivators and corepressors (12, 31). In this study, we observed the unique characteristic of global SUMOylation in ovarian cancer. Although several studies have demonstrated the therapeutic potential of SUMOylation-targeting drugs, such as TAK981 (20), ginkgolic acid (32) and kerriamycin B (33), in cancers such as pancreatic and liver cancer, our findings suggest that the therapeutic efficacy of SUMOylation inhibition in ovarian cancer is suboptimal. Previous research has demonstrated that SUMOylation is essential for maintaining adult ovarian homeostasis and preserving normal function in conditional knockout mouse models (34). In contrast, PIAS1 inhibition leads to reduced SUMOylation, which, through activation of the TGFβ pathway, promotes EMT, increasing tumor cell survival and metastasis (11). Additionally, low levels of SUMOylation have been shown to increase HIF1-dependent VEGF expression, thereby promoting tumor angiogenesis (35). Tumor angiogenesis facilitates cancer metastasis by supplying oxygen, nutrients and routes for dissemination (36). Stergios J. et al. reported that distant metastatic lesions exhibit lower levels of SUMOylation, whereas primary tumors tend to have higher expression (37). Therefore, considering the unique characteristics of SUMOylation in various cancers, intervening in SUMOylation levels in ovarian cancer patients may not only disrupt the homeostasis of normal cells but also drive cancer cells to adopt a more aggressive and metastatic phenotype. Thus, targeting SUMOylation-regulated downstream targets, SRGs, may represent a more effective strategy.
This study is unique in that it involves 80 combinations of ten distinct algorithms to construct a prognostic model SRGM and identify 22 SRGs closely associated with ovarian cancer survival and regulated by SUMOylation. The SRGM model, composed of these 22 SRGs, demonstrated superior performance across all five independent datasets compared to 50 published prognostic models, further confirming the close association between these 22 SRGs and prognosis. Through single-cell analysis, we further identified five potential prognostic biomarkers associated with the ovarian cancer cell functional pathway and TIME: three risk genes PI3, AUP1 and CCDC80 and two protective genes CD200 and GNAS.
In epithelial cells, low SUMOylation levels drive the upregulation of risk genes PI3 and AUP1 while downregulating protective genes CD200 and GNAS. PI3, also known as Elafin, is a member of the whey acidic protein four-disulfide core (WFDC) family (38). This protein plays a crucial role in modulating inflammatory responses, protecting against tissue damage, and inhibiting elastase-mediated proteolysis. It is significantly involved in both the physiology and pathology of the reproductive system. Emerging evidence suggests that PI3 concentration and subcellular localization may serve as potential biomarkers for assessing cervical cancer progression (39). Notably, in ovarian cancer, Lu et al. demonstrated that elevated PI3 expression correlates with poorer overall survival, which is consistent with our findings (40). CD200, also known as OX-2, is a single-pass type I membrane glycoprotein belonging to the immunoglobulin superfamily (IgSF) (41). Although numerous studies have demonstrated that CD200 is upregulated in various types of cancer and is associated with immunosuppression, there is also evidence indicating that CD200 may exert anti-tumor effects (42, 43). These effects are thought to arise from its ability to suppress tumor-promoting inflammation, inhibit angiogenesis, and limit the expansion of tumor-associated myeloid cells (TAMCs) (44, 45). In a B16 melanoma model, inoculation with CD200-positive B16 melanoma cells inhibited tumor formation and growth in C57BL/6 mice and significantly reduced the formation of metastatic foci in the lungs (46). GNAS (guanine nucleotide-binding protein, alpha-stimulating) is an imprinted gene located on the q arm of chromosome 20 with a complex genomic locus (47). Its major product, Gsα, consists of a Ras-like domain with GTPase activity and an α-helical domain. Gsα plays a vital role in transducing signals from G protein-coupled receptors (GPCRs), thereby activating downstream effectors involved in diverse cellular processes (48). Proper functioning of Gsα is essential for maintaining normal cellular responses to external stimuli, and dysregulation of Gsα signaling has been implicated in various diseases, including endocrine disorders and cancers (49, 50). Notably, loss or reduced expression of GNAS has been associated with increased tumor aggressiveness and poor survival in medulloblastoma (51). In the present study, both univariate Cox regression analysis and integrated machine learning approaches identified CD200 and GNAS as protective biomarkers in ovarian cancer. However, the mechanisms through which CD200 and GNAS influence ovarian cancer prognosis remain unclear and require further investigation through in vitro and in vivo experiments.
Correlation analysis shown that the expression level of PI3, AUP1, CD200 and GNAS is closely associated with the activities of epigenetic regulation processes, such as histone binding and the organization of protein-DNA complexes. Epigenetic modifications in ovarian cancer led to chromatin structural changes that enhance the expression of genes involved in DNA repair, differentiation, angiogenesis and metastasis, thereby promoting tumorigenesis (52). Another study found that high levels of histone-modifying enzymes, such as the H3K9 methyltransferase G9a, are associated with advanced, high-grade, serous ovarian cancer and shorter survival in ovarian cancer patients (53). Shang et al. demonstrated that small molecule epigenetic inhibitors modulate key cellular signaling pathways, including NF-κB, TGFβ and WNT signaling, as well as major metabolic pathways, such as fatty acid metabolism and the TCA cycle, ultimately reducing platinum resistance in ovarian cancer cell lines (54). These findings suggest that reduced SUMOylation levels may regulate the expression of PI3, AUP1, CD200 and GNAS in ovarian cancer cells, thereby influencing cancer cell survival, proliferation, metastasis and chemoresistance by modulating cell functions and metabolism.
Postoperative chemotherapy is crucial for improving the overall survival rate of ovarian cancer patients. The current consensus standard for chemotherapy involves a combination of carboplatin and paclitaxel. Our study revealed that overexpression of the SUMOylation-related gene AUP1 is associated with the resistance of ovarian cancer cells to paclitaxel and carboplatin chemotherapy regimens. AUP1 (ancient ubiquitous protein 1) is an endoplasmic reticulum (ER)-associated protein (55) and more recently, it has been found to be abundantly expressed on the surface of lipid droplets (LDs) (56). Elevated levels of AUP1 enhance the ability of cells to efficiently degrade soluble terminally misfolded proteins, such as RI332-HA and NHK, leading to further accumulation of lipid droplets within the cell (57). Abnormal accumulation of lipid droplets (LDs) in tumor cells can promote the phosphorylation and degradation of E-cadherin or alter the palmitoylation levels of Wnt, thereby activating the Wnt/β-catenin signaling pathway to induce EMT in tumor cells (58). EMT can effectively induce ovarian cancer cell proliferation, invasion and drug resistance (59). Therefore, AUP1 expression levels in cancer cells could serve as biomarkers for predicting ovarian cancer sensitivity to postoperative chemotherapy with paclitaxel and carboplatin. Targeting AUP1 could potentially act as a novel therapeutic strategy improve the patient outcomes.
CCDC80 (Coiled-Coil Domain Containing 80), also known as DRO1 or SSG1, is located at 3q13.2 (60). Previous studies have demonstrated that elevated CCDC80 expression is associated with reduced immune infiltration, poor response to immunotherapy, and worse prognosis in colorectal cancer and muscle-invasive bladder cancer, suggesting a strong association between aberrantly high CCDC80 expression and the formation of an immunosuppressive tumor microenvironment (61, 62). To date, most research on CCDC80 has focused on its expression and functional characteristics in tumor cells. For example, deletion of CCDC80 impairs the growth-inhibitory effect mediated by LATS1/2 (Hippo pathway kinases) deficiency in MC38 cells, and silencing the immune-infiltration-associated gene CCDC80 suppresses malignant progression and tumorigenicity in gastric cancer (63, 64). However, the expression pattern and functional role of CCDC80 in immune cells remain largely unexplored. Our study revealed that the CD8+ cytotoxic T cells with high SRG CCDC80 expression exhibit inhibited the antitumor immune functions. CD8+ cytotoxic T cells play crucial roles in the adaptive immune system, serve as the primary effectors in the antitumor immune response and form the foundation of cancer immunotherapy (29). Currently, progress in immunotherapy for ovarian cancer remains slow. Randomized phase III studies evaluating the addition of ICI monotherapy to standard cytotoxic chemotherapy in both first-line [e.g., JAVELIN 100 (65) and IMagyn050 studies (66)] and relapsed disease settings [e.g., JAVELIN 200 (67) and ATALANTE/ov29 trials (68)] have shown no benefit, failing to meet PFS and OS endpoints. The efficacy of ICI therapy can be improved by reinvigorating tumor-specific CD8+ T cells, as evidenced both in vitro and in murine models (69). Targeted inhibition (such as gene therapy) to specifically reduce CCDC80 expression in CD8+ cytotoxic T cells, thereby reactivating their antitumor immune activity, has the potential to enhance the response of ovarian cancer patients to ICI treatment.
This study has several limitations. First, although we observed that inhibition of SUMOylation alters SRG expression at both the transcriptomic and proteomic levels, the direct mechanistic link between SUMOylation and these genes remains unclear. Second, although we identified SRGs involved in tumor progression and immune evasion, the underlying molecular mechanisms by which these genes modulate specific signaling pathways remain incompletely understood and warrant further mechanistic investigation. Additionally, the expression profiles and functional characteristics of these genes in epithelial and immune cells still need to be validated through further in vivo and in vitro experiments. Third, despite validation using an ID8 murine model and clinical samples from 213 ovarian cancer patients, the overall sample size may still be inadequate to fully capture the biological variability and rare genetic subtypes present in diverse patient populations. Finally, the therapeutic potential of AUP1 inhibition is promising, but further preclinical and clinical trials are necessary to evaluate its safety, efficacy, and potential off-target effects in humans. Addressing these limitations in future studies will be critical to enhancing the robustness and translational applicability of our findings.
Finally, we validated the aberrant expression of these five SRGs in 213 ovarian cancer patient samples from West China Second Hospital. Survival analysis further established their prognostic potential.
5 Conclusion
Through integrated machine learning and single-cell analysis, we identified five prognostic-associated SRGs (PI3, AUP1, CD200, GNAS and CCDC80) regulated by global SUMOylation levels in ovarian cancer. These SRGs are closely associated with ovarian cancer’s function, metabolism and TIME and may serve as potential biomarkers for predicting patient prognosis. Among them, we identified AUP1, whose overexpression may be a risk factor for postoperative chemoresistance. These findings have potential to improve patient outcomes and contribute to the ongoing advancement of precision medicine in oncology.
Data availability statement
The original contributions presented in the study are included in the article/Supplementary Material. Further inquiries can be directed to the corresponding author.
Ethics statement
The studies involving humans were approved by Ethics Committee of West China Second Hospital, Sichuan University. The studies were conducted in accordance with the local legislation and institutional requirements. The human samples used in this study were acquired from a by- product of routine care or industry. Written informed consent for participation was not required from the participants or the participants’ legal guardians/next of kin in accordance with the national legislation and institutional requirements. The animal study was approved by Institutional Animal Care and Use Committee of West China Second University Hospital, Sichuan University. The study was conducted in accordance with the local legislation and institutional requirements.
Author contributions
ZD: Data curation, Visualization, Writing – original draft. YX: Supervision, Validation, Writing – original draft. PZ: Methodology, Software, Visualization, Writing – review & editing. YP: Validation, Writing – review & editing. JT: Methodology, Resources, Writing – review & editing. ZC: Conceptualization, Visualization, Writing – review & editing. YM: Conceptualization, Funding acquisition, Project administration, Writing – original draft.
Funding
The author(s) declare that financial support was received for the research and/or publication of this article. This work was supported by grants from the Science and Technology Department of Sichuan Province (No. 2022YFS0061) and the West China Second University Hospital of Sichuan University (No. KX144).
Conflict of interest
The authors declare that the research was conducted in the absence of any commercial or financial relationships that could be construed as a potential conflict of interest.
Generative AI statement
The author(s) declare that no Generative AI was used in the creation of this manuscript.
Publisher’s note
All claims expressed in this article are solely those of the authors and do not necessarily represent those of their affiliated organizations, or those of the publisher, the editors and the reviewers. Any product that may be evaluated in this article, or claim that may be made by its manufacturer, is not guaranteed or endorsed by the publisher.
Supplementary material
The Supplementary Material for this article can be found online at: https://www.frontiersin.org/articles/10.3389/fimmu.2025.1577781/full#supplementary-material
References
1. Siegel RL, Miller KD, Wagle NS, and Jemal A. Cancer statistics, 2023. CA Cancer J Clin. (2023) 73:17–48. doi: 10.3322/caac.21763
2. Lheureux S, Braunstein M, and Oza AM. Epithelial ovarian cancer: evolution of management in the era of precision medicine. CA Cancer J Clin. (2019) 69:280–304. doi: 10.3322/caac.21559
3. Meng Y, Qiu L, Zeng X, Hu X, Zhang Y, Wan X, et al. Targeting Crl4 suppresses chemoresistant ovarian cancer growth by inducing mitophagy. Signal Transduct Target Ther. (2022) 7:388. doi: 10.1038/s41392-022-01253-y
4. Sun H, Wang H, Wang X, Aoki Y, Wang X, Yang Y, et al. Aurora-a/Sox8/Foxk1 signaling axis promotes chemoresistance via suppression of cell senescence and induction of glucose metabolism in ovarian cancer organoids and cells. Theranostics. (2020) 10:6928–45. doi: 10.7150/thno.43811
5. Oza AM, Cook AD, Pfisterer J, Embleton A, Ledermann JA, Pujade-Lauraine E, et al. Standard chemotherapy with or without bevacizumab for women with newly diagnosed ovarian cancer (Icon7): overall survival results of a phase 3 randomised trial. Lancet Oncol. (2015) 16:928–36. doi: 10.1016/s1470-2045(15)00086-8
6. Yang L, Xie HJ, Li YY, Wang X, Liu XX, and Mai J. Molecular mechanisms of platinum−Based chemotherapy resistance in ovarian cancer (Review). Oncol Rep. (2022) 47:82. doi: 10.3892/or.2022.8293
7. Konstantinopoulos PA and Matulonis UA. Clinical and translational advances in ovarian cancer therapy. Nat Cancer. (2023) 4:1239–57. doi: 10.1038/s43018-023-00617-9
8. Seeler JS and Dejean A. Sumo and the robustness of cancer. Nat Rev Cancer. (2017) 17:184–97. doi: 10.1038/nrc.2016.143
9. Jiao Y, Zhang X, and Yang Z. Sumo-specific proteases: Senps in oxidative stress-related signaling and diseases. Biofactors. (2024) 50:910–21. doi: 10.1002/biof.2055
10. Bossis G, Sarry JE, Kifagi C, Ristic M, Saland E, Vergez F, et al. The Ros/Sumo axis contributes to the response of acute myeloid leukemia cells to chemotherapeutic drugs. Cell Rep. (2014) 7:1815–23. doi: 10.1016/j.celrep.2014.05.016
11. Netherton SJ and Bonni S. Suppression of Tgfβ-induced epithelial-mesenchymal transition like phenotype by a Pias1 regulated sumoylation pathway in Nmumg epithelial cells. PloS One. (2010) 5:e13971. doi: 10.1371/journal.pone.0013971
12. Vertegaal ACO. Signalling mechanisms and cellular functions of Sumo. Nat Rev Mol Cell Biol. (2022) 23:715–31. doi: 10.1038/s41580-022-00500-y
13. Luchini C, Pea A, and Scarpa A. Artificial intelligence in oncology: current applications and future perspectives. Br J Cancer. (2022) 126:4–9. doi: 10.1038/s41416-021-01633-1
14. Ding J, Wang C, Sun Y, Guo J, Liu S, and Cheng Z. Identification of an autophagy-related signature for prognosis and immunotherapy response prediction in ovarian cancer. Biomolecules. (2023) 13:339. doi: 10.3390/biom13020339
15. Swanson K, Wu E, Zhang A, Alizadeh AA, and Zou J. From patterns to patients: advances in clinical machine learning for cancer diagnosis, prognosis, and treatment. Cell. (2023) 186:1772–91. doi: 10.1016/j.cell.2023.01.035
16. Winterhoff B, Talukdar S, Chang Z, Wang J, and Starr TK. Single-cell sequencing in ovarian cancer: A new frontier in precision medicine. Curr Opin Obstet Gynecol. (2019) 31:49–55. doi: 10.1097/gco.0000000000000516
17. Shepherd TG, Thériault BL, Campbell EJ, and Nachtigal MW. Primary culture of ovarian surface epithelial cells and ascites-derived ovarian cancer cells from patients. Nat Protoc. (2006) 1:2643–9. doi: 10.1038/nprot.2006.328
18. Hänzelmann S, Castelo R, and Guinney J. Gsva: gene set variation analysis for microarray and Rna-Seq data. BMC Bioinf. (2013) 14:7. doi: 10.1186/1471-2105-14-7
19. Kumar S, Schoonderwoerd MJA, Kroonen JS, de Graaf IJ, Sluijter M, Ruano D, et al. Targeting pancreatic cancer by Tak-981: A sumoylation inhibitor that activates the immune system and blocks cancer cell cycle progression in a preclinical model. Gut. (2022) 71:2266–83. doi: 10.1136/gutjnl-2021-324834
20. Kim HS, Kim BR, Dao TTP, Kim JM, Kim YJ, Son H, et al. Tak-981, a sumoylation inhibitor, suppresses Aml growth immune-independently. Blood Adv. (2023) 7:3155–68. doi: 10.1182/bloodadvances.2022007956
21. Zheng X, Wang X, Cheng X, Liu Z, Yin Y, Li X, et al. Single-cell analyses implicate ascites in remodeling the ecosystems of primary and metastatic tumors in ovarian cancer. Nat Cancer. (2023) 4:1138–56. doi: 10.1038/s43018-023-00599-8
22. Kroonen JS, de Graaf IJ, Kumar S, Remst DFG, Wouters AK, Heemskerk MHM, et al. Inhibition of sumoylation enhances DNA hypomethylating drug efficacy to reduce outgrowth of hematopoietic Malignancies. Leukemia. (2023) 37:864–76. doi: 10.1038/s41375-023-01838-8
23. Heynen G, Baumgartner F, Heider M, Patra U, Holz M, Braune J, et al. Sumoylation inhibition overcomes proteasome inhibitor resistance in multiple myeloma. Blood Adv. (2023) 7:469–81. doi: 10.1182/bloodadvances.2022007875
24. Chen C, Zheng H, Luo Y, Kong Y, An M, Li Y, et al. Sumoylation promotes extracellular vesicle-mediated transmission of Lncrna Elnat1 and lymph node metastasis in bladder cancer. J Clin Invest. (2021) 131:e14631. doi: 10.1172/jci146431
25. Wang S, Yu H, Gan Y, Wu Z, Li E, Li X, et al. Mining whole-lung information by artificial intelligence for predicting Egfr genotype and targeted therapy response in lung cancer: A multicohort study. Lancet Digit Health. (2022) 4:e309–e19. doi: 10.1016/s2589-7500(22)00024-3
26. Gajewski TF, Schreiber H, and Fu YX. Innate and adaptive immune cells in the tumor microenvironment. Nat Immunol. (2013) 14:1014–22. doi: 10.1038/ni.2703
27. Swanton C, Bernard E, Abbosh C, André F, Auwerx J, Balmain A, et al. Embracing cancer complexity: hallmarks of systemic disease. Cell. (2024) 187:1589–616. doi: 10.1016/j.cell.2024.02.009
28. Chu Y, Dai E, Li Y, Han G, Pei G, Ingram DR, et al. Pan-cancer T cell atlas links a cellular stress response state to immunotherapy resistance. Nat Med. (2023) 29:1550–62. doi: 10.1038/s41591-023-02371-y
29. St Paul M and Ohashi PS. The roles of Cd8(+) T cell subsets in antitumor immunity. Trends Cell Biol. (2020) 30:695–704. doi: 10.1016/j.tcb.2020.06.003
30. Sung H, Ferlay J, Siegel RL, Laversanne M, Soerjomataram I, Jemal A, et al. Global cancer statistics 2020: Globocan estimates of incidence and mortality worldwide for 36 cancers in 185 countries. CA Cancer J Clin. (2021) 71:209–49. doi: 10.3322/caac.21660
31. Makhnevych T, Sydorskyy Y, Xin X, Srikumar T, Vizeacoumar FJ, Jeram SM, et al. Global map of sumo function revealed by protein-protein interaction and genetic networks. Mol Cell. (2009) 33:124–35. doi: 10.1016/j.molcel.2008.12.025
32. Liu D, Li Z, Yang Z, Ma J, and Mai S. Ginkgoic acid impedes gastric cancer cell proliferation, migration and Emt through inhibiting the sumoylation of Igf-1r. Chem Biol Interact. (2021) 337:109394. doi: 10.1016/j.cbi.2021.109394
33. Fukuda I, Ito A, Uramoto M, Saitoh H, Kawasaki H, Osada H, et al. Kerriamycin B inhibits protein sumoylation. J Antibiot (Tokyo). (2009) 62:221–4. doi: 10.1038/ja.2009.10
34. Rossitto M, Déjardin S, Rands CM, Le Gras S, Migale R, Rafiee MR, et al. Trim28-dependent sumoylation protects the adult ovary from activation of the testicular pathway. Nat Commun. (2022) 13:4412. doi: 10.1038/s41467-022-32061-1
35. Huang C, Han Y, Wang Y, Sun X, Yan S, Yeh ET, et al. Senp3 is responsible for Hif-1 transactivation under mild oxidative stress via P300 de-sumoylation. EMBO J. (2009) 28:2748–62. doi: 10.1038/emboj.2009.210
36. He L, Zhu W, Chen Q, Yuan Y, Wang Y, Wang J, et al. Ovarian cancer cell-secreted exosomal Mir-205 promotes metastasis by inducing angiogenesis. Theranostics. (2019) 9:8206–20. doi: 10.7150/thno.37455
37. Moschos SJ, Jukic DM, Athanassiou C, Bhargava R, Dacic S, Wang X, et al. Expression analysis of Ubc9, the single small ubiquitin-like modifier (Sumo) E2 conjugating enzyme, in normal and Malignant tissues. Hum Pathol. (2010) 41:1286–98. doi: 10.1016/j.humpath.2010.02.007
38. Correnti CE, Gewe MM, Mehlin C, Bandaranayake AD, Johnsen WA, Rupert PB, et al. Screening, large-scale production and structure-based classification of cystine-dense peptides. Nat Struct Mol Biol. (2018) 25:270–8. doi: 10.1038/s41594-018-0033-9
39. Longatto-Filho A, Fregnani JH, Mafra da Costa A, de Araujo-Souza PS, Scapulatempo-Neto C, Herbster S, et al. Evaluation of elafin immunohistochemical expression as marker of cervical cancer severity. Acta Cytol. (2021) 65:165–74. doi: 10.1159/000512010
40. Lu W, Xie B, Tan G, Dai W, Ren J, Pervaz S, et al. Elafin is related to immune infiltration and could predict the poor prognosis in ovarian cancer. Front Endocrinol (Lausanne). (2023) 14:1088944. doi: 10.3389/fendo.2023.1088944
41. Choe D and Choi D. Cancel cancer: the immunotherapeutic potential of Cd200/Cd200r blockade. Front Oncol. (2023) 13:1088038. doi: 10.3389/fonc.2023.1088038
42. Liu JQ, Hu A, Zhu J, Yu J, Talebian F, and Bai XF. Cd200-Cd200r pathway in the regulation of tumor immune microenvironment and immunotherapy. Adv Exp Med Biol. (2020) 1223:155–65. doi: 10.1007/978-3-030-35582-1_8
43. Rastogi N, Baker S, Man S, Uger RA, Wong M, Coles SJ, et al. Use of an anti-Cd200-blocking antibody improves immune responses to Aml in vitro and in vivo. Br J Haematol. (2021) 193:155–9. doi: 10.1111/bjh.17125
44. Erin N, Podnos A, Tanriover G, Duymuş Ö, Cote E, Khatri I, et al. Bidirectional effect of Cd200 on breast cancer development and metastasis, with ultimate outcome determined by tumor aggressiveness and a cancer-induced inflammatory response. Oncogene. (2015) 34:3860–70. doi: 10.1038/onc.2014.317
45. Jablonska J, Leschner S, Westphal K, Lienenklaus S, and Weiss S. Neutrophils responsive to endogenous Ifn-beta regulate tumor angiogenesis and growth in a mouse tumor model. J Clin Invest. (2010) 120:1151–64. doi: 10.1172/jci37223
46. Talebian F, Liu JQ, Liu Z, Khattabi M, He Y, Ganju R, et al. Melanoma cell expression of Cd200 inhibits tumor formation and lung metastasis via inhibition of myeloid cell functions. PloS One. (2012) 7:e31442. doi: 10.1371/journal.pone.0031442
47. Levine MA, Downs RW Jr., Moses AM, Breslau NA, Marx SJ, Lasker RD, et al. Resistance to multiple hormones in patients with pseudohypoparathyroidism. Association with deficient activity of guanine nucleotide regulatory protein. Am J Med. (1983) 74:545–56. doi: 10.1016/0002-9343(83)91008-2
48. Ahn D, Provasi D, Duc NM, Xu J, Salas-Estrada L, Spasic A, et al. Gαs slow conformational transition upon Gtp binding and a novel Gαs regulator. iScience. (2023) 26:106603. doi: 10.1016/j.isci.2023.106603
49. Weinstein LS, Shenker A, Gejman PV, Merino MJ, Friedman E, and Spiegel AM. Activating mutations of the stimulatory G protein in the Mccune-Albright syndrome. N Engl J Med. (1991) 325:1688–95. doi: 10.1056/nejm199112123252403
50. Landis CA, Masters SB, Spada A, Pace AM, Bourne HR, and Vallar L. Gtpase inhibiting mutations activate the alpha chain of Gs and stimulate adenylyl cyclase in human pituitary tumours. Nature. (1989) 340:692–6. doi: 10.1038/340692a0
51. da Silva LS, Mançano BM, de Paula FE, Dos Reis MB, de Almeida GC, Matsushita M, et al. Expression of Gnas, Tp53, and Pten improves the patient prognostication in sonic hedgehog (Shh) medulloblastoma subgroup. J Mol Diagn. (2020) 22:957–66. doi: 10.1016/j.jmoldx.2020.04.207
52. Nervi C, De Marinis E, and Codacci-Pisanelli G. Epigenetic treatment of solid tumours: A review of clinical trials. Clin Epigenet. (2015) 7:127. doi: 10.1186/s13148-015-0157-2
53. Hua KT, Wang MY, Chen MW, Wei LH, Chen CK, Ko CH, et al. The H3k9 methyltransferase G9a is a marker of aggressive ovarian cancer that promotes peritoneal metastasis. Mol Cancer. (2014) 13:189. doi: 10.1186/1476-4598-13-189
54. Shang S, Yang J, Jazaeri AA, Duval AJ, Tufan T, Lopes Fischer N, et al. Chemotherapy-induced distal enhancers drive transcriptional programs to maintain the chemoresistant state in ovarian cancer. Cancer Res. (2019) 79:4599–611. doi: 10.1158/0008-5472.Can-19-0215
55. Hodges BD and Wu CC. Proteomic insights into an expanded cellular role for cytoplasmic lipid droplets. J Lipid Res. (2010) 51:262–73. doi: 10.1194/jlr.R003582
56. Spandl J, Lohmann D, Kuerschner L, Moessinger C, and Thiele C. Ancient ubiquitous protein 1 (Aup1) localizes to lipid droplets and binds the E2 ubiquitin conjugase G2 (Ube2g2) via its G2 binding region. J Biol Chem. (2011) 286:5599–606. doi: 10.1074/jbc.M110.190785
57. Yoo YS, Han HG, and Jeon YJ. Unfolded protein response of the endoplasmic reticulum in tumor progression and immunogenicity. Oxid Med Cell Longev. (2017) 2017:2969271. doi: 10.1155/2017/2969271
58. Li M, Bu X, Cai B, Liang P, Li K, Qu X, et al. Biological role of metabolic reprogramming of cancer cells during epithelial−Mesenchymal transition (Review). Oncol Rep. (2019) 41:727–41. doi: 10.3892/or.2018.6882
59. Guo Z, Ashrafizadeh M, Zhang W, Zou R, Sethi G, and Zhang X. Molecular profile of metastasis, cell plasticity and Emt in pancreatic cancer: A pre-clinical connection to aggressiveness and drug resistance. Cancer Metastasis Rev. (2024) 43:29–53. doi: 10.1007/s10555-023-10125-y
60. Gong D, Zhang Q, Chen LY, Yu XH, Wang G, Zou J, et al. Coiled-coil domain-containing 80 accelerates atherosclerosis development through decreasing lipoprotein lipase expression via Erk1/2 phosphorylation and Tet2 expression. Eur J Pharmacol. (2019) 843:177–89. doi: 10.1016/j.ejphar.2018.11.009
61. Wang WD, Wu GY, Bai KH, Shu LL, Chi PD, He SY, et al. A prognostic stemness biomarker Ccdc80 reveals acquired drug resistance and immune infiltration in colorectal cancer. Clin Transl Med. (2020) 10:e225. doi: 10.1002/ctm2.225
62. Jiang W, Zhu D, Wang C, and Zhu Y. An immune relevant signature for predicting prognoses and immunotherapeutic responses in patients with muscle-invasive bladder cancer (Mibc). Cancer Med. (2020) 9:2774–90. doi: 10.1002/cam4.2942
63. Pan WW, Moroishi T, Koo JH, and Guan KL. Cell type-dependent function of Lats1/2 in cancer cell growth. Oncogene. (2019) 38:2595–610. doi: 10.1038/s41388-018-0610-8
64. Yu M, Peng J, Lu Y, Li S, and Ding K. Silencing immune-infiltrating biomarker Ccdc80 inhibits Malignant characterization and tumor formation in gastric cancer. BMC Cancer. (2024) 24:724. doi: 10.1186/s12885-024-12451-y
65. Monk BJ, Colombo N, Oza AM, Fujiwara K, Birrer MJ, Randall L, et al. Chemotherapy with or without avelumab followed by avelumab maintenance versus chemotherapy alone in patients with previously untreated epithelial ovarian cancer (Javelin ovarian 100): an open-label, randomised, phase 3 trial. Lancet Oncol. (2021) 22:1275–89. doi: 10.1016/s1470-2045(21)00342-9
66. Moore KN, Bookman M, Sehouli J, Miller A, Anderson C, Scambia G, et al. Atezolizumab, bevacizumab, and chemotherapy for newly diagnosed stage Iii or Iv ovarian cancer: placebo-controlled randomized phase Iii trial (Imagyn050/Gog 3015/Engot-Ov39). J Clin Oncol. (2021) 39:1842–55. doi: 10.1200/jco.21.00306
67. Pujade-Lauraine E, Fujiwara K, Ledermann JA, Oza AM, Kristeleit R, Ray-Coquard IL, et al. Avelumab alone or in combination with chemotherapy versus chemotherapy alone in platinum-resistant or platinum-refractory ovarian cancer (Javelin ovarian 200): an open-label, three-arm, randomised, phase 3 study. Lancet Oncol. (2021) 22:1034–46. doi: 10.1016/s1470-2045(21)00216-3
68. Kurtz JE, Pujade-Lauraine E, Oaknin A, Belin L, Leitner K, Cibula D, et al. Atezolizumab combined with bevacizumab and platinum-based therapy for platinum-sensitive ovarian cancer: placebo-controlled randomized phase Iii Atalante/Engot-Ov29 trial. J Clin Oncol. (2023) 41:4768–78. doi: 10.1200/jco.23.00529
Keywords: sumoylation, machine learning, single-cell RNA-seq, clinical cohort, chemoresistance
Citation: Deng Z, Xu Y, Zhang P, Peng Y, Tan J, Chen Z and Ma Y (2025) Integrated machine learning and single-cell analysis reveal the prognostic and therapeutic potential of SUMOylation-related genes in ovarian cancer. Front. Immunol. 16:1577781. doi: 10.3389/fimmu.2025.1577781
Received: 16 February 2025; Accepted: 29 April 2025;
Published: 04 June 2025.
Edited by:
Nicole James, Women & Infants Hospital of Rhode Island, United StatesReviewed by:
Swakkhar Shatabda, BRAC University, BangladeshBaira Godneeva, Institute of Gene Biology (RAS), Russia
Copyright © 2025 Deng, Xu, Zhang, Peng, Tan, Chen and Ma. This is an open-access article distributed under the terms of the Creative Commons Attribution License (CC BY). The use, distribution or reproduction in other forums is permitted, provided the original author(s) and the copyright owner(s) are credited and that the original publication in this journal is cited, in accordance with accepted academic practice. No use, distribution or reproduction is permitted which does not comply with these terms.
*Correspondence: Yimei Ma, bWF5aW1laTkwQHNjdS5lZHUuY24=
†These authors have contributed equally to this work and share first authorship