 Shuang Li
 Ping Zhou1
 Yan Huang
 Min Chen
 Chan Yang
 Lili Jiang
- 1Department of Pathology, West China Hospital, Sichuan University, Chengdu, China
- 2Department of Pathology, The First People's Hospital of Yunnan Province, Yunnan, Kunming, China
- 3Department of Medical Oncology, Cancer Center, West China Hospital, Sichuan University, Chengdu, Sichuan, China
- 4College of Physical Education and Health Science, Yi bin University, Yi bin, Sichuan, China
Background: The tertiary lymphoid structures (TLSs) are the anti-tumor immune hubs in the tumor microenvironment. The germinal center (GC) (a marker of maturation) and spatial distribution of TLS may determine the responsiveness of immunotherapy. However, the regulatory mechanism of neoadjuvant chemotherapy (NACT) and combined immunotherapy (NACT-IO) on the dynamic remodeling of TLS has not been elucidated.
Methods: The NACT-IO group (72 patients), NACT group (50 patients), UT group (50 patients, un-neoadjuvant therapy) were included. Multiple immunofluorescence (mIF) was used to analyze the difference of microenvironment in paired samples (the same case) pre and post neoadjuvant therapy. To further analyze the effect of treatment on the maturity and spatial distribution pattern of TLS (within/outside tumor bed) in postoperative samples, and to establish a quantitative method of TLS based on hot spot area to evaluate its prognostic value.
Results: Spatial heterogeneity analysis that the density of total TLSs (t-TLSs) and GC-positive TLSs (GC-TLSs) in the tumor bed of NACT (p<0.01, p<0.01) group and NACT-IO (p<0.001, p<0.001) group were significantly higher than that outside the tumor bed. Compared with the UT group, NACT and NACT-IO significantly increased the density of t-TLSs (p<0.01, p<0.001) and GC-TLSs (p<0.01, p<0.01) in the tumor bed. In addition, there was an inverted U-shaped correlation between GC-TLS and treatment cycle: the density of GC-TLSs reaches the peak value after receiving two or less (≤ 2) cycles of NACT and NACT-IO, and decreased significantly after receiving more than two (> 2) cycles of NACT and NACT-IO (p<0.05). Multivariate Cox regression model confirmed that low GC-TLS burden (≤2/20×HPF) within tumor bed hotspots (HR = 3.99, 95%CI=1.10-14.5, p = 0.036) was superior to the traditional prognostic factor of pathological remission in ≤ 2-cycles of NACT-IO subgroup (HR = 3.44, 95%CI=1.03-11.47, p = 0.044), and became the strongest independent factor for predicting disease free survival (DFS).
Conclusions: This study reveals for the first time that NACT and NACT-IO enhance anti-tumor efficacy through multidimensional (abundance, spatial distribution and maturity) dynamic remodeling of TLS, and proposes the short course of ≤ 2 cycles of NACT-IO can maximize the prognostic value of GC-TLS, providing key evidence for optimizing the treatment ‘ time window ‘.
Introduction
Lung cancer remains the leading cause of cancer-related deaths worldwide, with non-small cell lung cancer (NSCLC) accounting for 85% (1). Squamous cell carcinoma (SCC) is the second most common type of NSCLC (2). Chemotherapy is the standard treatment in the perioperative period, but the efficacy is limited (3). The preoperative neoadjuvant therapy scheme can reduce the size of the primary tumor to further facilitate surgical operation and improve postoperative prognosis (4). In recent years, immunotherapy has emerged as a promising new approach. Additionally, the neoadjuvant chemotherapy combined with immunotherapy could significantly improve the pathological remission rate and prolong the event-free survival (EFS) (5). Nevertheless, some patients still face a high risk of recurrence, suggesting that there is still an unmet need for us to explore the identification and predictive markers of relapse-prone populations.
The efficacy of immunotherapy can be attributed to the highlighted impact of the tumor immune microenvironment (TIME) (6), which refers to the cellular environment around tumor cells (7). Immune cells play a central role in this environment, including but not limited to: T lymphocytes, B lymphocytes, natural killer cells, bone marrow-derived suppressor cells, dendritic cells, macrophages (8). The tertiary lymphoid structure (TLS) is an ectopic lymphoid tissue dominated by B-cell follicles and T-cell regions in chronic inflammation or tumor microenvironment (9). In recent years, a large number of studies have shown that TLS has a positive anti-tumor effect in different cancers, especially when it is in the mature stage (10). According to its histological characteristics and functional activity, TLS can be divided into immature stage with only lymphocyte aggregation, lack of germinal center (GC) and clear partition, and mature stage with GC, follicular dendritic cell (FDC) network, high endothelial venule (HEV) and clear B/T cell partition (10, 11). The tight interaction between B cells and T cells in TLSs is related to the improvement of cancer survival rate and hot tumor environment (12). Within TLS, B cells undergo GC reactions to produce high-affinity tumor-specific antibodies. These antibodies form immune complexes by engaging Fcγ receptor (FcγR)-expressing dendritic cells (DCs) and macrophages in the extrafollicular zones, thereby triggering the antigen cross-presentation cascade. Through MHC class I molecules, tumor-derived antigens are presented to CD8+T lymphocytes, driving their differentiation into cytotoxic effector cells capable of direct tumor cell elimination. Concurrently, CD4+T cells secrete key cytokines (such as IL - 21, IFN-γ) with the help of B cell-dependent antigen presentation, which synergistically enhance the anti-tumor immune response (9, 13). In addition to the characteristics of abundance and maturity of TLS, the effect of its location distribution on the prognosis of colorectal cancer, hepatocellular carcinoma, breast cancer and esophageal squamous cell carcinoma has also been explored (14–19).
TLS creates a microenvironment that is sensitive to immunotherapy (9) and can predict favorable responses to immune checkpoint blockade in a variety of malignant tumors (19, 20). Intriguingly, Helmink et al. demonstrated that immune checkpoint inhibitors (ICIs) coordinate the formation and maturation of TLS by reprogramming chemokine networks (CXCL9/10/13) and lymphatic induction signals (LT-α/β) (21). Chemotherapy is also a conventional anti-tumor treatment, and its effect on TLS function is still poorly understood. The results of SILIA K et al. lung squamous cell carcinoma showed that corticosteroids (the main pillar of chemotherapy regimens) disrupted TLS maturation by inhibiting lymphatic-induced LT-α/β signaling, thereby eliminating GC formation and weakening CD8+T cell infiltration (11). However, it is worth noting that lu zhang et al. used a bladder cohort to reveal the synergistic effect of ICIs and chemotherapeutic drugs on enhancing TLS maturity (22). This study used a 172 SCC cohort to analyze the interaction between TLS maturity, spatial topology, and treatment regimen. By combining multiple spatial phenotypes with longitudinal survival analysis, our objectives are: (1) to explore the differential regulation of chemotherapy and ICIs on the spatial distribution and maturity of TLS, (2) to explore the characteristics of TLS as a predictive value of disease progression after SCC receiving NACT and NACT-IO, and (3) to optimize the treatment of TLS-driven immunity.
Materials and methods
Patient collection and tissues specimens
The locally advanced SCC samples that underwent surgical resection after neoadjuvant therapy in West China Hospital of Sichuan University from January 2018 and December 2022 were collected. We included patients who received NACT (50 cases) and NACT-IO (72 cases) and matched 50 cases of surgical resection SCC samples that did not receive any neoadjuvant therapy (UT group). Preoperative paired biopsy samples of SCC patients are difficult to systematically evaluate the integrity of TLS due to tissue fragmentation. Therefore, we attempted to preliminarily quantify the dynamic changes of lymphocyte subsets in TIME before and after treatment by multiple immunofluorescence staining. Among the 172 patients in the NACT-IO group and the NACT group, we screened 64 cases with paired biopsy specimens before and after treatment. In order to ensure the objectivity of the evaluation, 64 paired samples of TIME were evaluated by two independent senior pathologists, considering the samples with rich immune cells, clear tumor tissue, sufficient interstitial tissue and complete clinical data. Finally, 10 cases (4 cases with NACT-IO, 6 cases with NACT) that met the strict quality control were included for subsequent analysis. Clinical data were obtained from the medical records, including gender, age, smoking history, tumor site and follow-up data. The follow-up period ended in April 2, 2024.
Multiple immunofluorescence and immunohistochemistry
Paraffin sections were baked at 62 °C for 60 minutes, followed by xylene gradient dewaxing and ethanol gradient hydration. Antigen repair was performed by high-pressure method, the first round was repaired with a pH 9.0 repair solution, and the subsequent high-pressure treatment was repeated with a pH 6.0 repair solution before each round of staining to eliminate antibody cross-reaction. Each round of staining process included TBST washing and blocking with bovine and sheep mixed serum, followed by primary antibody incubation (antibodies and dilution ratios were as follows: CD4, CD8, CD19, PD1, and then incubated with secondary antibodies (goat anti-mouse/rabbit mixed secondary antibody, 37 °C 10 minutes). Finally, Opal fluorescent dye was used for color development (Opal 520/570/620/690/780, room temperature 5 – 10 minutes). DAIP was used for re-staining nucleus, and finally the tablets were sealed with anti-quenching sealing agent. The stained sections were scanned using the TissueFAXS SL panoramic tissue cell imaging system. Analysis was performed using StrataQuest analysis software (version 7.1.129). Firstly, tumor cells, stromal cells and lymphocyte subsets were distinguished based on DAPI nuclear staining and morphological features (area, roundness). Then the fluorescence intensity threshold of each marker (CD4/CD8/CD19/PD1) was set. Finally, the proportion of positive cells was calculated.
The formalin-fixed paraffin-embedded (FFPE) tissues of 172 patients with SCC were serially sectioned (4μm thickness) and baked at 65°C for 1 hour. The sections were subjected to xylene gradient dewaxing and ethanol gradient hydration, rinsed with double distilled water, and incubated with 3% H2O2 at room temperature for 25 minutes to block endogenous peroxidase activity. Antigen repair was performed using pH 6.0 citrate buffer, boiled under high pressure for 3 minutes. CD8, CD19, CD21, CD23 and D2 – 40 were incubated at 37°C for 1 hour. Subsequently, HRP-labeled goat anti-mouse/rabbit universal secondary antibody (ready-to-use, ZSGB-Bio, Cat#PV-9000) was incubated at 45°C for 30 minutes. Finally, DAB staining was performed for 5 minutes and re-stained with hematoxylin. The digital pathological images were collected by KFBIO automatic scanning system, and quantitative analysis was performed by K-Viewer software (v2.3.1). All IHC was performed on a Leica Bond-Max or Roche Ventana system. Details of all antibodies and batch verification procedures are available in Supplementary Table S1.
Assessment of pathological response
Two pathologists with advanced qualifications assessed the pathological remission of samples from NACT-IO group and NACT group. Throughout this process, they were not informed of the specific details and objectives of this study. CPR is defined as complete pathological response, indicating the absence of residual surviving tumor cells (RVT). MPR and PPR are defined as major pathological response (0%<RVT<10%) and partial pathological response (RVT ≥10%) respectively. In this study, we combined cases with residual tumor ≤ 10%, including CPR and MPR, with PPR to form a binary stratification.
Assessment of the TLS
The spatial niche of TLSs is divided into (1) TLSs within the tumor bed (the area where the original tumor tissue exists), including TLSs in the tumor (residual tumor tissue) and TLSs in the stroma; (2) TLSs outside the tumor bed (2mm area outside the edge of the tumor bed) (Figure 2A). TLSs are divided into three mature stages: early TLS(E-TLS), primary follicle-like TLS (PFL-TLS) and secondary follicle-like TLS (SFL-TLS) (16). E-TLS is a loosely clustered lymphocyte population, lacking a clear follicular structure and GC. CD19+B cells are scattered and non-aggregated, CD8+T cells do not form T cell regions, and there is no follicular dendritic cell (FDC) network and high endothelial venule (HEV). PFL-TLS has a preliminary B cell follicular structure, but there is no GC, and the T cell region begins to differentiate. CD19+B cells gathered into clusters, CD8+T cells formed a peripheral T cell band, and CD21+FDC formed a preliminary network structure. SFL-TLS is a fully mature stage, and CD23 is a marker of functional active GC. Total TLS (t-TLS) includes E-TLS, PFL-TLS and SFL-TLS. Among them, SFL-TLS was counted as GC-TLS (Figure 2B).
Assessment of the CD8+T cells within in GC-TLSs/outside TLSs
The formation and maturation of TLS (GC differentiation) are dynamically regulated by the treatment cycle. As the core effector cells of anti-tumor immunity, the spatial distribution heterogeneity of CD8+ T cells inside and outside TLS may further reflect the reprogramming of immune response pattern by treatment. The spatial distribution of CD8+T cells was divided into regions located within in GC-TLSs and outside TLSs. We used KF-view software to count the density of CD8+T cells in any 10 target areas with an area of more than 1 mm2, and calculated the average value (Figures 2C-F).
Inter-observer agreement analysis
Two blinded thoracic pathologists independently selected randomly 100 samples assessed the t-TLS/GC-TLS burden within tumor bed hotspots (binary: ≤3/>3/20×HPF, ≤2/>2/20×HPF). Detailed data are provided in Supplementary Table S2.
Statistical analysis
All statistical analysis and visualization were performed in the R language environment (RStudio 4.2.3). There was a significant difference when p < 0.05.
Data distribution and paired sample analysis
Analysis of clinicopathological features: The categorical variables such as clinicopathological features of 172 patients were analyzed by chi-square test or Fisher ‘s exact test.
Paired sample analysis: For the dynamic changes of lymphocyte subsets in TIME of 10 paired samples from the same patient before and after treatment, the Wilcoxon Signed-Rank Test was used to evaluate the difference before and after treatment.
Comparison of continuous variables between groups
Cross-group comparison (NACT group vs. NACT-IO group vs. UT group): For continuous variables such as TLS density (t-TLS, GC-TLS) and CD8+T cell count, Kruskal-Wallis H test (Kruskal-Wallis Test) was used.
Subgroup analysis: treatment cycle stratification (≤ 2 cycles vs. > 2 cycles) and pathological remission stratification (CPR/MPR cases vs. PPR cases), using Mann-Whitney U test (Wilcoxon Rank-Sum Test).
Survival analysis and prognostic model
Survival grouping: Patients were divided into high/low (t-/GC-) TLS density group with median cut-off value. Kaplan-Meier method (Log-rank test) was used to evaluate the difference of disease-free survival (DFS), and the survival curve was visualized by ggsurvplot package (v 0.4.9). DFS was defined as the time from surgical resection to disease recurrence, death (for any reason), or loss to follow-up.
Prognostic factor screening: The purpose of this study was to screen TLS-related prognostic factors with high clinical applicability and repeatability of evaluation principles, and to implement a grouping strategy based on the number of t-TLS in hot spots (≤ 3/20×HPF vs. >3/20×HPF) and the number of GC-TLS in hot spots (≤ 2/20×HPF vs. >2/20×HPF), rather than using the median of TLS as a threshold. Univariate Cox Regression model was used to screen potential prognostic factors, and Multivariate Cox Regression model was constructed to correct confounding factors such as age, gender, and smoking history. The association between the number of t-/GC-TLS in hot spots and pathological remission grading and DFS was evaluated, and independent prognostic factors were screened.
The inter-observer agreement was quantified using Cohen’s kappa (κ), with 95% confidence intervals estimated via bias-corrected and accelerated (BCa) bootstrap resampling (1000 iterations).
Results
Patient characteristics
The clinicopathological characteristics are summarized in Table 1, with a mean age of 57.4 ± 7.3 years. There were no significant differences in age, sex, smoking history, treatment cycles, or N stage between NACT-IO group and NACT group. 52 cases (52/72, 72.2%) obtained CPR/MPR and 20 cases (20/72, 27.8%) obtained PPR in NACT-IO group. Conversely, in the NACT group, only 11 cases (11/50, 22%) obtained CPR/MPR and 39 cases (39/50, 78.0%) obtained MPR. Detailed data are provided in Supplementary Table S3.
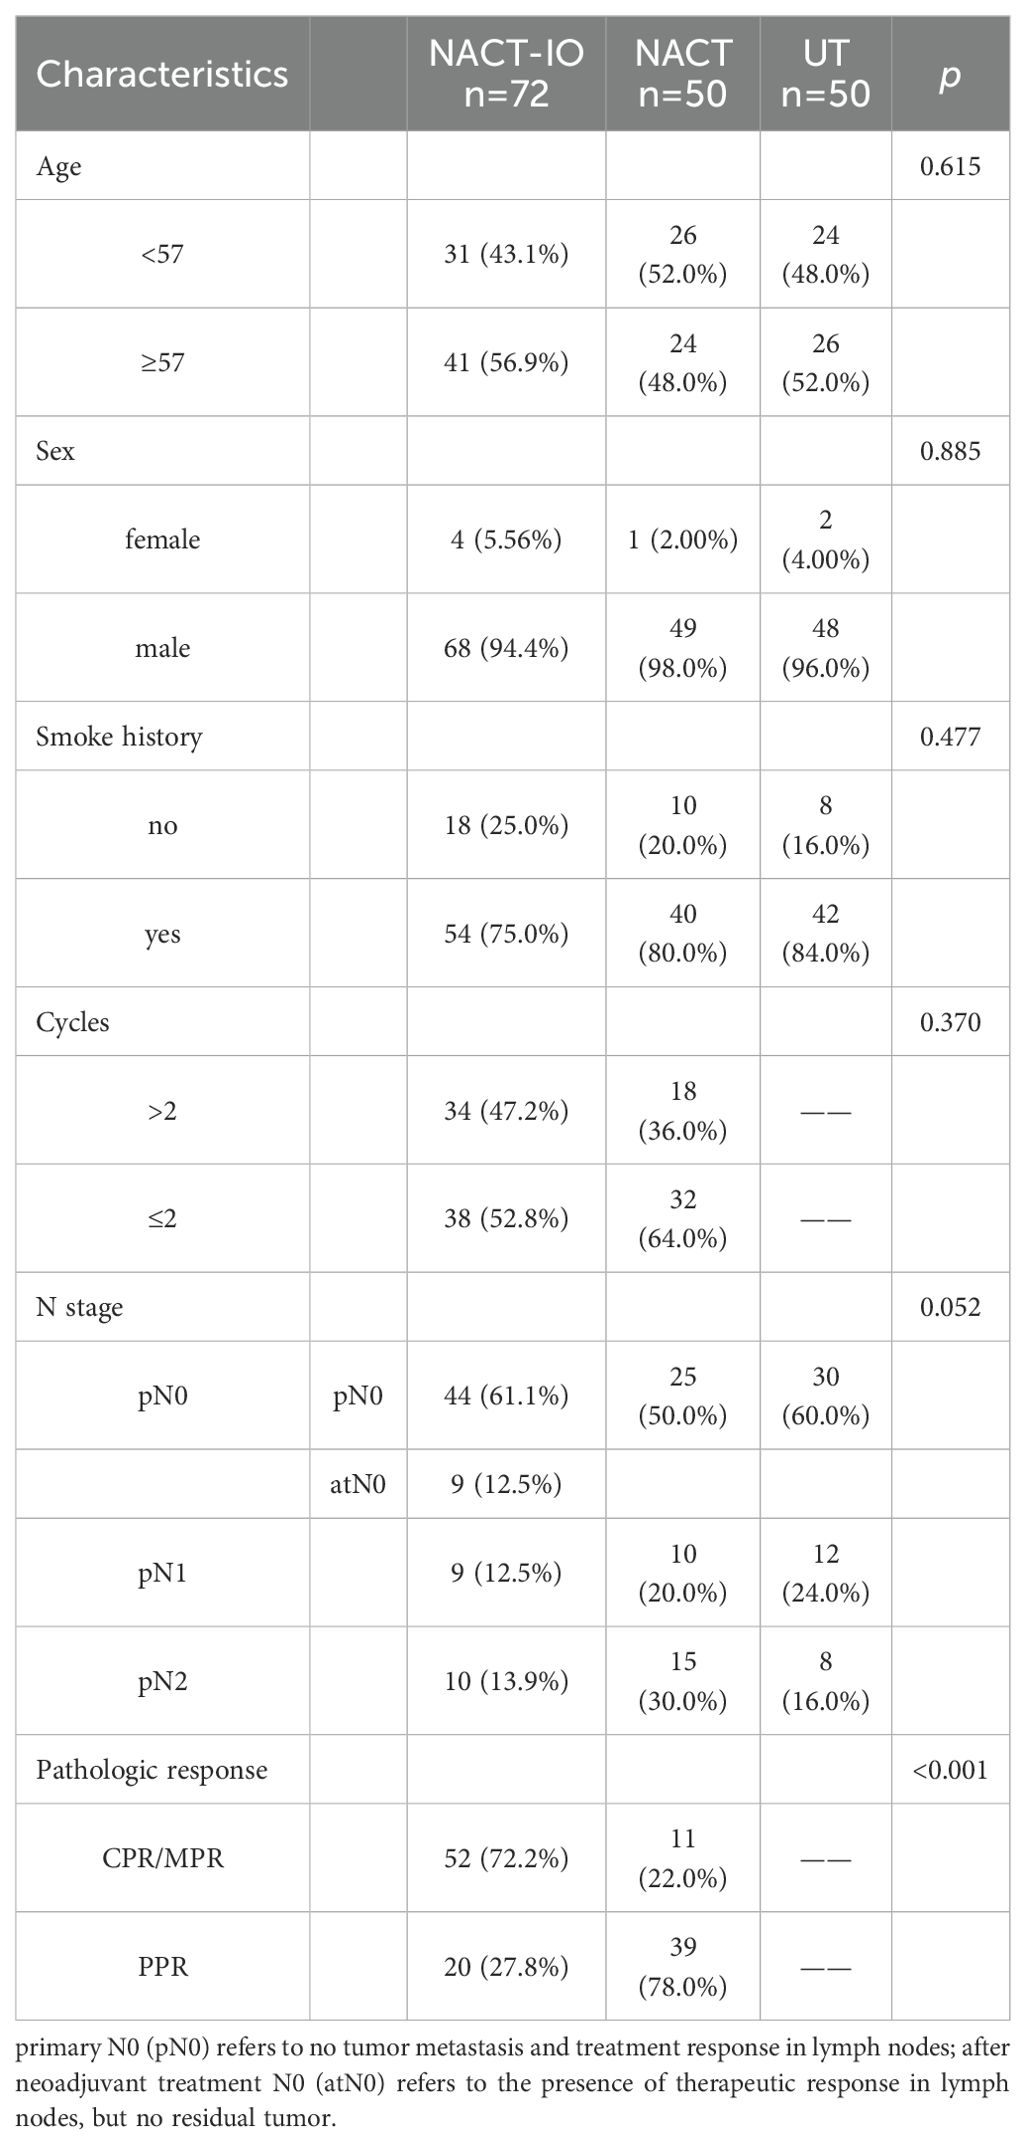
Table 1. The clinicopathological characteristics of 172 patients in all groups.
B cells recruitment may be the common mechanism of chemotherapy and immunotherapy
It is worth noting that despite the heterogeneity of treatment strategies (NACT vs. NACT-IO), the density of CD19+ B cell in post- NACT-IO/NACT were significantly higher (729.39 ± 217.66 cells/mm², p<0.01) than that pre- NACT-IO/NACT (n=10) (Figure 1E). However, there was no such change in CD4+T cell (913.04 ± 243.03 cells/mm², p = 0.14), CD8+T cell (541.59 ± 483.79 cells/mm², p = 0.62) and PD1+ lymphocyte (394.75 ± 129.98 cells/mm², p = 0.07) (Figures 1C, D, F).
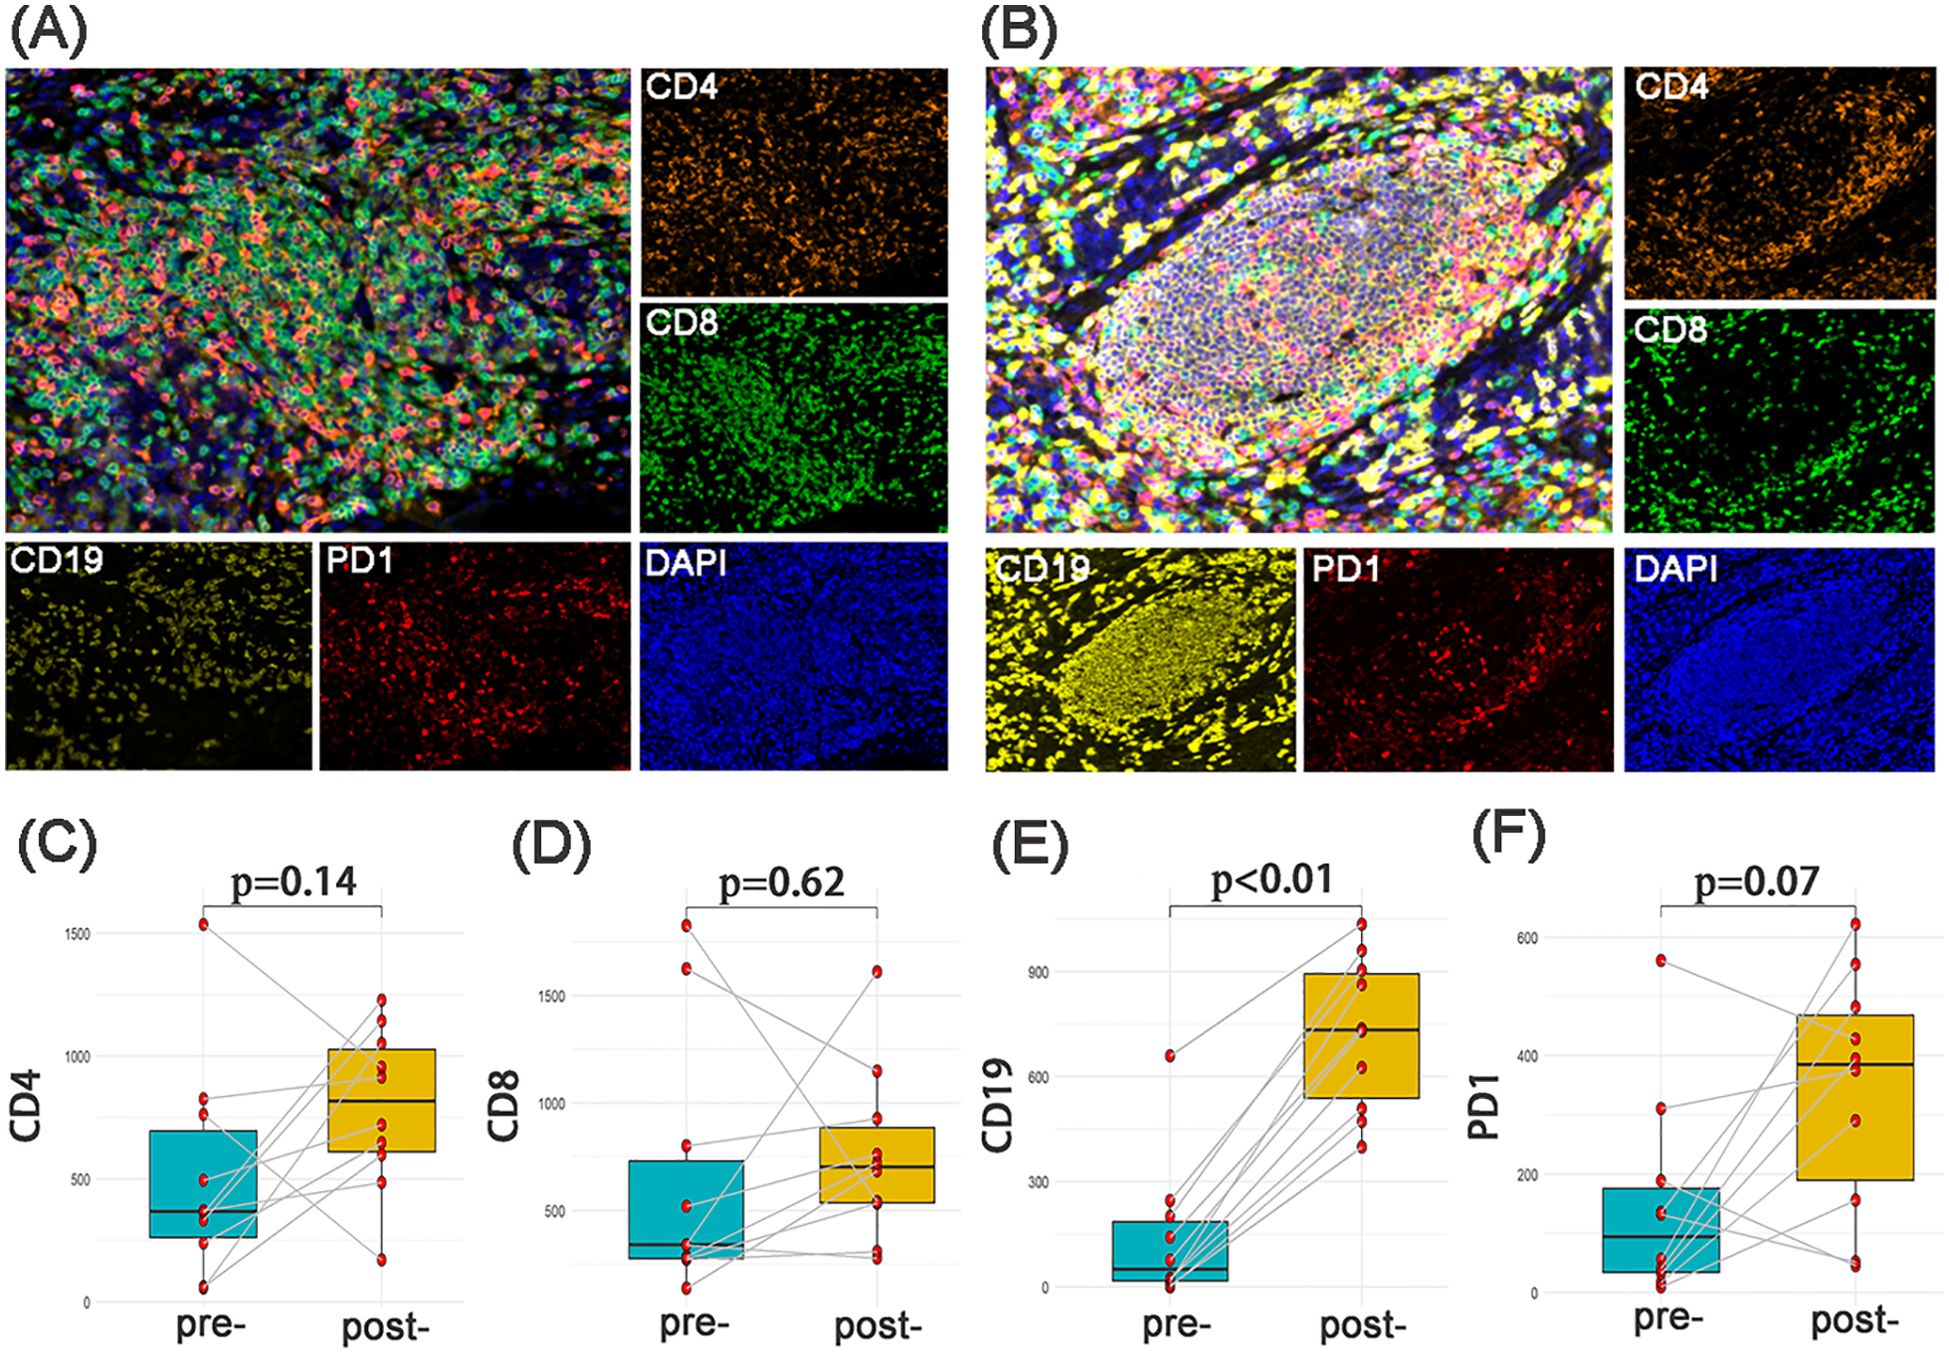
Figure 1. The changes of immune microenvironment between SCC samples pre and post neoadjuvant therapy (n=10). The multi-channel mIF(upper left) and single-channel mIF of lymphocyte subsets in 10 paired SCC samples pre (A) and post (B) neoadjuvant therapy (4 cases of NACT-IO, 6 cases of NACT) were showed. Compared with SCC samples pre-treatment (n=10), CD19+B cells were significantly increased in SCC samples post-treatment (n=10) (E). There was no significant difference of CD4+T cells (C), CD8+T cells (D) and PD - 1+lymphocytes (F) pre- and post- neoadjuvant therapy. The p-value was obtained by Wilcoxon signed rank sum test. p< 0.05 was considered statistically significant. (A) magnification×200, (B) magnification×200.
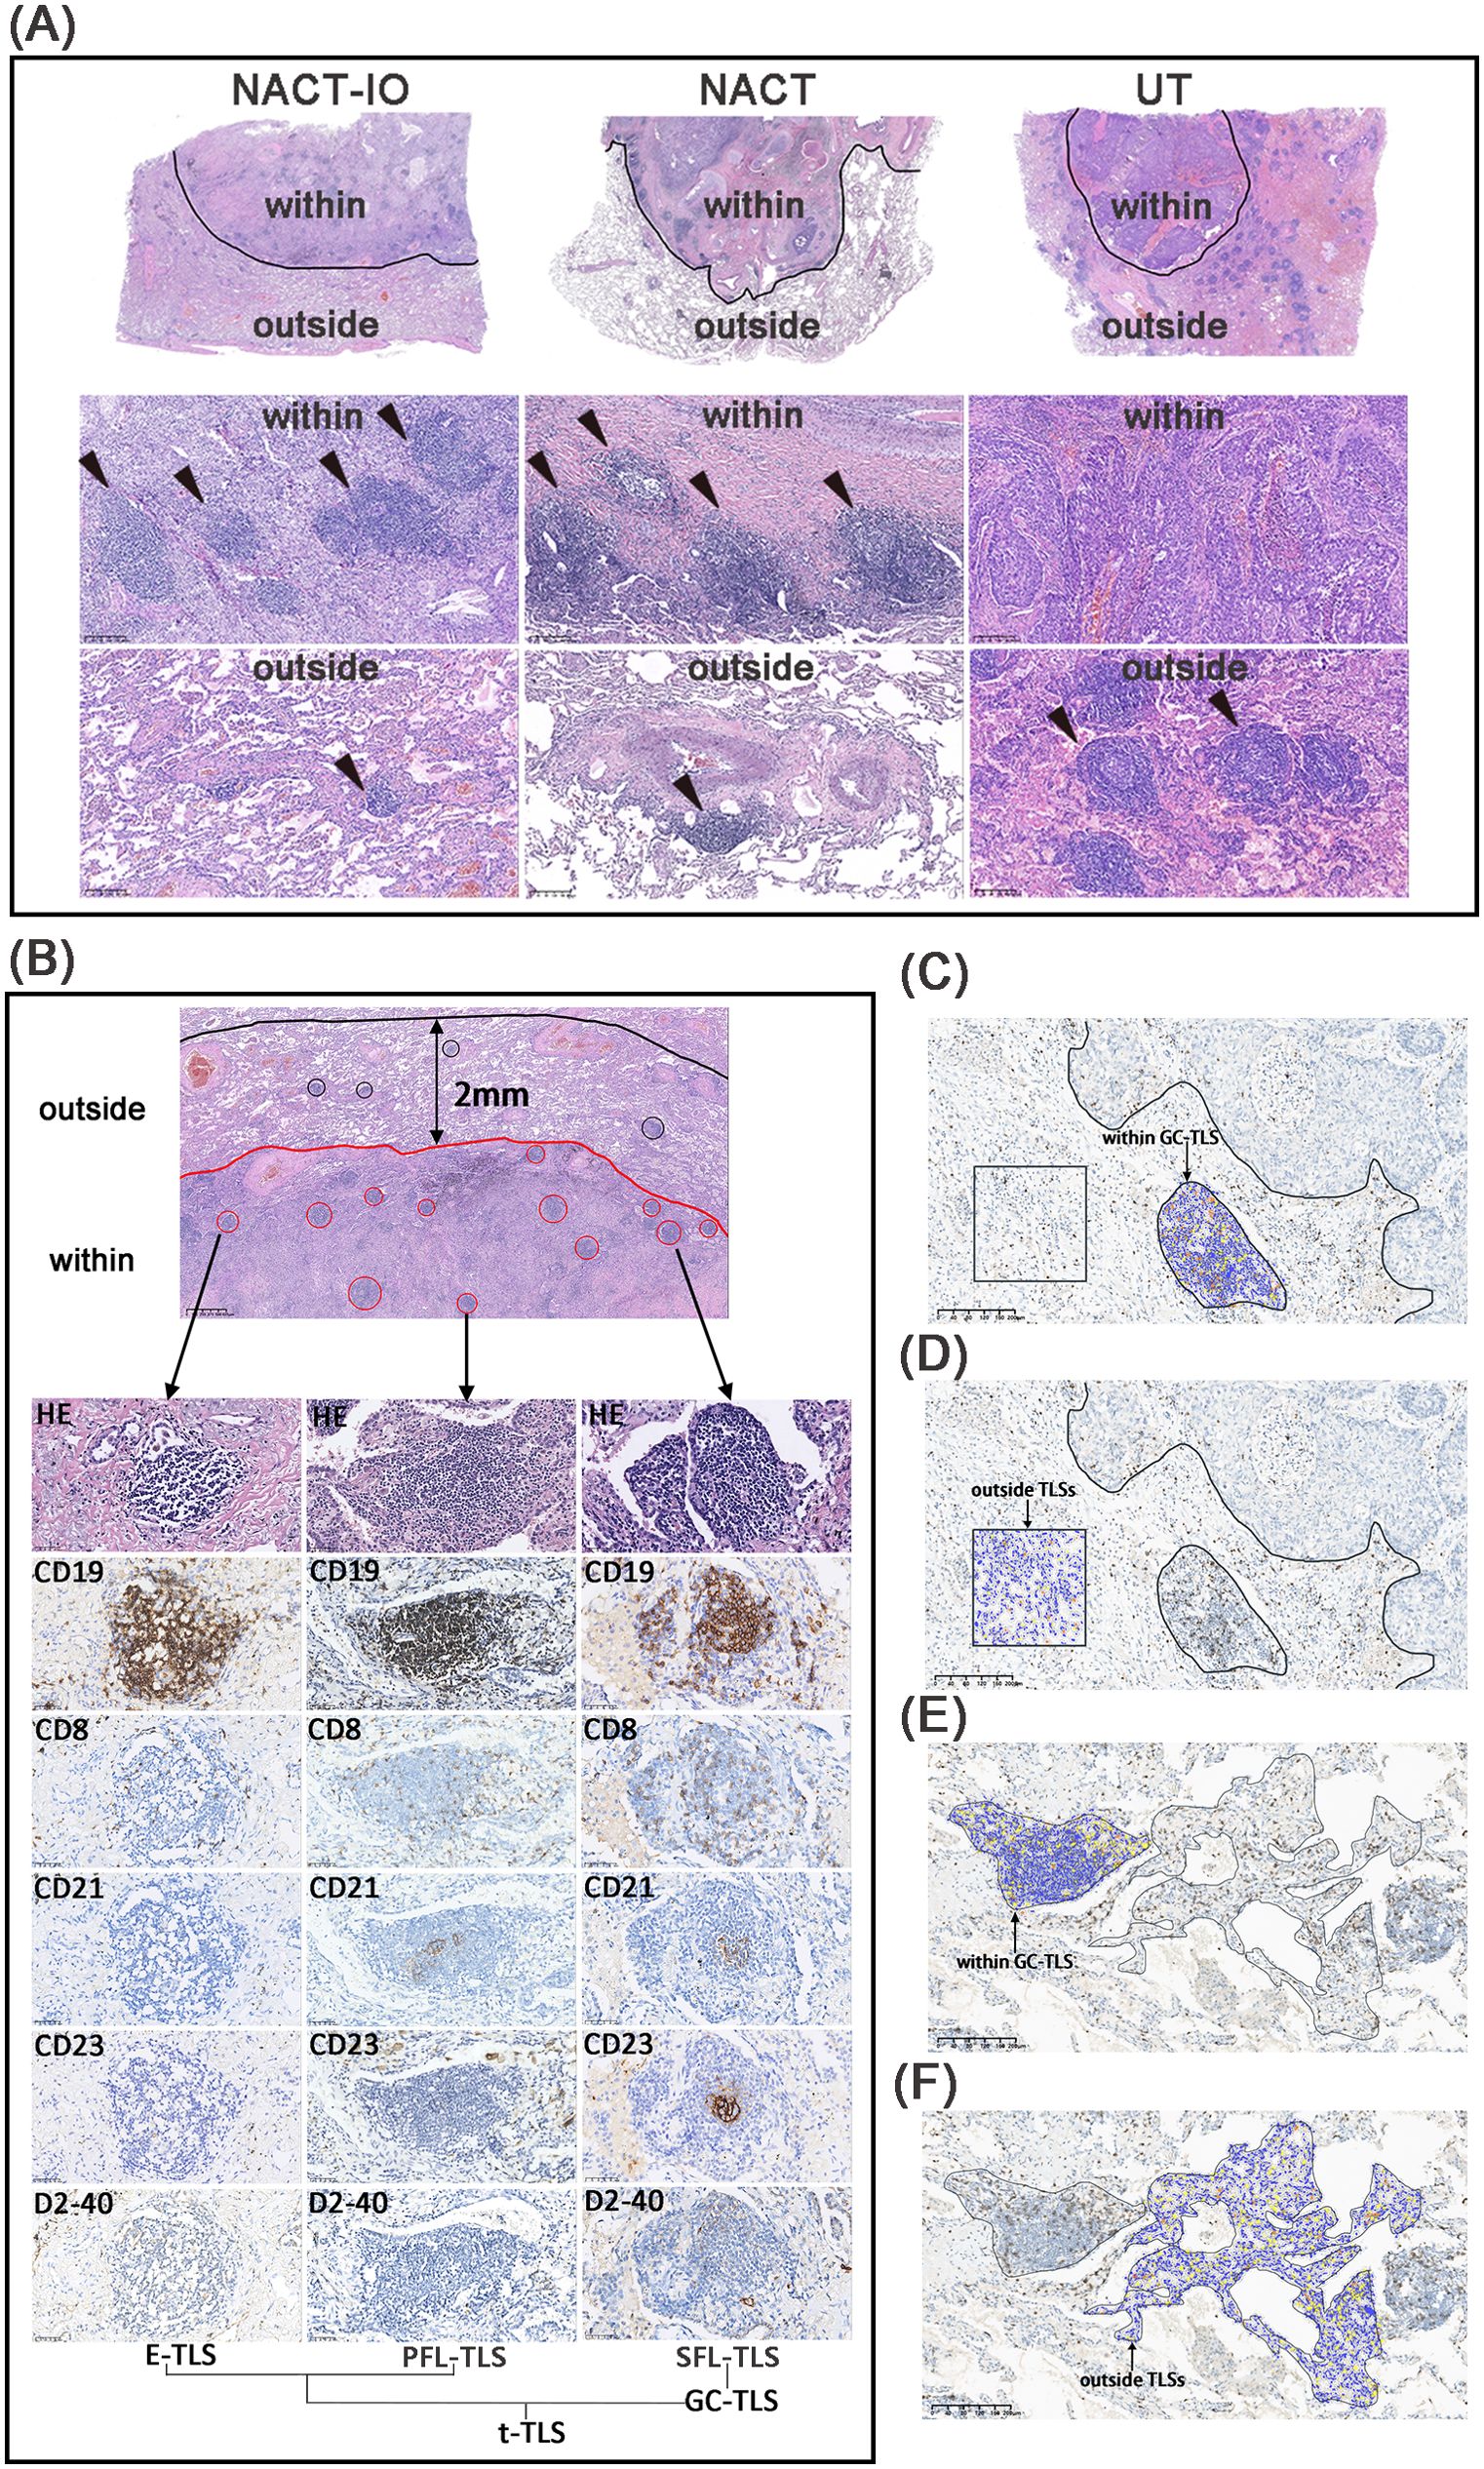
Figure 2. The niche distribution characteristics of TLSs and CD8+ T cell location distribution. The TLSs located the within- and outside- regions of tumor bed in NACT-IO group (left), NACT group (middle) and UT group (right) (A). The TLSs at different developmental stages, including E-TLS, PFL-TLS and SFL-TLS. The E-TLS was characterized by CD19+, CD8+, CD21—, CD23— and D2 - 40—. The PFL-TLS was characterized by CD19+, CD8+, CD21+, CD23— and D2 - 40+. The SFL-TLS was characterized by CD19+, CD8+, CD21+, CD23+ and D2 - 40+. E-TLS, PFL-TLS and SFL-TLS were counted as t-TLS. Among them, SFL-TLS is GC-TLS (B). Quantitative assessment of CD8+T cell density in the tumor bed, including areas within GC-TLS (black arrow, oval area) and areas outside TLSs (black arrow, square area) (C, D). Quantitative assessment of CD8+ T cell density outside the tumor bed, including areas within GC-TLS (black arrow, oval area) and areas outside TLSs (black arrow, irregular area). (C, D). (C–F) magnification×100.
NACT and NACT-IO induced TLSs formation and differentiation into mature phenotype (GC formation) and directed TLSs recruitment to the tumor bed (antigen-rich region)
Firstly, the differences of t-/GC-TLSs within the tumor bed and outside the tumor bed in the three groups were analyzed. The t-TLSs within the tumor bed of the NACT-IO group (within/outside: 0.31 ± 0.21 vs 0.08 ± 0.11 t-TLSs/mm², p<0.001) and NACT group (within/outside: 0.14 ± 0.15 vs 0.06 ± 0.14 t-TLSs/mm², p<0.01) were significantly higher than that outside the tumor bed, while the UT group (within/outside: 0.05 ± 0.09 vs 0.20 ± 0.29 t-TLSs/mm², p<0.01) was the opposite (Figure 3A). Similarly, The GC-TLSs within the tumor bed of the NACT group (within/outside: 0.04 ± 0.06 vs 0.00 ± 0.08 GC-TLSs/mm², p<0.001) and NACT-IO group (within/outside: 0.07 ± 0.11 vs 0.00 ± 0.04 GC-TLSs/mm², p<0.001) were significantly higher than that outside the tumor bed, while the UT group (within/outside: 0.01 ± 0.04 vs 0.08 ± 0.13 GC-TLSs/mm², p<0.001) was the opposite (Figure 3B).
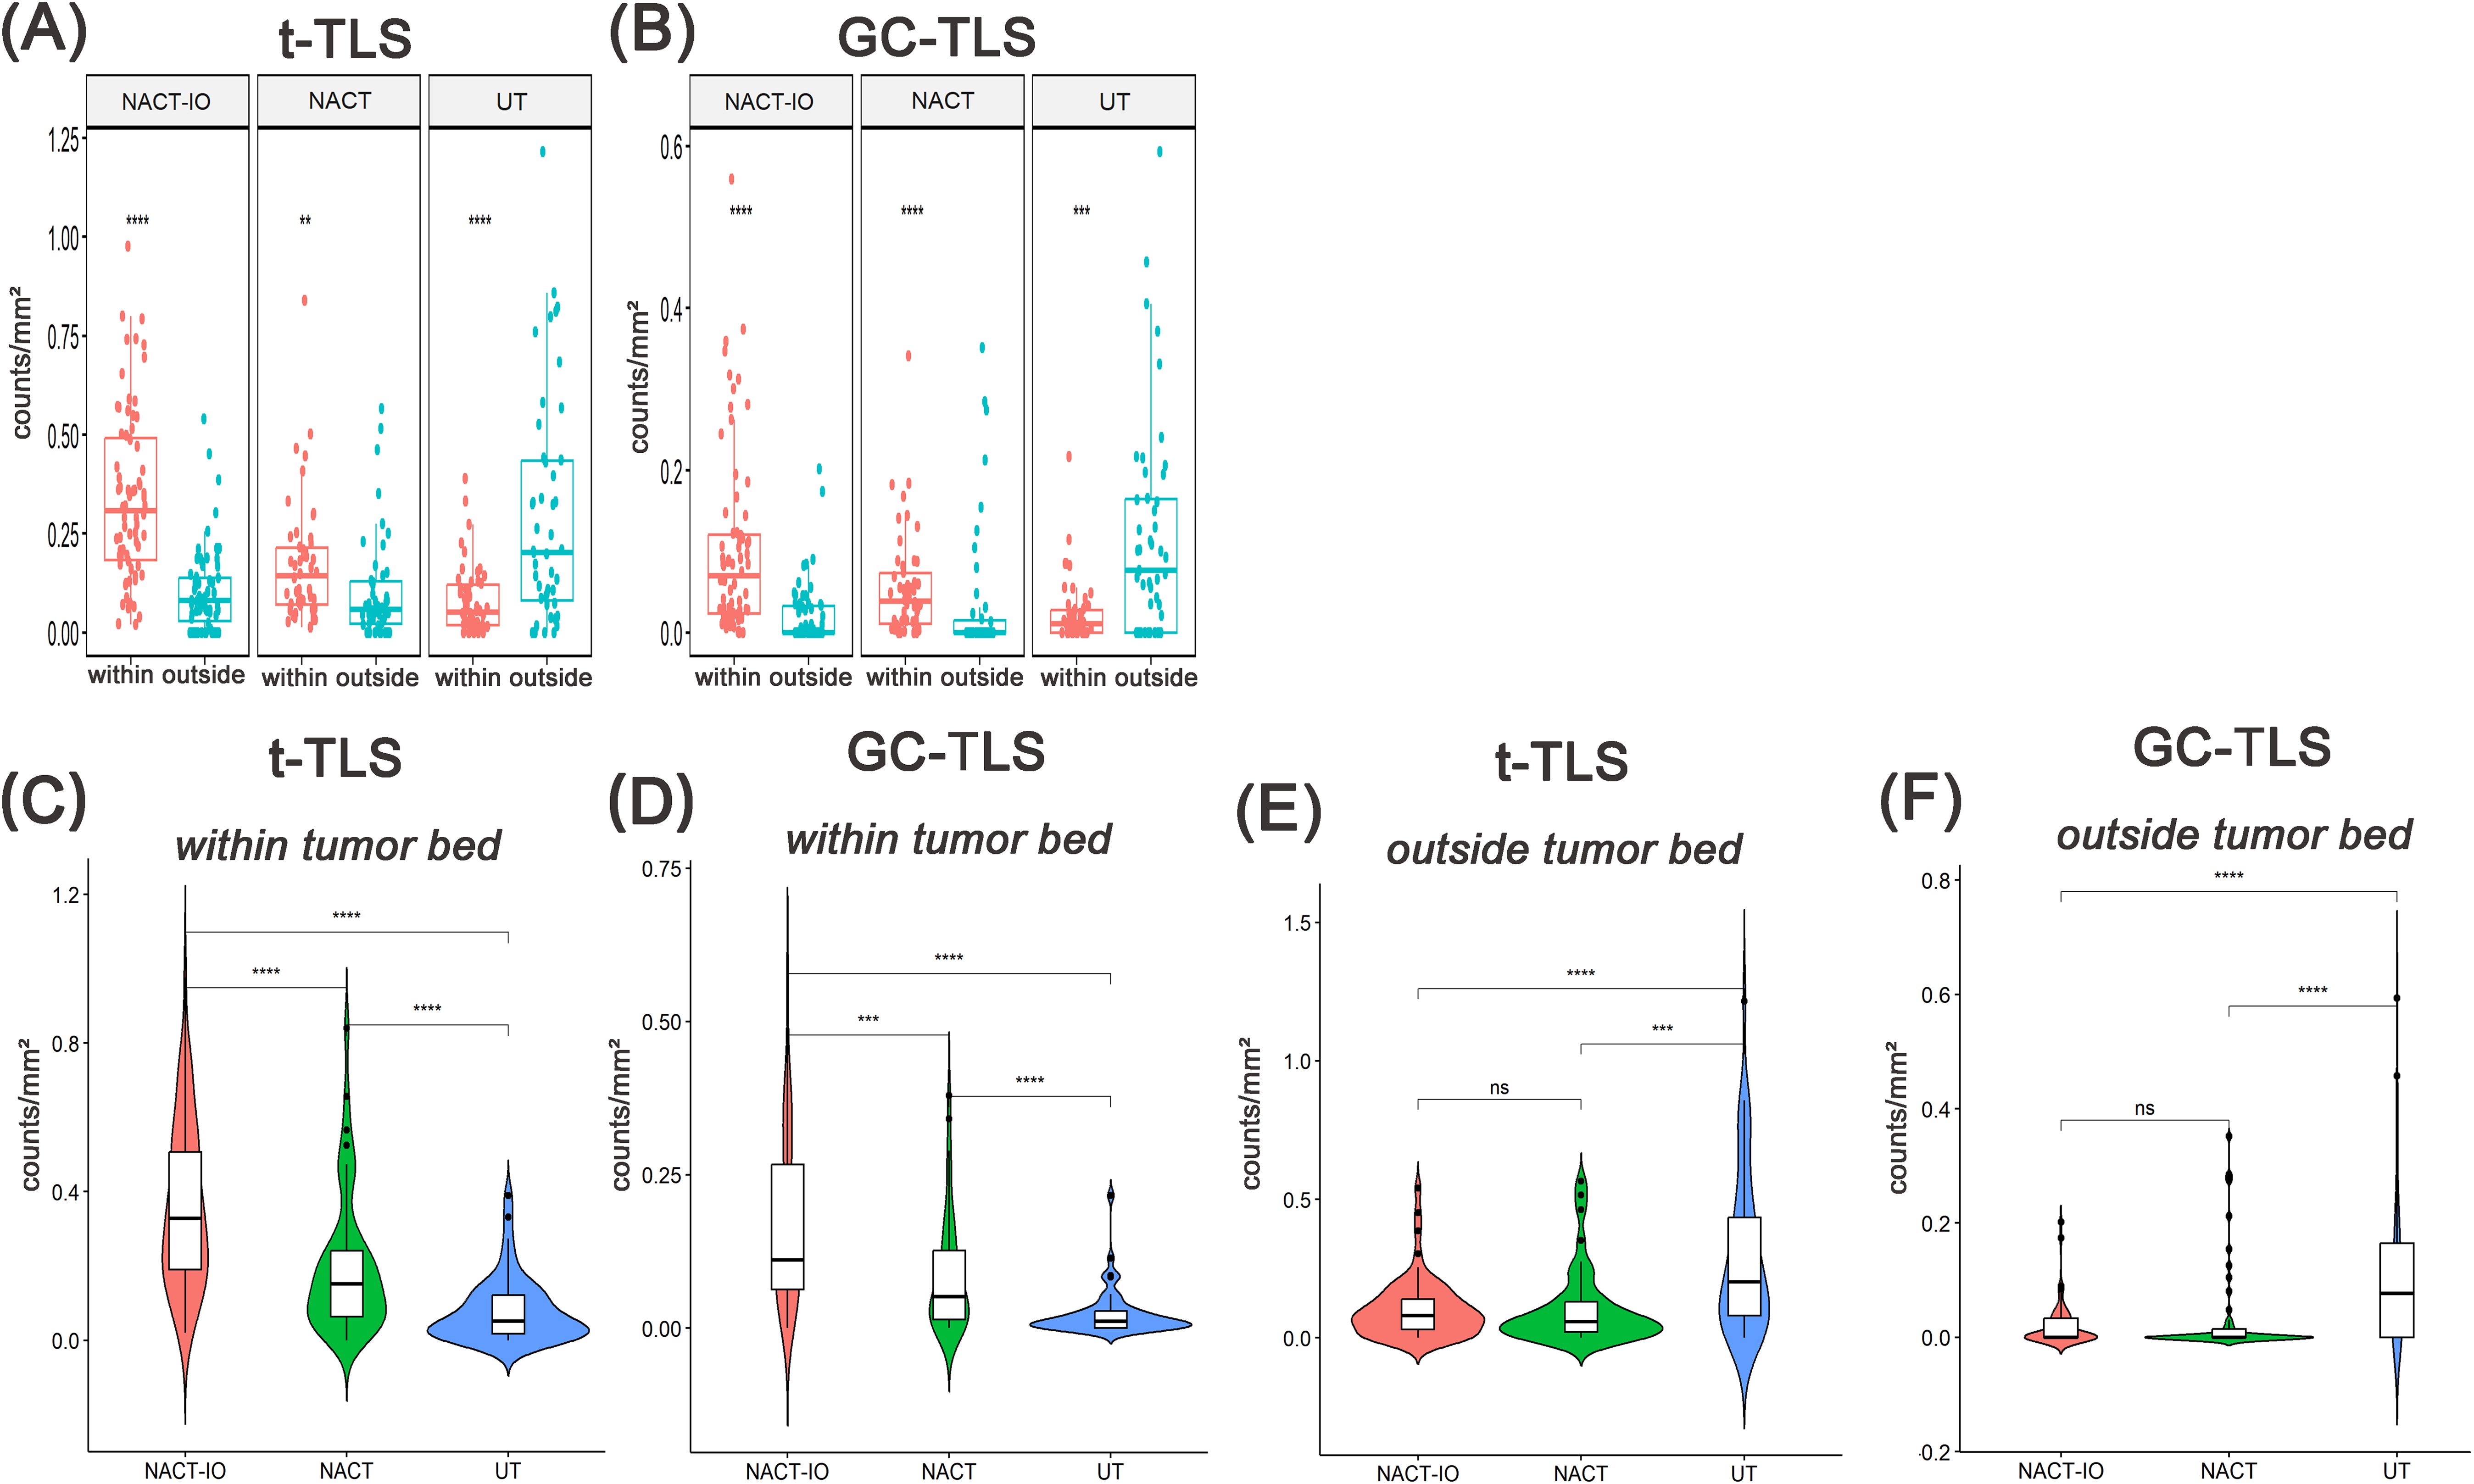
Figure 3. Analysis of the spatial distribution of t-/GC-TLSs in NACT-IO group(n=72), NACT group(n=50) and UT group(n=50) and between groups. The density difference of t-TLS (A) and GC-TLS (B) in the within and outside regions of the tumor bed in the NACT-IO group, the NACT group and the UT group. The differences of t-TLS (C) and GC-TLS (D) within the tumor bed were compared among NACT-IO group, NACT group and UT group. The differences of t-TLS (E) and GC-TLS (F) outside the tumor bed were compared among NACT-IO group, NACT group and UT group. The p value was obtained by Wilcoxon rank sum test (* * means p < 0.01; * * * denotes p < 0.001; ns means no statistical difference).
Then, the differences of t-/GC-TLSs in the same spatial location among the three groups were analyzed. The t-TLSs within the tumor bed of the NACT-IO group and NACT group were significantly higher than that of the UT group (NACT-IO group/UT group: 0.20 ± 0.29 vs 0.06 ± 0.14 t-TLSs/mm², p<0.01; NACT group/UT group: 0.14 ± 0.15 vs 0.05 ± 0.09 t-TLSs/mm², p<0.01) (Figure 3C). The GC-TLSs within the tumor bed of the NACT-IO group and NACT-IO group were significantly higher than that of the UT group (NACT-IO group/UT group: 0.08 ± 0.13 vs 0.00 ± 0.09 GC-TLSs/mm², p<0.01; NACT group/UT group: 0.04 ± 0.06 vs 0.01 ± 0.04 GC-TLSs/mm², p<0.01) (Figure 3D). However, the t-TLSs outside the tumor bed of the NACT-IO group and NACT group were significantly lower than that of the UT group (NACT-IO group/UT group: 0.08 ± 0.11 vs 0.20 ± 0.29 t-TLSs/mm²; NACT group/UT group: 0.06 ± 0.14 vs 0.20 ± 0.29 t-TLSs/mm², p<0.01) (Figure 3E). The GC-TLSs outside the tumor bed of the NACT-IO group and NACT-IO group were significantly lower than that of the UT group (NACT-IO group/UT group: 0.00 ± 0.04 vs 0.08 ± 0.13 GC-TLSs/mm², p<0.01; NACT group/UT group: 0.00 ± 0.08 vs 0.08 ± 0.13 GC-TLSs/mm², p<0.01) (Figure 3F).
NACT-IO and NACT inhibited the induction of TLSs in a time-dependent manner
The differences of t-/GC-TLSs in NACT-IO group among patients receiving two or less (≤ 2) (n=38) or more than two (> 2) (n=34) treatment cycles were analyzed. The t-/GC-TLSs in the tumor bed was significantly higher than the baseline level (UT group), regardless of receiving ≤ 2 or > 2 cycles of NACT-IO (p<0.01, p<0.001) (Figures 4A, B). Among them, after receiving > 2 cycles of NACT-IO, t-/GC-TLS in the tumor bed decreased, but the decrease of GC-TLSs was significant (p<0.01) (Figure 4B). Similarly, the t-/GC-TLSs in the tumor bed were significantly higher than the baseline level (UT group) after receiving ≤ 2 (n=32) cycles of NACT (p<0.001) (Figures 4C, D). However, after receiving > 2 (n=18) cycles of NACT, t-/GC-TLS in the tumor bed both significantly decreased (p<0.05, p<0.001) (Figures 4C, D). Among them, GC-TLSs in the tumor bed even decreased to no significant difference from the baseline in patients receiving ≤ 2 cycles of NACT.
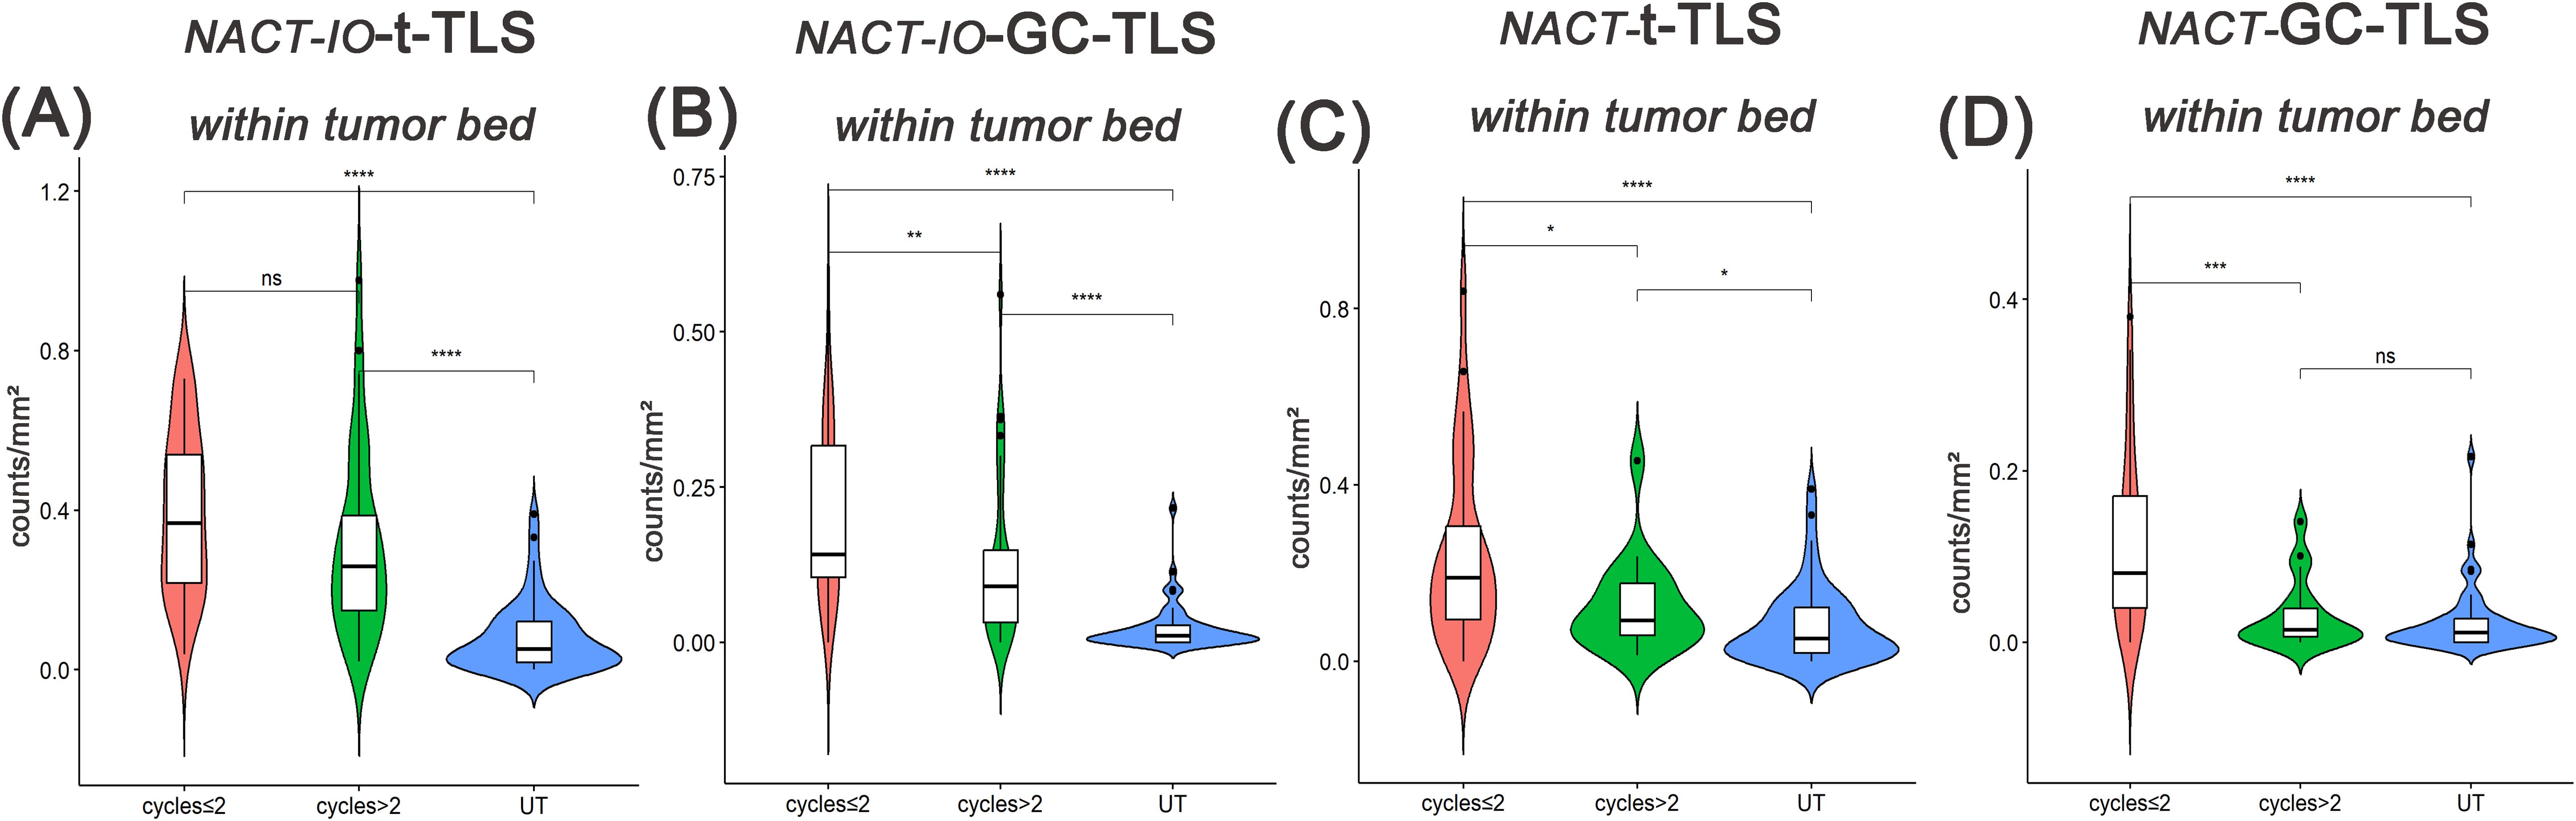
Figure 4. Differences in t-/GC-TLSs located in the tumor bed between UT group (baseline) and samples after receiving two or less(≤2) or more than two(>2) cycles of NACT-IO/NACT. Differences in t-TLSs (A) and GC-TLSs (B) located in the tumor bed between UT group (baseline) and samples after ≤2(n=38)/>2(n=34) cycles of NACT-IO. Differences in t-TLSs (C) and GC-TLSs (D) located in the tumor bed between UT group (baseline) and samples after ≤2(n=32)/>2(n=18) cycles of NACT. The p value was obtained by Wilcoxon rank sum test (* * means p < 0.01; * * * denotes p < 0.001; ns means no statistical difference).
Long-term NACT may lead to depletion extravasation of CD8+T cells in GC-TLS, and combined immunotherapy maintains the efficacy of GC-TLS by reshaping the spatial distribution of CD8+T cells
The differences of CD8+T cells with different spatial distribution in NACT-IO group/NACT group in patients receiving different treatment cycles were analyzed. After receiving > 2 cycles of NACT-IO, it was no significant change in the infiltration of CD8 (T cells) within the GC-TLS region (Figure 5A, left), while the infiltration of CD8+T cells in the outer region of TLSs decreased significantly (p<0.05) (Figure 5B, left). Differently, after receiving > 2 cycles of NACT, the infiltration of CD8+T cells in GC-TLS decreased (Figure 5A, right), while the infiltration of CD8+T cells in the outer region of TLSs increased (Figure 5B, right).
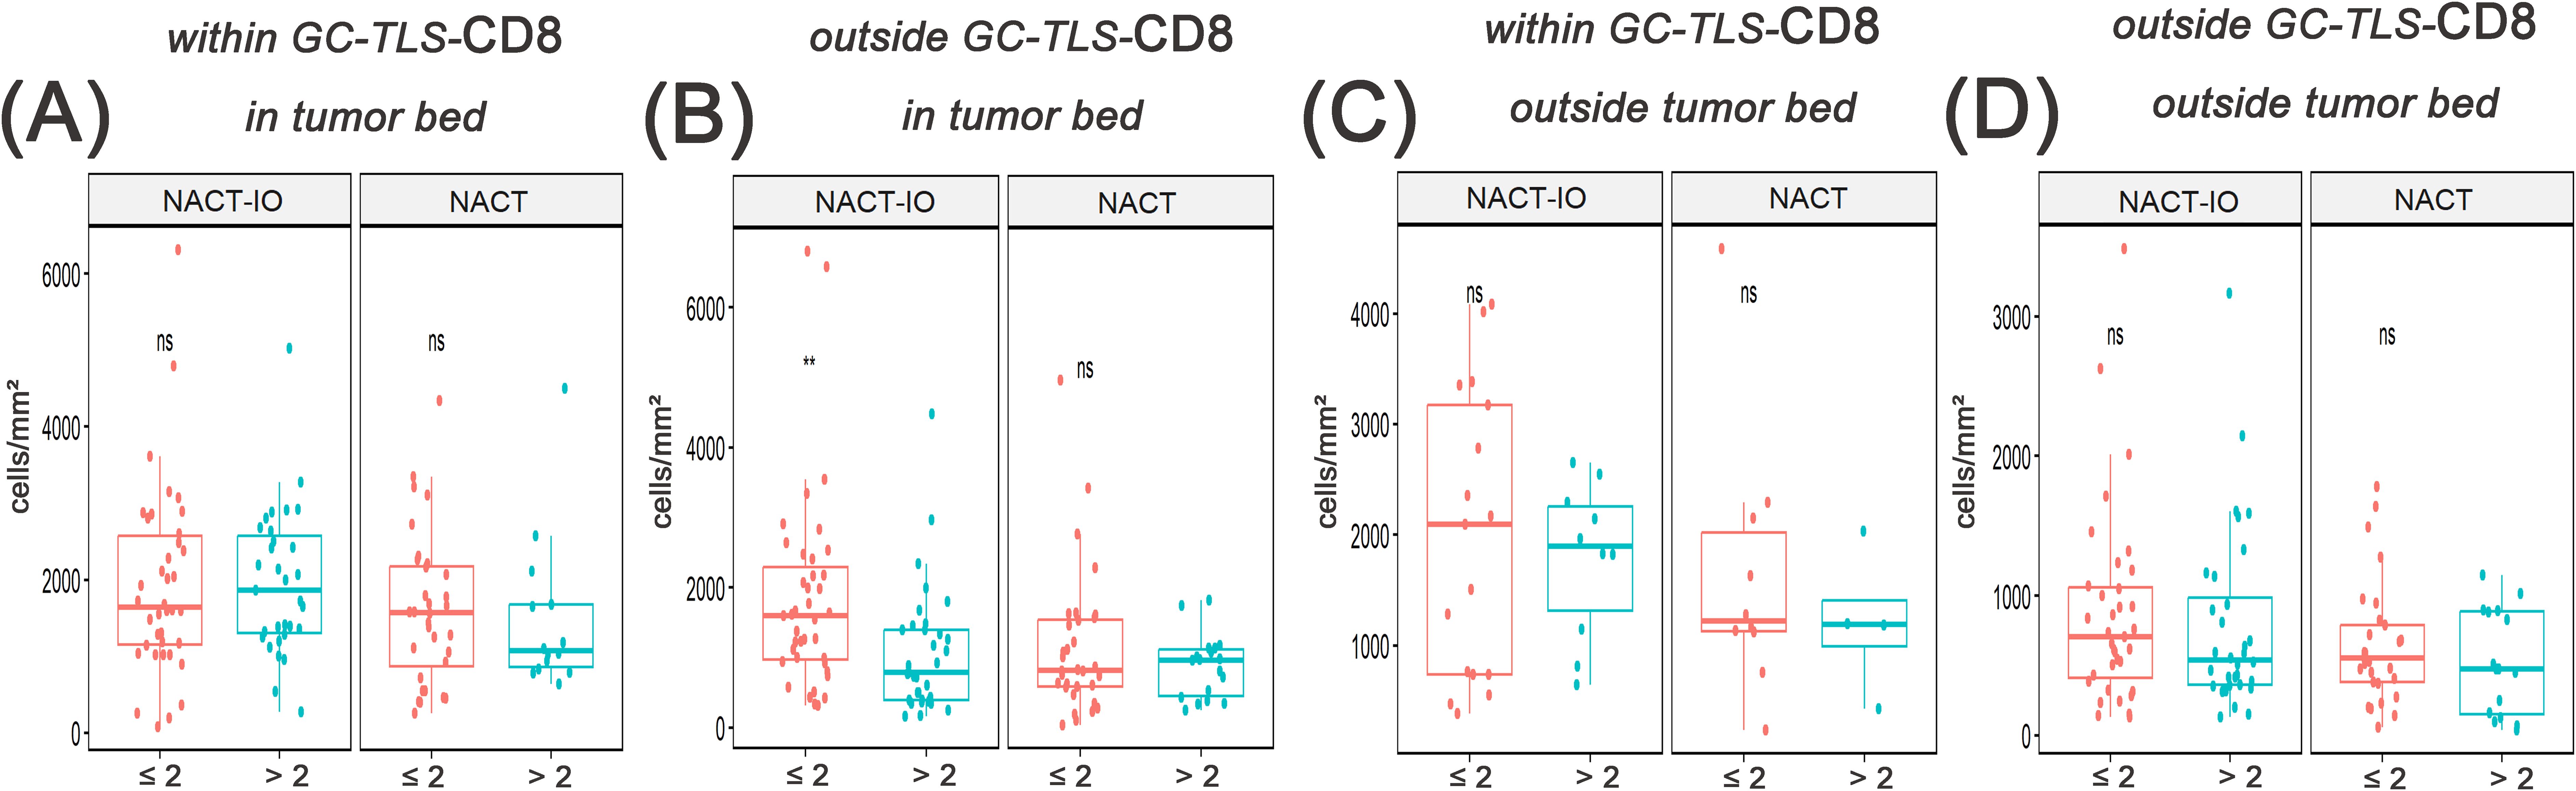
Figure 5. The correlation between the migration and enrichment pattern of CD8+T cells and receiving ≤ 2 or > 2 cycles of NACT-IO/NACT was analyzed. The difference of CD8+T cells within GC-TLSs in tumor bed between patients receiving ≤2(n=38)/>2(n=34) cycles of NACT-IO(A, left) and ≤2(n=32)/>2(n=18) cycles of NACT(A, right). The difference of CD8+T cells outside TLSs in tumor bed between patients receiving ≤2/>2 cycles of NACT-IO(B, left)/NACT(B, right). The difference of CD8+T cells within GC-TLSs outside tumor bed between patients receiving ≤2/>2 cycles of NACT-IO(C, left)/NACT(C, right). The difference of CD8+T cells outside TLSs outside tumor bed between patients receiving ≤2/>2 cycles of NACT-IO(D, left)/NACT(D, right). The p value was obtained by Wilcoxon rank sum test (* * means p < 0.01; * * * denotes p < 0.001; ns means no statistical difference).
The induction effect of NACT on the formation and maturation of TLS may be positively correlated with tumor tissue load, but the combination of immunotherapy makes TLS compensatory proliferation
The relationship between t-/GC-TLS in tumor bed and different pathological remission cases (CPR/MPR vs. PPR) in NACT-IO group/NACT group was analyzed. In the NACT group, t-TLS in the tumor bed increased in the PPR cases (n=39) compared with the baseline (UT group) (Figure 6C), while the t-/GC-TLSs in the tumor bed were no significant change in the CPR/MPR cases (n=11) (Figures 6C, D). Moreover, after combined immunotherapy (NACT-IO group), the t-/GC-TLSs in the tumor bed of CPR/MPR cases (n=52) were higher than those of UT and PPR cases (n=20) (Figures 6A, B), and t-TLS was a significant advantage (p<0.001, p<0.05) (Figure 6A).
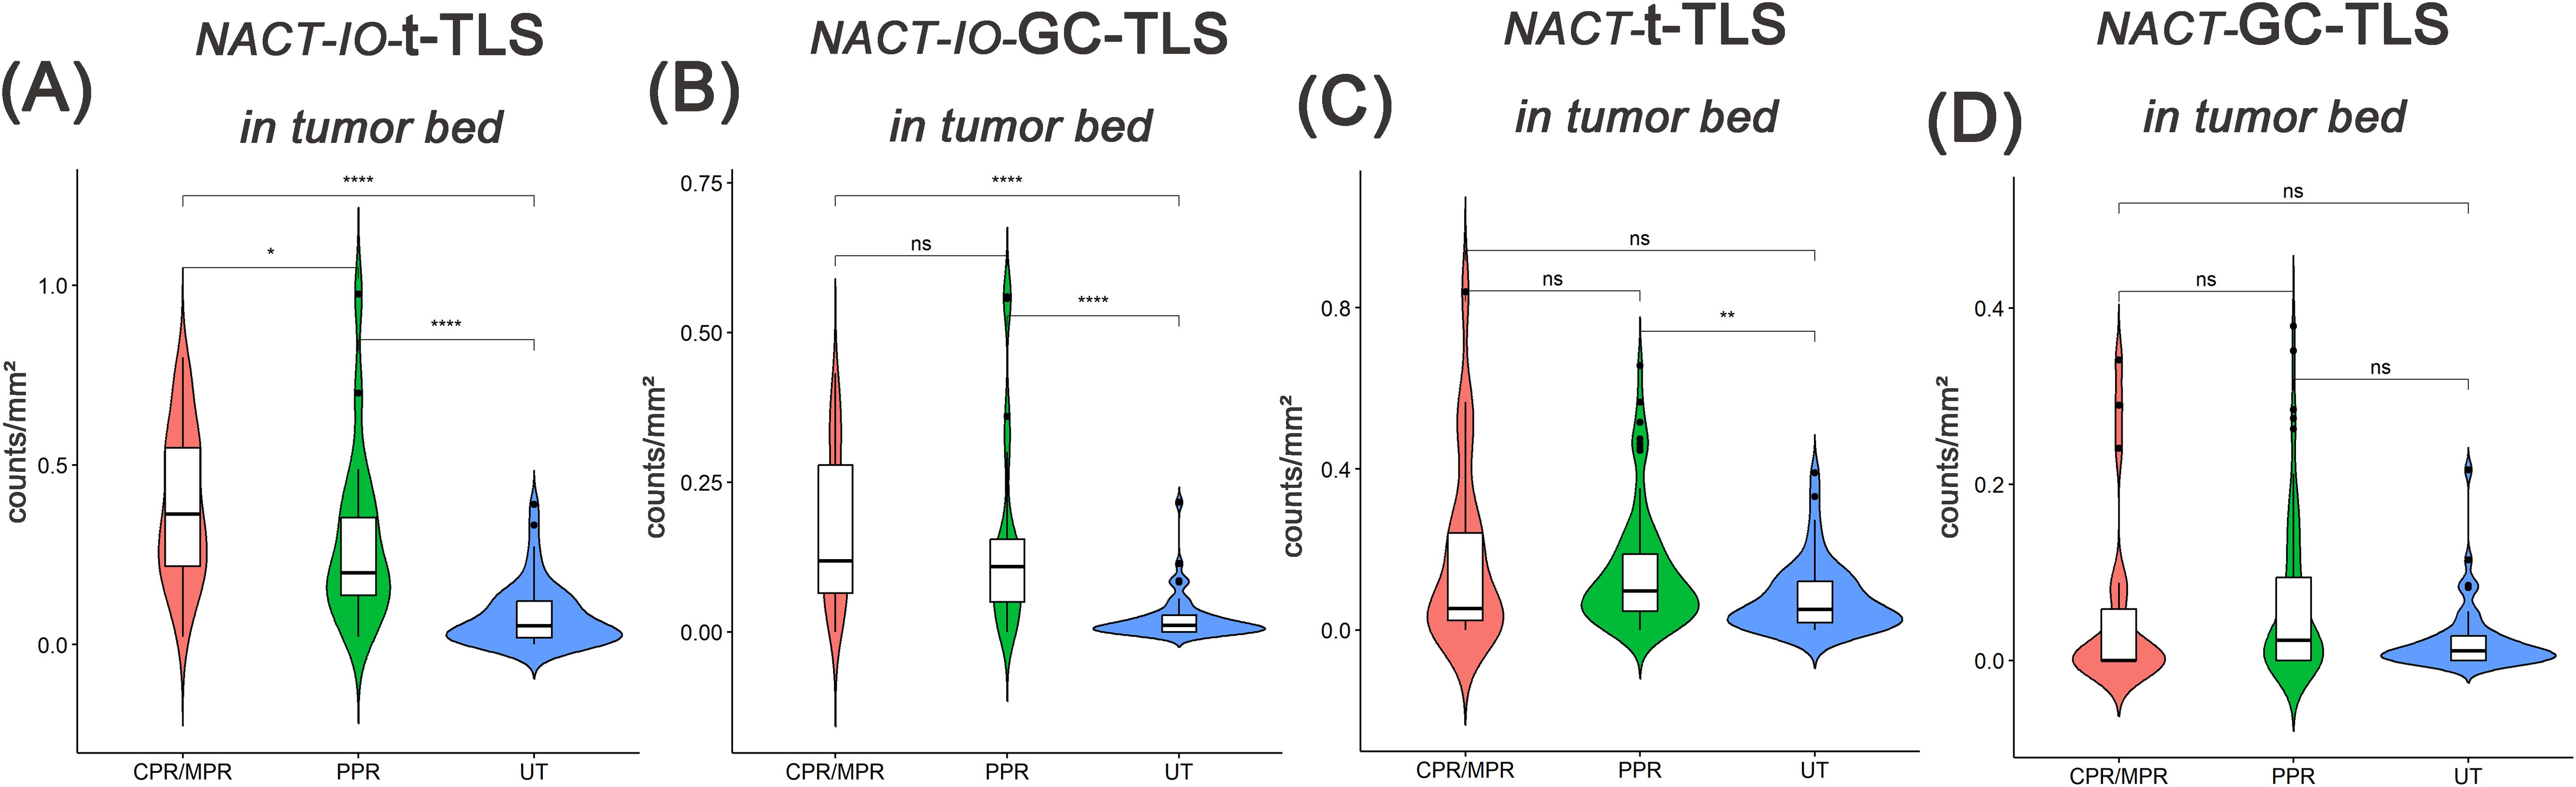
Figure 6. The difference of t-TLSs/GC-TLSs within tumor bed in different pathological remission cases between UT group (baseline) and NACT-IO group/NACT group. The difference of t-TLSs (A) /GC-TLSs (B) in tumor bed between CPR/MPR(n=52) and PPR(n=20) cases in UT group (baseline) and NACT-IO group. The difference of t-TLSs (C) /GC-TLSs (D) in tumor bed between CPR/MPR(n=11) and PPR(n=39) cases in UT group (baseline) and NACT group. The p value was obtained by Wilcoxon rank sum test (* * means p < 0.01; * * * denotes p < 0.001; ns means no statistical difference).
Two cycles of NACT-IO may be a time window period for immune activation, and GC-TLS in the tumor bed can predict disease progression
The median follow-up duration was 24 months (range one day to 67 months). Based on the previously discovered treatment cycle-dependent immune microenvironment remodeling, we further verified whether TLS can be used as a biomarker to predict the survival benefit of combined therapy in a short period (≤ 2 treatment cycles) through survival analysis. According to the density distribution of t-/GC-TLS in the tumor bed of patients receiving ≤ 2 NACT-IO treatment cycles, the median value (median of t-TLS=0.37/mm2, range: 0.04/mm2-0.73/mm2; median of GC-TLS=0.14/mm2, range: 0/mm2-0.56/mm2) patients were divided into high/low group. Survival analysis results revealed that a significantly improved DFS in patients with high density t-/GC-TLS within the tumor bed (p = 0.005, p = 0.031) in patients who received ≤ 2 cycles of NACT-IO (n=38) (Figures 7A, B). However, the t-/GC-TLSs are not a prognostic factor for short-term (≤ 2 treatment cycles) NACT cases (n=32) (Figures 7C, D). In order to establish a clinically applicable TLS evaluation standard, this study stratified the t-/GC-TLS density in the tumor bed according to the threshold of hot spot area (t-TLS ≤/> 3/20×HPF, GC-TLS ≤/> 2/20×HPF). Multivariate analysis confirmed that the threshold of GC-TLS (≤ 2/20×HPF) could independently predict the survival risk of patients with ≤ 2 cycles of NACT-IO (HR = 3.99, 95%CI=1.10~14.5, p = 0.036), suggesting its potential as an auxiliary marker for treatment decision-making (Table 2).
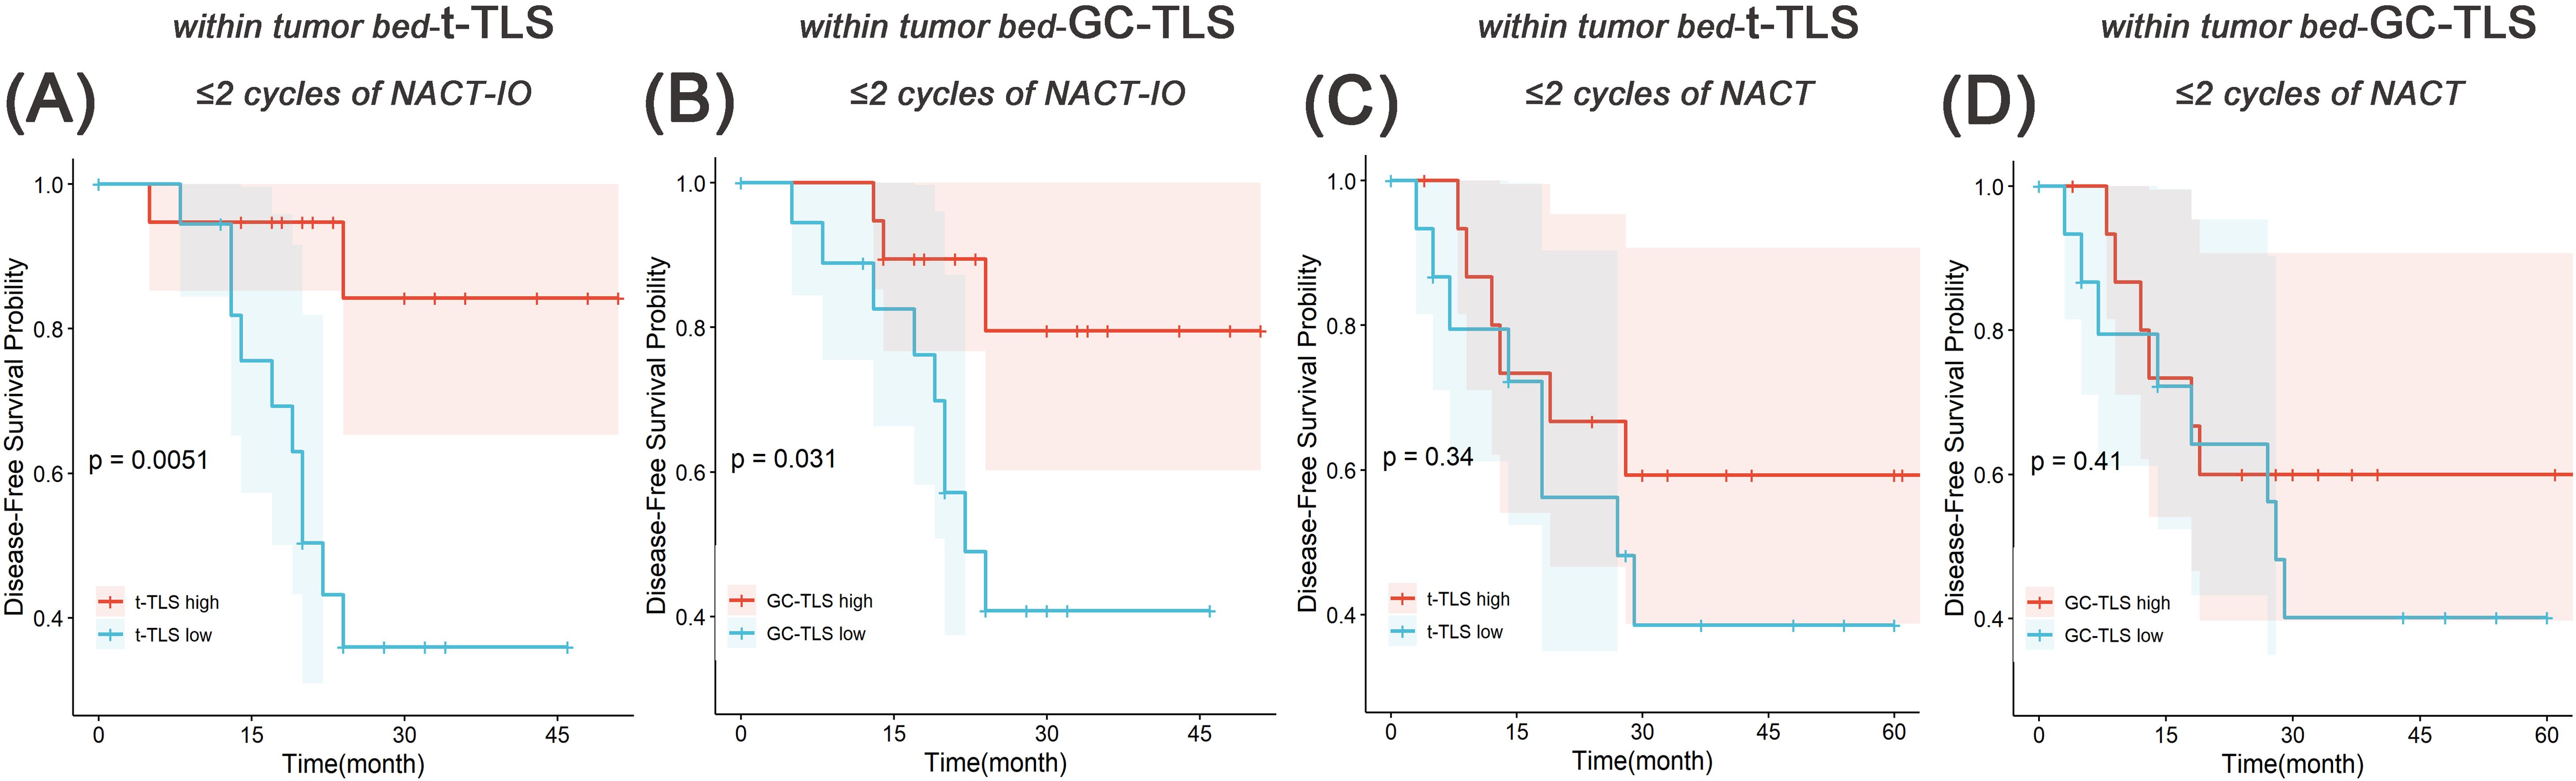
Figure 7. Survival analysis of t-TLS/GC-TLS in tumor bed in receiving ≤2 cycles of NACT-IO/NACT. The Kaplan-Meier curves of t-TLS (A) /GC-TLS (B) in the tumor bed high-/low- subgroup receiving ≤2 cycles of NACT-IO (n=38). The Kaplan-Meier curves of t-TLS (C) /GC-TLS (D) in the tumor bed high-/low- subgroup receiving ≤2 cycles of NACT (n=32). p < 0.05 was considered statistically significant.
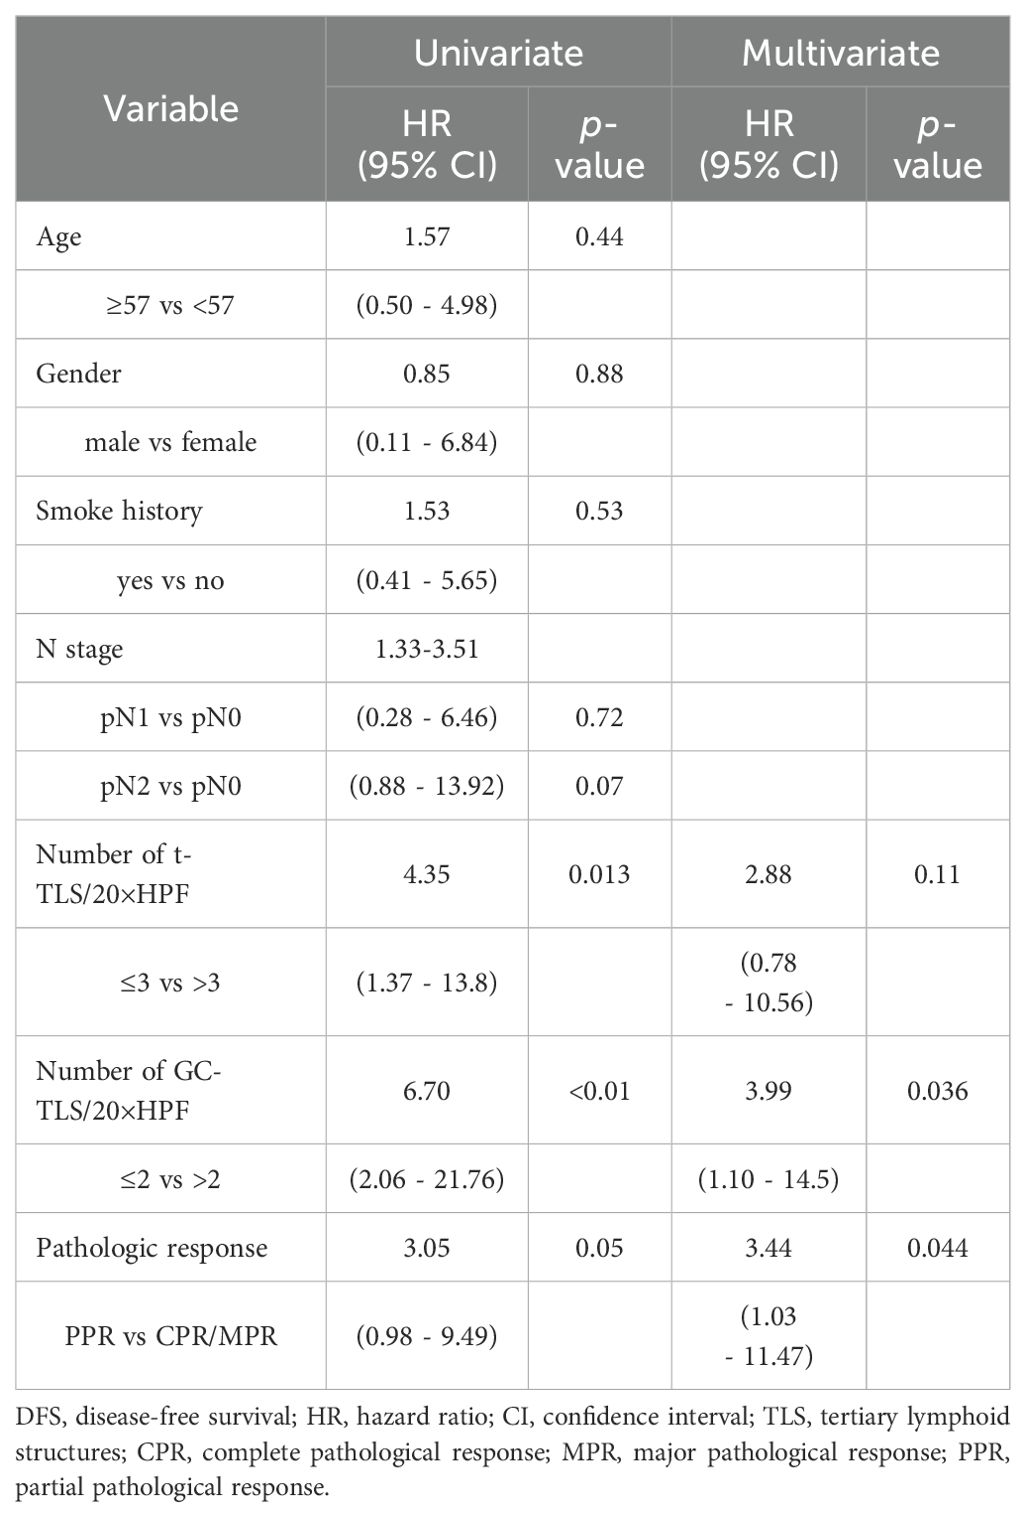
Table 2. Univariate and multivariate analyses of DFS in patients with ≤ 2 cycles of NACT-IO (n=38).
Reproducibility of assessing the t-TLS/GC-TLS within tumor bed hotspots quantification
Independent assessment by two pathologists demonstrated both near-perfect agreement in t-TLS hotspot identification (Cohen’s κ = 0.85, 95% CI: 0.70 - 0.95). and GC-TLS hotspot identification (Cohen’s κ = 0.81, 95% CI: 0.62 - 0.94), confirming the operational robustness of this metric in routine pathology practice.
Discussion
TIME is rich in components, but a large number of studies have focused on the T lymphocyte subsets (23). The CD8+T cells are highly destructive anti-tumor immune effector cells. Chemotherapy-induced immunogenic cell death (ICD) promotes the maturation and activation of dendritic cells (DCs), enabling them to present tumor antigens to CD8+T cells, thereby activating specific cytotoxic T lymphocyte responses (24). The combination of chemotherapy and immune checkpoint inhibitors can enhance this anti-tumor effect (25). We observed by mIF that CD8+T cells increased in most cases after receiving NACT/NACT-IO, even if not significantly. In recent years, various clinical studies of anti-tumor immune cells are rapidly expanding beyond the T cell-centered perspective, especially B cells (26). B cells could play an active role in anti-tumor immunity by acting as antigen-presenting cells, participating in the formation of TLS, and producing antibodies (27). We observed that the common role of NACT and NACT-IO is to significantly promote the infiltration of CD19+B cells and participate in the remodeling of TIME in SCC. The results of the study on NSCLC patients after neoadjuvant chemotherapy show that the prognosis of patients with SCC is not only affected by T cells, but also related to B cells, which is different from adenocarcinoma (28). B lymphocytes are the main components of TLS, and T cells are also one of the indispensable components (21, 29, 30). As an ‘ in situ immune factory ‘, TLS supports the differentiation of B cells into plasma cells (antibody secretion) and memory B cells through germinal center, and promotes the synergistic killing of Tfh-CD8+T cells (30). Therefore, B cells may be a key factor involved in the neoadjuvant therapy of SCC (chemotherapy alone or combined immunotherapy), which may provide a cellular basis for the formation of TLS.
The presence of the TLS structure often indicates a good prognosis outcome of the tumor (9, 21, 29), and it can also significantly enhance the anti-tumor effect of neoadjuvant immunochemotherapy by integrating local adaptive immune responses and systemic inflammatory signals (31). In fact, there is a ‘ two-way interaction ‘ between TLS and clinical treatment measures. In clinical practice, vaccines (32) and cisplatin (33) have been found to induce TLS in high-grade cervical intraepithelial neoplasia and hepatoblastoma. Therefore, further study on the induction of TLS by which drugs and treatment methods will help to develop new cancer treatment strategies to improve prognosis and survival rate. In this study, the results of cross-sectional comparative analysis among the three groups revealed the mechanism of synergistic regulation of TLS generation between chemotherapy and immunotherapy. In fact, in addition to maturity, the localization pattern has also been proved to be one of the key features of TLS functional differentiation. Patients with TLS in hepatocellular carcinoma (HCC) have a significantly lower risk of early recurrence within 2 years after surgery. However, there was no significant correlation between the density or maturity of TLS located at the edge of HCC or surrounding non-cancerous tissues and the risk of early recurrence (14). Interestingly, patients with cholangiocarcinoma (16) and esophageal squamous cell carcinoma (19) with high density of TLS around the tumor benefited significantly from chemotherapy combined with immunotherapy. In addition, another study of breast cancer suggested that patients with high TLS density around the tumor had a lower response rate to neoadjuvant chemotherapy (15). In this study, subgroup analysis based on spatial topological features confirmed that NACT/NACT-IO can induce TLS to show specific enrichment in the high exposure area of tumor antigen (the area where the original tumor tissue exists, that is, in the tumor bed), suggesting that the synergy of chemotherapy and immunotherapy drives the ecological position of TLS directional recruitment in the tumor bed. Few studies have explored to investigate the exact relationship between spatial distribution of TLS and clinical prognosis in SCC. To the best of our knowledge, this study represents the first attempt to assess the spatial aspects of TLS in SCC.
Silia et al. found that chemotherapy combined with corticosteroid in the treatment of lung squamous cell carcinoma could inhibit the formation of GC, a key functional unit in TLS, and weaken its anti-tumor potential (11). Zhang ‘s team confirmed in bladder cancer that platinum-based chemotherapy synergistically promotes TLS regeneration and maturation by inducing tumor immunogenic death to release antigens, activating dendritic cells, and combining programmed cell death 1/programmed cell death ligand 1(PD - 1/PD-L1) inhibitors (22). The analysis of the three groups and the analysis of the spatial sub-component layer in this study also supported that platinum-based chemotherapy alone and combined immunotherapy could significantly improve the mature phenotype differentiation of TLS, which may suggest that the immune regulation role of chemotherapy has the characteristics of ‘ treatment combination dependence ‘. Prolonging the cycle of chemotherapy combined with immunotherapy to 3 – 4 cycles can significantly achieve higher MPR rate (34). In fact, the extension of the treatment cycle may lead to delayed surgery, but short-term treatment may not be enough to maximize the effect of immunotherapy. The maturation of TLS requires continuous antigen exposure and immune microenvironment remodeling, which also suggests that the number of treatment cycles may directly affect its functional maturity and spatial distribution. Our results show that the promotion effect of NACT on GC is significantly weakened after the extension of the cycle. Interestingly, the generation of GC in TLS was sustained after combined immunotherapy, and the prolongation of the treatment cycle did not significantly weaken this effect. On the one hand, we confirmed that long-term NACT treatment can lead to the depletion of TLS and weakening of TLS maturity, and on the other hand it also revealed chemotherapy combined immunotherapy may antagonize negative regulation by maintaining the function of TLS. It has been reported that after receiving one NAC cycle, the abundance of CD8+T cells in the tumor of breast cancer patients can be significantly increased (35). Our data show that after long-term NACT treatment, CD8+T cells changed from ‘ functional enrichment ‘ to ‘ ineffective dispersion ‘. However, the functional integrity and maturity of TLS are still maintained after prolonging the cycle of NACT-IO, and CD8+T cells located in GC-TLS are anchored by regulating the homeostasis of immune microenvironment. This also suggests that the ‘ double-edged sword ‘ effect of early pro-inflammatory and late immunosuppression of simple chemotherapy may directly destroy the functional coupling of TLS-CD8+T cells. This will make it difficult to determine a time window to reach the balance point of tumor immune tolerance.
The TLS, particularly those harboring GC formations, serves as a robust independent predictor of therapeutic benefit in solid tumors. In patients with NSCLC who received neoadjuvant therapy, TLS infiltration was significantly increased in MPR or pCR compared with non-MPR or non-pCR (36). And, the GC-TLSs are positively correlated with MPR rate in NSCLC (37). When exploring TLS and treatment benefits, we found that the t-TLS of CPR/MPR patients in the NACT-IO group was significantly better than that of PPR patients, not GC-TLS. The t-TLS and GC-TLS of PPR patients in the NACT group were not only slightly higher than those in the UT group (baseline), but also higher than those in the CPR/MPR patients. The TLS acts as a local immune niche to promote adaptive immunity, and its non-encapsulated structure can be directly exposed to various stimuli in TIME (38). The presence of tumor specific antigen is one of the factors for the formation of GC in TLS (9). GC is an important site for the activation, proliferation and differentiation of B cells into antibody-secreting cells in TLS (39). Therefore, we speculate that the formation and maturation of TLS induced by NACT may be largely dependent on tumor tissue load. When the tumor volume is significantly reduced, the antigen release is reduced, and t-TLS and GC-TLS are degraded due to lack of continuous stimulation. Although the combined immunotherapy may maintain the compensatory proliferation of TLS, it is not enough to continue to activate GC. These findings provide a more detailed idea for mining TLS-related indicators as prognostic indicators for SCC patients receiving neoadjuvant therapy.
Finally, this study innovatively developed a spatial hotspot counting method based on digital pathological images. By quantifying the aggregation distribution characteristics of TLS in the tumor bed (rather than simply counting), it revealed the strong correlation between TLS spatial topological pattern and DFS for the first time. Survival analysis of patients receiving ≤ 2 cycles of NACT-IO showed that the DFS rate of patients in the high t-/GC-TLS group was significantly better than that in the low t-/GC-TLS group. Further, the hot spot assessment of t-TLS (HR = 4.35, 95%CI: 1.37 - 13.8, p = 0.013) and GC-TLS (HR = 6.70, 95%CI: 2.06 - 21.76, p < 0.01) in univariate analysis was strongly correlated with DFS benefit. It is worth noting that in the multivariate Cox regression model, GC-TLS hotspot assessment was independent of the traditional prognostic factor of pathological remission (HR = 3.99, 95%CI=1.10-14.5, p = 0.036) and became the strongest independent factor for predicting DFS. This finding breaks through the limitations of traditional TLS semi-quantitative evaluation, revealing that spatial clustering GC-TLS (rather than isolated scattered distribution) is an important feature of clinical benefits, and provides a quantifiable new biomarker system for optimizing the stratification of patients receiving NACT-IO.
Conclusions and prospects
This study analyzed the dynamic regulatory network of neoadjuvant therapy (chemotherapy ± immune checkpoint inhibitors) on TLS, a key hub of TIME in SCC, and clarified that the treatment mode (chemotherapy alone vs combined immunization) and cycle number differences reshape TLS density, spatial topology and functional maturity (GC formation) through a time-dependent mechanism. For the first time, we quantified the spatial aggregation characteristics of TLS (hot spot assessment method) based on digital pathological images, and further explored multi-dimensional topological biomarkers for predicting disease progression, providing a clinically practical and repeatable evaluation tool for optimizing SCC neoadjuvant treatment decisions. However, the study still has the following limitations: Firstly, the sample size is small and is a retrospective design, which may affect the statistical effectiveness. Secondly, the functional verification of GC-TLS (such as spatial transcriptome or TCR clonality analysis) has not yet been deepened, and its regulatory mechanism needs further analysis. Thirdly, the causal relationship between treatment cycle and TLS dynamics needs to be verified by prospective studies.
Data availability statement
The raw data supporting the conclusions of this article will be made available by the authors, without undue reservation.
Ethics statement
The studies involving humans were approved by the Ethical Committee of West China Hospital. The studies were conducted in accordance with the local legislation and institutional requirements. The ethics committee/institutional review board waived the requirement of written informed consent for participation from the participants or the participants’ legal guardians/next of kin because patients could not be contacted.
Author contributions
LJ: Conceptualization, Writing – review & editing. SL: Data curation, Visualization, Writing – original draft. PZ: Investigation, Writing – review & editing. YH: Project administration, Writing – review & editing. MC: Investigation, Writing – review & editing. CY: Resources, Writing – original draft.
Funding
The author(s) declare financial support was received for the research and/or publication of this article. This work was supported by Sichuan University 1.3.5 Project for Disciplines of Excellence-Clinical Research Incubation (No.2019HXFH002).
Conflict of interest
The authors declare that the research was conducted in the absence of any commercial or financial relationships that could be construed as a potential conflict of interest.
Correction note
A correction has been made to this article. Details can be found at: 10.3389/fimmu.2025.1721980.
Generative AI statement
The author(s) declare that no Generative AI was used in the creation of this manuscript.
Any alternative text (alt text) provided alongside figures in this article has been generated by Frontiers with the support of artificial intelligence and reasonable efforts have been made to ensure accuracy, including review by the authors wherever possible. If you identify any issues, please contact us.
Publisher’s note
All claims expressed in this article are solely those of the authors and do not necessarily represent those of their affiliated organizations, or those of the publisher, the editors and the reviewers. Any product that may be evaluated in this article, or claim that may be made by its manufacturer, is not guaranteed or endorsed by the publisher.
Supplementary material
The Supplementary Material for this article can be found online at: https://www.frontiersin.org/articles/10.3389/fimmu.2025.1579840/full#supplementary-material
References
1. Chen Z, Fillmore CM, Hammerman PS, Kim CF, and Wong KK. Non-small-cell lung cancers: a heterogeneous set of diseases. Nat Rev Cancer. (2014) 14:535–46. doi: 10.1038/nrc3775
2. Piperdi B, Merla A, and Perez-Soler R. Targeting angiogenesis in squamous non-small cell lung cancer. Drugs. (2014) 74:403–13. doi: 10.1007/s40265-014-0182-z
3. Gadgeel SM. Role of chemotherapy and targeted therapy in early-stage non-small cell lung cancer. Am Soc Clin Oncol Educ Book. (2017) 37:630–9. doi: 10.1200/EDBK_175188
4. Jia XH, Xu H, Geng LY, Jiao M, Wang WJ, Jiang LL, et al. Efficacy and safety of neoadjuvant immunotherapy in resectable nonsmall cell lung cancer: A meta-analysis. Lung Cancer. (2020) 147:143–53. doi: 10.1016/j.lungcan.2020.07.001
5. Heymach JV, Harpole D, Mitsudomi T, Taube JM, Galffy G, Hochmair M, et al. Perioperative durvalumab for resectable non-small-cell lung cancer. N Engl J Med. (2023) 389:1672–84. doi: 10.1056/NEJMoa2304875
6. Casarrubios M, Provencio M, Nadal E, Insa A, Del Rosario García-Campelo M, Lázaro-Quintela M, et al. Tumor microenvironment gene expression profiles associated to complete pathological response and disease progression in resectable NSCLC patients treated with neoadjuvant chemoimmunotherapy. J Immunother Cancer. (2022) 10. doi: 10.1136/jitc-2022-005320
7. Xu L, Zou C, Zhang S, Chu TSM, Zhang Y, Chen W, et al. Reshaping the systemic tumor immune environment (STIE) and tumor immune microenvironment (TIME) to enhance immunotherapy efficacy in solid tumors. J Hematol Oncol. (2022) 15:87. doi: 10.1186/s13045-022-01307-2
8. Hsieh WC, Budiarto BR, Wang YF, Lin CY, Gwo MC, So DK, et al. Spatial multi-omics analyses of the tumor immune microenvironment. J BioMed Sci. (2022) 29:96. doi: 10.1186/s12929-022-00879-y
9. Sautès-Fridman C, Petitprez F, Calderaro J, and Fridman WH. Tertiary lymphoid structures in the era of cancer immunotherapy. Nat Rev Cancer. (2019) 19:307–25. doi: 10.1038/s41568-019-0144-6
10. Posch F, Silina K, Leibl S, Mündlein A, Moch H, Siebenhüner A, et al. Maturation of tertiary lymphoid structures and recurrence of stage II and III colorectal cancer. Oncoimmunology. (2018) 7:e1378844. doi: 10.1080/2162402X.2017.1378844
11. Siliņa K, Soltermann A, Attar FM, Casanova R, Uckeley ZM, Thut H, et al. Germinal centers determine the prognostic relevance of tertiary lymphoid structures and are impaired by corticosteroids in lung squamous cell carcinoma. Cancer Res. (2018) 78:1308–20. doi: 10.1158/0008-5472.CAN-17-1987
12. Schumacher TN and Thommen DS. Tertiary lymphoid structures in cancer. Science. (2022) 375. doi: 10.1126/science.abf9419
13. Lauss M, Donia M, Svane IM, and Jönsson G. B cells and tertiary lymphoid structures: friends or foes in cancer immunotherapy? Clin Cancer Res. (2022) 28(9):1751–8. doi: 10.1158/1078-0432.CCR-21-1130
14. Calderaro J, Petitprez F, Becht E, Laurent A, Hirsch TZ, Rousseau B, et al. Intra-tumoral tertiary lymphoid structures are associated with a low risk of early recurrence of hepatocellular carcinoma. J Hepatol. (2019) 70:58–65. doi: 10.1016/j.jhep.2018.09.003
15. Sofopoulos M, Fortis SP, Vaxevanis CK, Sotiriadou NN, Arnogiannaki N, Ardavanis A, et al. The prognostic significance of peritumoral tertiary lymphoid structures in breast cancer. Cancer Immunol Immunother. (2019) 68:1733–45. doi: 10.1007/s00262-019-02407-8
16. Ding GY, Ma JQ, Yun JP, Chen X, Ling Y, Zhang S, et al. Distribution and density of tertiary lymphoid structures predict clinical outcome in intrahepatic cholangiocarcinoma. J Hepatol. (2022) 76:608–18. doi: 10.1016/j.jhep.2021.10.030
17. Jia W, Zhang T, Yao Q, Li J, Nie Y, Lei X, et al. Tertiary lymphatic structures in primary hepatic carcinoma: controversy cannot overshadow hope. Front Immunol. (2022) 13:870458. doi: 10.3389/fimmu.2022.870458
18. Wang Q, Shen X, An R, Bai J, Dong J, Cai H, et al. Peritumoral tertiary lymphoid structure and tumor stroma percentage predict the prognosis of patients with non-metastatic colorectal cancer. Front Immunol. (2022) 13:962056. doi: 10.3389/fimmu.2022.962056
19. Hayashi Y, Makino T, Sato E, Ohshima K, Nogi Y, Kanemura T, et al. Density and maturity of peritumoral tertiary lymphoid structures in oesophageal squamous cell carcinoma predicts patient survival and response to immune checkpoint inhibitors. Br J Cancer. (2023) 128:2175–85. doi: 10.1038/s41416-023-02235-9
20. Vanhersecke L, Brunet M, Guégan JP, Rey C, Bougouin A, Cousin S, et al. Mature tertiary lymphoid structures predict immune checkpoint inhibitor efficacy in solid tumors independently of PD-L1 expression. Nat Cancer. (2021) 2:794–802. doi: 10.1038/s43018-021-00232-6
21. Helmink BA, Reddy SM, Gao J, Zhang S, Basar R, Thakur R, et al. B cells and tertiary lymphoid structures promote immunotherapy response. Nature. (2020) 577:549–55. doi: 10.1038/s41586-019-1922-8
22. Zhang L, Zhang R, Jin D, Zhang T, Shahatiaili A, Zang J, et al. Synergistic induction of tertiary lymphoid structures by chemoimmunotherapy in bladder cancer. Br J Cancer. (2024) 130(7):1221–31. doi: 10.1038/s41416-024-02598-7
23. Chen L and Fu B. T cell exhaustion assessment algorism in tumor microenvironment predicted clinical outcomes and immunotherapy effects in glioma. Front Genet. (2022) 13:1087434. doi: 10.3389/fgene.2022.1087434
24. Pol J, Vacchelli E, Aranda F, Castoldi F, Eggermont A, Cremer I, et al. Trial Watch: Immunogenic cell death inducers for anticancer chemotherapy. Oncoimmunology. (2015) 4:e1008866. doi: 10.1080/2162402X.2015.1008866
25. Pfirschke C, Engblom C, Rickelt S, Cortez-Retamozo V, Garris C, Pucci F, et al. Immunogenic chemotherapy sensitizes tumors to checkpoint blockade therapy. Immunity. (2016) 44:343–54. doi: 10.1016/j.immuni.2015.11.024
26. Laumont CM and Nelson BH. B cells in the tumor microenvironment: Multi-faceted organizers, regulators, and effectors of anti-tumor immunity. Cancer Cell. (2023) 41:466–89. doi: 10.1016/j.ccell.2023.02.017
27. Downs-Canner SM, Meier J, Vincent BG, and Serody JS. B cell function in the tumor microenvironment. Annu Rev Immunol. (2022) 40:169–93. doi: 10.1146/annurev-immunol-101220-015603
28. Ding R, Prasanna P, Corredor G, Barrera C, Zens P, Lu C, et al. Image analysis reveals molecularly distinct patterns of TILs in NSCLC associated with treatment outcome. NPJ Precis Oncol. (2022) 6:33. doi: 10.1038/s41698-022-00277-5
29. Cabrita R, Lauss M, Sanna A, Donia M, Skaarup Larsen M, Mitra S, et al. Tertiary lymphoid structures improve immunotherapy and survival in melanoma. Nature. (2020) 577:561–5. doi: 10.1038/s41586-019-1914-8
30. Petitprez F, de Reyniès A, Keung EZ, Chen TW, Sun CM, Calderaro J, et al. B cells are associated with survival and immunotherapy response in sarcoma. Nature. (2020) 577:556–60. doi: 10.1038/s41586-019-1906-8
31. Xu F, Zhu H, Xiong D, Wang K, Dong Y, Li L, et al. Tertiary lymphoid structures combined with biomarkers of inflammation are associated with the efficacy of neoadjuvant immunochemotherapy in resectable non-small cell lung cancer: A retrospective study. Thorac Cancer. (2023) 15(2):172–81. doi: 10.1111/1759-7714.15175
32. Maldonado L, Teague JE, Morrow MP, Jotova I, Wu TC, Wang C, et al. Intramuscular therapeutic vaccination targeting HPV16 induces T cell responses that localize in mucosal lesions. Sci Transl Med. (2014) 6:221ra213. doi: 10.1126/scitranslmed.3007323
33. Morcrette G, Hirsch TZ, Badour E, Pilet J, Caruso S, Calderaro J, et al. APC germline hepatoblastomas demonstrate cisplatin-induced intratumor tertiary lymphoid structures. Oncoimmunology. (2019) 8:e1583547. doi: 10.1080/2162402X.2019.1583547
34. Deng H, Liang H, Chen J, Wang W, Li J, Xiong S, et al. Preoperative immunochemotherapy for locally advanced non-small cell lung cancer: an analysis of the clinical outcomes, optimal number of cycles, and peripheral immune markers. Transl Lung Cancer Res. (2022) 11:2364–81. doi: 10.21037/tlcr-22-439
35. Park YH, Lal S, Lee JE, Choi YL, Wen J, Ram S, et al. Chemotherapy induces dynamic immune responses in breast cancers that impact treatment outcome. Nat Commun. (2020) 11:6175. doi: 10.1038/s41467-020-19933-0
36. Cai W, Jing M, Gu Y, Bei T, Zhao X, Chen S, et al. Tumor microenvironment features decipher the outperformance of neoadjuvant immunochemotherapy over chemotherapy in resectable non-small cell lung cancer. Front Immunol. (2022) 13. doi: 10.3389/fimmu.2022.984666
37. Sun X, Liu W, Sun L, Mo H, Feng Y, Wu X, et al. Maturation and abundance of tertiary lymphoid structures are associated with the efficacy of neoadjuvant chemoimmunotherapy in resectable non-small cell lung cancer. J ImmunoTherapy Cancer. (2022) 10. doi: 10.1136/jitc-2022-005531
38. Sato Y, Silina K, van den Broek M, Hirahara K, and Yanagita M. The roles of tertiary lymphoid structures in chronic diseases. Nat Rev Nephrol. (2023) 19:525–537. doi: 10.1038/s41581-023-00706-z
Keywords: neoadjuvant chemoimmunotherapy, lung squamous cell carcinoma, prognostic biomarkers, tertiary lymphoid structures (TLSs), neoadjuvant chemotherapy
Citation: Li S, Zhou P, Huang Y, Chen M, Yang C and Jiang L (2025) The germinal center-tertiary lymphoid structure after neoadjuvant chemo-immunotherapy for locally advanced lung squamous cell carcinoma can predict the disease progression. Front. Immunol. 16:1579840. doi: 10.3389/fimmu.2025.1579840
Received: 19 February 2025; Accepted: 21 August 2025;
Published: 12 September 2025; Corrected: 17 October 2025.
Edited by:
Zodwa Dlamini, Pan African Cancer Research Institute (PACRI), South AfricaReviewed by:
Ichwaku Rastogi, University of Wisconsin-Madison, United StatesHansheng Wu, First Affiliated Hospital of Shantou University Medical College, China
Copyright © 2025 Li, Zhou, Huang, Chen, Yang and Jiang. This is an open-access article distributed under the terms of the Creative Commons Attribution License (CC BY). The use, distribution or reproduction in other forums is permitted, provided the original author(s) and the copyright owner(s) are credited and that the original publication in this journal is cited, in accordance with accepted academic practice. No use, distribution or reproduction is permitted which does not comply with these terms.
*Correspondence: Lili Jiang, ODc5ODc2MDQ3QHFxLmNvbQ==