 Nan Zhang
 Shishun Zhao2
 Runze Wu
 Xizi Luo
 Zecheng Chang
 Jianting Xu
- 1Cancer Center, First Hospital of Jilin University, Changchun, China
- 2College of Mathematics, Jilin University, Changchun, China
- 3College of Basic Medical Science, Jilin University, Changchun, China
Introduction: Integrating immune repertoire sequencing data with single cell sequencing data offers profound insights into the diversity of immune cells and their dynamic changes across various disease states.
Methods: Here, we propose a novel KDDC framework that integrates kmers, dataset selection, dimensionality reduction and classification algorithms to facilitate the heterogeneous classification of immune cells.
Results and Discussion: By comparing various kmer length combinations across seven different classification algorithms, we found that B cell receptor-based cellsubset classification outperforms T cell receptor-based classification, achievingan average AUC of over 96%. This finding offers a new perspective on the classification of immune cells. We also observed that 11 distinct cell subpopulations exhibited differences in cell proportions, inflammatory factorexpression, cell communication, and metabolic pathways, with notable activity in metabolic pathways. These variations may reflect the adaptive changes of cellsubpopulations in response to different disease states. This study aims to uncoverthe potential biological significance of immune prediction, target antigens, andeffective evaluation by analyzing the immune characteristics of specific cellsubsets at the cellular level. These findings will not only enhance ourunderstanding of immune system functions but also offer new directions for the development and optimization of immunotherapy.
1 Introduction
After pathogens invade the human body, the immune system serves a crucial protective role, primarily through the immune response mediated by numerous lymphocyte receptors, including T cell receptors (TCRs) and B cell receptors (BCRs). Consequently, inferring the specific binding of immune cell receptors to antigens has emerged as a prominent research focus. The total count of unique TCR and BCR reflects the immune system’s capacity to respond to pathogen invasion (1, 2). Analyzing and annotating immune repertoire data can offer valuable insights for immune prediction, target antigens, and effective evaluation (3).
Each TCR and BCR is a dimer composed of two distinct chains. TCR are encoded by the cell’s neutralizing chain (4), while BCR consist of a heavy chain (IGH) and a light chain, with the light chain derived from either the κ (IGK) or λ (IGL) locus (5). Each antigen-specific receptor comprises variable (V), diversity (D), joining (J), and constant (C) gene segments (6). The combination of these gene segments determines the specificity and diversity of lymphocytes. TCR and BCR features three complementarity-determining regions (CDRs): CDR1, CDR2, and CDR3, with CDR3 being the most variable component of the antigen-binding site (7). The diversity and uniqueness of TCR and BCR enable their use as distinct molecular barcodes for T cells and B cells, facilitating the inference of antigen-specific response functions and elucidating the differences in the association between cell types and disease phenotypes. Moreover, the rapid advancement and application of single-cell sequencing technologies allow researchers to investigate the changes and mechanisms that occur in cells in response to pathogen invasion at the cellular level (8). Consequently, integrating single-cell sequencing with immune repertoire sequencing can provide a more comprehensive view of the transcriptional characteristics and immune behaviors of cells, aiding in the discovery of antibody variations among individuals and the changes in immune cells under disease conditions.
The research and application of immune repertoire data primarily encompass two areas. The first involves exploring VDJ gene rearrangement. For instance, Ren et al. utilized large-scale single-cell transcriptome maps to reveal the immune characteristics of COVID-19, employing BCR data to classify patients’ infection statuses based on a random forest classifier that analyzes VDJ gene usage frequency (9). Similarly, Zhao et al. proposed a learning-based machine learning model, VDJMiner, to automatically mine VDJ gene fragments from TCR data to predict COVID-19 prognosis (10). The second area focuses on structural similarity in research. For example, Shoukat et al. employed kmer-based principal component analysis and clustering algorithms to classify samples from COVID-19 patients using TCR sequencing data (11). Park et al. also utilized machine learning methods to identify TCR characteristics in COVID-19 patients (12). However, these studies predominantly analyze single BCR or TCR data and do not integrate BCR with TCR data to investigate the changes in patients across different infection states, nor do they examine the binding behaviors and mechanisms between cell types in single-cell sequencing.
In this study, we proposed a KDDC framework that achieves heterogeneous classification of immune cells through kmer cutting, dataset screening, dimensionality reduction, and the selection of various classification algorithms. We integrated single-cell sequencing data with immune repertoire data to identify the characteristics of patients’ immune repertoires through specific immune cell subsets. This approach enabled us to explore the binding behaviors and mechanisms of these cells. Our model also compared seven classification algorithms: Logistic Regression(LR), Support Vector Machine(SVM), Multi-layer Perceptron(MLP), K-Nearest Neighbors(KNN), Decision Tree(DC), Random Forest(RF) and eXtreme Gradient Boosting(XGBoost), to classify and evaluate infection status based on specific immune cell subsets. This study aims to uncover the potential biological significance for immune prediction, target antigens, and effective evaluation by analyzing the immune characteristics of specific cell subsets at the cellular level.
2 Materials and methods
2.1 Data collection and preprocessing
The data for this study come from two parts: the immune repertoire data is obtained through the GSE158055 dataset in the GEO database. The single-cell sequencing data is sourced from the website http://covid19.cancer-pku.cn/#/dimensional-reduction, which provides a complete h5 file containing B cell, CD4T cell and CD8T cell related data. Following data collection, the two datasets were matched, and we specially screened for B cells (BCRH_cdr3aa) and T cells (TCRA_cdr3aa) that include the cdr3 amino acid sequences for further analysis.
2.2 Cell clustering and cell annotation
We used the Scanpy library in Python for single-cell sequencing data analysis (13). The analysis proceed as follows: firstly, we performed K-Nearest Neighbor(KNN) clustering separately on the selected B cells and T cells to identify distinct cell subpopulations. After clustering, we identified the marker genes of each cell subpopulation based on the significant expression level. Using the identified marker genes, we employed manual annotation methods, supported by relevant literature, to classify the cell subpopulations. Finally, we visualized the cell annotation results using UMAP diagrams, which effectively illustrate the distribution and characteristics of the annotated cell subpopulations.
2.3 kmers clipping and dataset screening
The kmers algorithm segments each specific cdr3 amino acid sequence based on selected lengths. In this study, we chose k values of 2, 3 and 4. Based on these lengths, we combined the 20 common amino acid types to generate 400 amino acid concatemers for k=2, 8000 amino acid concatemers for k=3, and 160,000 amino acid concatemers for k=4. Next, we constructed a count matrix for CDR3 amino acid concatemers according to the different states of the same cell type, assembling the dataset based on the various k values. This process resulted in seven datasets containing CDR3 amino acid concatemers. During the construction of the count matrix, any concatemers that did not appear were filled with 0 to ensure accurate counting.
2.4 Choices of dimensionality reduction and classification methods
Given the large number of features in the dataset, we first counted the number of filled 0 values in each column and set a threshold to eliminate features containing outliers.
The threshold filtering mainly considered the expression of feature in the sample, which determined whether to retain the features. Next, we employed analysis of variance (ANOVA) for feature dimensionality reduction, retaining only those features with a significance level lower than 0.05. After dimensionality reduction, we divided each dataset into a training dataset and a test dataset in a 4:1, using seven different classification algorithms to classify and compare each cell type based on structural similarity. The algorithms included: LR, SVM, MLP, KNN, DC, RF and XGB. In the final presentation, we selected the classification algorithm that exhibited the best performance. Furthermore, the grid search algorithm was applied to introduce hyperparameters to filter out the best classification model, with a p-value range of 0.001-0.049. Comparing multiple classification models through changes in p-value to find the best combination and improve the generalization ability. To address the imbalance in data distribution, we utilized the ROC curve and the average AUC value as evaluation indicators for the classification results. The advantage of ROC curve was that it was intensive to data imbalance and effectively demonstrate the classification performance across the entire threshold range. The average macro AUC was calculated independently for each category, avoiding the influence of large categories and not relying on the number of categories (14, 15).
2.5 Connections between cell subpopulations and metabolic pathway score
To explore the connections between cell subpopulations, we measured the interaction between them based on the membrane protein pairs present on the surface of the cells in different states (16). This assessment provided insights into the interactions among cell subpopulations. For calculating the metabolic pathway scores of different cell subpopulations, we accessed the KEGG database (KEGG, https://www.kegg.jp/) and utilized the KEGGREST package in R to screen 84 human-related metabolic pathways (17). We then combined the expression levels of metabolic genes associated with each pathway to compute a score for each pathway in various states. Additionally, we conducted significance testing for each metabolic pathway to highlight the differences among cell subpopulations under different states. The t test method was used for pairwise comparison, while the Kruskal Wallis test method was used for multiple comparison. This approach allowed us to identify key metabolic pathways that may be relevant to the functional characteristics of the cell subpopulations in response to different conditions.
3 Results
3.1 KDDC framework: classification of cell heterogeneity based on amino acid sequence similarity
We propose a novel framework that integrates k-mer cutting, dataset screening, dimensionality reduction and classification algorithms for a joint analysis of immune repertoire data and single-cell sequencing data. This framework achieves heterogeneous classification of immune cells based on the structural similarity of CDR3 amino acid sequences, providing new insights for personalized disease treatment. The framework consists of five main parts: the first part realizes cell clustering and cell annotation through single-cell sequencing data, and then uses the immune repertoire data to extract the cdr3 amino acid sequences of the same cell type under each cell type and construct the corresponding dataset. The second part is to perform kmers processing on the cdr3 amino acid sequences in the dataset to cut out amino acid concatemers of different kmer lengths. The third part is to generate the corresponding count matrix for the amino acid concatemers according to different cutting lengths. The fourth part is to reduce the dimension of the count matrix of the amino acid concatemers using feature selection methods. The fifth part is to classify and compare the count matrix after dimensionality reduction using seven different classification algorithms to achieve heterogeneous classification of immune cell subsets. A schematic diagram of the framework is provided in Figure 1, illustrating the workflow and interconnections among these components.
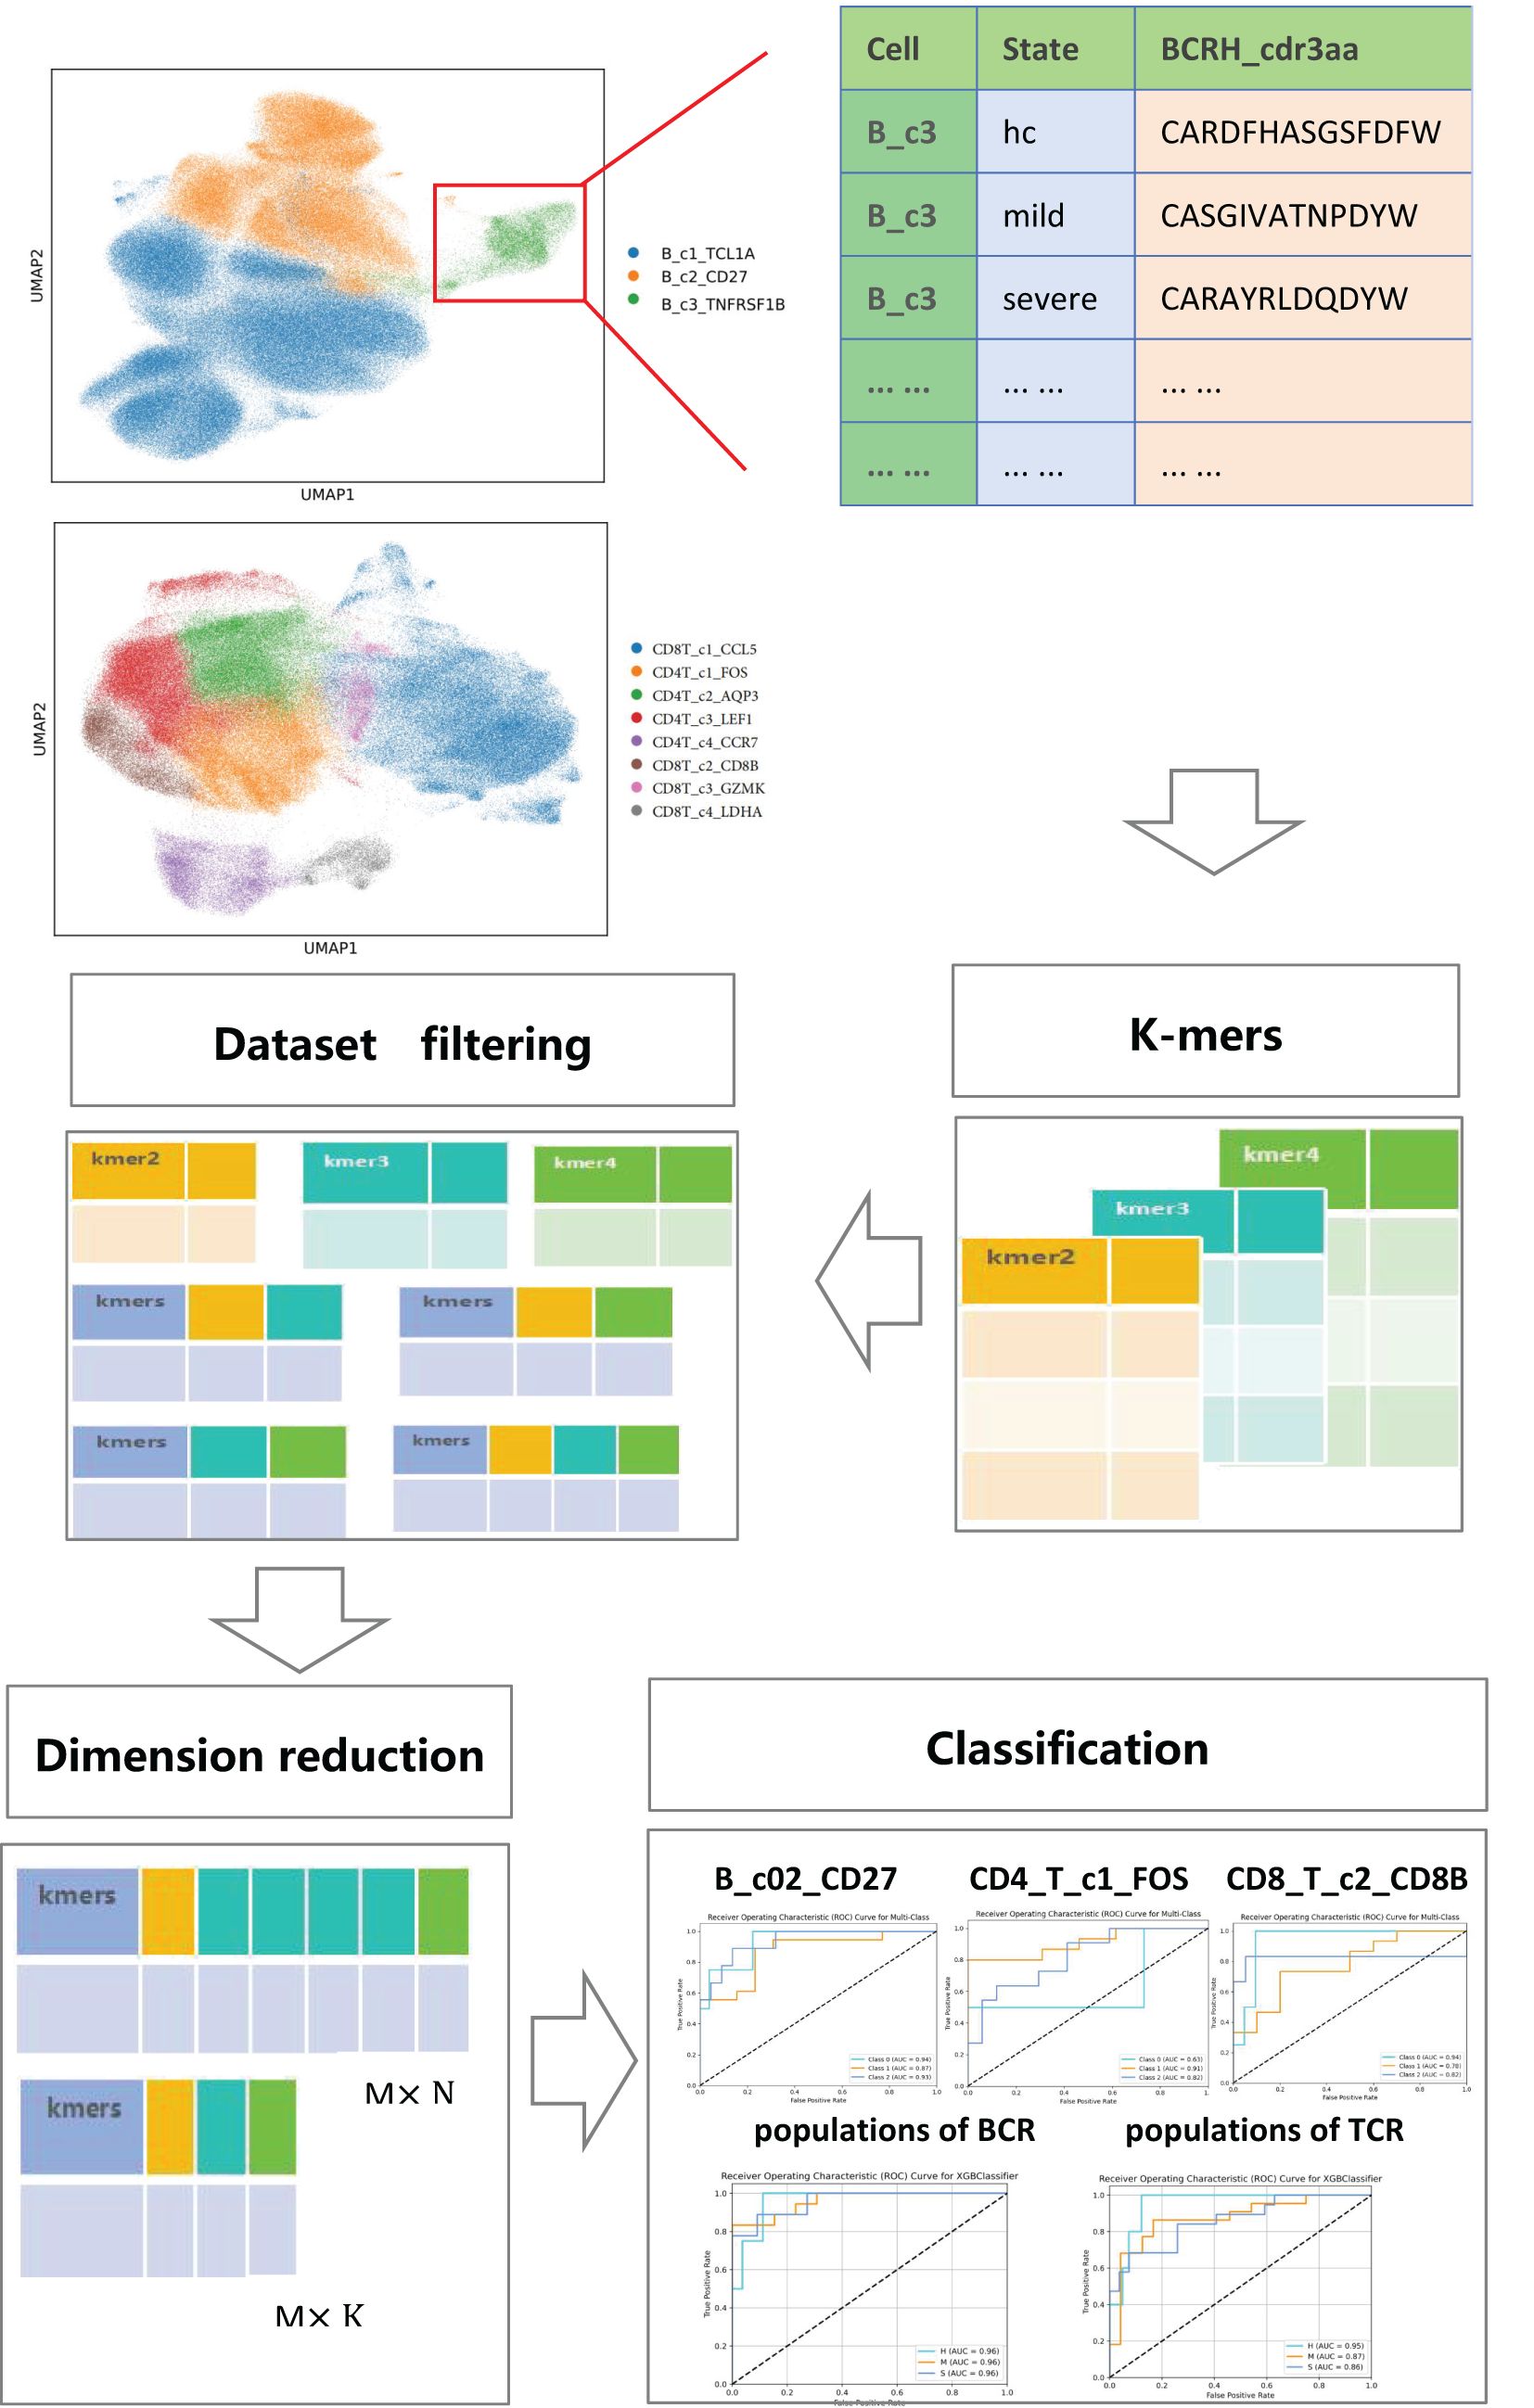
Figure 1. A summary diagram of the KDDC framework.
3.2 Demonstration of immune cell subset distribution in COVID-19 patients based on single-cell sequencing data
We investigated the shared cells between the immune repertoire data and single-cell sequencing data, ultimately identifying 278,298 B cells and 220,968 T cells, as illustrated in Supplementary Figure 1. Using single-cell sequencing data, we generated B cell and T cell profiles of COVID-19 patients, as shown in Figure 2A and Figure 2B. For B cells, we identified three cell subpopulations, with the marker genes of each cell subpopulation displayed in Supplementary Figures 2A–C. We found that the proportion of B_c1_TCL1A cell subpopulation increased significantly after COVID-19 infection, and the proportion of B_c3_TNFRSF1B subpopulation cells decreased significantly, as shown in Figure 2C. For T cells, we identified eight cell subpopulations, and the marker genes for each cell subpopulation are shown in Supplementary Figures 2D–K. We found that the proportion of CD4T_c1_FOS and CD8T_c4_LDHA cell subpopulation increased after COVID-19 infection. The proportion of CD4T_c4_CCR7 and CD8T_c1_CCL5 cell subpopulation shown a notable decrease, as shown in Figure 2D. We examined the inflammatory factors related to immune cells and discovered that the expression of MT-CO2 and MT-ND3 genes was significantly elevated in both B cell and T cell subsets following COVID-19 infection. The B_c3_TNFRSF1B populations shown a significant increase in the expression of NFKB1, NFKB2, ID3, SKIL and TNF genes. Conversely, B_c1_TCL1A, CD4T_c1FOS and CD8T_c3_GZMK subpopulations exhibited overexpression of DUSP1 and JUN genes. This result displayed in Figures 2E, F.
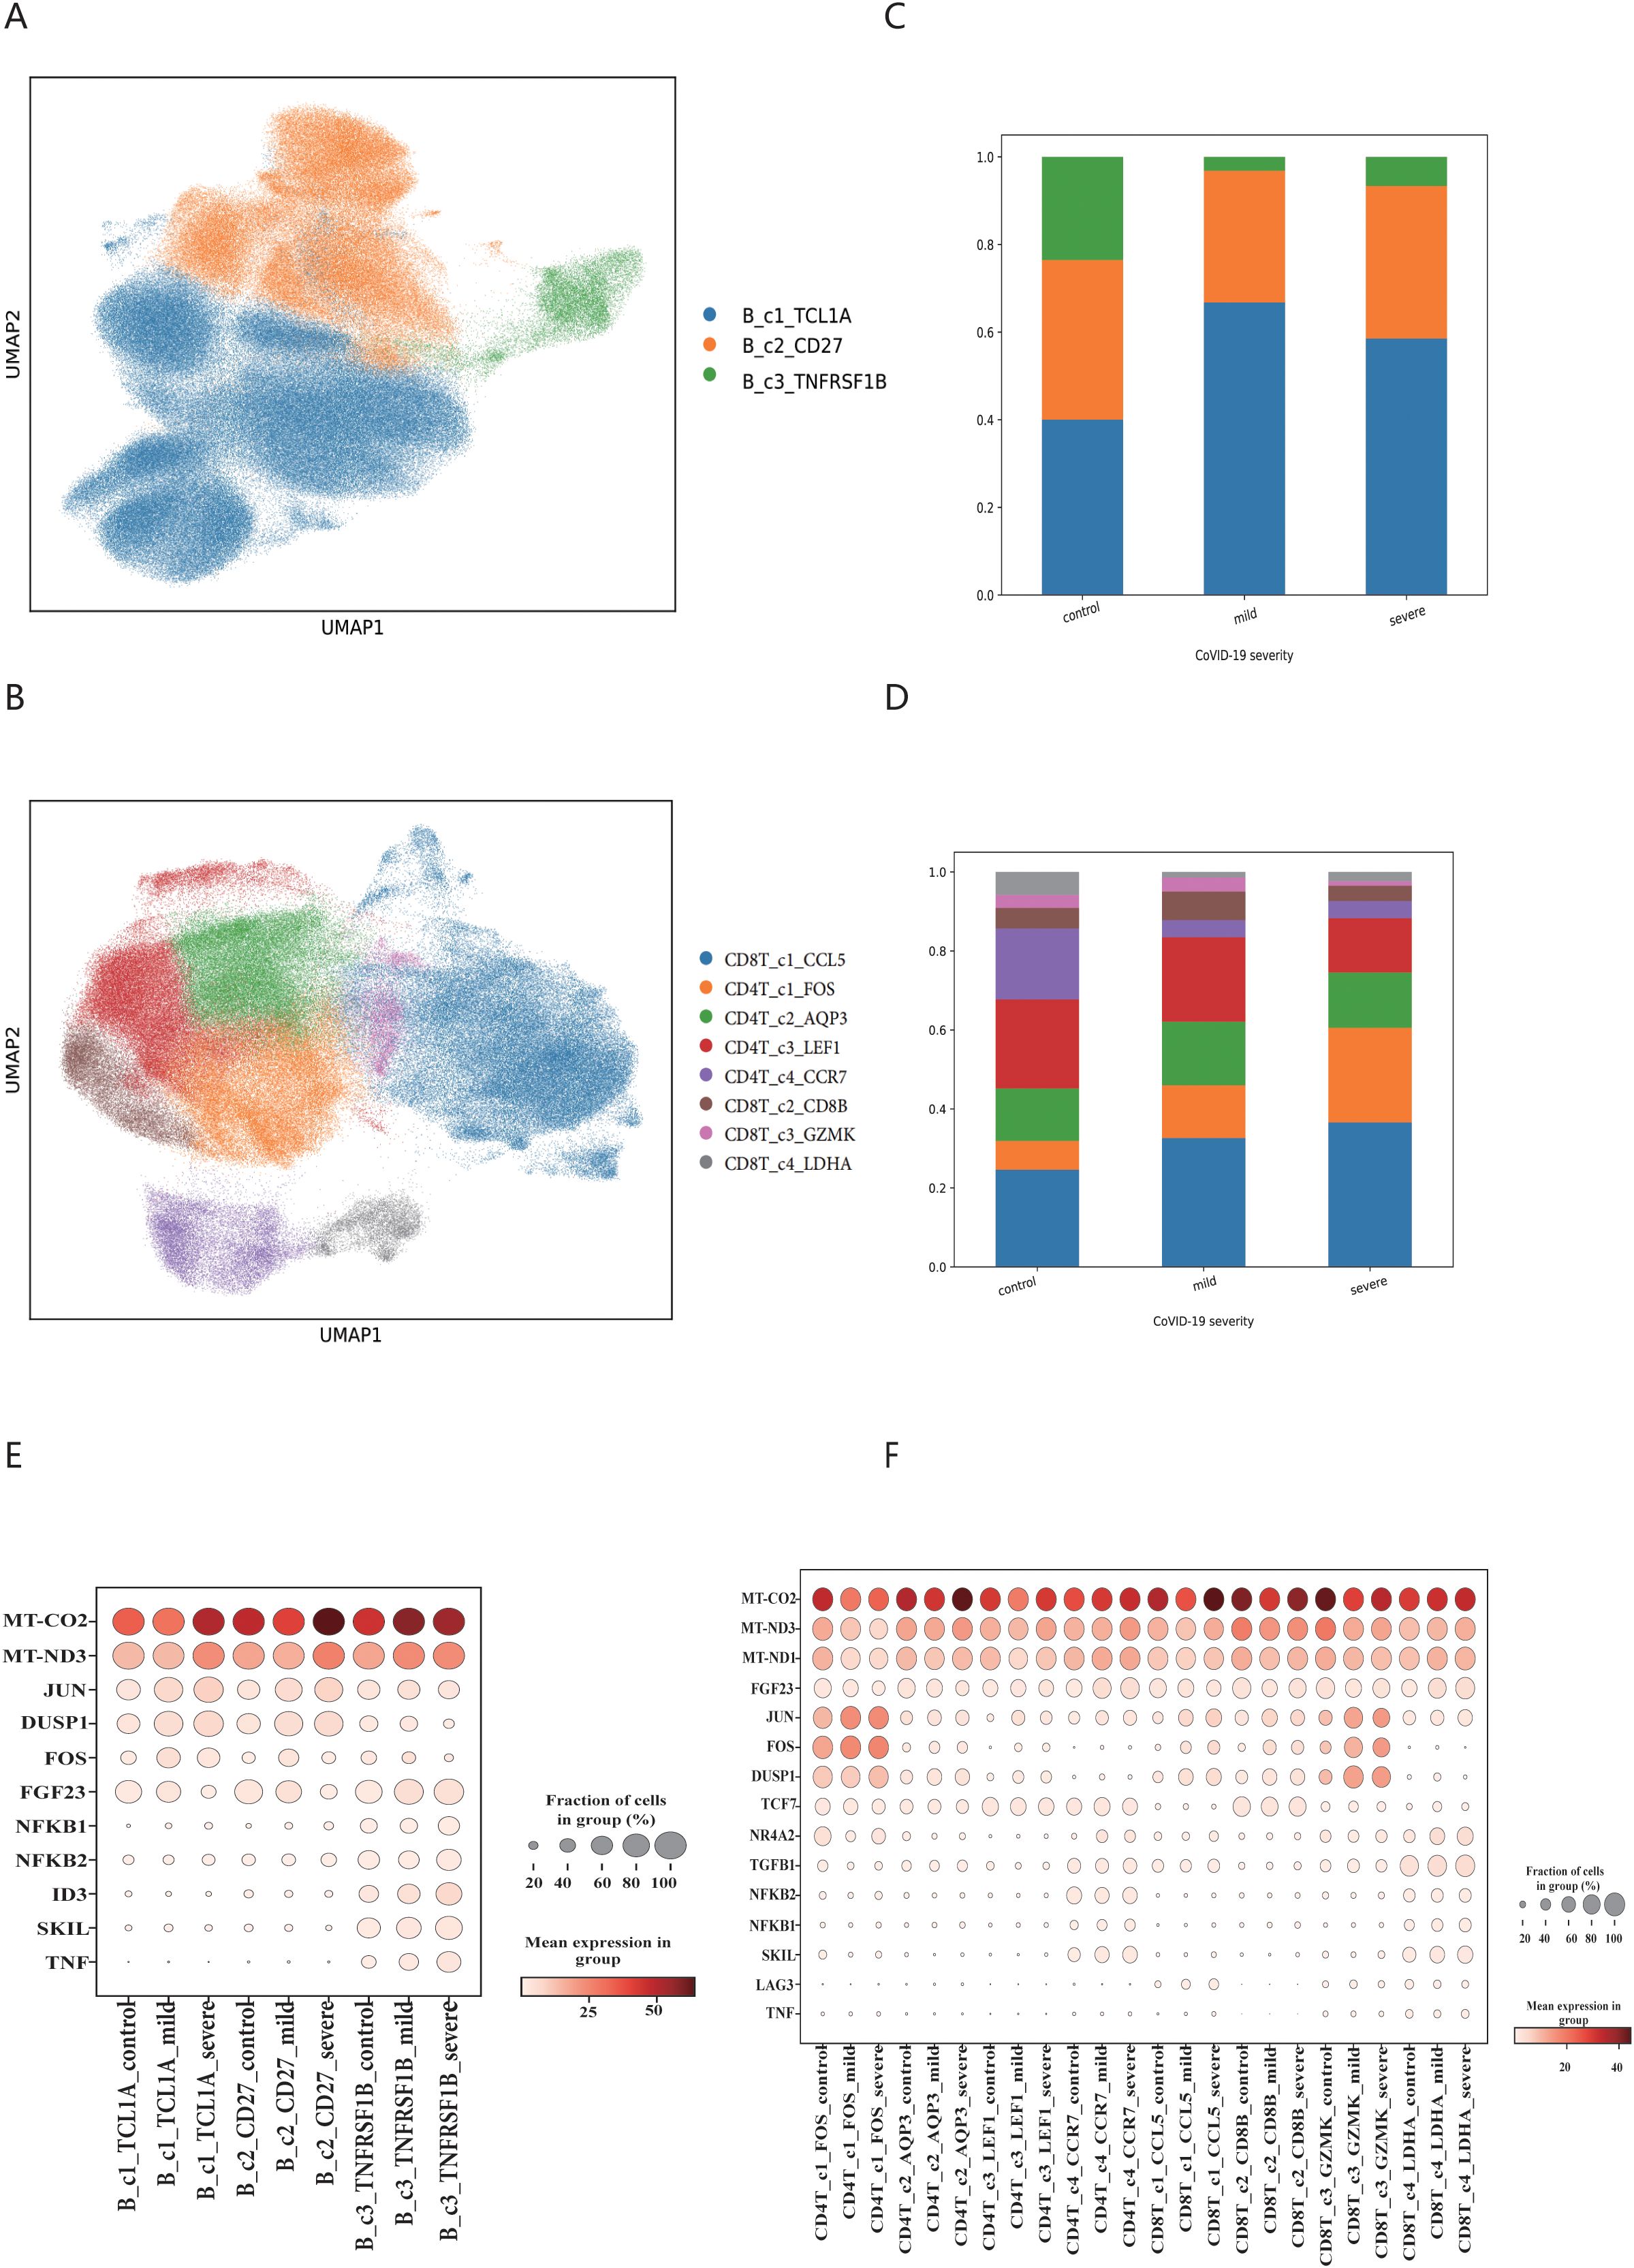
Figure 2. The immune cell populations signatures in COVID-19 patient. (A) Map of B cell subsets in COVID-19 patients based on BCR data. (B) Map of T cell subsets in COVID-19 patients based on TCR data. (C) Changes in the proportion of B cell subsets. (D) Changes in the proportion of T cell subsets. The legend of C and D should be consistent with A and B respectively. (E) Differential expression of inflammatory factors in B cell subsets. (F) Differential expression of inflammatory factors in T cell subsets.
3.3 The KDDC framework identifies heterogeneous classification of cell subsets in B cells
To characterize the structure of cdr3 amino acid sequences among different immune cell subsets, we applied the KDDC framework to achieve heterogeneous classification of immune cells. We constructed a count matrix using cdr3 sequence amino acid concatemers of varying lengths and compared the classification results to reflect the heterogeneity of different immune cell subsets. Using variance analysis, we performed dimensionality reduction on the count matrix and evaluated several classification algorithms for comparison. ultimately, we selected the most suitable classification algorithm for our study. The classification results of each algorithm are shown in Table 1. Our findings indicate that the classification performance for the three B cell subsets was notably strong. Specifically, the average AUC value for the B_c1_TCL1A cell subset using kmer3 reached 96.5%, as shown in Figure 3A. The average AUC value for the B_c2_CD27 cell subset across kmer2, kmer3 and kmer4 reached an impressive 99%, depicted in Figure 3B. Additionally, the average AUC value for the B_c3_TNFRSF1B cell subset with kmer2, kmer3 and kmer4 reached 93.2%, illustrated in Figure 3C. The relevant parameters of the best model can refer to Supplementary Table 1. Afterwards, we conducted an interactive analysis on the three kmers datasets that demonstrated the best classification results. We discovered share amino acid concatemers among the kmers dataset, which reflect the structural similiarities with cdr3 sequences. The structure of DLW and FDL were high importance in B_c1_TCL1A and B_c2_CD27. Meanwhile, the structure of YDY and RGGF were great importance in B_c2_CD27 and B_c3_TNFRSF1B, as displayed in Figure 3D.
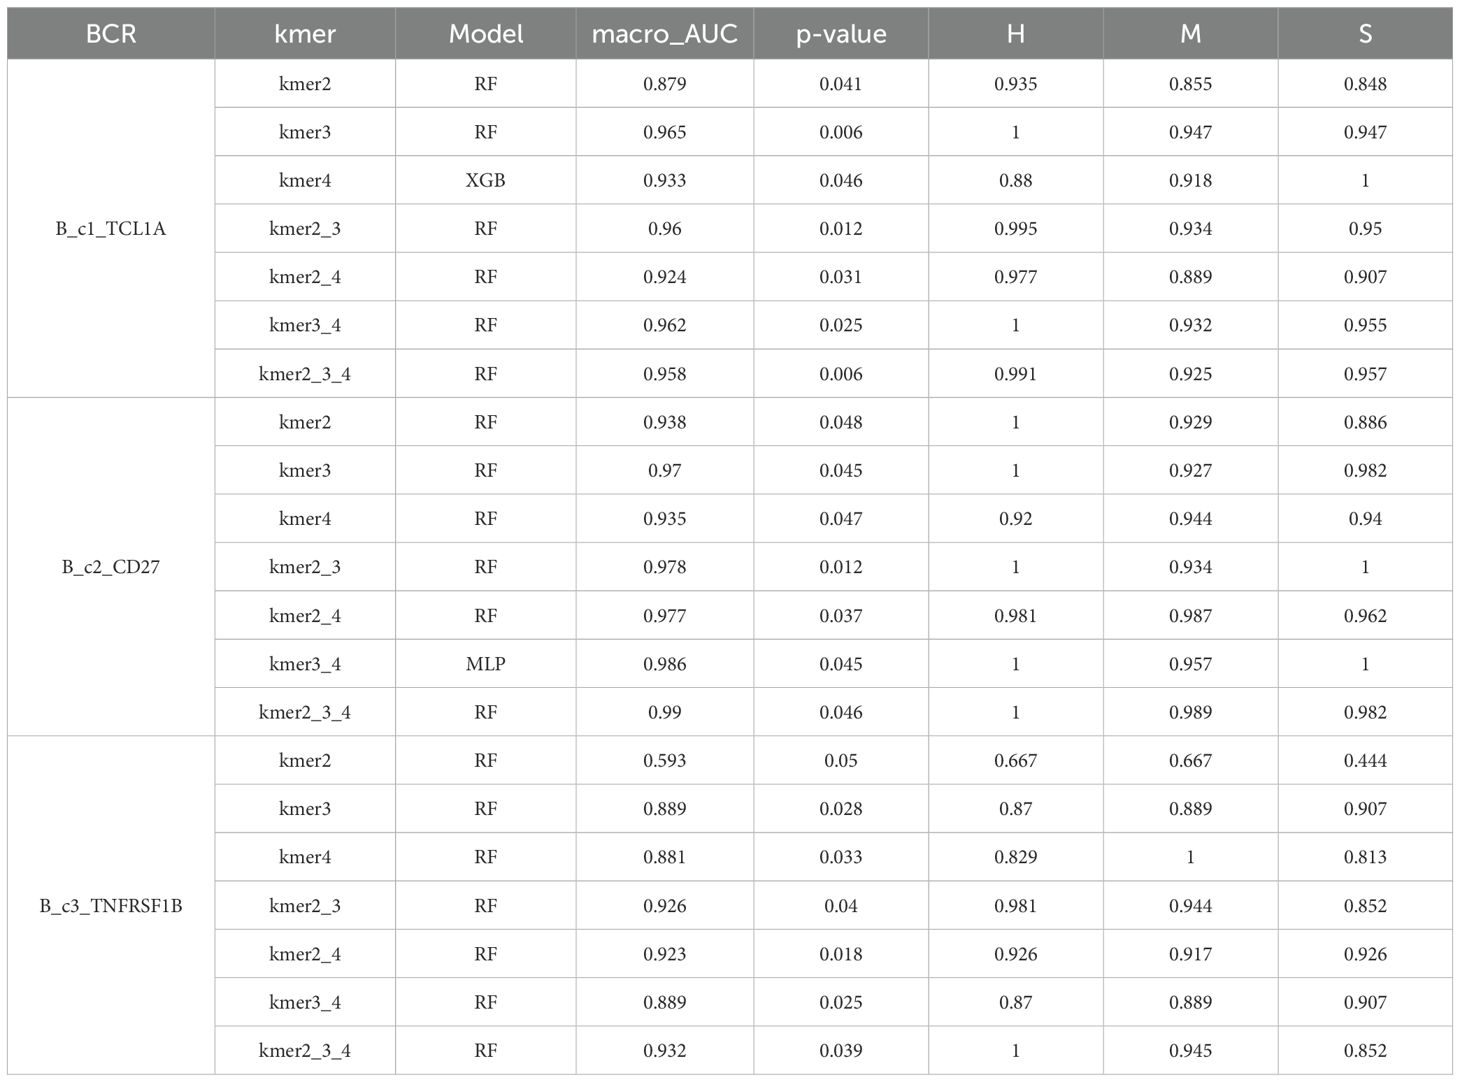
Table 1. B cell subset classification and assessment based on BCR sequencing.
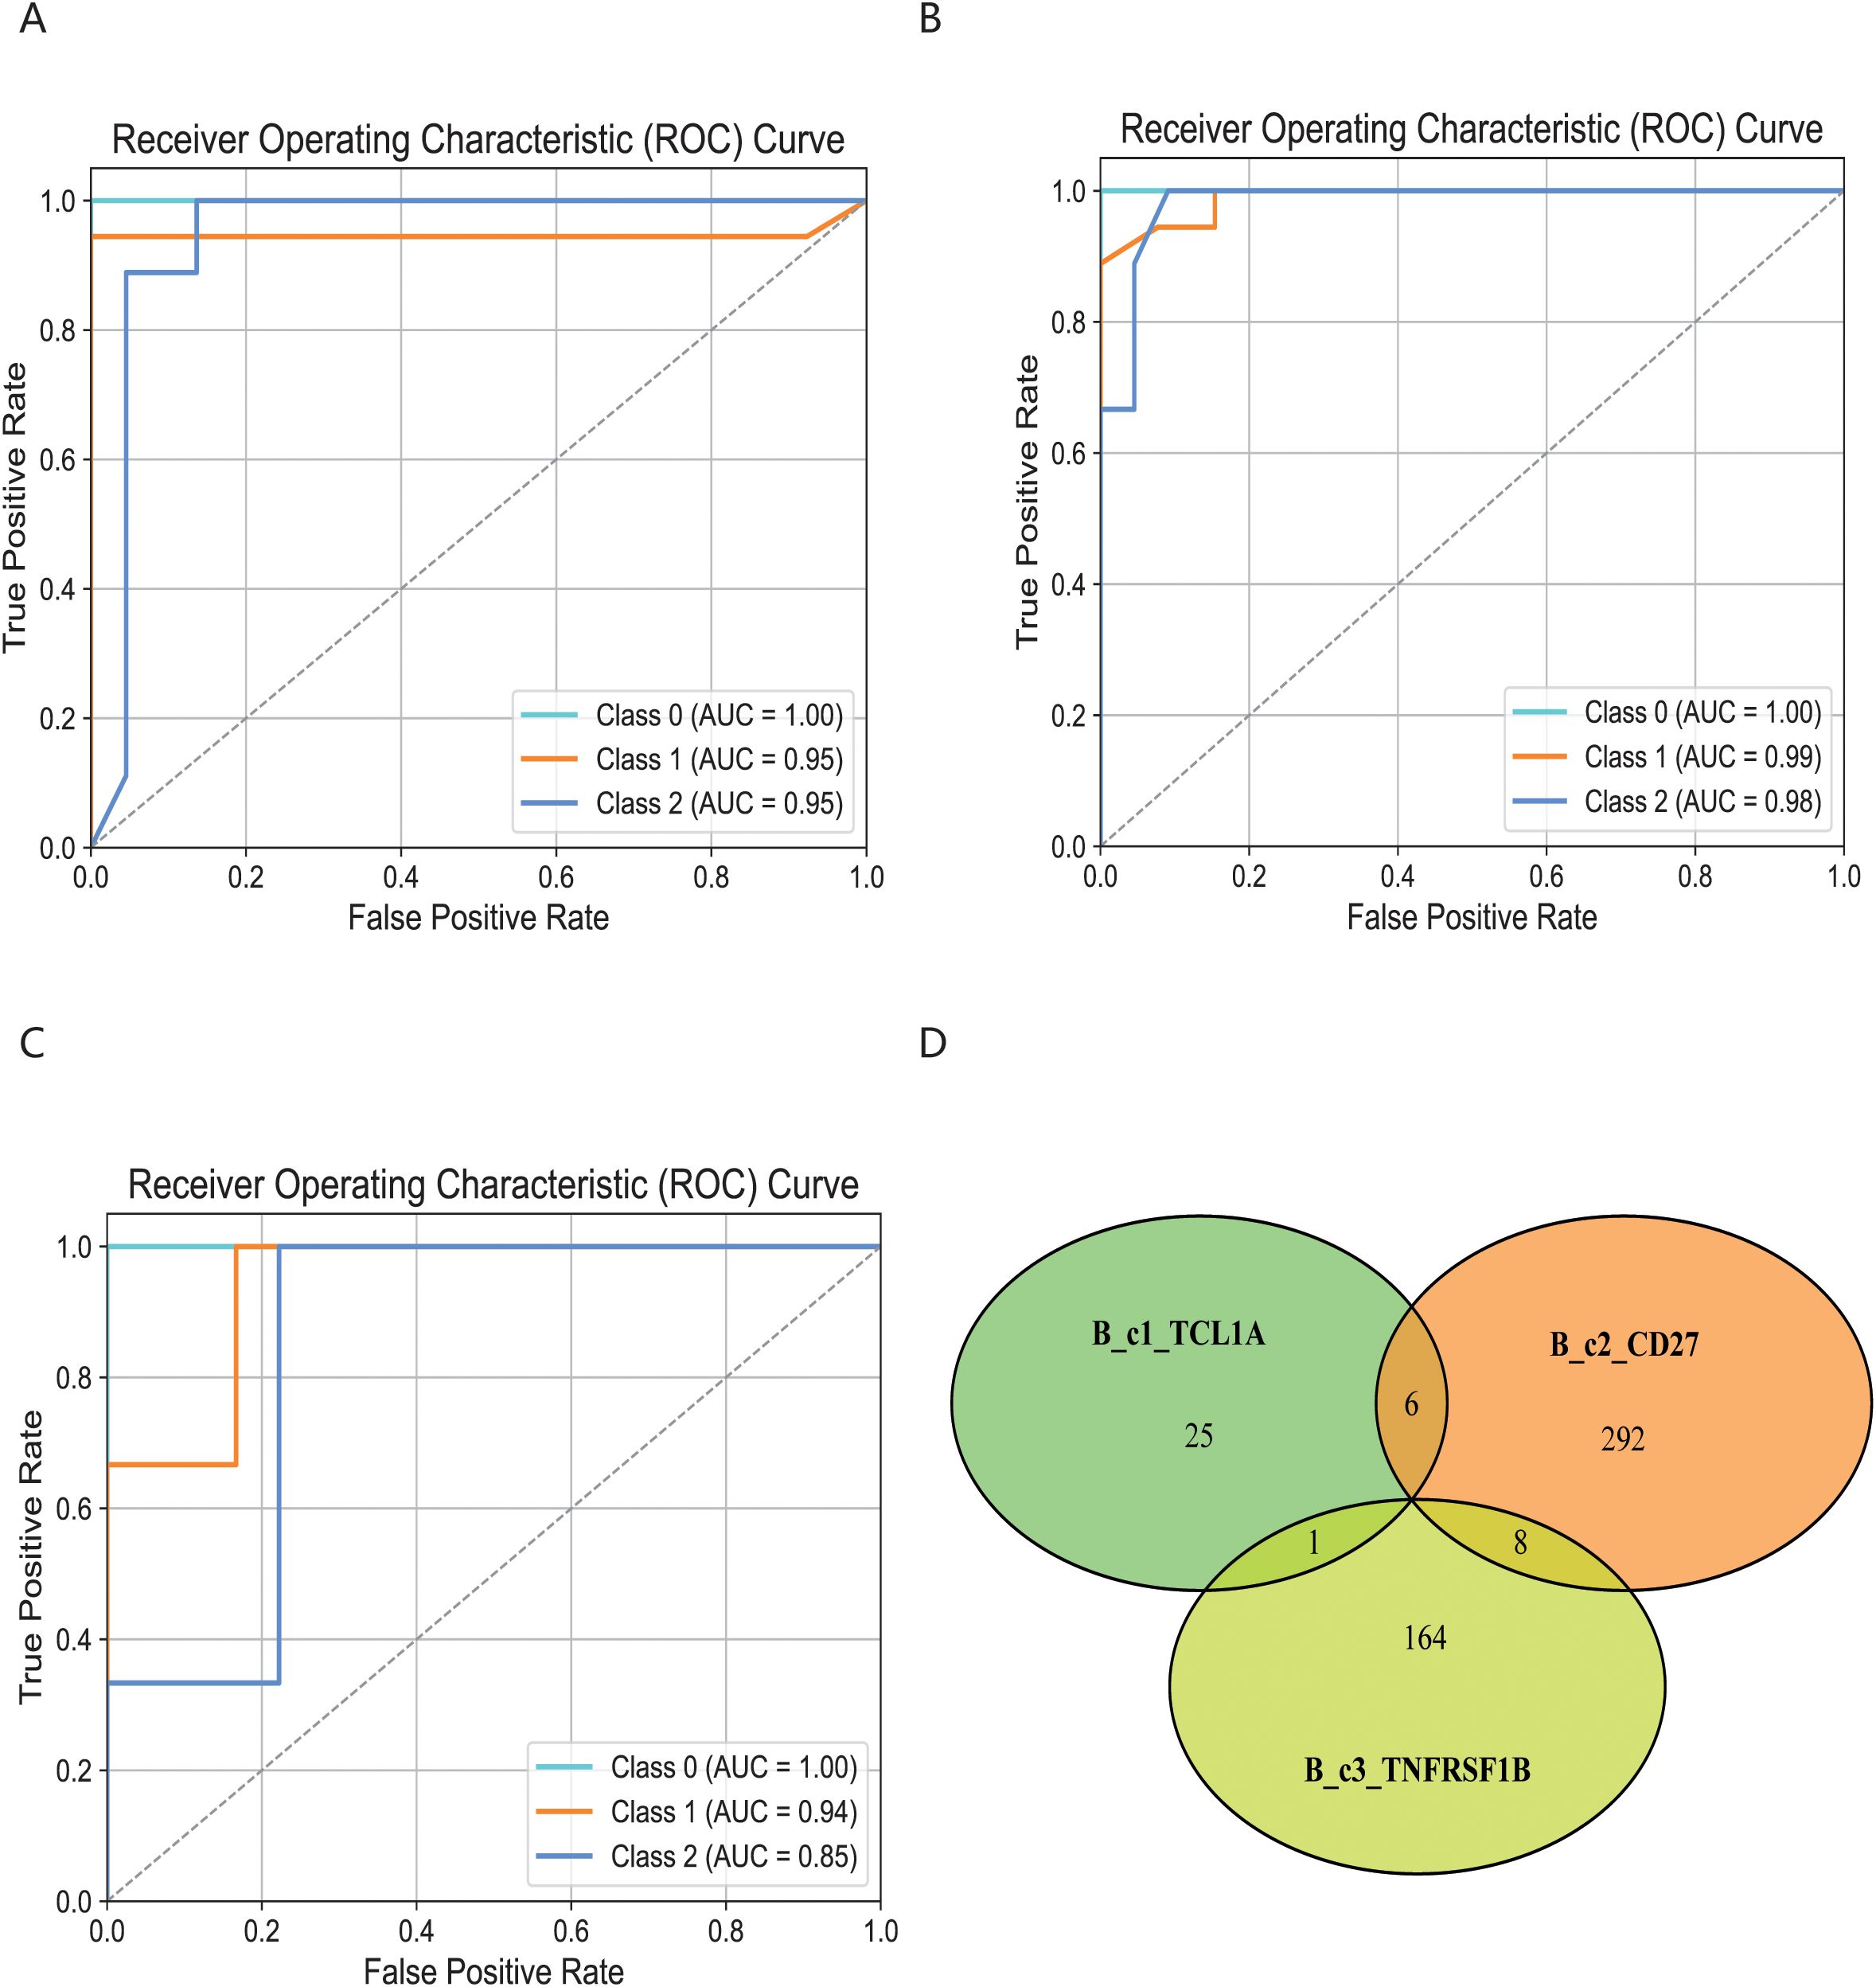
Figure 3. Comparison of specific B cell subsets based on structural similarities. (A) Classification and comparison of B_c1_TCL1A cell subsets based on structural similarity. (B) Classification and comparison of B_c2_CD27 cell subsets based on structural similarity. (C) Classification and comparison of B_c3_TNFRSF1B cell subsets based on structural similarity. The number of class 0, 1 and 2 are normal group, mild and severe infection, respectively. (D) Interactive analysis of structural features for optimal classification of three specific cell subpopulations.
3.4 KDDC framework identifies heterogeneous classification of cell subsets in T cells
The cell subsets within T cells were classified and compared using the KDDC framework, with the results of different classification algorithms summarized in Tables 2 and 3. We discovered that the CD4T_c2_AQP3 subset had a strong classification performance in kmer4, achieving an average AUC value of 93.5%, as illustrated in Figure 4A. The CD4T_c3_LEF1 subset demonstrated effective classification with kmer4, yielding an average AUC value of 92.7%, as shown in Figure 4B. The classification performance for the CD8T_c2_CD8B subset was optimized using kmer2, kmer3 and kmer4, attaining an impressive average AUC value of 99%, represented in Figure 4C. The CD8T_c3_GZMK subset exhibited a better classification performance in kmer2 and kmer3, resulted in an average AUC value of 91.2%, depicted in Figure 4D.
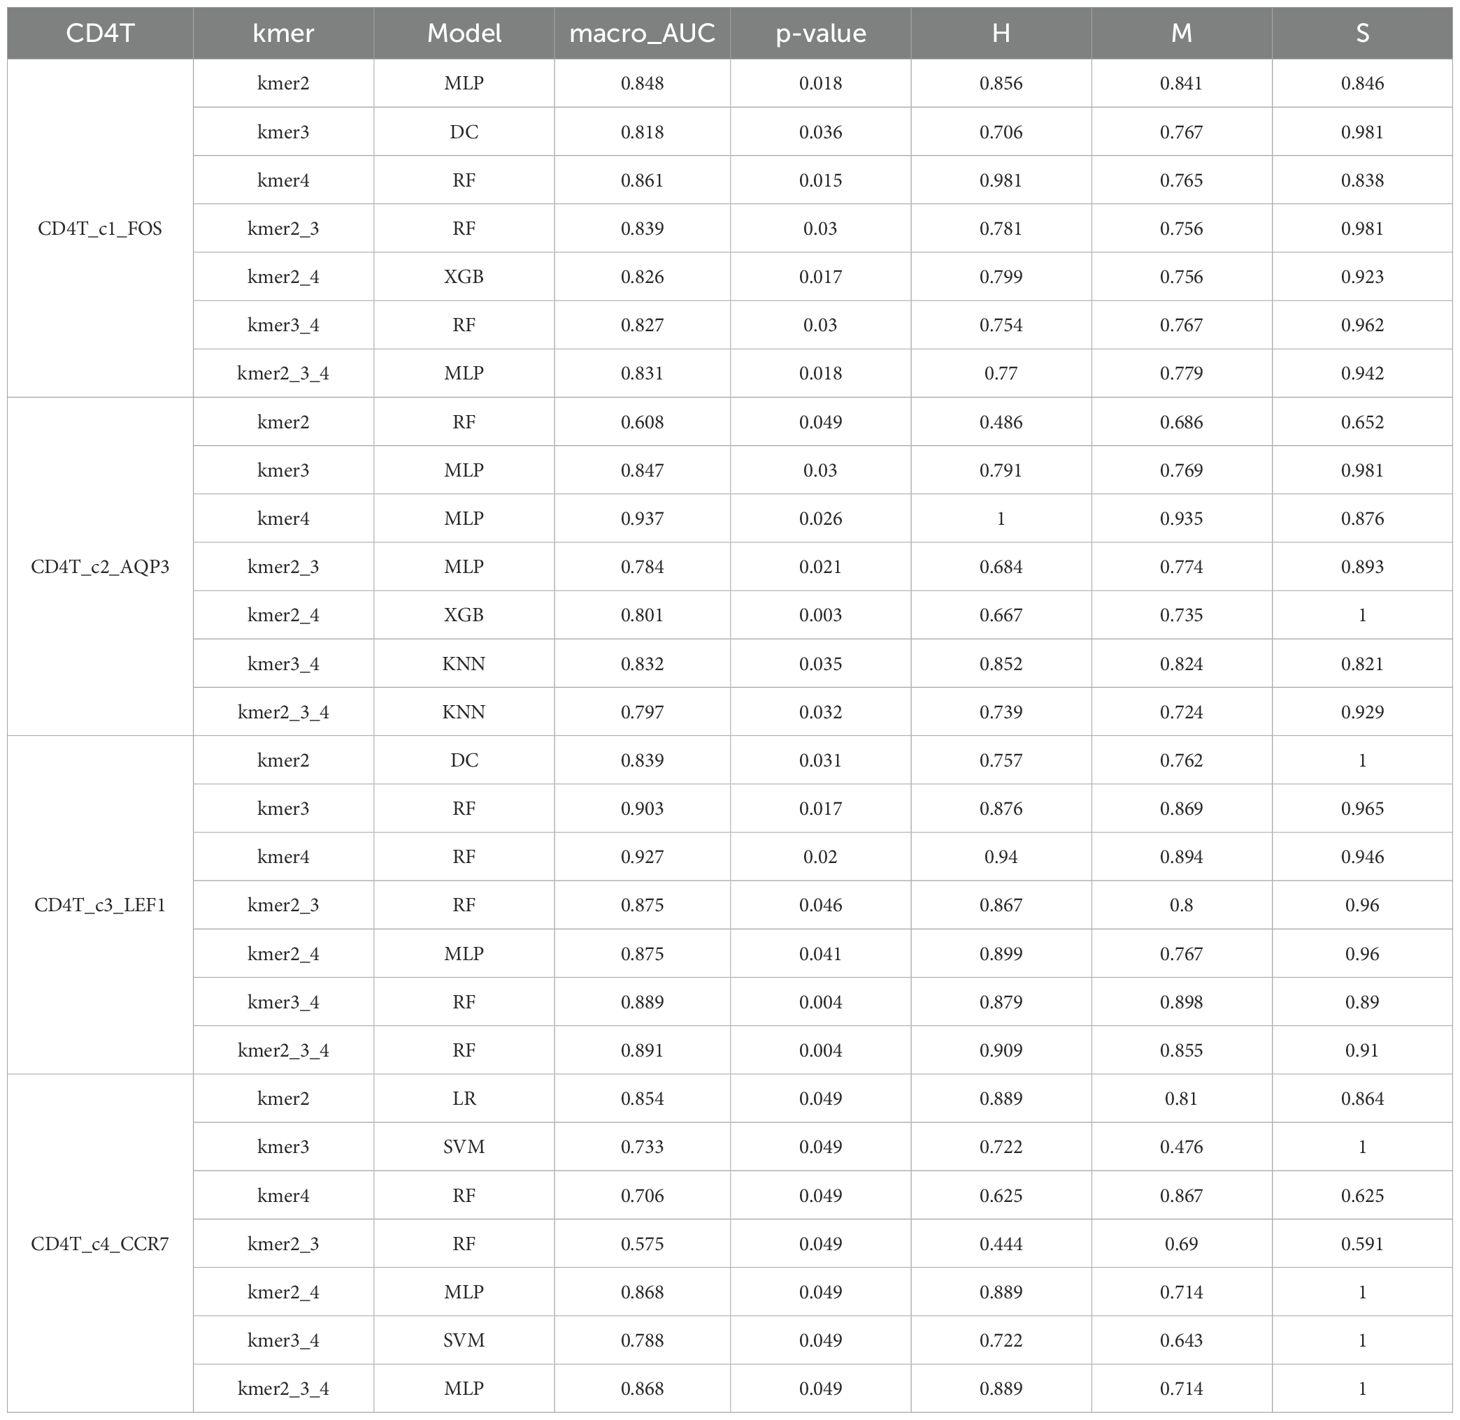
Table 2. Evaluation of CD4T cell subsets based on TCR sequencing.
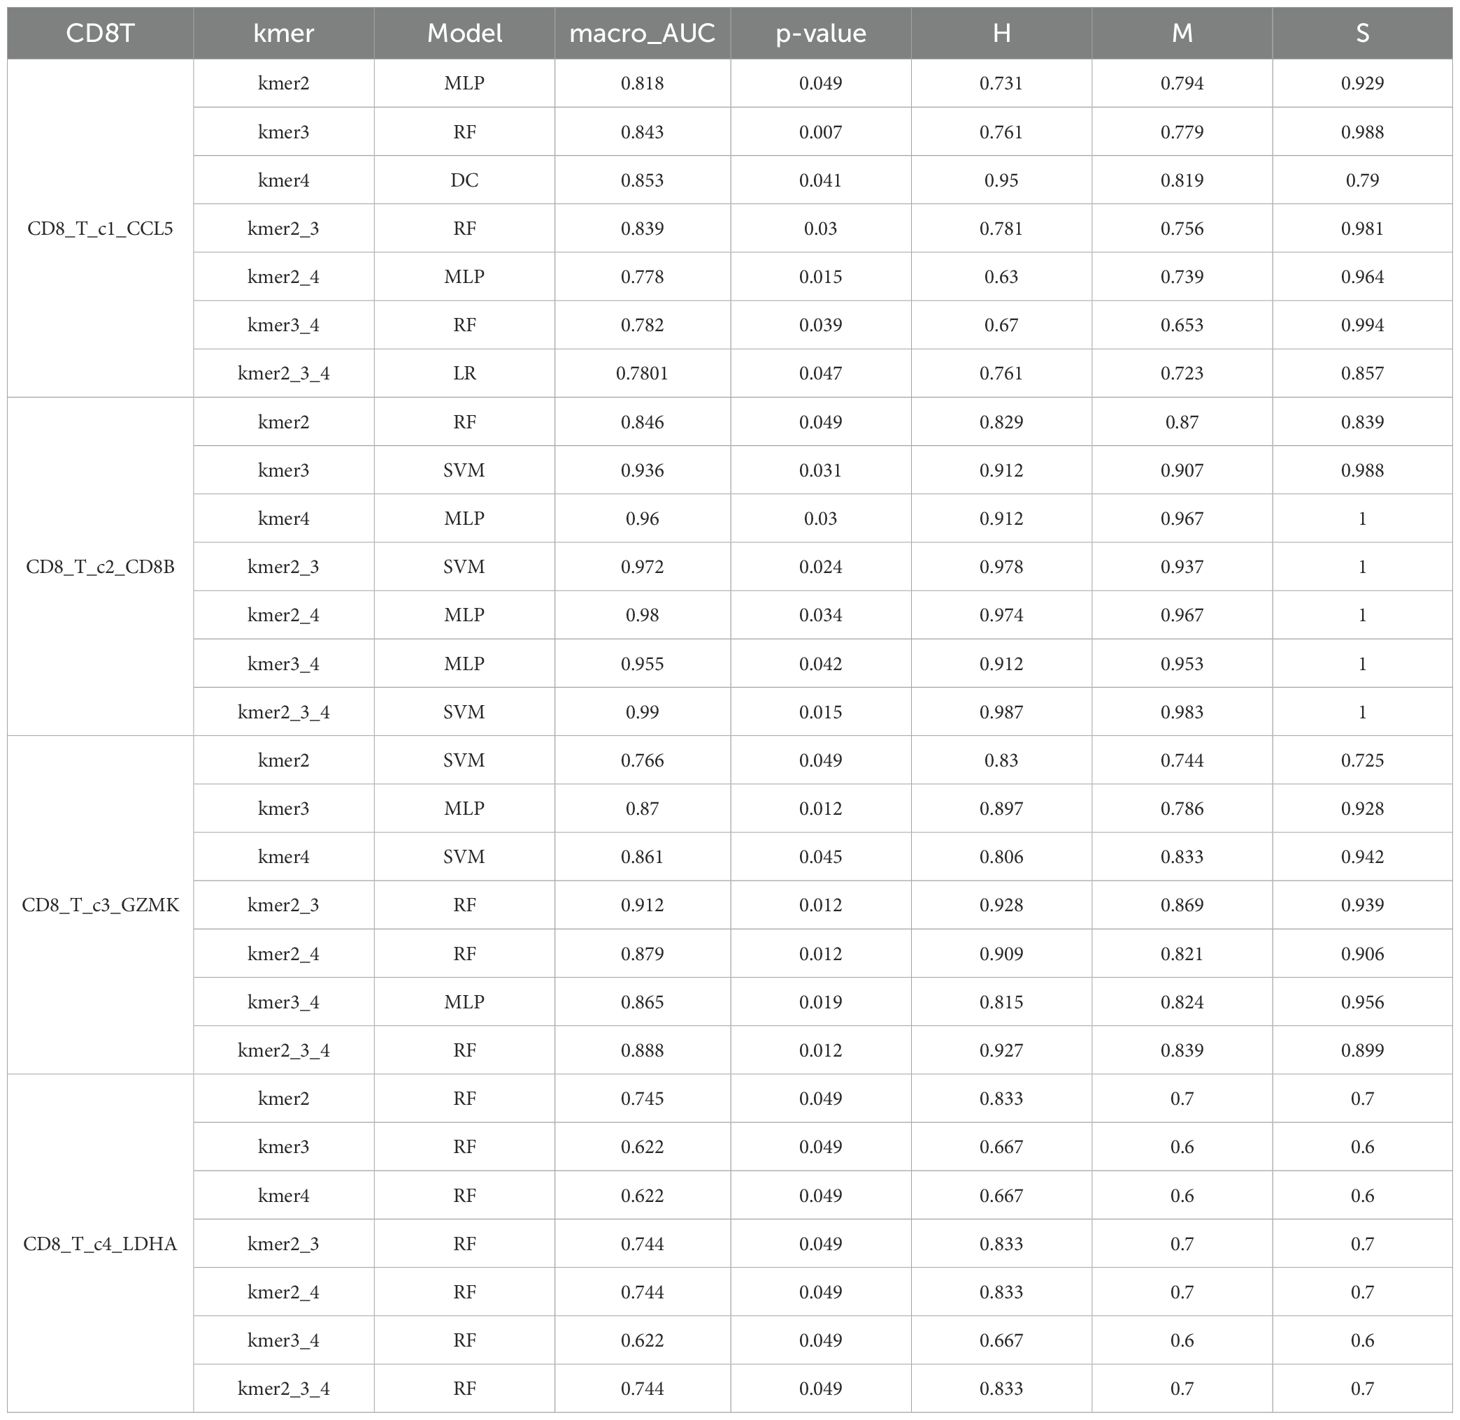
Table 3. Evaluation of CD8T cell subsets based on TCR sequencing.
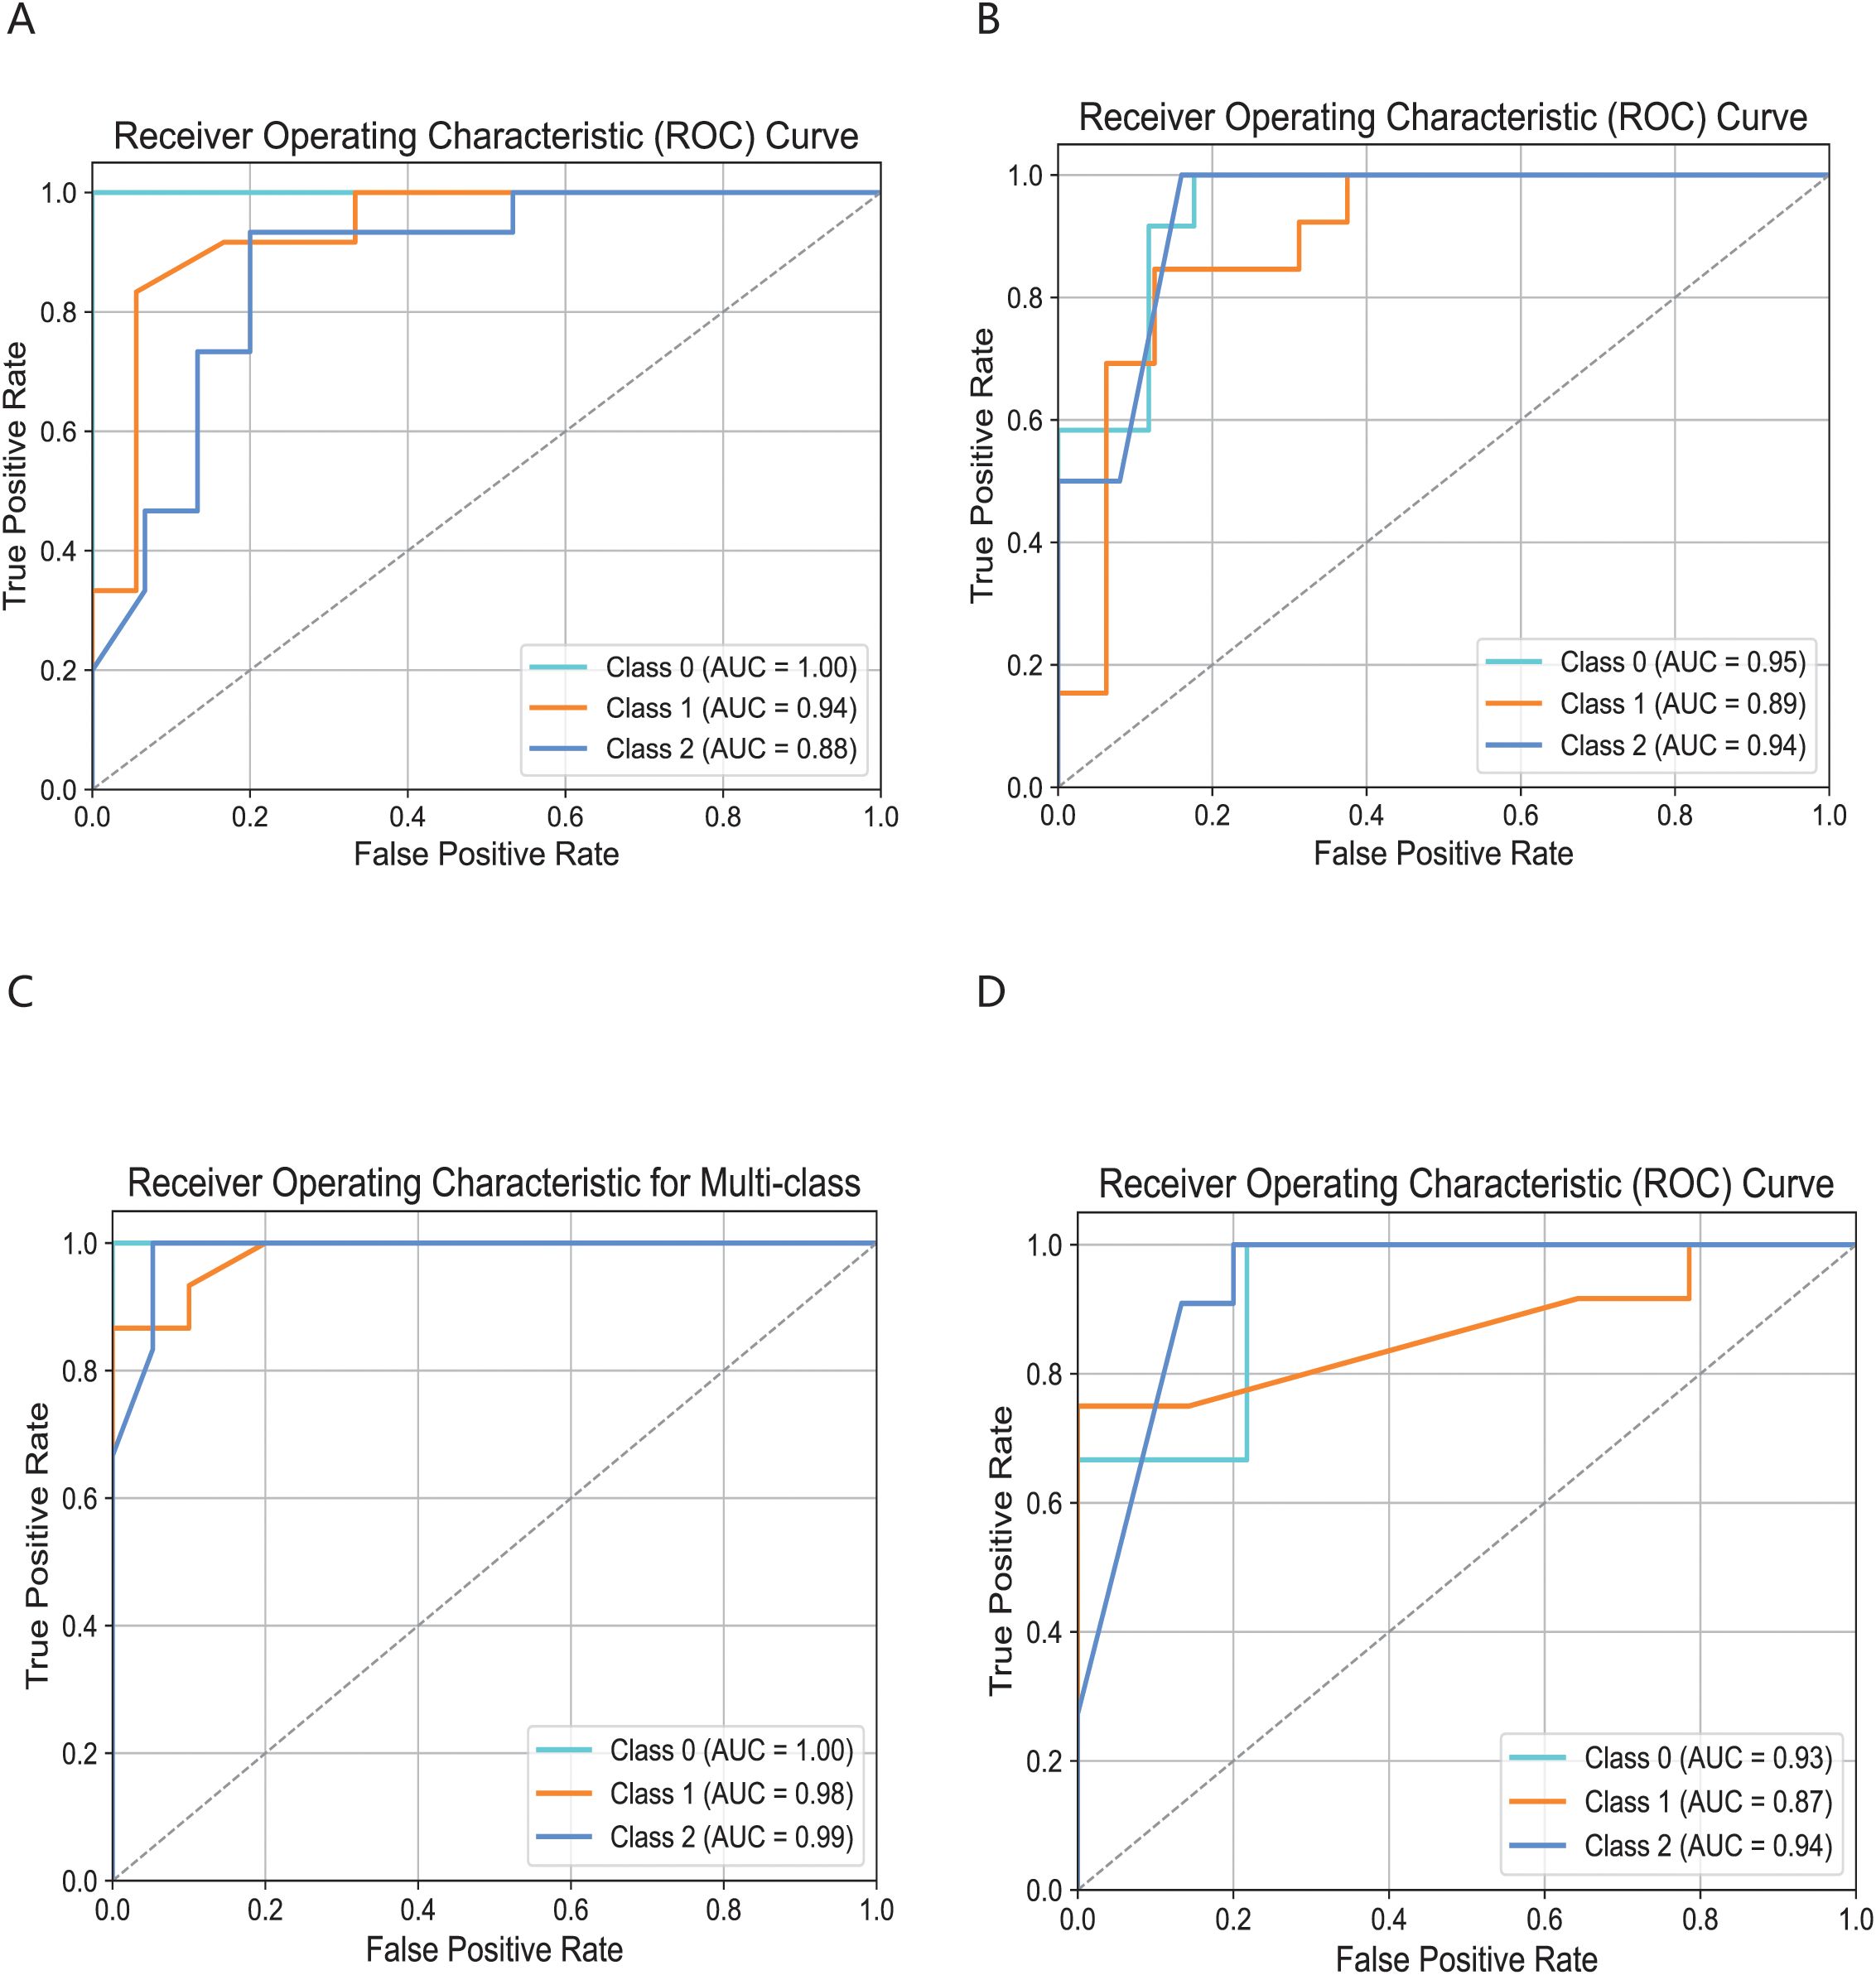
Figure 4. Comparison of specific T cell subsets based on structural similarities. (A) Classification and comparison of CD4T_c2_AQP3 cell subsets based on structural similarity. (B) Classification and comparison of CD4T_c3_LEF1 cell subsets based on structural similarity. (C) Classification and comparison of CD8T_c2_CD8B cell subsets based on structural similarity. (D) Classification and comparison of CD8T_c3_GZMK cell subsets based on structural similarity. The number of class 0, 1 and 2 are normal group, mild and severe infection, respectively.
3.5 Close connections between immune cell subsets in different infection states in COVID-19 patients
We investigated the interactions among 11 immune cell subsets by selecting immune cell surface protein pairs. This approach allowed us to evaluate the connectivity of the immune cell subsets in COVID-19 patients under different infection states, based on the affinity of each pair of proteins and the expression of the encoding genes. When comparing the post-COVID-19 infection state to the normal state, we observed a weakened binding affinity between the CD4T_c4_CCR7 and CD8T_c2_CD8B subset. Conversely, the binding strength of CD8T_c1_CCL5 to both CD8T_c4_LDHA and CD4T_c1_FOS was found to be enhanced. In comparisons between the mid-term and severe states following COVID-19 infection, we noted a significant reduction in the binding affinity between the B_c1_TCL1A and CD4T_c1_FOS subset, as illustrated in Figures 5A–C.
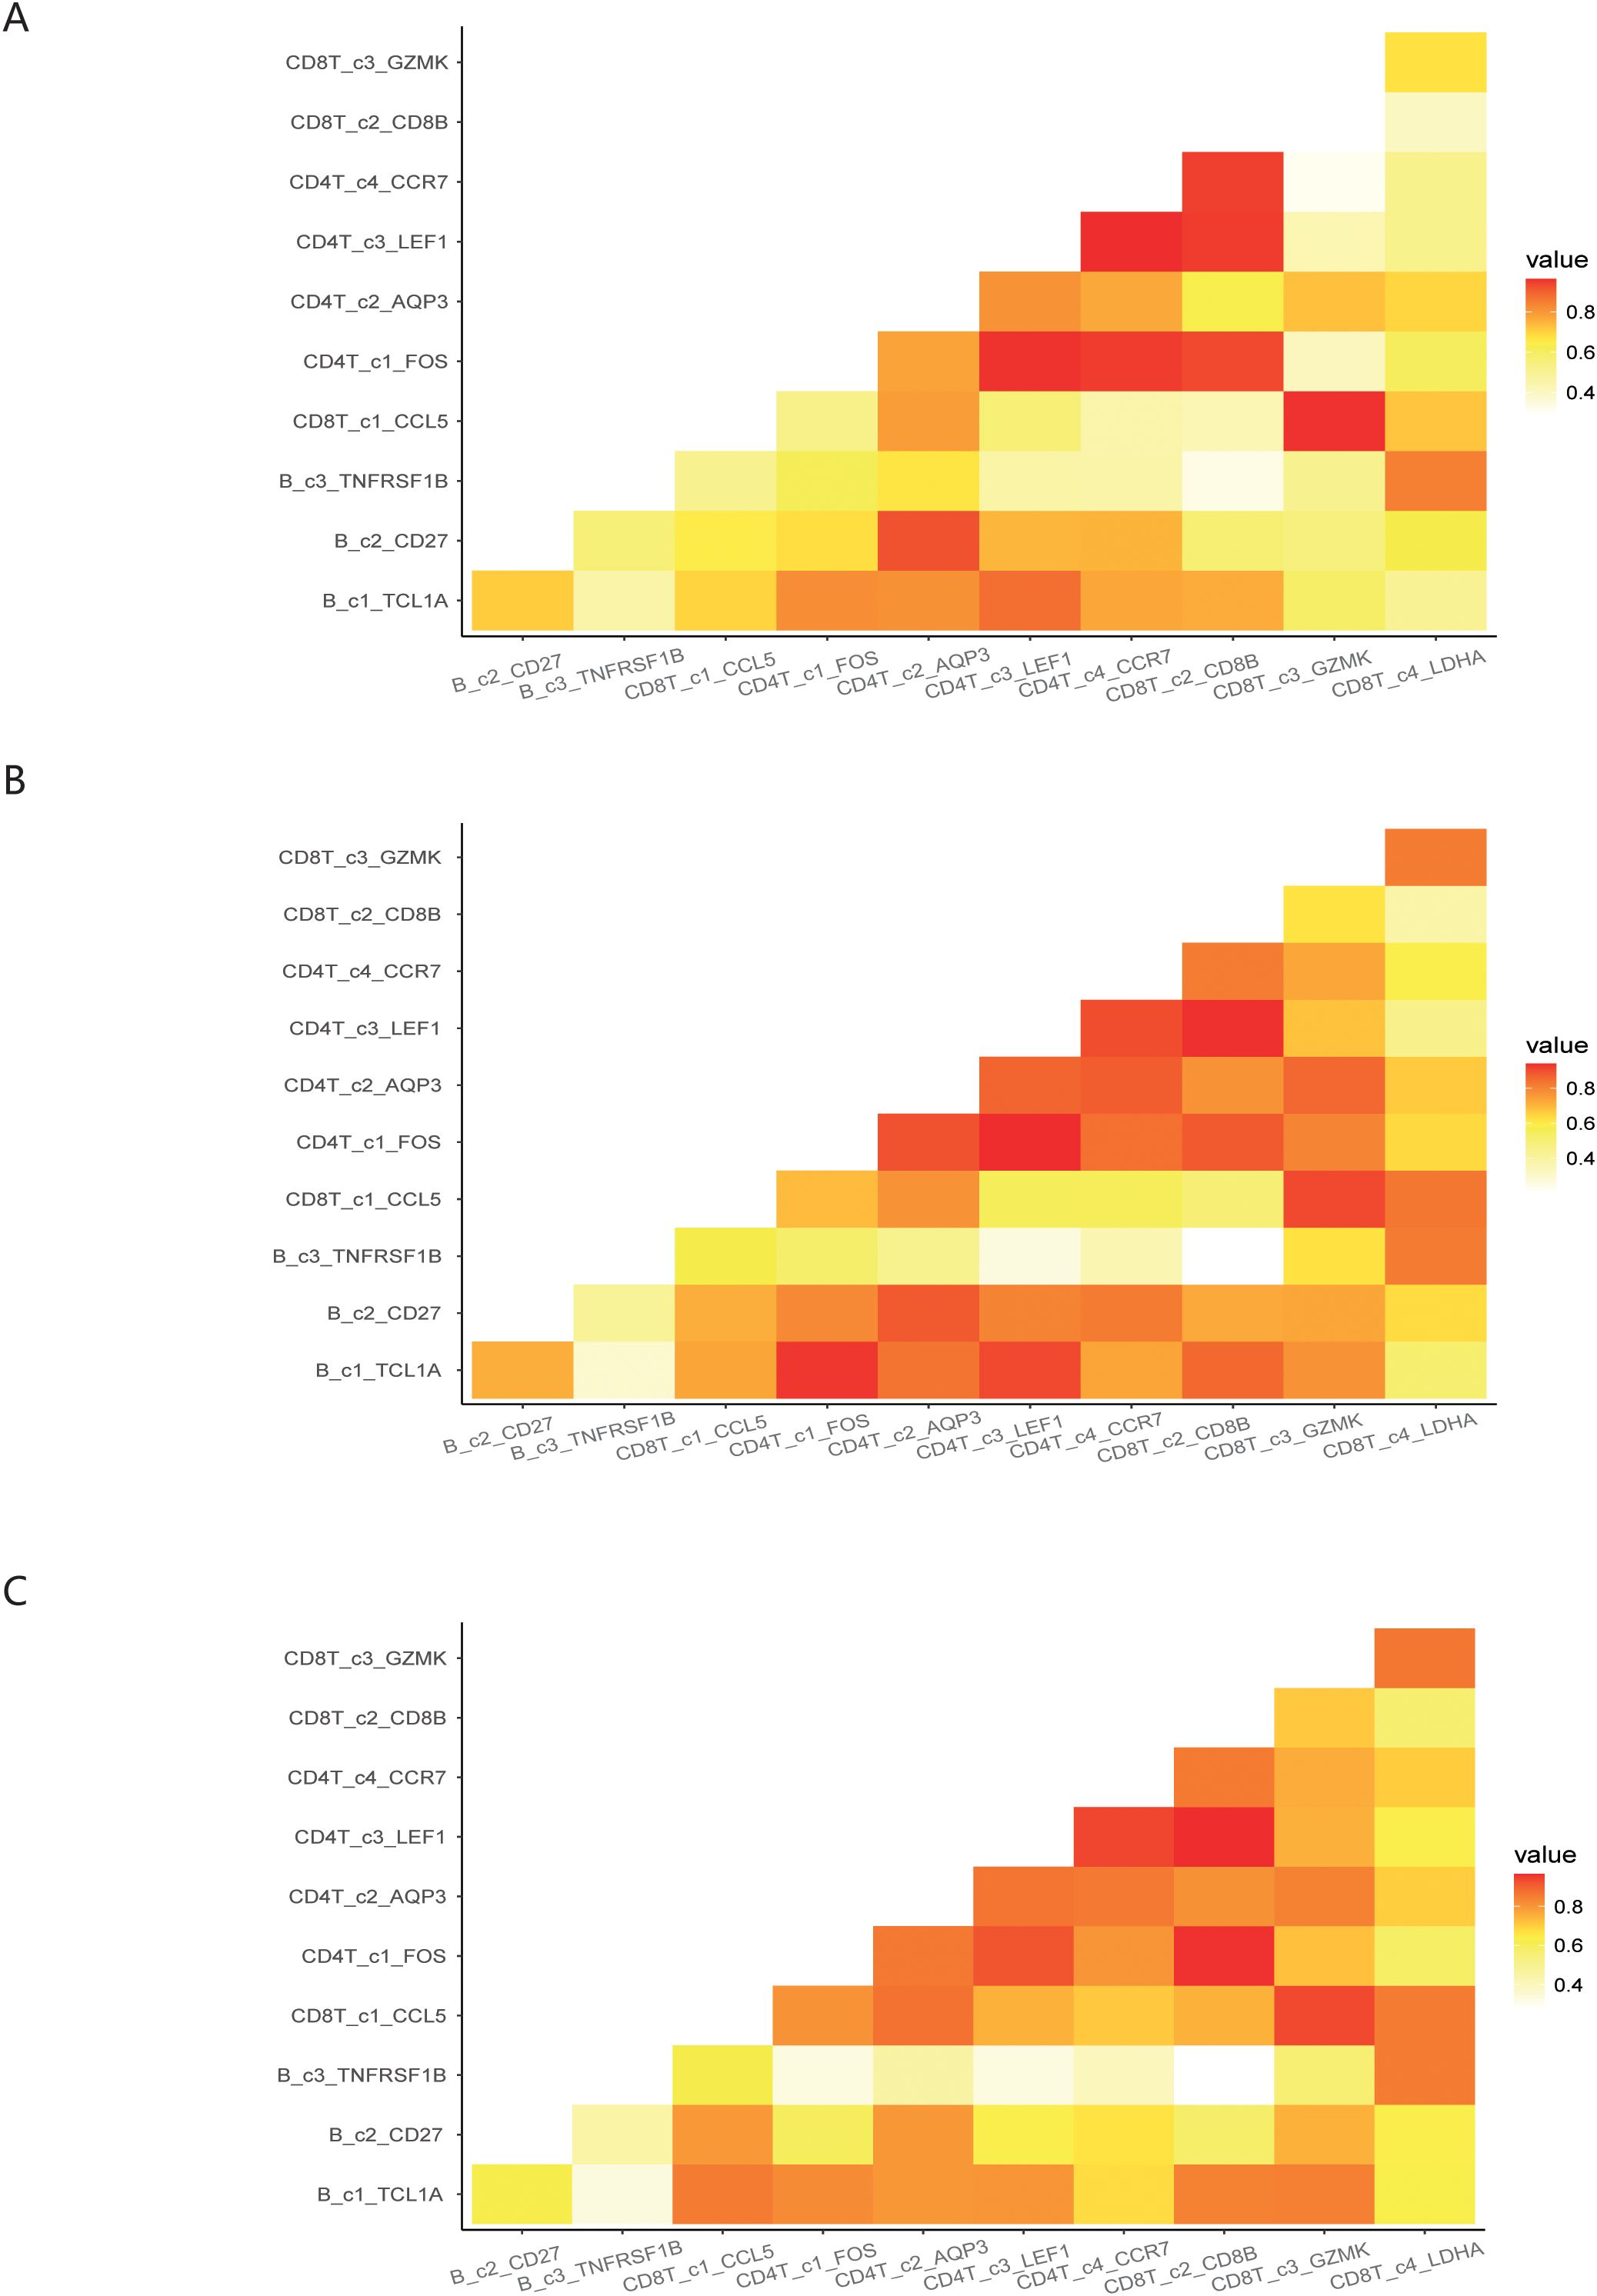
Figure 5. Demonstration of interactions between immune cell subsets under different infection states. (A) Interactions among immune cell subsets in normal states of COVID-19 patients. (B) Interactions among immune cell subsets in mild states of COVID-19 patients. (C) Interactions among immune cell subsets in severe states of COVID-19 patients.
3.6 Metabolic changes of immune cell subsets in COVID-19 patients under different infection states
Furthermore, we explored the specific metabolic pathways associated with the 11 immune cell subpopulations. By comparing the post-COVID-19 infection state with the normal state, we observed that these cell subpopulations exhibited active engagement in various metabolic pathways, revealing metabolic heterogeneity across different infection states, as shown in Figure 6A. Meanwhile, we also conducted significant hypothesis tests on the metabolic pathways involved, as shown in the Supplementary Figure 3. The Glycerophospholipid metabolism, Oxidative phosphorylation, and Purine metabolism metabolic pathways were significantly expressed in B_c1_TCL1A, B_c2_CD27, and CD8T_c1_CCL5 cell subpopulations, particularly notable during the mid-stage of infection, as illustrated in Figure 6B. The CD4T_c4_CCR7 subpopulation shown significant changes in the scores of Pyrimidine metabolism, Nicotinate and nicotinamide metabolism metabolic pathways post-COVID-19 infection, as followed in Figure 6C. Additionally, the metabolic scores for the B_c3_TNFRSF1B, CD4T_c2_AQP3, CD4T_c3_LEF1, CD8T_c2_CD8B, and CD8T_c3_GZMK subpopulations displayed a trend of increasing followed by a decrease, as summarized in Figure 6D. The CD8T_C4_LDHA subpopulation exhibited notable changes in the scores for the Starch and sucrose metabolism metabolic pathways following COVID-19 infection, as summarized in Figure 6E.
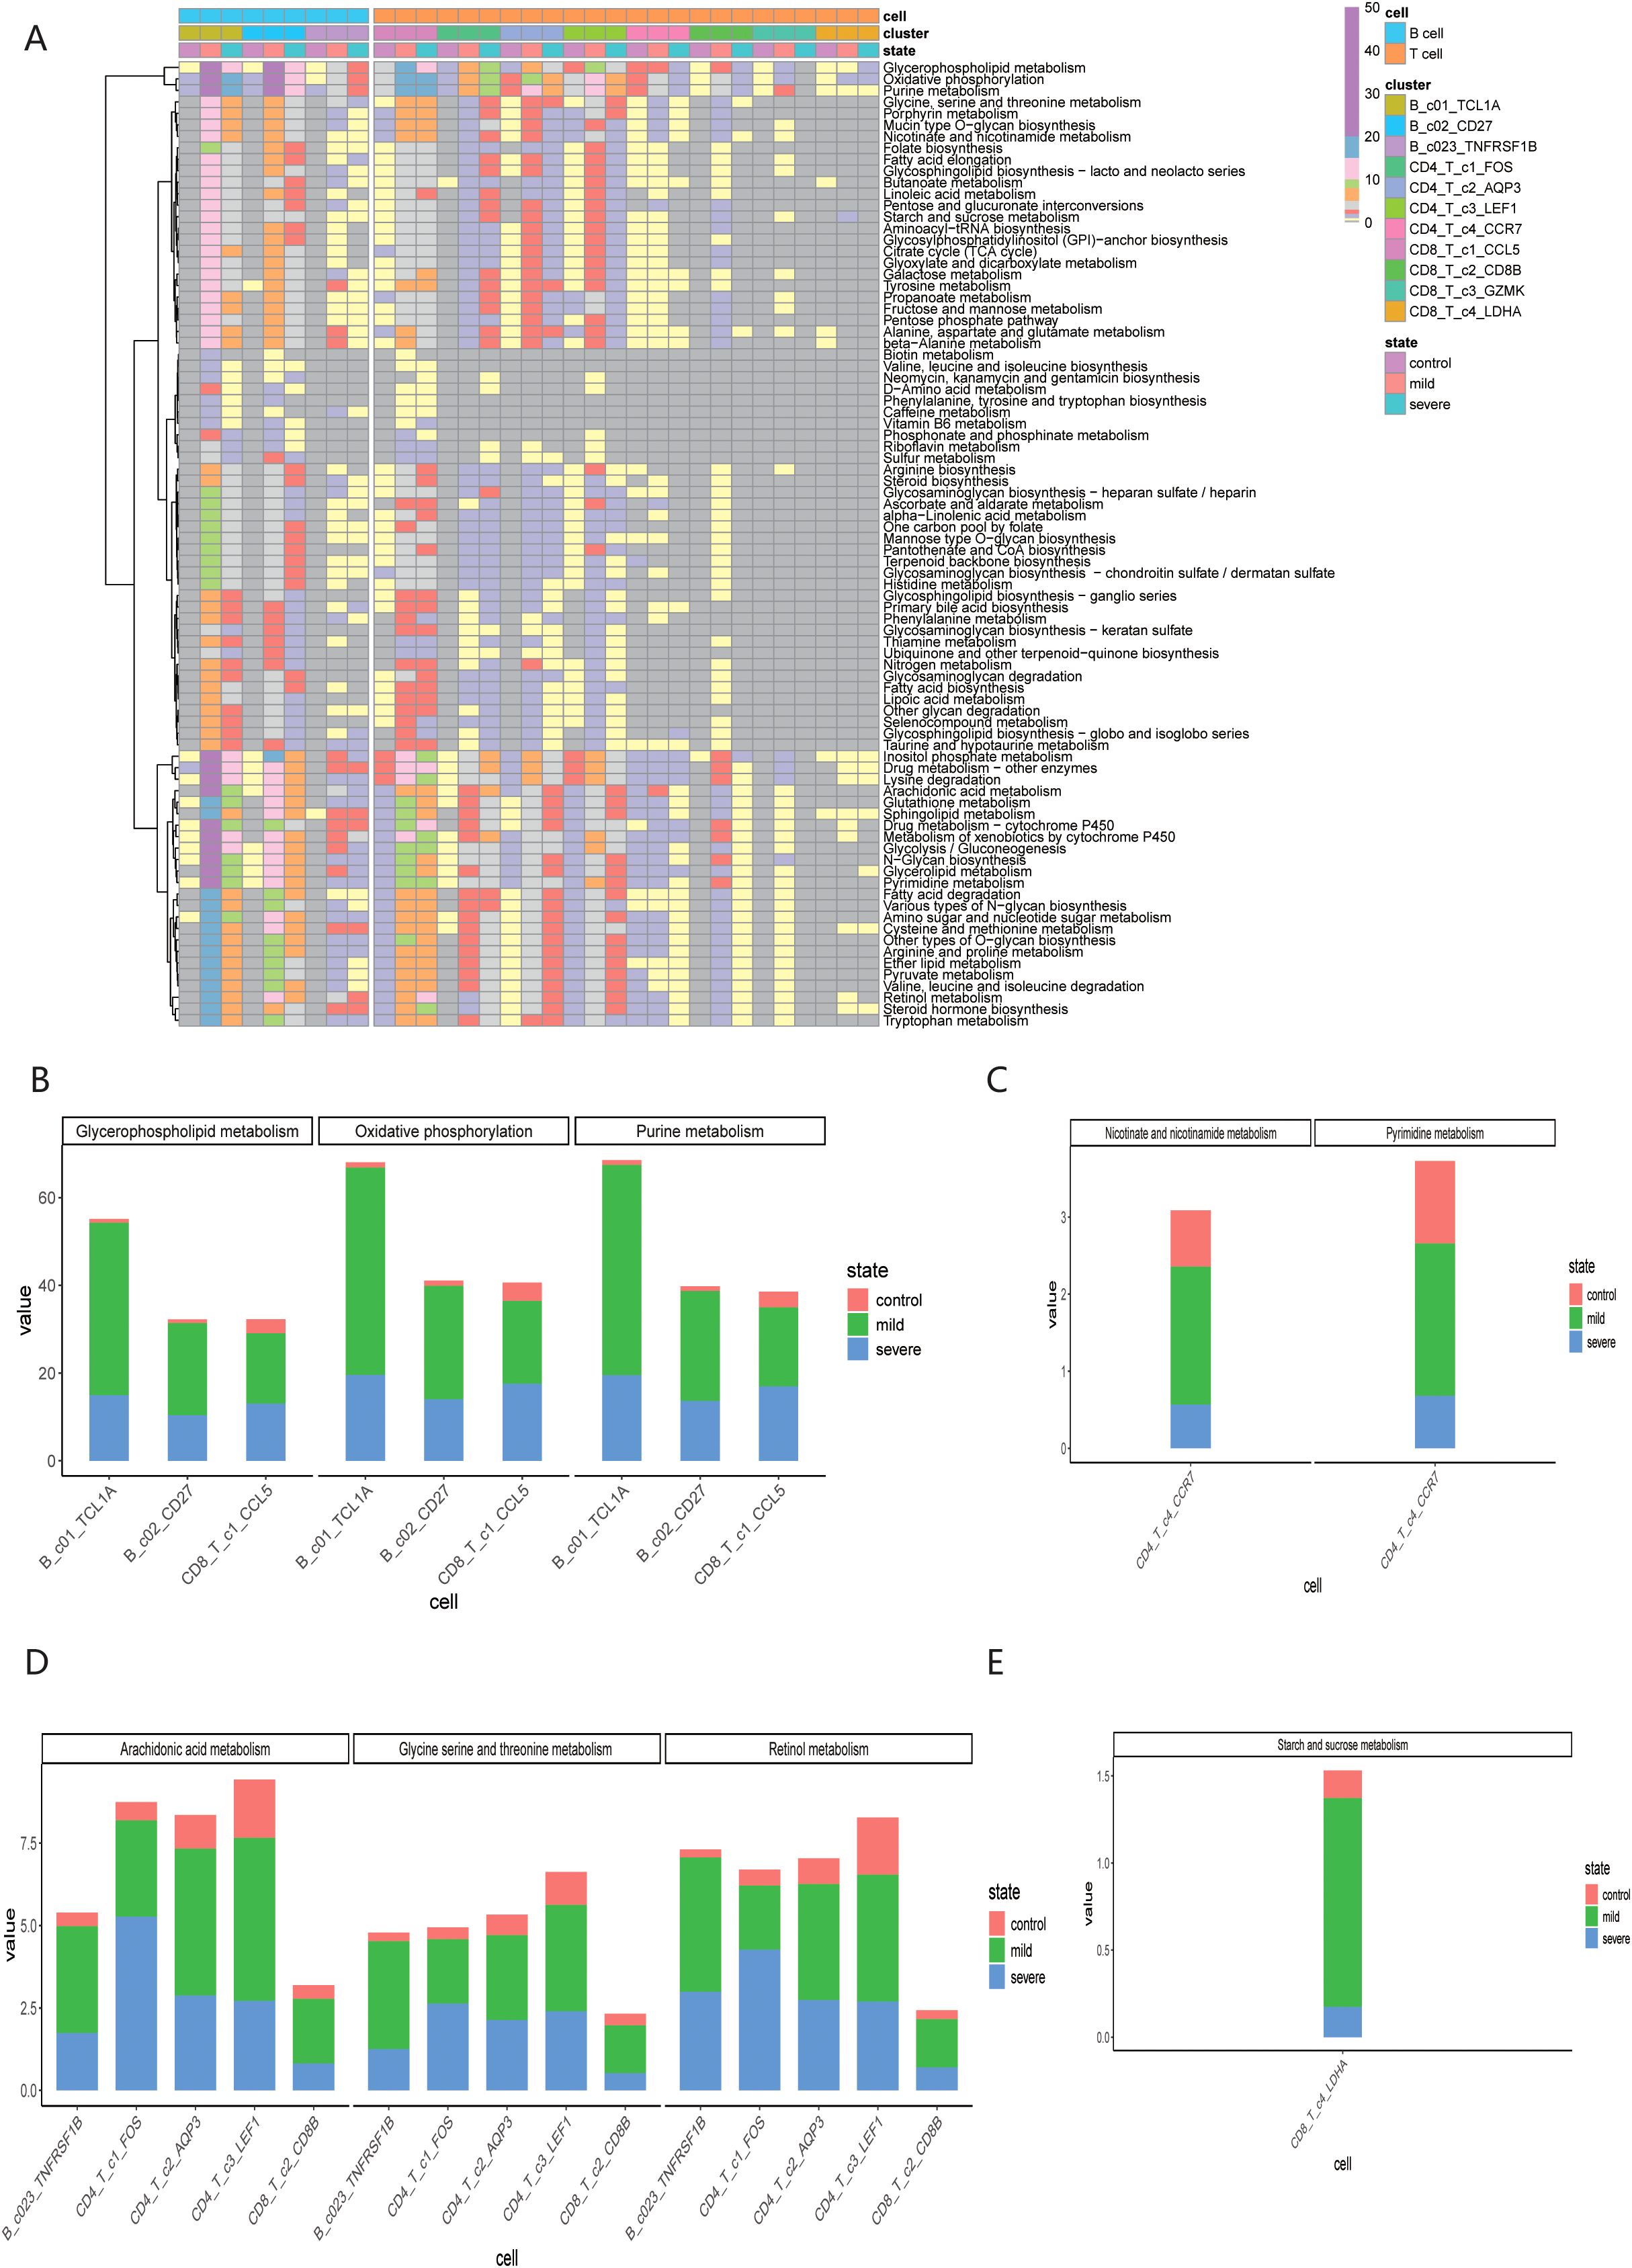
Figure 6. Metabolic heterogeneity of immune cells under different infection states. (A) Metabolic pathway scores of 11 immune cell subsets; (B) Significant expression of B_c1_TCL1A, B_c2_CD27 and CD8T_c1_CCL5 in three specific metabolic pathways. (C) Significant expression of B_c3_TNFRAF1B, CD4T_c1_FOS, CD4T_c2_AQP3, CD4T_c3_LEF1 and CD8T_c2_CD8B in three specific metabolic pathways. (D) Significant expression of CD4T_c4_CCR7 in two specific metabolic pathways. (E) Significant expression of CD8T_c4_LDHA in the specific metabolic pathway.
3.7 The KDDC framework can also be used to classify COVID-19 patients in different infection states
Finally, we employed the KDDC algorithm to classify COVID-19 patients in different states based on BCR and TCR sequencing data. We first analyzed the distribution of cdr3aa sequence lengths in both BCR and TCR across different infection states. The cdr3aa length distribution exhibited significant differences post-COIVD-19 infection, as depicted in Figures 7A, B. The KDDC framework was applied to compare datasets with different kmer lengths. We identified the datasets and classification algorithms yielded the best classification performance, as summarized in Table 4. The classification performance of COVID-19 patients based on BCR sequencing data was exceptional, achieving an average AUC value of 98.8% in kmer3, as shown in Figure 7C. In contrast, the classification performance of COVID-19 patients based on TCR sequencing data was good, with an average AUC value of 83.3% in kmer4, as followed in Figure 7D.
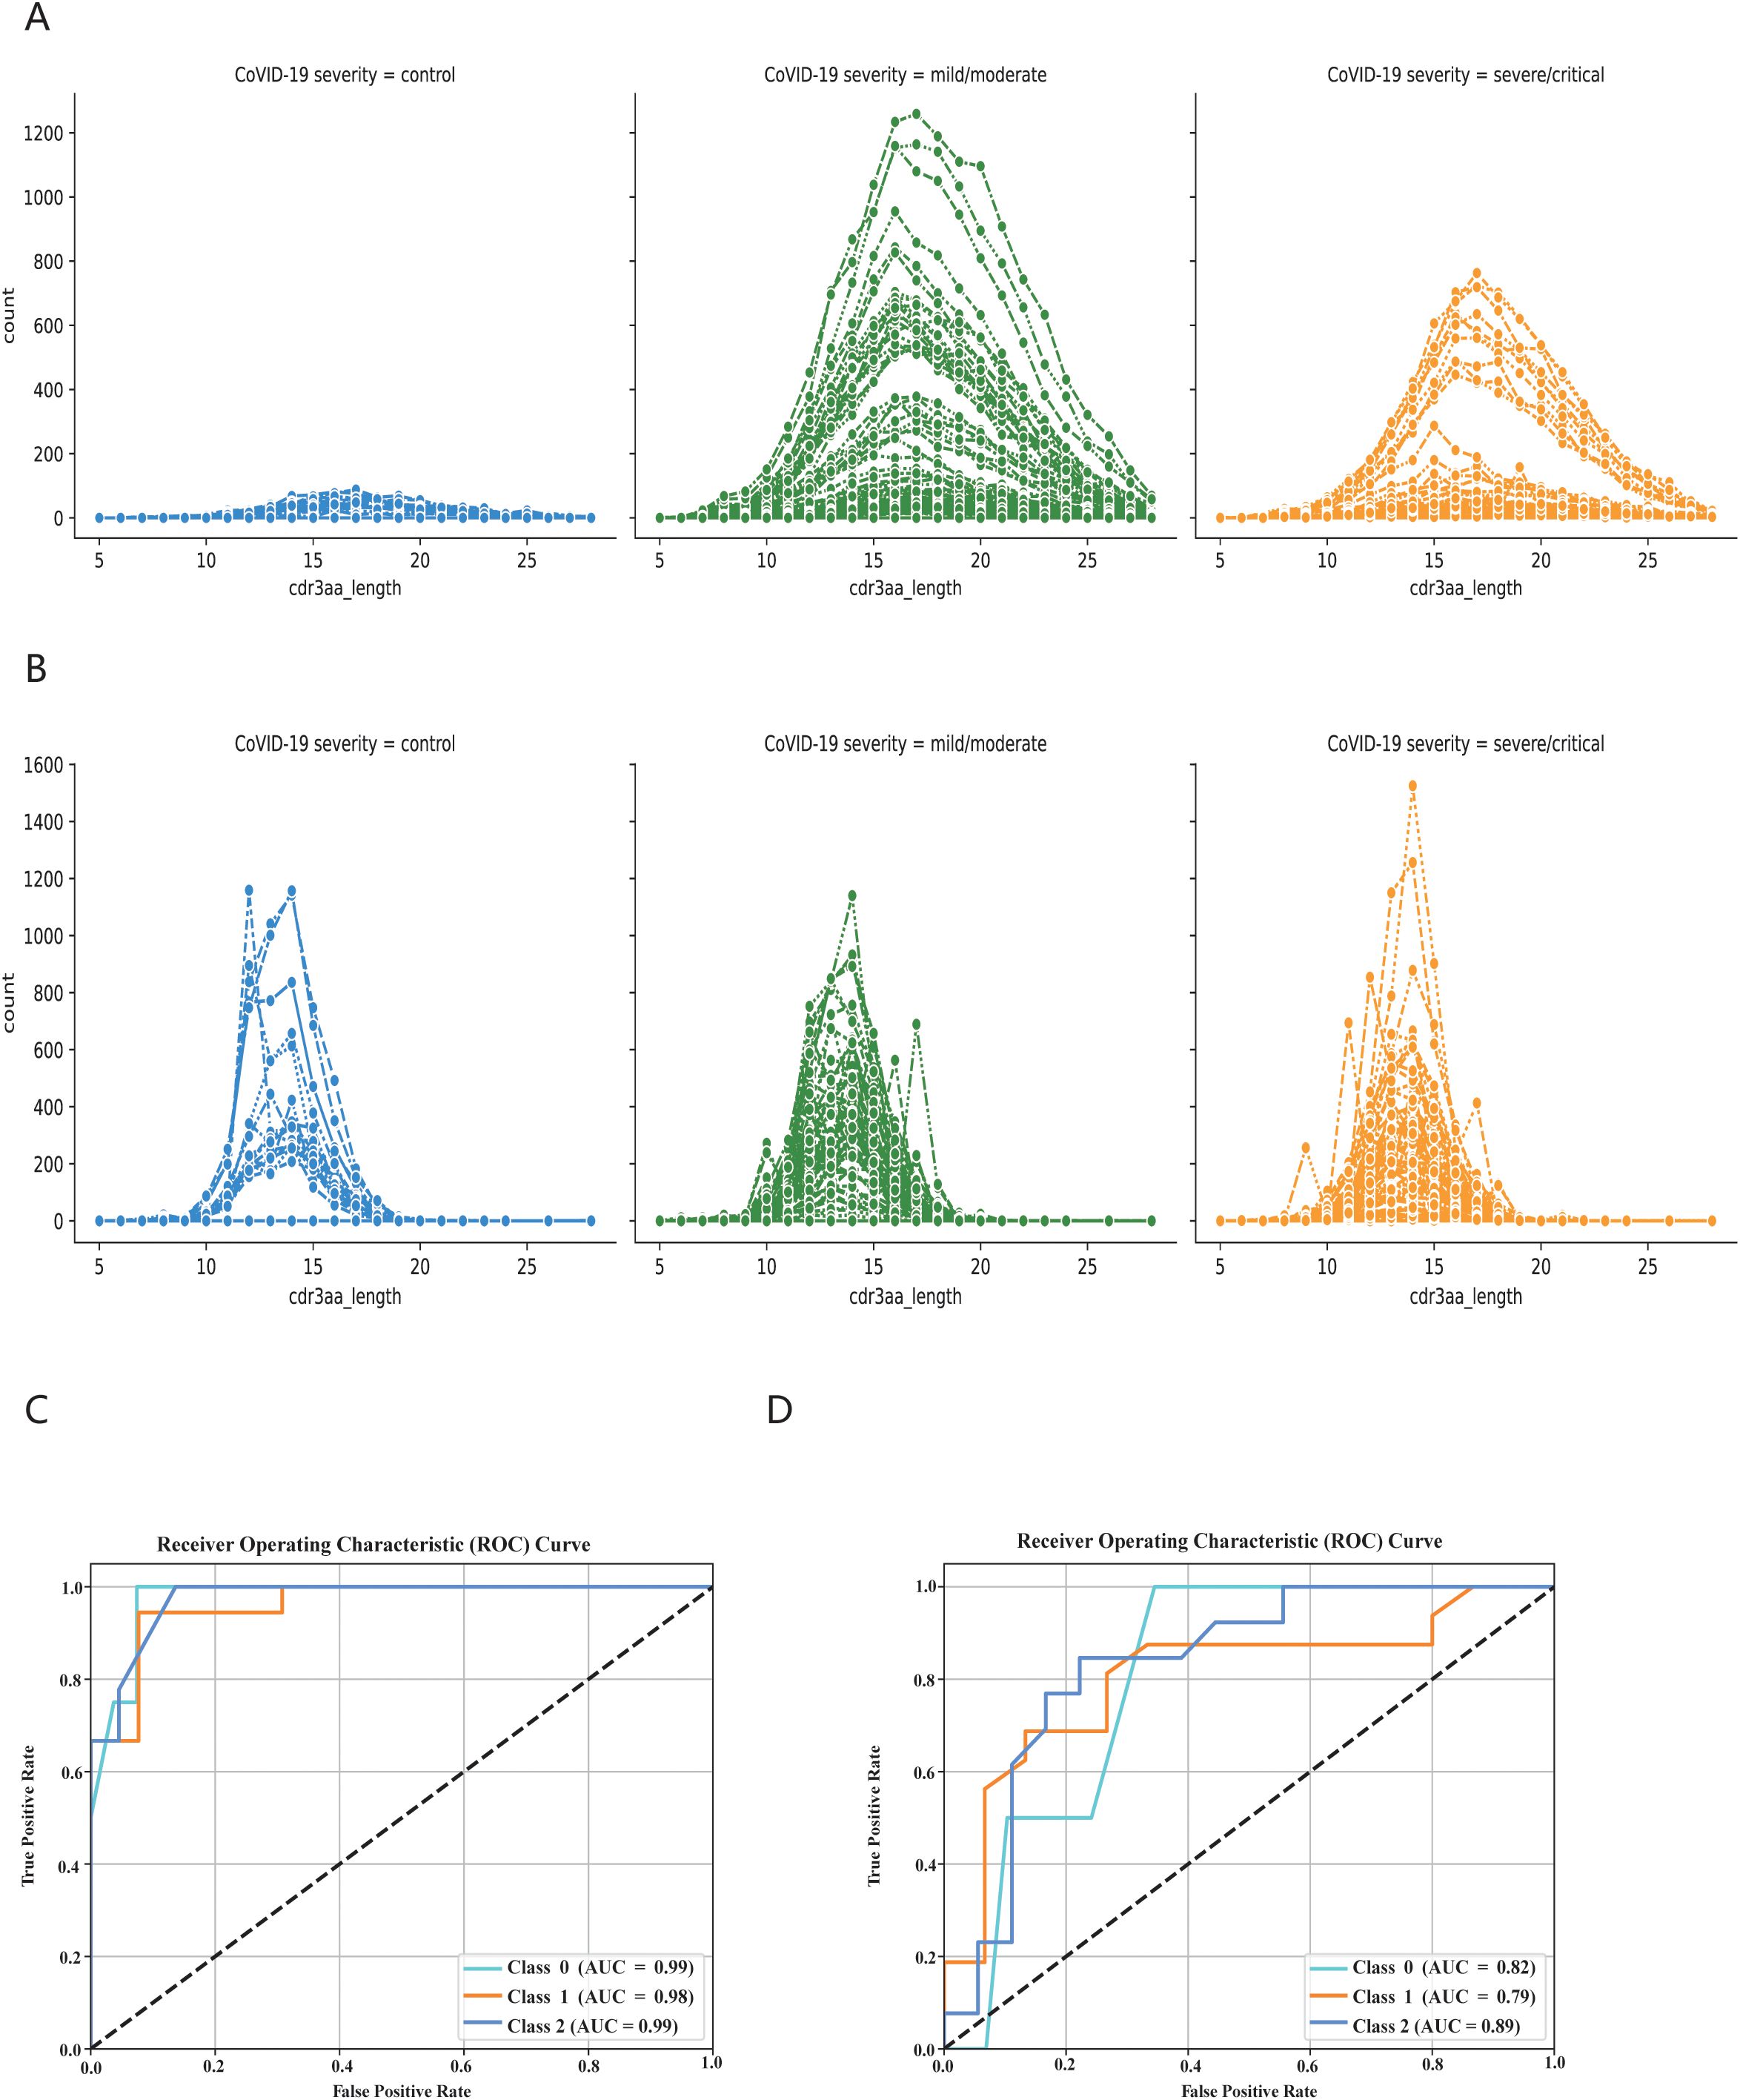
Figure 7. KDDC framework realizes classification and comparison of COVID-19 patients in different states. (A) BCR length distribution in different states of COVID-19 patients. (B) TCR length distribution in different states of COVID-19 patients. Different colors represent different states of patients, with blue indicating normal group, green mild or moderate infection, orange indicating severe infection. (C) Classification comparison of COVID-19 patients in different states based on BCR data. (D) Classification comparison of COVID-19 patients in different states based on TCR data.
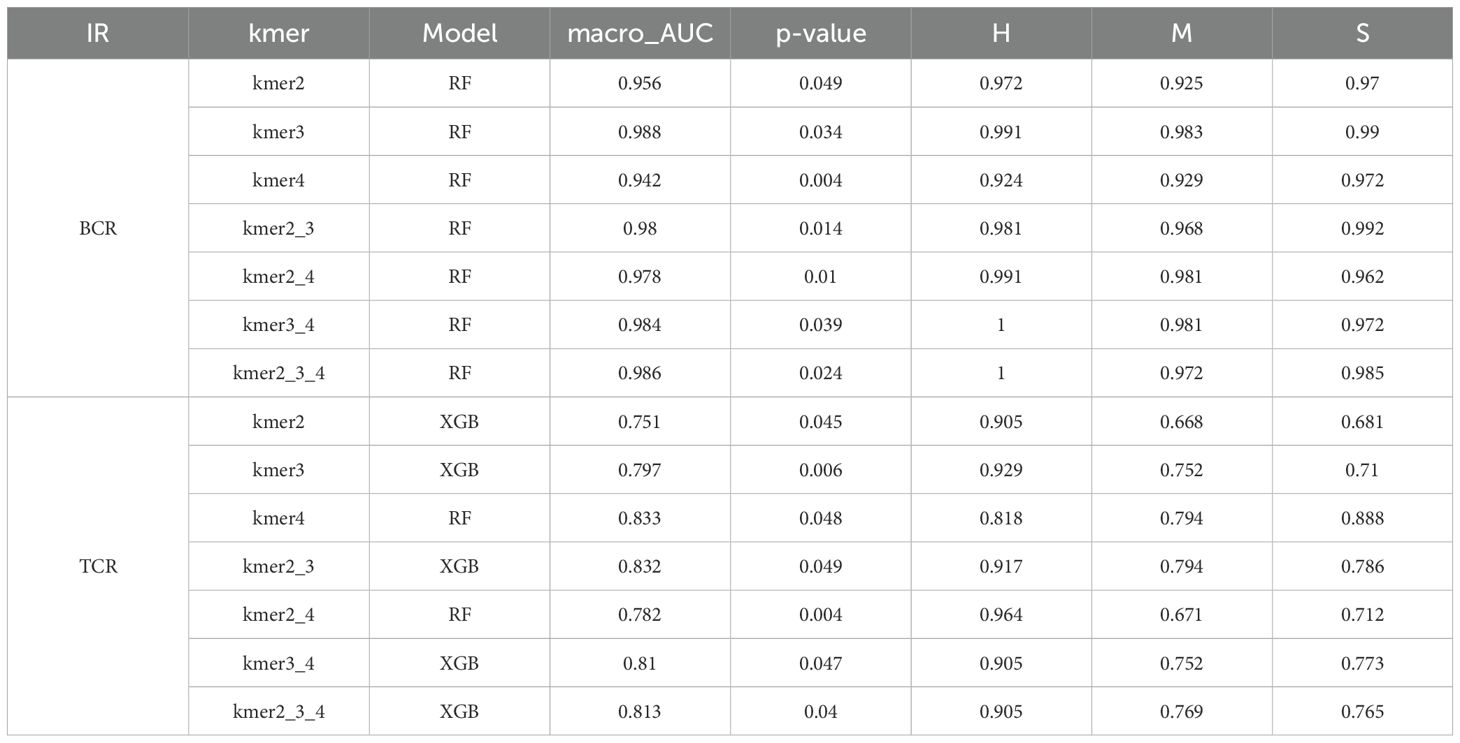
Table 4. Evaluation of immune repertoire data classification algorithms.
4 Discussion
In this study, we implemented the KDDC framework to integrate single-cell sequencing data with immune repertoire data, achieving heterogeneous classification of immune cell subsets based on the structural similarity of cdr3aa sequences. The integration of immune repertoire data and single-cell sequencing data enhance our understanding of the changes, behaviors and mechanisms of cell subsets at the cellular level. We observed that the classification performance of BCR-based cell subsets under different infection states was notably superior to that of TCR-based cell subsets. This highlights the advantages of utilizing BCR data in understanding immune responses. Additionally, we placed emphasis on comparing the classification performance of BCR and TCR across individual cases, providing valuable insights into the distinct roles these receptors play in immune classification.
After COVID-19 infects the host, the expression of BCR and TCR receptor-related cell subpopulations shows heightened activity in terms of cell proportions, cell communication, and metabolic pathways. We observed a increase in the expression of MT-CO2 and MT-ND3 genes in both B cells and T cell subsets post-COVID-19 infection. This upregulation may activate oxidative phosphorylation and other related pathways, triggering immune responses (18). The B_c1_TCL1A subpopulation exhibited distinct changes in the cell proportions compared to the B_c3_TNFRSF1B subpopulation. The B_c3_TNFRSF1B subpopulation shown a marked increase in the expression of NFKB1, NFKB3, ID3, SKIL and TNF genes, potentially activating TGF-beta signaling pathway, which may contribute to cell proliferation (19). Conversely, the B_c1_TCL1A, CD4T_c1FOS and CD8T_c3_GZMK subpopulations were highly expressed in DUSP1 and JUN genes, suggesting activation the innate immune system and inflammatory response pathways (20). This may influence the production and expression of the corresponding cell subpopulations. Comparing the states before and after COVID-19 infection revealed a weakening of binding affinity between the CD4T_c4_CCR7 and CD8T_c2_CD8B subpopulations. In contrast, the binding strength between the CD8T_c1_CCL5, CD8T_c4_LDHA and CD4T_c1_FOS populations increased post-COVID-19 infection. These findings highlighted the complex interplay of immune cell subsets during COVID-19 infection, emphasizing the dynamic changes in gene expression and cell communication that contribute to the overall immune response.
During the metabolic process after COVID-19 infection, the B_c1_TCL1A, B_c2_CD27, and CD8T_c1_CCL5 subpopulations shown significant expression in the Glycerophospholipid metabolism, Oxidative phosphorylation, and Purine metabolism metabolic pathways, particularly during the middle stage of infection. Glycerophospholipid metabolism played a crucial role in maintaining the fluidity and integrity of cell membranes and was involved in inflammatory and immune responses during signal transduction (21). The increase in oxidative phosphorylation indicated that immune cells require substantial energy to support heightened activity during the immune response (22). Alterations in purine metabolism may drive cell proliferation and apoptosis, impacting overall cell function and survival (23). the CD4T_c1_FOS cell subpopulation exhibited significant increases in Retinol metabolism, Glycine, serine and threonine metabolism, and Arachidonic acid metabolism metabolic pathways after COVID-19 infection. The scores of these pathways for the B_c3_TNFRSF1B, CD4T_c2_AQP3, CD4T_c3_LEF1, CD8T_c2_CD8B and CD8T_c3_GZMK subpopulations displayed a trend of increasing following by a decreased. The Retinol metabolism was involved in the development and function of B cells and T cells and had anti-inflammatory properties (24). The Glycine, serine and threonine metabolism reflected the metabolic activity and energy demands of cells (25). The Arachidonic acid metabolism played a vital role in inflammatory responses, with its upregulation likely linked to enhanced immune regulation post-COVID-19 infection (26). The CD4T_c4_CCR7 subpopulation demonstrated significant shifts in the Pyrimidine metabolism, Nicotinate and nicotinamide metabolism metabolic pathways, potentially related to viral immune evasion mechanism and the metabolic reprogramming. The CD8T:C4_LDHA subpopulation shown notable changes in the Starch and sucrose metabolism pathway, suggesting adaptations in energy supply and the regulation of immune responses (27). Cell therapy based on TCR and BCR had significant advantages in immunotherapy, as it can accurately target immune cells, avoid damaging normal cells and improve treatment efficacy. This study provides valuable insights into the integrated analysis of immune repertoire data and single cell repertoire data. By revealing the metabolic changes and mechanisms of cell subpopulations at a cellular level, it offered new directions for personalized treatment strategies and antibody development in the context of COVID-19.
Data availability statement
The original contributions presented in the study are included in the article/Supplementary Material. Further inquiries can be directed to the corresponding authors.
Author contributions
NZ: Data curation, Formal analysis, Writing – original draft. SZ: Writing – original draft, Formal analysis. RW: Investigation, Writing – original draft. XL: Investigation, Writing – original draft. MY: Writing – review & editing. ZC: Writing – review & editing. JX: Writing – review & editing. MY: Writing – review & editing.
Funding
The author(s) declare that financial support was received for the research and/or publication of this article. This project was supported by the National Key R&D Program of China (2023YFC2605000 and 2022YFF1203204), the Joint Funds of the National Natural Science Foundation of China (Grant No. U23A20269).
Conflict of interest
The authors declare that the research was conducted in the absence of any commercial or financial relationships that could be construed as a potential conflict of interest.
Generative AI statement
The author(s) declare that no Generative AI was used in the creation of this manuscript.
Publisher’s note
All claims expressed in this article are solely those of the authors and do not necessarily represent those of their affiliated organizations, or those of the publisher, the editors and the reviewers. Any product that may be evaluated in this article, or claim that may be made by its manufacturer, is not guaranteed or endorsed by the publisher.
Supplementary material
The Supplementary Material for this article can be found online at: https://www.frontiersin.org/articles/10.3389/fimmu.2025.1602907/full#supplementary-material
References
1. Mariuzza RA, Agnihotri P, and Orban J. The structural basis of T-cell receptor (TCR) activation: An enduring enigma. J Biol Chem. (2020) 295:914–25. doi: 10.1016/S0021-9258(17)49904-2
2. Wang Q, Feng D, Jia S, Lu Q, and Zhao M. B-cell receptor repertoire: recent advances in autoimmune diseases. Clin Rev Allergy Immunol. (2024) 66:76–98. doi: 10.1007/s12016-024-08984-6
3. Liu H, Pan W, Tang C, Tang Y, Wu H, Yoshimura A, et al. The methods and advances of adaptive immune receptors repertoire sequencing. Theranostics. (2021) 11:8945–63. doi: 10.7150/thno.61390
4. Xin W, Huang B, Chi X, Liu Y, Xu M, Zhang Y, et al. Structures of human gammadelta T cell receptor-CD3 complex. Nature. (2024) 630:222–9. doi: 10.1038/s41586-024-07439-4
5. van der Burg M, Tumkaya T, Boerma M, de Bruin-Versteeg S, Langerak AW, and van Dongen JJ. Ordered recombination of immunoglobulin light chain genes occurs at the IGK locus but seems less strict at the IGL locus. Blood. (2001) 97:1001–8. doi: 10.1182/blood.v97.4.1001
6. Chi X, Li Y, and Qiu X. V(D)J recombination, somatic hypermutation and class switch recombination of immunoglobulins: mechanism and regulation. Immunology. (2020) 160:233–47. doi: 10.1111/imm.v160.3
7. Irac SE, Soon MSF, Borcherding N, and Tuong ZK. Single-cell immune repertoire analysis. Nat Methods. (2024) 21:777–92. doi: 10.1038/s41592-024-02243-4
8. Papalexi E and Satija R. Single-cell RNA sequencing to explore immune cell heterogeneity. Nat Rev Immunol. (2018) 18:35–45. doi: 10.1038/nri.2017.76
9. Ren X, Wen W, Fan X, Hou W, Su B, Cai P, et al. COVID-19 immune features revealed by a large-scale single-cell transcriptome atlas. Cell. (2021) 184:5838. doi: 10.1016/j.cell.2021.01.053
10. Zhao Y, He B, Xu Z, Zhang Y, Zhao X, Huang ZA, et al. Interpretab le artificial intelligence model for accurate identification of medical conditions using immune repertoire. Brief Bioinform. (2023) 24:bbac555. doi: 10.1093/bib/bbac555
11. Shoukat MS, Foers AD, Woodmansey S, Evans SC, Fowler A, and Soilleux EJ. Use of machine learning to identify a T cell response to SARS-CoV-2. Cell Rep Med. (2021) 2:100192. doi: 10.1016/j.xcrm.2021.100192
12. Park JJ, Lee KAV, Lam SZ, Moon KS, Fang Z, and Chen S. Machine learning identifies T cell receptor repertoire signatures associated with COVID-19 severity. Commun Biol. (2023) 6:76. doi: 10.1038/s42003-023-04447-4
13. Wolf FA, Angerer P, and Theis FJ. SCANPY: large-scale single-cell gene expression data analysis. Genome Biol. (2018) 19:15. doi: 10.1186/s13059-017-1382-0
14. Schultebraucks K, Choi KW, Galatzer-Levy IR, and Bonanno GA. Discriminating heterogeneous trajectories of resilience and depression after major life stressors using polygenic scores. JAMA Psychiat. (2021) 78:744–52. doi: 10.1001/jamapsychiatry.2021.0228
15. Yang ZY, Xu QQ, Bao SL, Cao XC, and Huang QM. Learning with multiclass AUC: theory and algorithms. IEEE T Pattern Anal. (2022) 44:7747–63. doi: 10.1109/TPAMI.2021.3101125
16. Shilts J, Severin Y, Galaway F, Muller-Sienerth N, Chong ZS, Pritchard S, et al. A physical wiring diagram for the human immune system. Nature. (2022) 608:397–404. doi: 10.1038/s41586-022-05028-x
17. Tenenbaum D and Maintainer B. KEGGREST: client-side REST access to KEGG. R Package version. (2016) 1. doi: 10.18129/B9.bioc.KEGGREST
18. Errichiello E, Balsamo A, Cerni M, and Venesio T. Mitochondrial variants in MT-CO2 and D-loop instability are involved in MUTYH-associated polyposis. J Mol Med (Berl). (2015) 93:1271–81. doi: 10.1007/s00109-015-1312-0
19. Xu J, Xu X, Jiang L, Dua K, Hansbro PM, and Liu G. SARS-CoV-2 induces transcriptional signatures in human lung epithelial cells that promote lung fibrosis. Respir Res. (2020) 21:182. doi: 10.1186/s12931-020-01445-6
20. Saheb Sharif-Askari F, Saheb Sharif-Askari N, Goel S, Hafezi S, Assiri R, Al-Muhsen S, et al. SARS-CoV-2 attenuates corticosteroid sensitivity by suppressing DUSP1 expression and activating p38 MAPK pathway. Eur J Pharmacol. (2021) 908:174374. doi: 10.1016/j.ejphar.2021.174374
21. Gonzalez-Baro MR and Coleman RA. Mitochondrial acyltransferases and glycerophospholipid metabolism. Biochim Biophys Acta Mol Cell Biol Lipids. (2017) 1862:49–55. doi: 10.1016/j.bbalip.2016.06.023
22. Hanson BA, Visvabharathy L, Orban ZS, Jimenez M, Batra A, Liotta EM, et al. Plasma proteomics show altered inflammatory and mitochondrial proteins in patients with neurologic symptoms of post-acute sequelae of SARS-CoV-2 infection. Brain Behav Immun. (2023) 114:462–74. doi: 10.1016/j.bbi.2023.08.022
23. Linden J, Koch-Nolte F, and Dahl G. Purine release, metabolism, and signaling in the inflammatory response. Annu Rev Immunol. (2019) 37:325–47. doi: 10.1146/annurev-immunol-051116-052406
24. Sarohan AR, Kizil M, Inkaya AC, Mahmud S, Akram M, and Cen O. A novel hypothesis for COVID-19 pathogenesis: Retinol depletion and retinoid signaling disorder. Cell Signal. (2021) 87:110121. doi: 10.1016/j.cellsig.2021.110121
25. Haj AK, Hasan H, and Raife TJ. Heritability of protein and metabolite biomarkers associated with COVID-19 severity: A metabolomics and proteomics analysis. Biomolecules. (2022) 13:46. doi: 10.3390/biom13010046
26. Das UN. Essential fatty acids and their metabolites in the pathobiology of inflammation and its resolution. Biomolecules. (2021) 11:1873. doi: 10.3390/biom11121873
Keywords: KDDC, immune repertoire, cdr3aa, structural similarity, immune cell heterogeneity
Citation: Zhang N, Zhao S, Wu R, Luo X, Yang M, Chang Z and Xu J (2025) KDDC: a new framework that integrates kmers, dataset filtering, dimension reduction and classification algorithms to achieve immune cell heterogeneity classification. Front. Immunol. 16:1602907. doi: 10.3389/fimmu.2025.1602907
Received: 30 March 2025; Accepted: 12 May 2025;
Published: 30 May 2025.
Edited by:
Jin Bin, Shandong University, ChinaReviewed by:
Quan Zou, University of Electronic Science and Technology of China, ChinaJihan Wang, Yan’an University, China
Copyright © 2025 Zhang, Zhao, Wu, Luo, Yang, Chang and Xu. This is an open-access article distributed under the terms of the Creative Commons Attribution License (CC BY). The use, distribution or reproduction in other forums is permitted, provided the original author(s) and the copyright owner(s) are credited and that the original publication in this journal is cited, in accordance with accepted academic practice. No use, distribution or reproduction is permitted which does not comply with these terms.
*Correspondence: Jianting Xu, dGlhb2JhbjAwN0BqbHUuZWR1LmNu; Zecheng Chang, Y2hhbmd6YzIxQG1haWxzLmpsdS5lZHUuY24=