 Qiongbing Zheng
 Youmian Lan
 Jiexin Chen
 Ling Lin
- 1Department of Rheumatology and Immunology, First Affiliated Hospital of Shantou University Medical College, Shantou, China
- 2Department of Neurology, Shantou Central Hospital, Shantou, China
- 3Department of Endocrinology and Metabolism, First Affiliated Hospital of Shantou University Medical College, Shantou, China
- 4Department of Rheumatology, Shantou University Medical College, Shantou, China
Background: Rheumatoid arthritis (RA) is a common chronic joint disease. However, many patients exhibit inadequate responses to treatment due to disease heterogeneity. Identifying novel biomarkers for RA is crucial for advancing molecular diagnosis and identifying potential therapeutic targets.
Methods: Synovial tissue transcriptome data from RA patients and healthy controls were obtained from the GEO database. Differentially expressed gene (DEG) analysis, functional enrichment analysis, and weighted gene co-expression network analysis (WGCNA) identified key gene modules in RA. Machine learning algorithms were used to identify hub genes, followed by immune infiltration analysis and gene set variation analysis (GSVA). Mendelian randomization (MR) analysis explored the causal relationship between hub genes and RA. Clinical synovial tissue samples were used to validate CKAP2 expression via quantitative real-time polymerase chain reaction (qRT-PCR), western blot, and immunohistochemistry (IHC). The potential role of CKAP2 in the pathogenesis of RA was investigated through CCK-8 assay, wound healing assay, transwell migration assay and transwell invasion assay.
Results: A total of 242 DEGs were identified between 20 RA patients and 17 healthy controls. Six gene modules were recognized, with the “turquoise” module associated with RA (cor = 0.39, p = 0.00017). Three hub genes, CKAP2 (AUC = 0.876), POU2AF1 (AUC = 0.885), and HLA-DOB (AUC = 0.897), involved in the IL-6/JAK/STAT3 signaling pathway and inflammation, were identified. Immune infiltration analysis showed these genes were associated with plasma cells and T cell infiltration. MR analysis confirmed a causal relationship between CKAP2 and RA. qRT-PCR, western blot, and IHC demonstrated CKAP2 expression was higher in RA synovial tissue compared to osteoarthritis (OA) samples. Cellular functional assays demonstrated that CKAP2 knockdown inhibited the proliferation, migration, and invasion of MH7A and HFLS-RA cells.
Conclusion: CKAP2, a signature gene in RA, is highly expressed in RA synovial tissues, and contributes to the pathogenesis of RA by promoting the proliferation, migration, and invasion of MH7A and HFLS-RA cells. This gene holds potential as a novel biomarker for RA and provides valuable insights into its molecular diagnosis and targeted therapies.
Introduction
Rheumatoid arthritis (RA) is a systemic inflammatory autoimmune disease that affects about 0.5%~1% of the population, with women being 3~5 times more likely to be affected than men (1–3). The pathogenesis of RA is multifactorial, involving genetic, environmental, and immunologic factors that contribute to both initiation and progression of the disease (4, 5). These processes lead to synovial inflammation and hyperplasia, which ultimately results in joint destruction, swelling, pain, and symmetric polyarthritis, impairing the patient’s quality of life (6–8). Although current anti-cytokine therapies have improved disease control and prognosis, the complexity of pathogenesis and its heterogeneity still results in many patients experiencing inadequate responses to treatment (9, 10). Thus, identifying novel RA biomarkers and developing more effective molecular diagnostic and therapeutic strategies remain of paramount importance.
The advent of gene microarray technology and high-throughput techniques has made bioinformatics methods crucial for the effective identification of differentially expressed genes (DEGs) (11). In recent years, machine learning has been increasingly utilized to address complex challenges in the biomedical field. The integration of bioinformatics analysis with machine learning presents valuable opportunities to enhance the accuracy, reliability, and predictability of disease diagnosis (12–14). Mendelian randomization (MR) is a method that overcomes the limitations of observational studies to identify potential causal relationships between exposure and outcome, making it a widely used tool in causal association research (15, 16).
Cytoskeleton-associated protein 2 (CKAP2) encodes a protein that stabilizes microtubules and plays a crucial role in the regulation of cytokinesis, which is closely linked to cellular proliferative activity, migration, and invasion (17–19). Previous studies have shown that CKAP2 expression is elevated in various cancers, including gastric adenocarcinoma, lung adenocarcinoma, hepatocellular carcinoma, cervical carcinoma, and breast carcinoma, where it influences tumor cell proliferation, migration and invasion (20–24). In the progression of RA, proliferation, migration and invasion of fibroblast-like synoviocytes (FLS) are key factors contributing to synovial hyperplasia and joint destruction (25, 26). However, the role of CKAP2 in RA is unknown and whether CKAP2 can participate in proliferation, migration and invasion in FLS yet to be investigated.
In this study, we employed machine learning algorithms combined with bioinformatics analysis and MR analysis to identify genes causally associated with RA. The expression of these hub genes in RA was subsequently validated using clinical tissue samples, and their potential role in RA pathogenesis was further explored through cellular functional assays. This research aimed to identify novel biomarkers for RA and provide new insights into its molecular diagnosis and targeted therapies.
Materials and methods
Data collection and processing
The microarray dataset for RA was retrieved from the GEO database of the National Center for Biotechnology Information (NCBI) (http://www.ncbi.nlm.nih.gov/geo/) using the search term “rheumatoid arthritis.” The selection criteria were as follows: (1) the study type involved expression profiling via microarrays, (2) the tissue type was synovial tissue, and (3) the organism was Homo sapiens. To minimize the influence of biological disease-modifying anti-rheumatic drugs (bDMARDs), only pre-treatment samples were included (27, 28). In total, four gene expression datasets (GSE206848, GSE55235, GSE172188, and GSE12021) were identified as suitable. The GSE206848, GSE55235, and GSE172188 datasets were used as the training set, consisting of 20 RA patients and 17 healthy controls, while the GSE12021 dataset served as the validation set, comprising 12 RA patients, 9 healthy controls, and 10 osteoarthritis (OA) patients. Information on patient age and sex is provided in Supplementary Table S1.
The “GEOquery” package was employed to convert the probe matrix into a gene expression matrix, using probe annotation files. If multiple probes corresponded to the same gene, the expression values of the first probe were retained. Given that these three datasets were derived from different platforms and exhibited batch effects, the “sva” package was utilized to correct for platform-related batch effects.
Identification of DEGs and functional enrichment analysis
The “limma” package was employed to analyze DEGs between RA patients and healthy controls. The selection criteria for DEGs included a p < 0.05 and an absolute fold change > 2. Functional enrichment analysis of Gene Ontology (GO) terms and Kyoto Encyclopedia of Genes and Genomes (KEGG) pathways for the upregulated DEGs was performed using the “clusterProfiler” package in R. Pathways with p < 0.05 was considered significantly enriched.
Weighted gene co-expression network analysis for the DEGs
We used the R package “WGCNA” to construct a weighted gene co-expression network for the DEGs. The soft threshold was selected using the “pickSoftThreshold” algorithm to build the gene co-expression modules. Each module contained at least 5 genes, with any remaining ungrouped genes assigned to the grey module. We calculated the correlation coefficients between modules and phenotypes to identify modules closely associated with RA. Additionally, gene significance and module membership were assessed to evaluate the relationship between gene modules and RA patients.
Screening of hub genes by machine learning algorithms
We employed machine learning algorithms for hub gene selection, including the random forest (RF) model (29) and least absolute shrinkage and selection operator (LASSO) regression (14).
The RF model is a decision tree-based machine learning approach. In this study, we utilized R package “randomForest” to build the random forest model. To determine the optimal number of variables, we computed the average error rate of candidate module genes. We then evaluated the error rate across a range of tree numbers, from 1 to 1000, and selected the number of trees that yielded the lowest error rate. Finally, we determined the feature importance scores for each candidate gene in the significant modules and selected genes with importance values greater than 0.
LASSO regression is a widely used machine learning algorithm for fitting generalized linear models. By applying an L1 penalty (λ), coefficients of less important variables are set to zero, thereby selecting the most important variables and building optimal classification models. In our study, we performed LASSO regression analysis on the candidate genes using R package “glmnet” to identify hub genes. The optimal value of λ was determined through tenfold cross-validation, selecting the value that resulted in the smallest standard error.
Diagnostic value of hub genes in RA
To evaluate the diagnostic accuracy of hub genes selected through machine learning algorithms, we employed the R package “pROC” to plot receiver operating characteristic (ROC) curves comparing RA patients with healthy controls in the training set. The area under the curve (AUC) was used to assess the diagnostic accuracy of these genes as potential hub genes for RA, with a larger AUC indicating higher accuracy. This analysis was subsequently validated in the independent validation set. Furthermore, to assess the specificity of the hub genes for RA diagnosis, we plotted ROC curves comparing RA patients to OA controls in the validation set. Expression levels of the hub genes in RA patients and controls were visualized using box plots generated by R package “ggplot2.”
Gene set variation analysis and immune infiltration analysis of hub genes
We conducted gene set variation analysis using the R package “GSVA” to explore the correlation between hub genes and hallmark signaling pathways. Subsequently, we applied the CIBERSORT algorithm to determine the infiltration of different immune cells in RA synovial tissues and healthy controls. Spearman correlation coefficients were then used to analyze the relationships between hub genes and immune cell types.
Identification of the causal relationship between signature genes and RA via MR analysis
Data source
In this study, we performed MR analysis using data from the IEU Open GWAS database (https://gwas.mrcieu.ac.uk). It is important to note that the participants in the studies included in the IEU Open GWAS database provided informed consent. GWAS data for the CKAP2, POU2AF1, and HLA-DOB genes were obtained from the following GWAS IDs: eqtl-a-ENSG00000136108, eqtl-a-ENSG00000110777, and eqtl-a-ENSG00000241106, respectively. Additionally, the UC GWAS database (GWAS ID: ebi-a-GCST90018910) contributed data for 417,256 individuals of European ancestry, including 8,255 RA patients and 409,001 healthy controls.
Instrumental variables selection
In MR analysis, IVs derived from genetic variants are used to obtain unbiased estimates of the causal effects of the exposure variable on the outcome variable. To begin, we identified single nucleotide polymorphisms (SNPs) that were significantly associated with the exposure variable (p < 5×10⁻⁸) as IVs for MR analysis. SNPs in linkage disequilibrium (LD) within a 10,000 kb distance and with an R² < 0.01 were excluded. The strength of the IVs was assessed using the F-statistic: F = (N- k-1)R²/[k(1 - R²)], where R² represents the proportion of variance in the exposure explained by each IV. An F-value greater than 10 indicates sufficient statistical power to retain the instrument.
MR analysis
To validate the causal relationship between exposure and outcome, our study employed R package “TwoSampleMR” for two-sample MR analysis, utilizing several MR methods, including inverse variance-weighted (IVW), weighted median (WM), MR-Egger, simple mode, and weighted mode. The IVW method was primarily used due to its superior statistical efficiency compared to the other methods and its ability to consistently estimate the causal effect of the exposure on the outcome.
Clinical samples
Twelve participants were recruited for this study from the First Affiliated Hospital of Shantou University Medical College, comprising 6 RA patients and 6 OA patients. The age and sex information of the participants can be found in Supplementary Table S1. Synovial tissue samples were collected from each participant during joint surgery. Our study protocol was approved by the Ethics Committee of the First Affiliated Hospital of Shantou University Medical College (Approval No. B-2024-060). Informed consent was obtained from all enrolled patients.
RNA isolation and quantitative real-time polymerase chain reaction
Total RNA was extracted from tissue samples using TRIzol (TIANGEN, China) according to the manufacturer’s instructions. RNA was then reverse transcribed into complementary DNA (cDNA) using cDNA Synthesis SuperMix for qPCR (YEASEN, China). qRT-PCR reactions were conducted using Advanced qPCR SYBR Green Master Mix (YEASEN, China). β-Actin was used as an internal control, and relative mRNA quantification was calculated using the 2−ΔΔCt method. Primer sequences used for qRT-PCR are listed in Supplementary Table S2.
Western blot
Total protein was extracted from synovial tissue using RIPA buffer (YEASEN, China) supplemented with protease and phosphatase inhibitors (P002, NCM Biotech, China). Briefly, protein samples were separated by 10% SDS-polyacrylamide gel electrophoresis and transferred onto PVDF membranes. After blocking with 5% non-fat milk, the membranes were incubated overnight at 4°C with primary antibodies: GAPDH (1:10000, 10494-1-AP, Proteintech, USA) and CKAP2 (1:2000, 25486-1-AP, Proteintech, USA), followed by incubation with secondary antibodies at room temperature for 2 hour. Target proteins were detected using an ECL kit (4AW011-200, 4A Biotech, China).
Hematoxylin and eosin staining and immunohistochemistry
Synovial tissue was fixed in 4% paraformaldehyde, embedded in paraffin, and sectioned into 4 μm-thick slices. The tissue sections were deparaffinized and dehydrated in xylene. For H&E staining, sections were stained with hematoxylin (G1100, Solarbio) and eosin (G1140, Solarbio). IHC was performed using an IHC Kit (KIT-9710, MXB Biotechnologies, China). The primary antibody used was CKAP2 (1:800, PS13605M, Abmart, China). Sections were stained using a DAB Detection Kit (DAB-0031, MXB, China) and counterstained with hematoxylin. Neutral resin was applied to seal the sections, and slides were imaged in the Department of Pathology of Shantou Central Hospital using a digital slide scanner (Pannoramic SCAN, 3DHISTECH Ltd, Hungary).
Cell culture and transfection
The MH7A (human rheumatoid arthritis synovial cell line) and HFLS-RA cells (human fibroblast-like synoviocytes: rheumatoid arthritis) were purchased from Shanghai Guan&Dao Biological Engineering Co., Ltd. (Shanghai, China). The passage number of all cell lines used for the experiments was no greater than 10. All cell lines were maintained in DMEM (Gibco, USA) supplemented with 10% fetal bovine serum (Gibco, USA), at 37°C under 5% CO2. For CKAP2 knockdown, shRNA sequences targeting CKAP2 or a scramble sequence were cloned into an pLKO.1-puro lentiviral cloning vector (Guangzhou IGE Biotechnology Co., Ltd., China). The shRNA and scramble sequences are shown in Supplementary Table S3. The virus was packaged in HEK293T cells after transfection with lentiviral packaging vectors using EZ Cell Transfection Reagent II (Shanghai Life-iLab Biotech, China), and then used to infect MH7A and HFLS-RA cells. Transfected cells were selected with puromycin (2 µg/mL) for one week, and expression levels of the target RNA were confirmed by qRT-PCR.
CCK-8 assay
Cell proliferation was assessed using the Cell Counting Kit-8 (CCK-8) assay (YEASEN, China) according to the manufacturer’s protocol. RA cells were seeded in 96-well plates at a density of 3,000 cells per well. Once the cells had adhered, CCK-8 solution (10 µL) was added to 90 µL of serum-free medium at 0, 24, 48, 72, and 96 hours, followed by a 2-hour incubation at 37°C. Absorbance at 450 nm was measured to determine the optical density (OD) values. Cell proliferation was calculated as follows: cell proliferation = absorbance value at each time point/absorbance value at 0 hours.
Wound healing assay
Cells were digested with trypsin, counted, and seeded at a density of 1 × 10⁷ cells per well in a 6-well plate, allowing them to grow until confluence. A scratch wound was made using a 200 µL pipette tip. Closure of the wound was monitored at 0, 24, and 48 or 72 hours to assess cell migration.
Transwell assay
A transwell assay was used to measure cell invasion and migration. Cells were digested with trypsin, and 4 × 10⁴ cells were seeded into the upper chamber of a transwell insert containing serum-free culture medium (for the migration assay) or pre-coated with Matrigel (for the invasion assay). The lower chamber was filled with complete medium to stimulate cell migration. After 48 hours of incubation, the medium and non-migrated or non-invaded cells in the upper chamber were removed. The remaining cells were fixed and stained with 0.1% crystal violet. Migration or invasion was quantified by counting the cells in five random fields at 200X magnification on each membrane.
Statistical analysis
Data were analyzed using R software (version 4.3.0) and GraphPad Prism (version 9.5.1). Continuous variables were compared using t-tests or Wilcoxon tests, while categorical variables were evaluated using chi-square tests. Statistical significance was defined as p < 0.05 (two-sided).
Results
Identification of DEGs between RA and healthy controls and functional enrichment analysis
Microarray datasets GSE206848, GSE55235, and GSE172188 were obtained from the GEO database, comprising a total of 20 RA patients and 17 healthy controls. After rigorous quality control, the batch effect was effectively eliminated, ensuring a robust foundation for subsequent analyses (Figures 1A, B). Differential expression gene analysis revealed 242 DEGs in RA, with 146 upregulated genes, and 96 downregulated genes. Volcano plots and heatmaps further highlighted the differences in gene expression profiles between RA patients and healthy controls (Figures 1C, D). Functional enrichment analysis was conducted on the 146 upregulated genes. GO enrichment analysis revealed that these genes were enriched in pathways related to white blood cell-mediated immunity, immunological synapse formation, immunoglobulin complex, and chemokine activity, indicating their potential involvement in immune responses. In KEGG enrichment analysis, the most significantly enriched pathway was associated with RA, with additional pathways related to Th1 and Th2 cell differentiation and type 1 diabetes, all of which are closely linked to immune responses or immune-related diseases (Figures 1E, F).
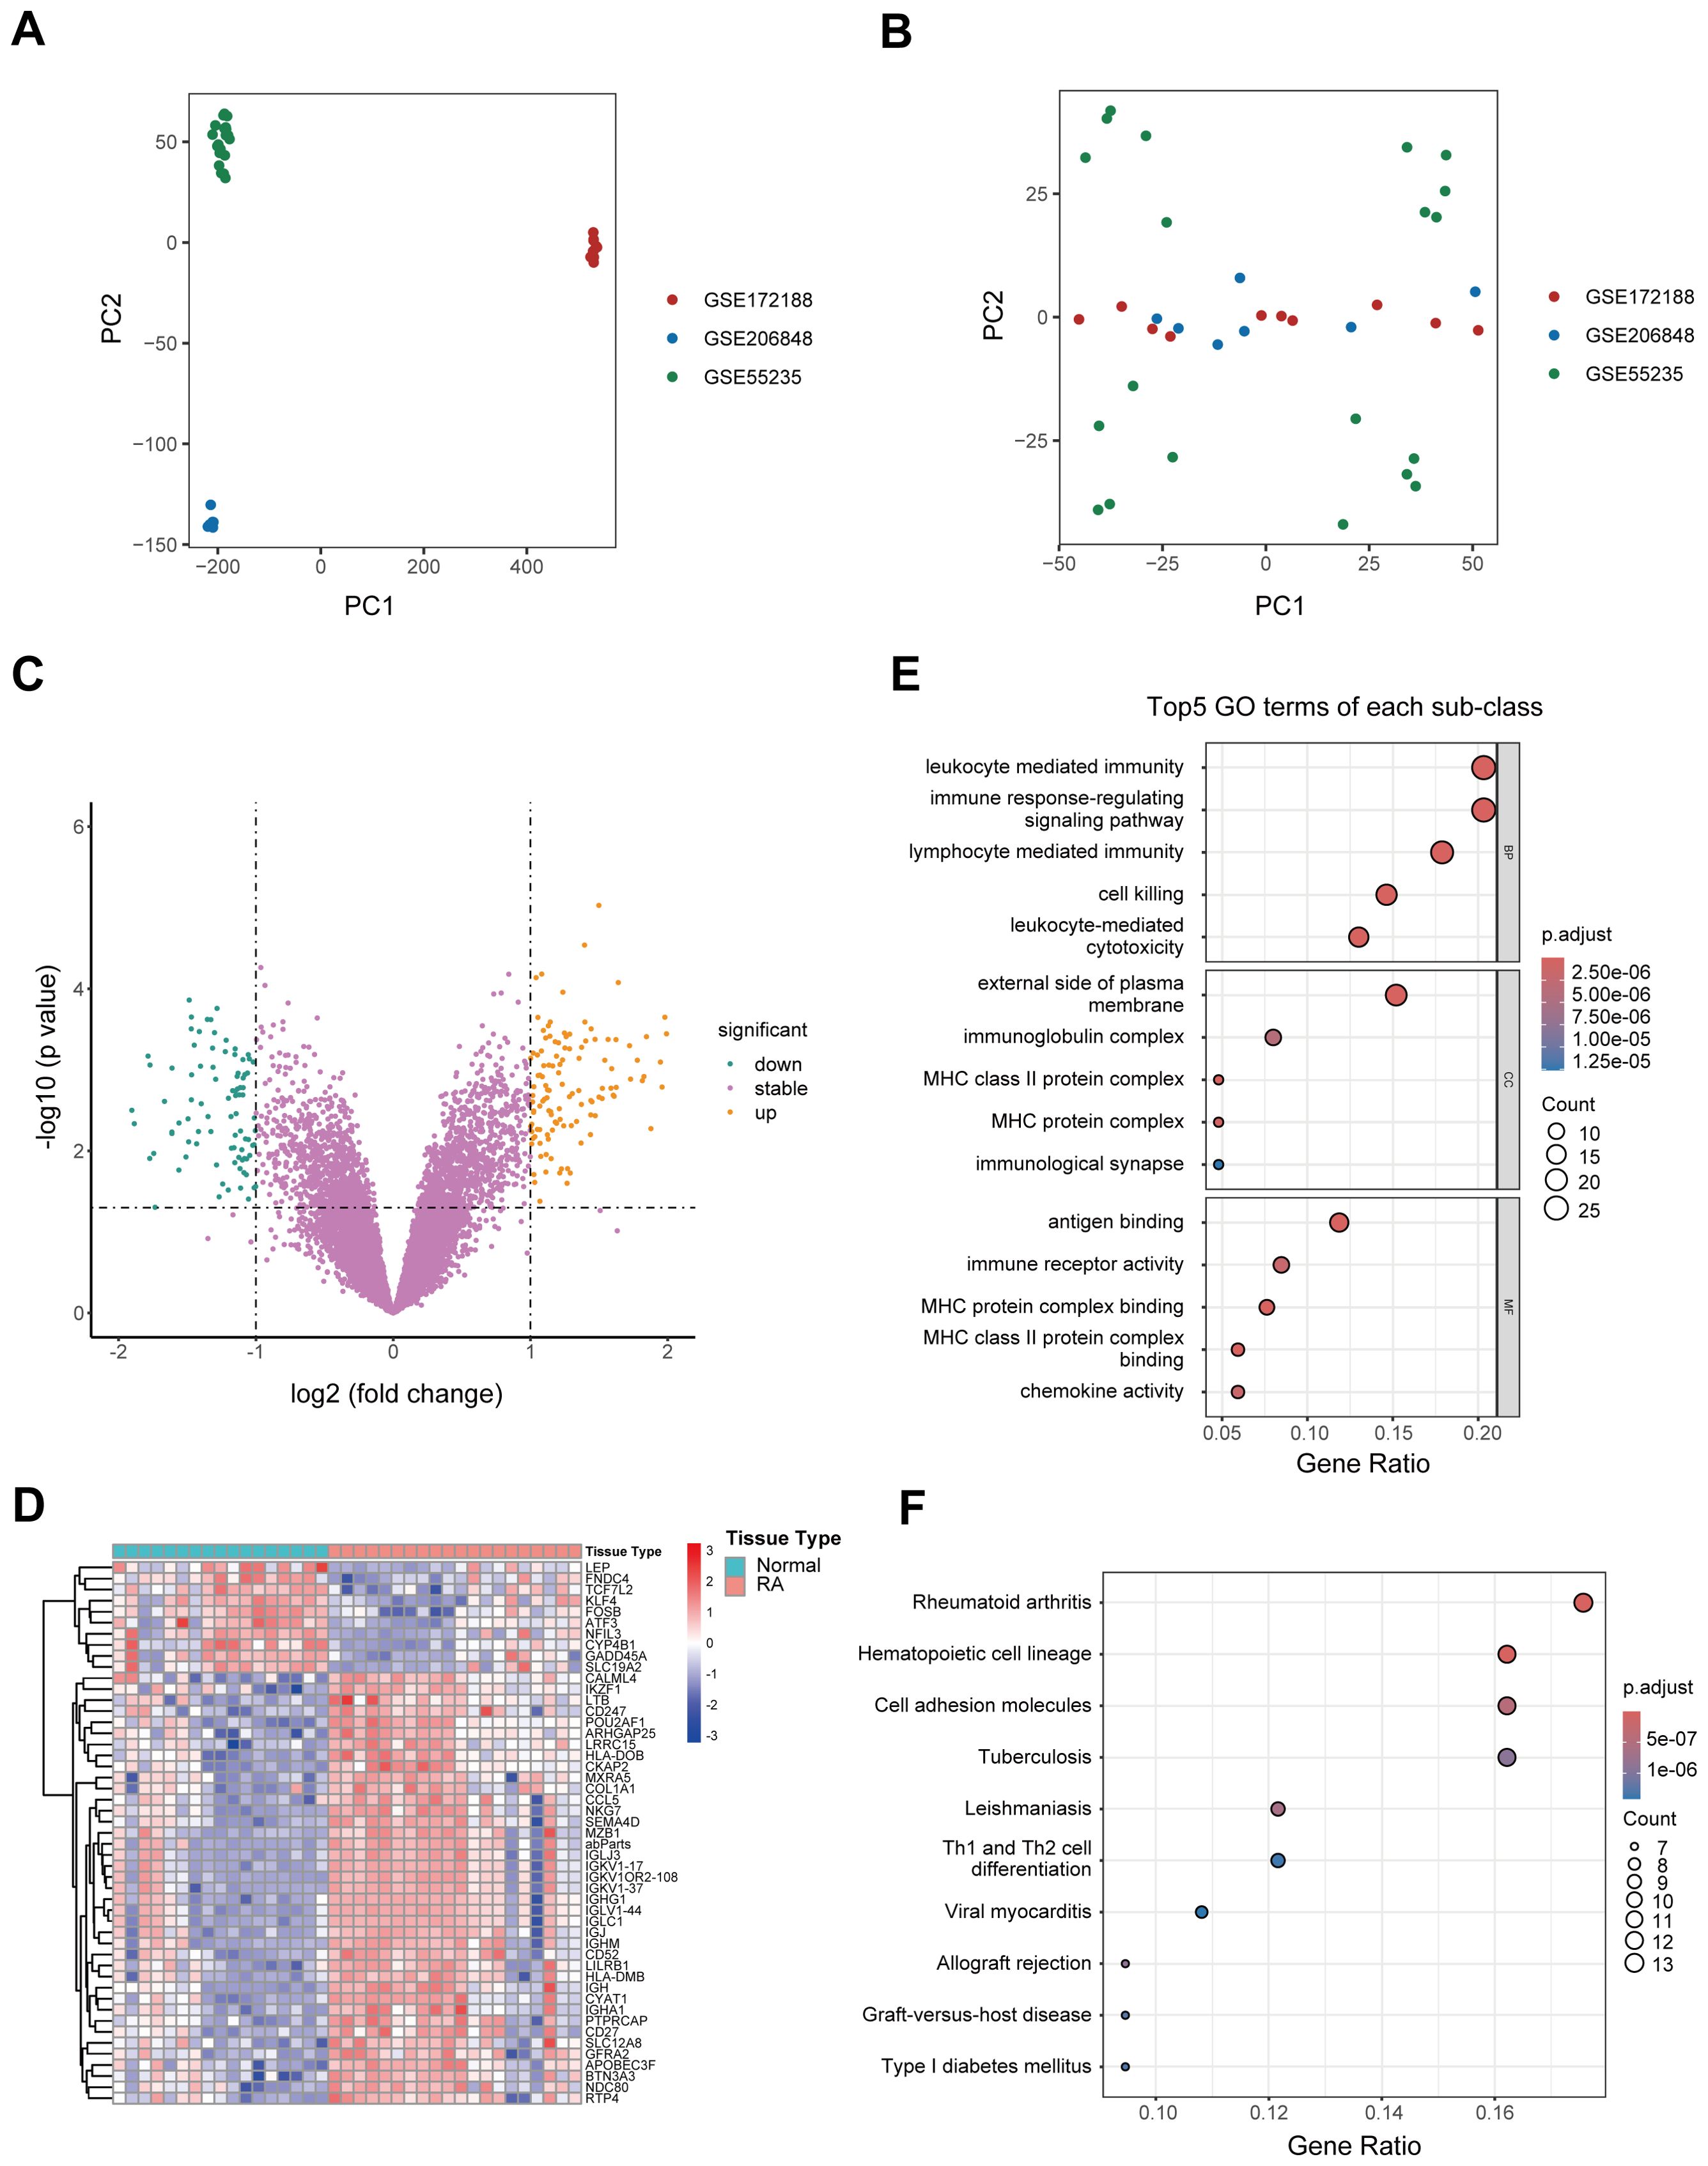
Figure 1. Identification of DEGs and functional enrichment analysis. (A, B) PCA plots illustrating the efficiency of batch effect removal [(A) before; (B) after]. (C) Volcano plot depicting the expression of DEGs between RA patients and healthy controls. (D) Heatmap illustrating the top genes characterized by the highest standard deviation changes between RA patients and healthy controls. (E) Bubble plot showing the top 5 upregulated GO terms in RA patients relative to healthy controls. (F) Bubble plot depicting significantly upregulated KEGG pathways in RA patients compared to healthy controls. DEG, Differentially expressed gene; GO, Gene Ontology; KEGG, Kyoto Encyclopedia of Genes and Genomes; PCA, Principal component analysis; RA, Rheumatoid arthritis.
Identification of hub genes in RA using WGCNA, RF and LASSO regression analysis
To identify hub genes associated with RA, we performed WGCNA on the DEGs between healthy and RA synovial tissues. A soft threshold of 16 was set to ensure a scale-free network distribution (Figure 2A). By evaluating gene correlations, we constructed a hierarchical clustering dendrogram, revealing 6 distinct gene modules with similar co-expression patterns (Figure 2B). The “turquoise” module exhibited a correlation coefficient of 0.60 and a p of 8 × 10⁻⁵ with the RA, indicating a strong association between the module’s gene expression and RA (Figure 2C). Furthermore, within the “turquoise” module, a significant correlation was observed between gene significance and module membership, with a correlation coefficient of 0.39 and a p of 0.00017 (Figure 2D). As a result, the “turquoise” module was identified as a key module associated with RA.
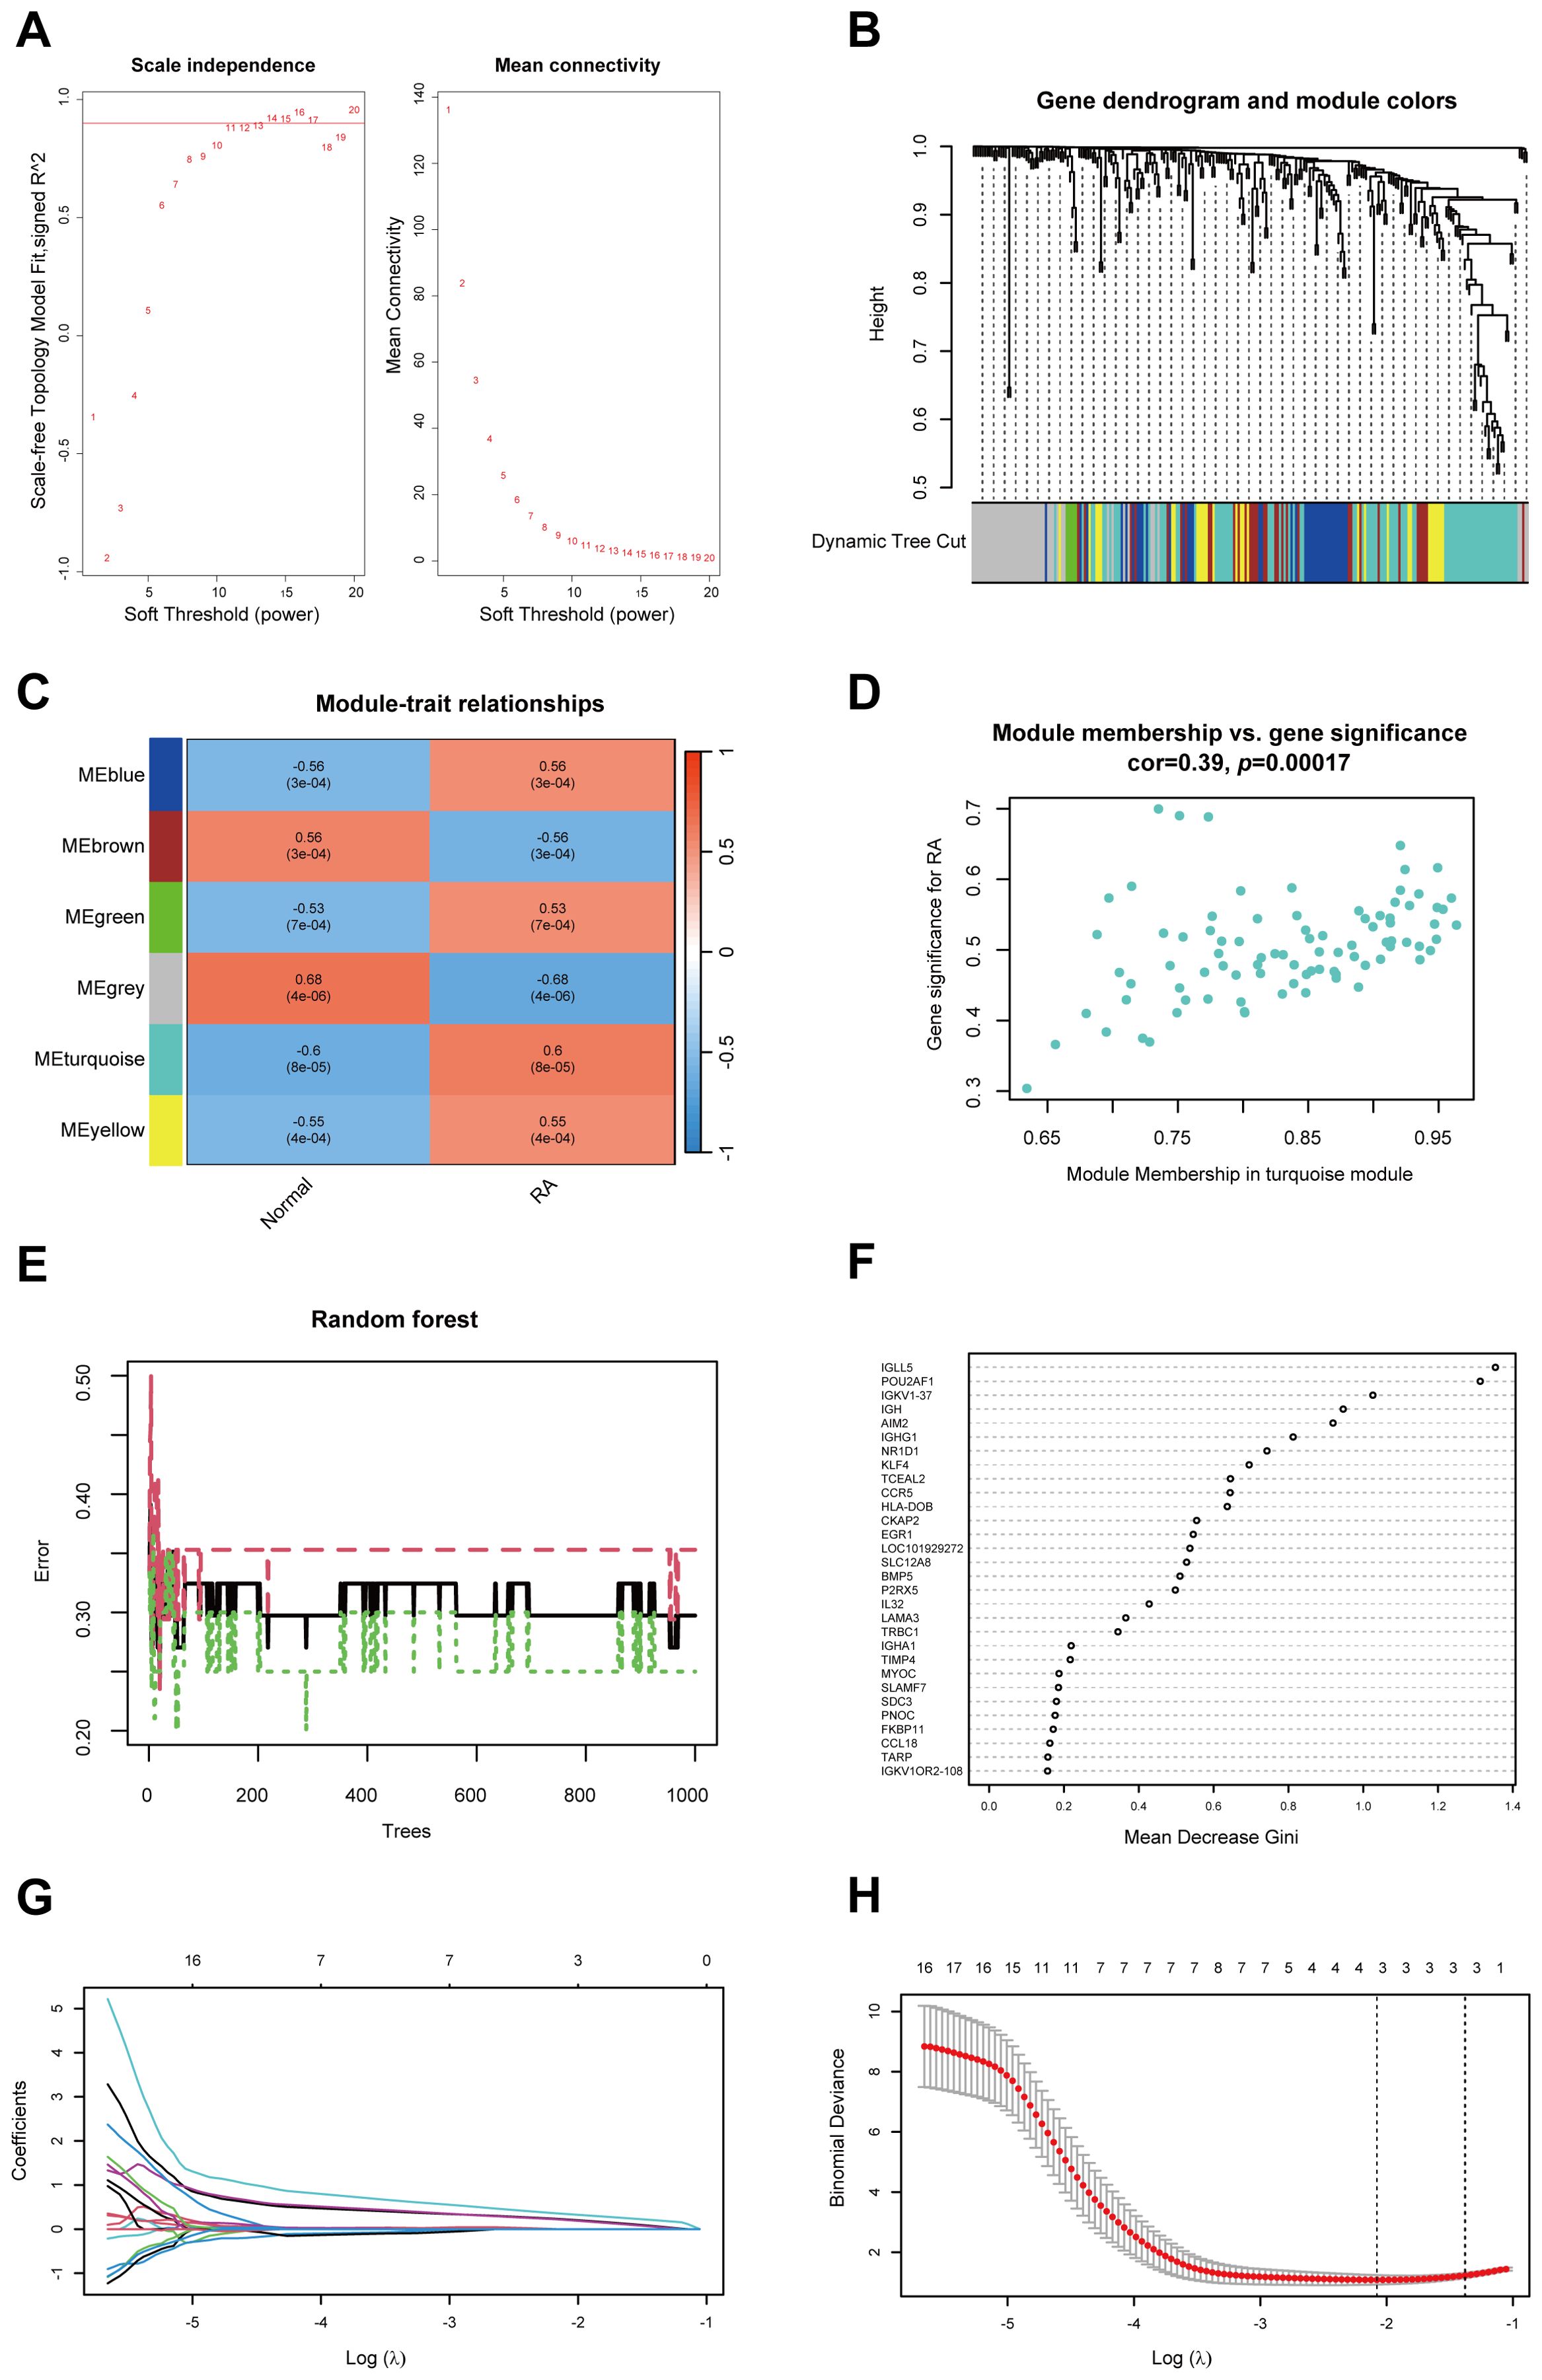
Figure 2. Identification of hub genes in RA using WGCNA, RF and LASSO regression. (A) Soft threshold power (left) and mean connectivity (right) of WGCNA. (B) Cluster dendrogram derived from WGCNA. (C) Heatmap depicting the relationship between modules and RA. (D) Scatter plot between gene significance and module members in the turquoise module. (E) Confidence intervals for error rates in the RF models within the training group. (F) Feature importance plot illustrating the relative importance of genes in the RF model. (G) Path diagram of LASSO coefficients for hub genes associated with RA identified through the RF model. (H) LASSO regression cross-validation curve with optimal λ values determined by 10-fold cross-validation. WGCNA, Weighted gene co-expression network analysis; RA, Rheumatoid arthritis; RF, Random forest; LASSO, Least absolute shrinkage and selection operator.
To further identify hub genes in RA, we applied the RF method and identified 56 core genes (Figures 2E, F). Subsequently, LASSO regression analysis was conducted, leading to the identification of 3 hub genes: CKAP2, POU2AF1, and HLA-DOB, all of which were selected as hub genes associated with RA (Figures 2G, H).
Evaluation and validation of hub genes
To assess the diagnostic efficacy of the identified hub genes, we performed ROC curve analysis. In the training set, the AUC values were 0.876 for CKAP2, 0.885 for POU2AF1, and 0.897 for HLA-DOB (Figure 3A). In the validation set, compared to healthy controls, the AUC values were 0.898 for CKAP2, 0.935 for POU2AF1, and 0.898 for HLA-DOB (Figure 3B). Additionally, to evaluate the specificity of the hub genes for RA, we compared RA to OA in the validation set and calculated the AUC values for the hub genes. The results showed AUC values of 0.808 for CKAP2, 0.833 for POU2AF1, and 0.750 for HLA-DOB (Figure 3C). These findings indicate that the 3 hub genes possess high diagnostic value for RA patients, regardless of whether they are compared with healthy controls or OA controls. Furthermore, we compared the expression profiles of the hub genes in RA patients, healthy controls, and OA controls in both the training and validation sets. The results demonstrated that these hub genes were expressed at higher levels in RA patients (Supplementary Figures S1A–C).
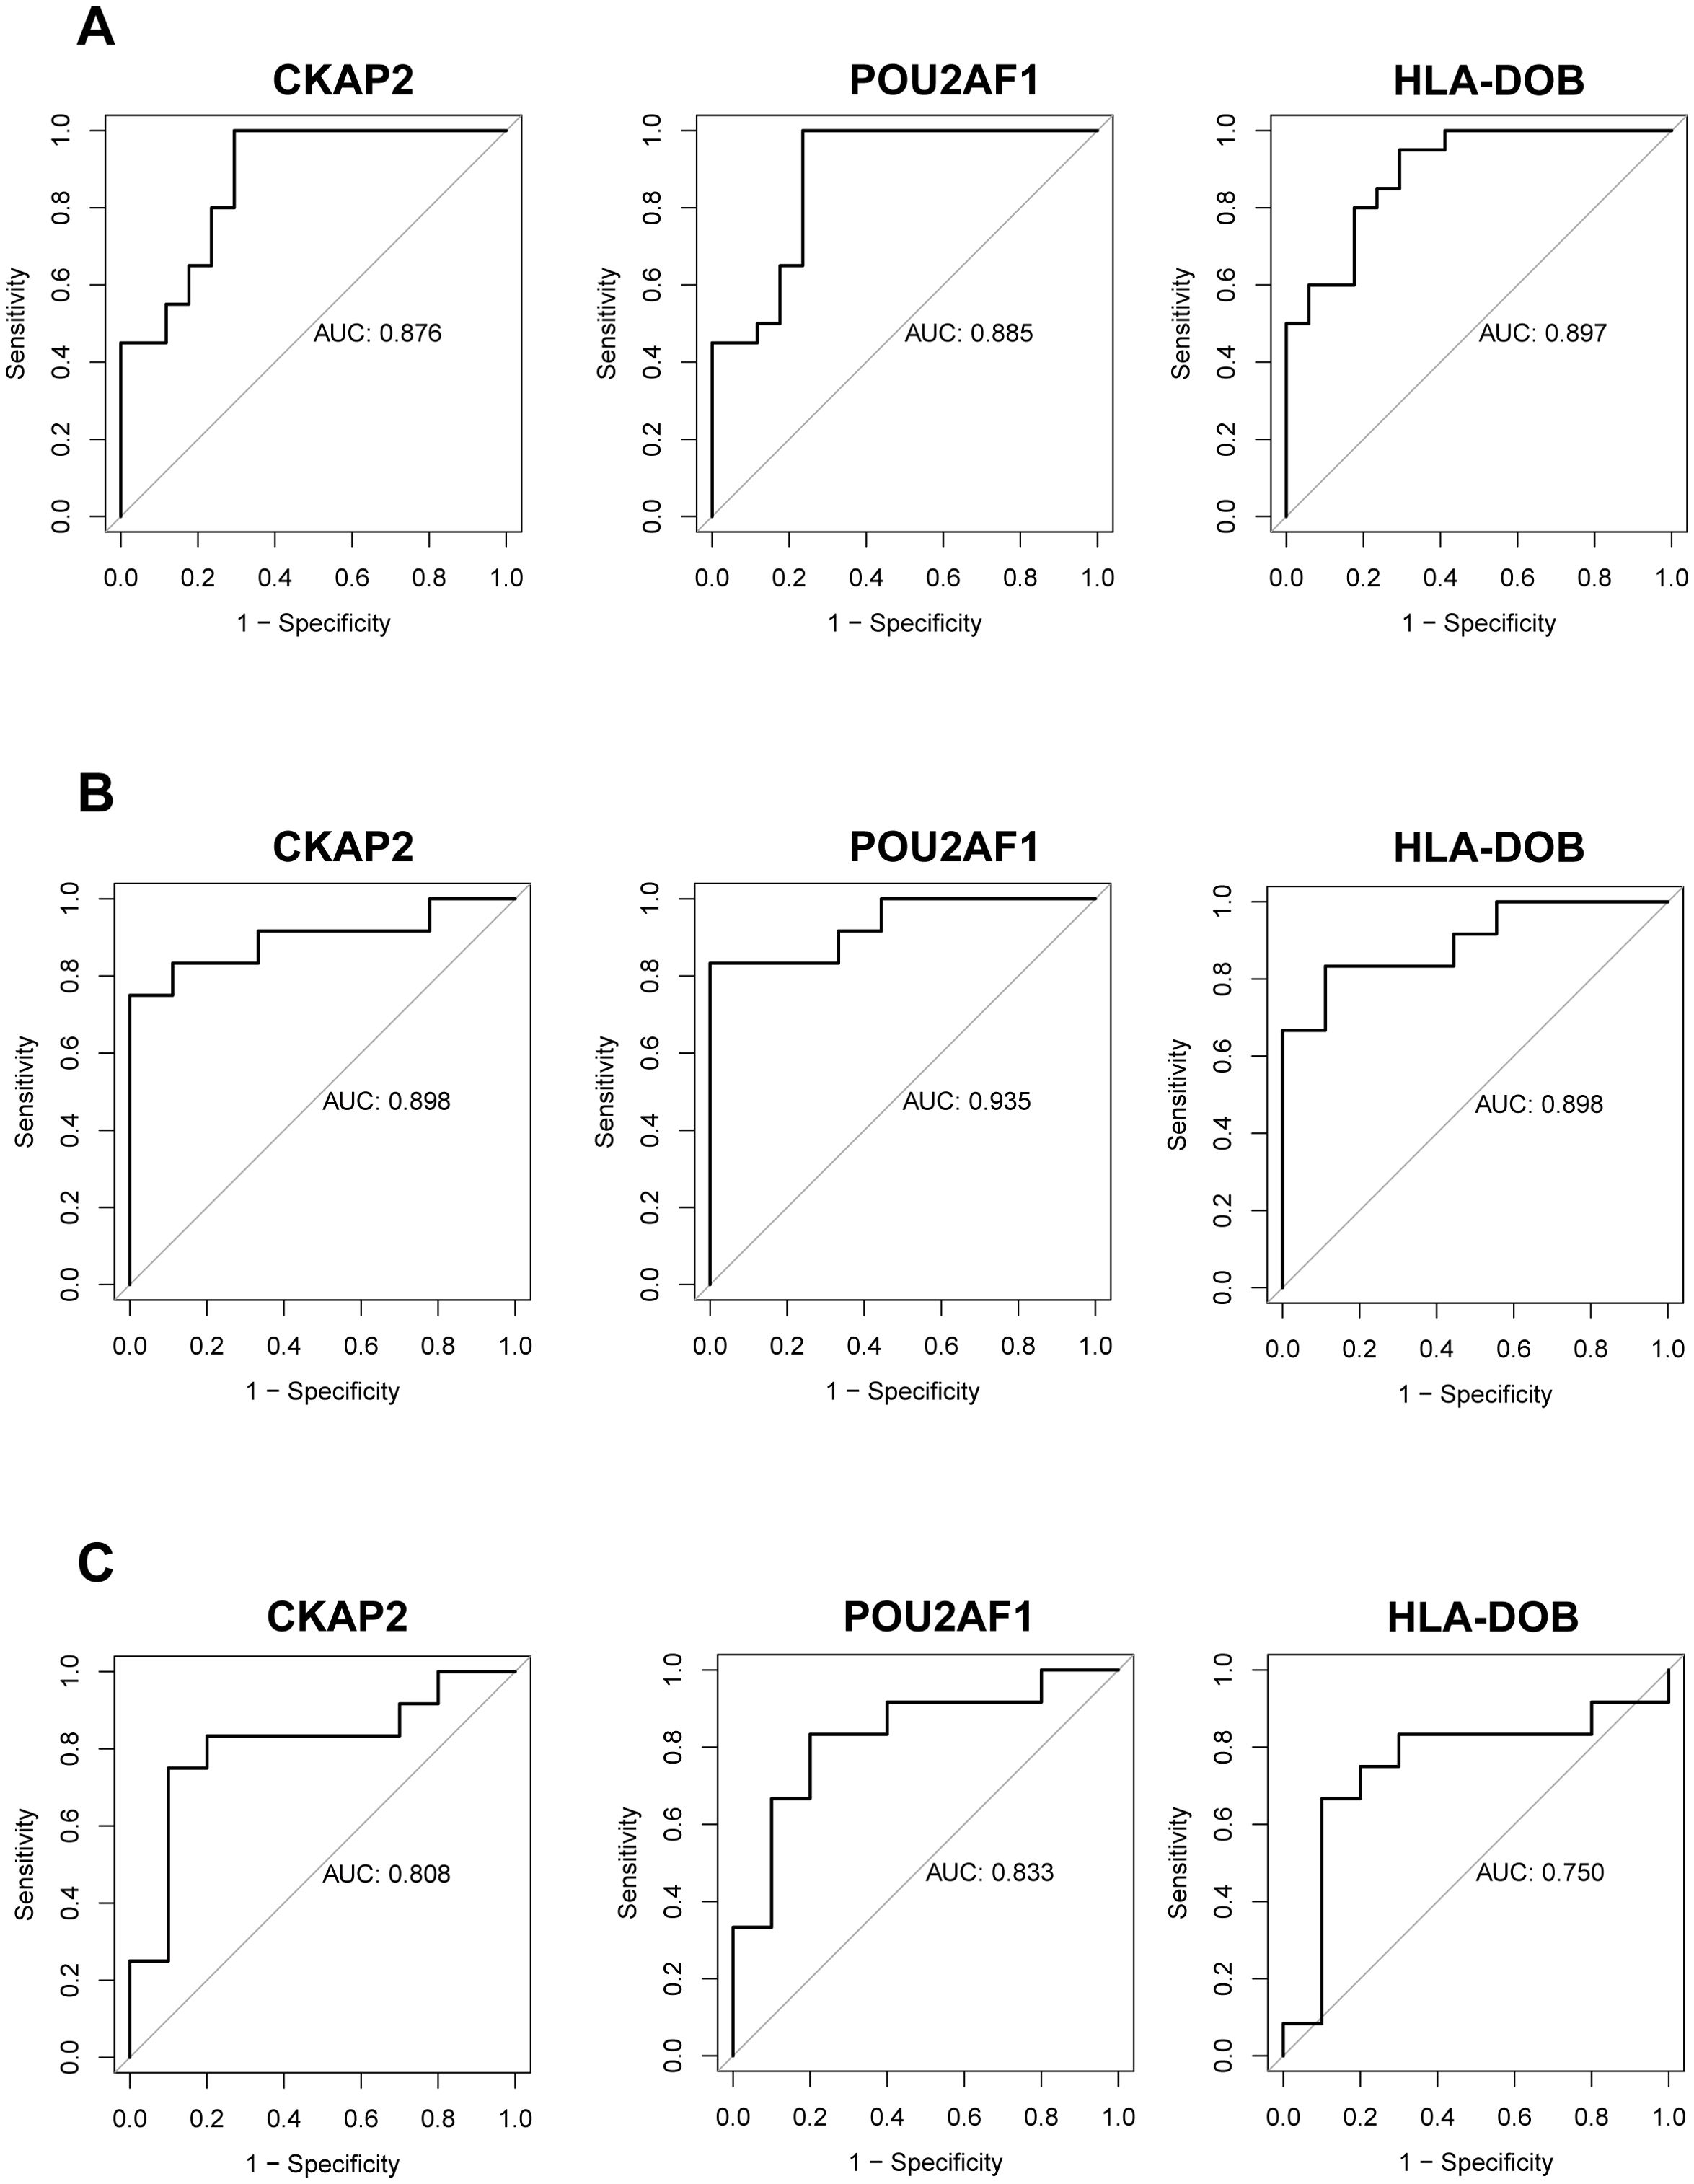
Figure 3. Evaluation and validation of hub genes. (A) ROC analysis of the three hub genes in RA patients compared to healthy controls within the training group. (B) ROC analysis of the same hub genes in RA patients vs. healthy controls in the validation group. (C) ROC analysis of the hub genes in RA patients vs. OA patients in the validation group. OA, Osteoarthritis; RA, Rheumatoid arthritis; ROC, Receiver operating characteristic.
Immune infiltration and GSVA analysis of hub genes
The CIBERSORT algorithm revealed significant differences in immune cell infiltration between RA patients and healthy controls in the synovium. Specifically, RA patients exhibited markedly increased infiltration of plasma cells (p = 0.011) and follicular helper T (Tfh) cells (p = 0.033), while healthy controls showed higher levels of resting memory CD4+ T cells (p = 0.016), activated NK cells (p = 0.040), and activated mast cells (p = 0.004). A relatively large proportion of M2 macrophages were found in both RA patients and healthy controls, but they were not statistically different (Figure 4A). Further analysis of immune cell infiltration in RA revealed associations between 3 hub genes and specific immune cell types. These genes were positively correlated with the infiltration of plasma cells, Tfh cells, and activated CD4+ T cells, while showing negative correlations with the infiltration of resting memory CD4+ T cells, activated NK cells, and activated mast cells (Figure 4B).
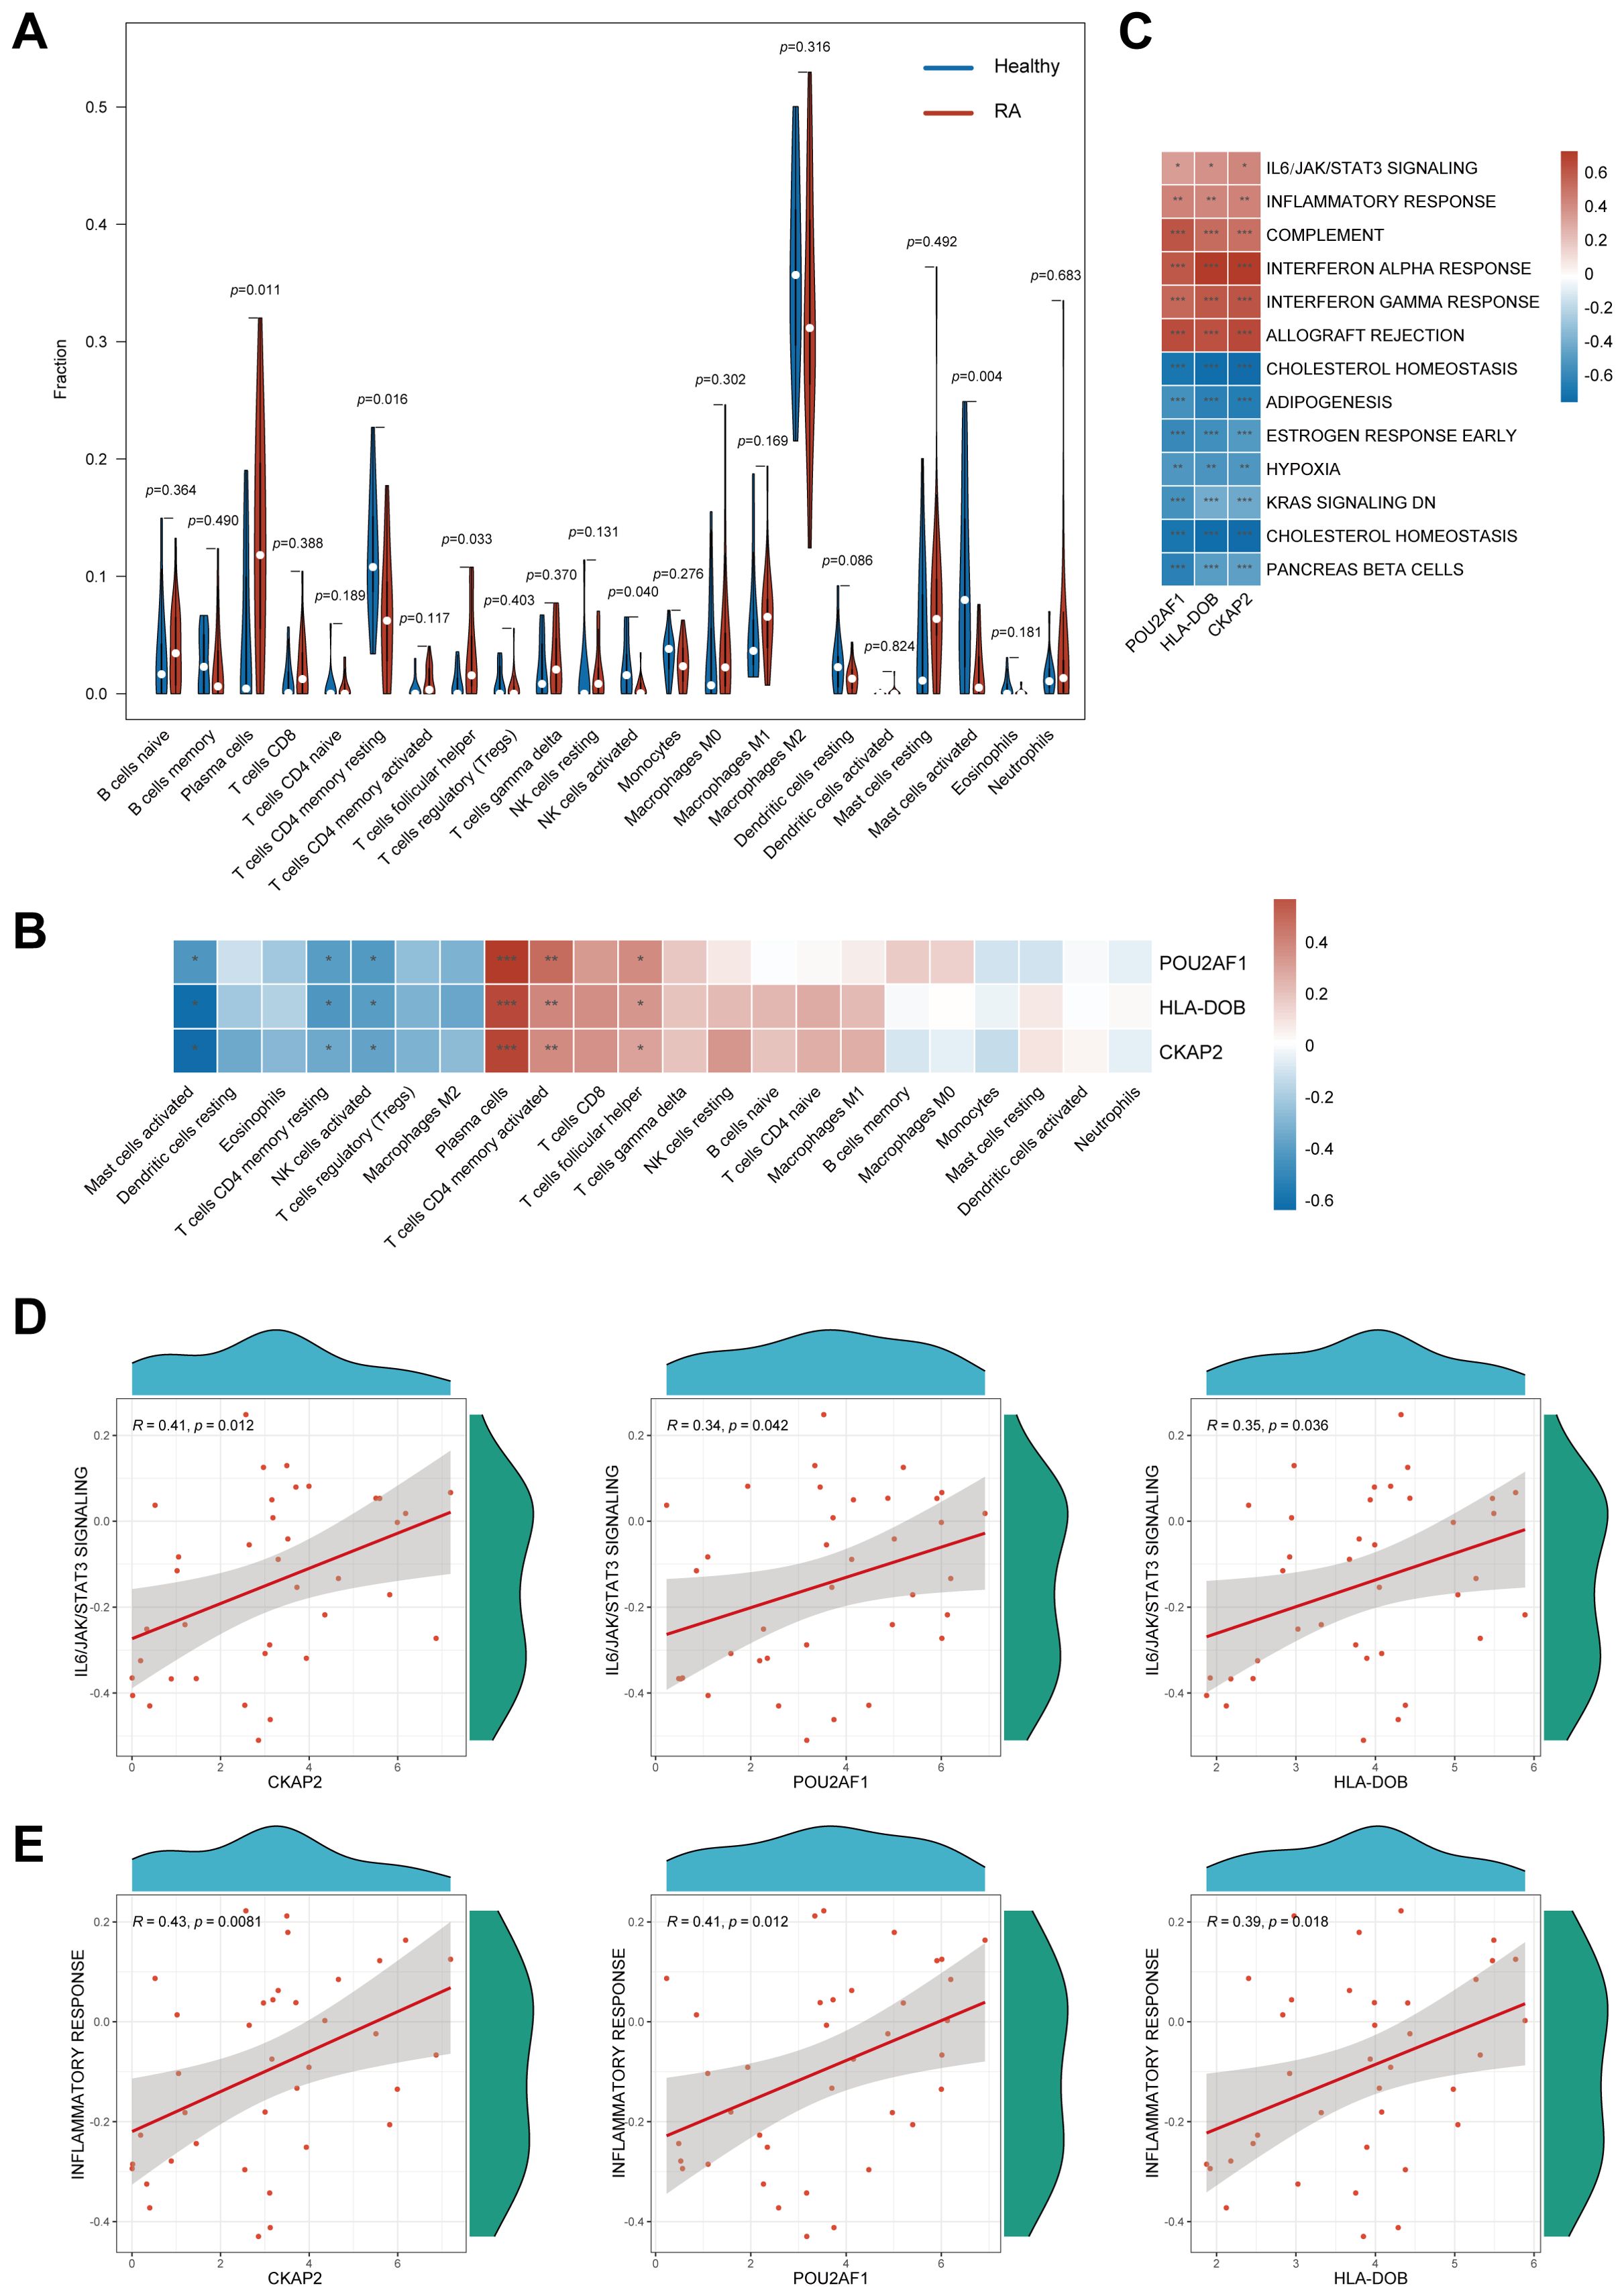
Figure 4. Immune infiltration analysis and GSVA of hub genes. (A) Immune cell infiltration profiles between RA patients and normal controls. (B) Association between the three hub genes and various immune cell infiltrates. (C) GSVA of hub genes. (D) Association of the 3 hub genes with IL6/JAK/STAT3 signaling pathways. (E) Association of the 3 hub genes with inflammatory response. GSVA, Gene set variation analysis; RA, Rheumatoid arthritis; *, p < 0.05; **, p < 0.01; ***, p < 0.001.
GSVA demonstrated that CKAP2, POU2AF1, and HLA-DOB were associated with pathways, such as IL6/JAK/STAT3 signaling, and involved in inflammatory response, complement activation, and interferon response (Figure 4C). Scatter plots with Spearman correlation analysis were performed to compare the relationship between the hub genes and the IL6/JAK/STAT3 signaling pathway, as well as the inflammatory response (Figures 4D, E).
MR analysis to identify the causal relationship between CKAP2 and RA
MR analysis integrates GWAS and expression quantitative trait locus (eQTL) data, and was used to investigate the association between RA and the eQTLs of CKAP2, POU2AF1, and HLA-DOB. Results from the IVW, WM, and weighted models consistently supported a positive correlation between CKAP2 and RA (Figure 5A). A scatter plot illustrating the SNP effect size for CKAP2 and RA shows the SNP effect on CKAP2 along the x-axis and the SNP effect on RA along the y-axis (Figure 5B). MR-Egger analysis revealed no evidence of horizontal pleiotropy (p = 0.77, Figure 5C, Supplementary Table S4). The funnel plot demonstrated no significant heterogeneity among the SNPs (p < 0.05, Figure 5D, Supplementary Table S5). Leave-one-out analysis indicated that individual SNPs did not influence the MR analysis results (Figure 5E). These findings support a positive causal relationship between CKAP2 and RA.
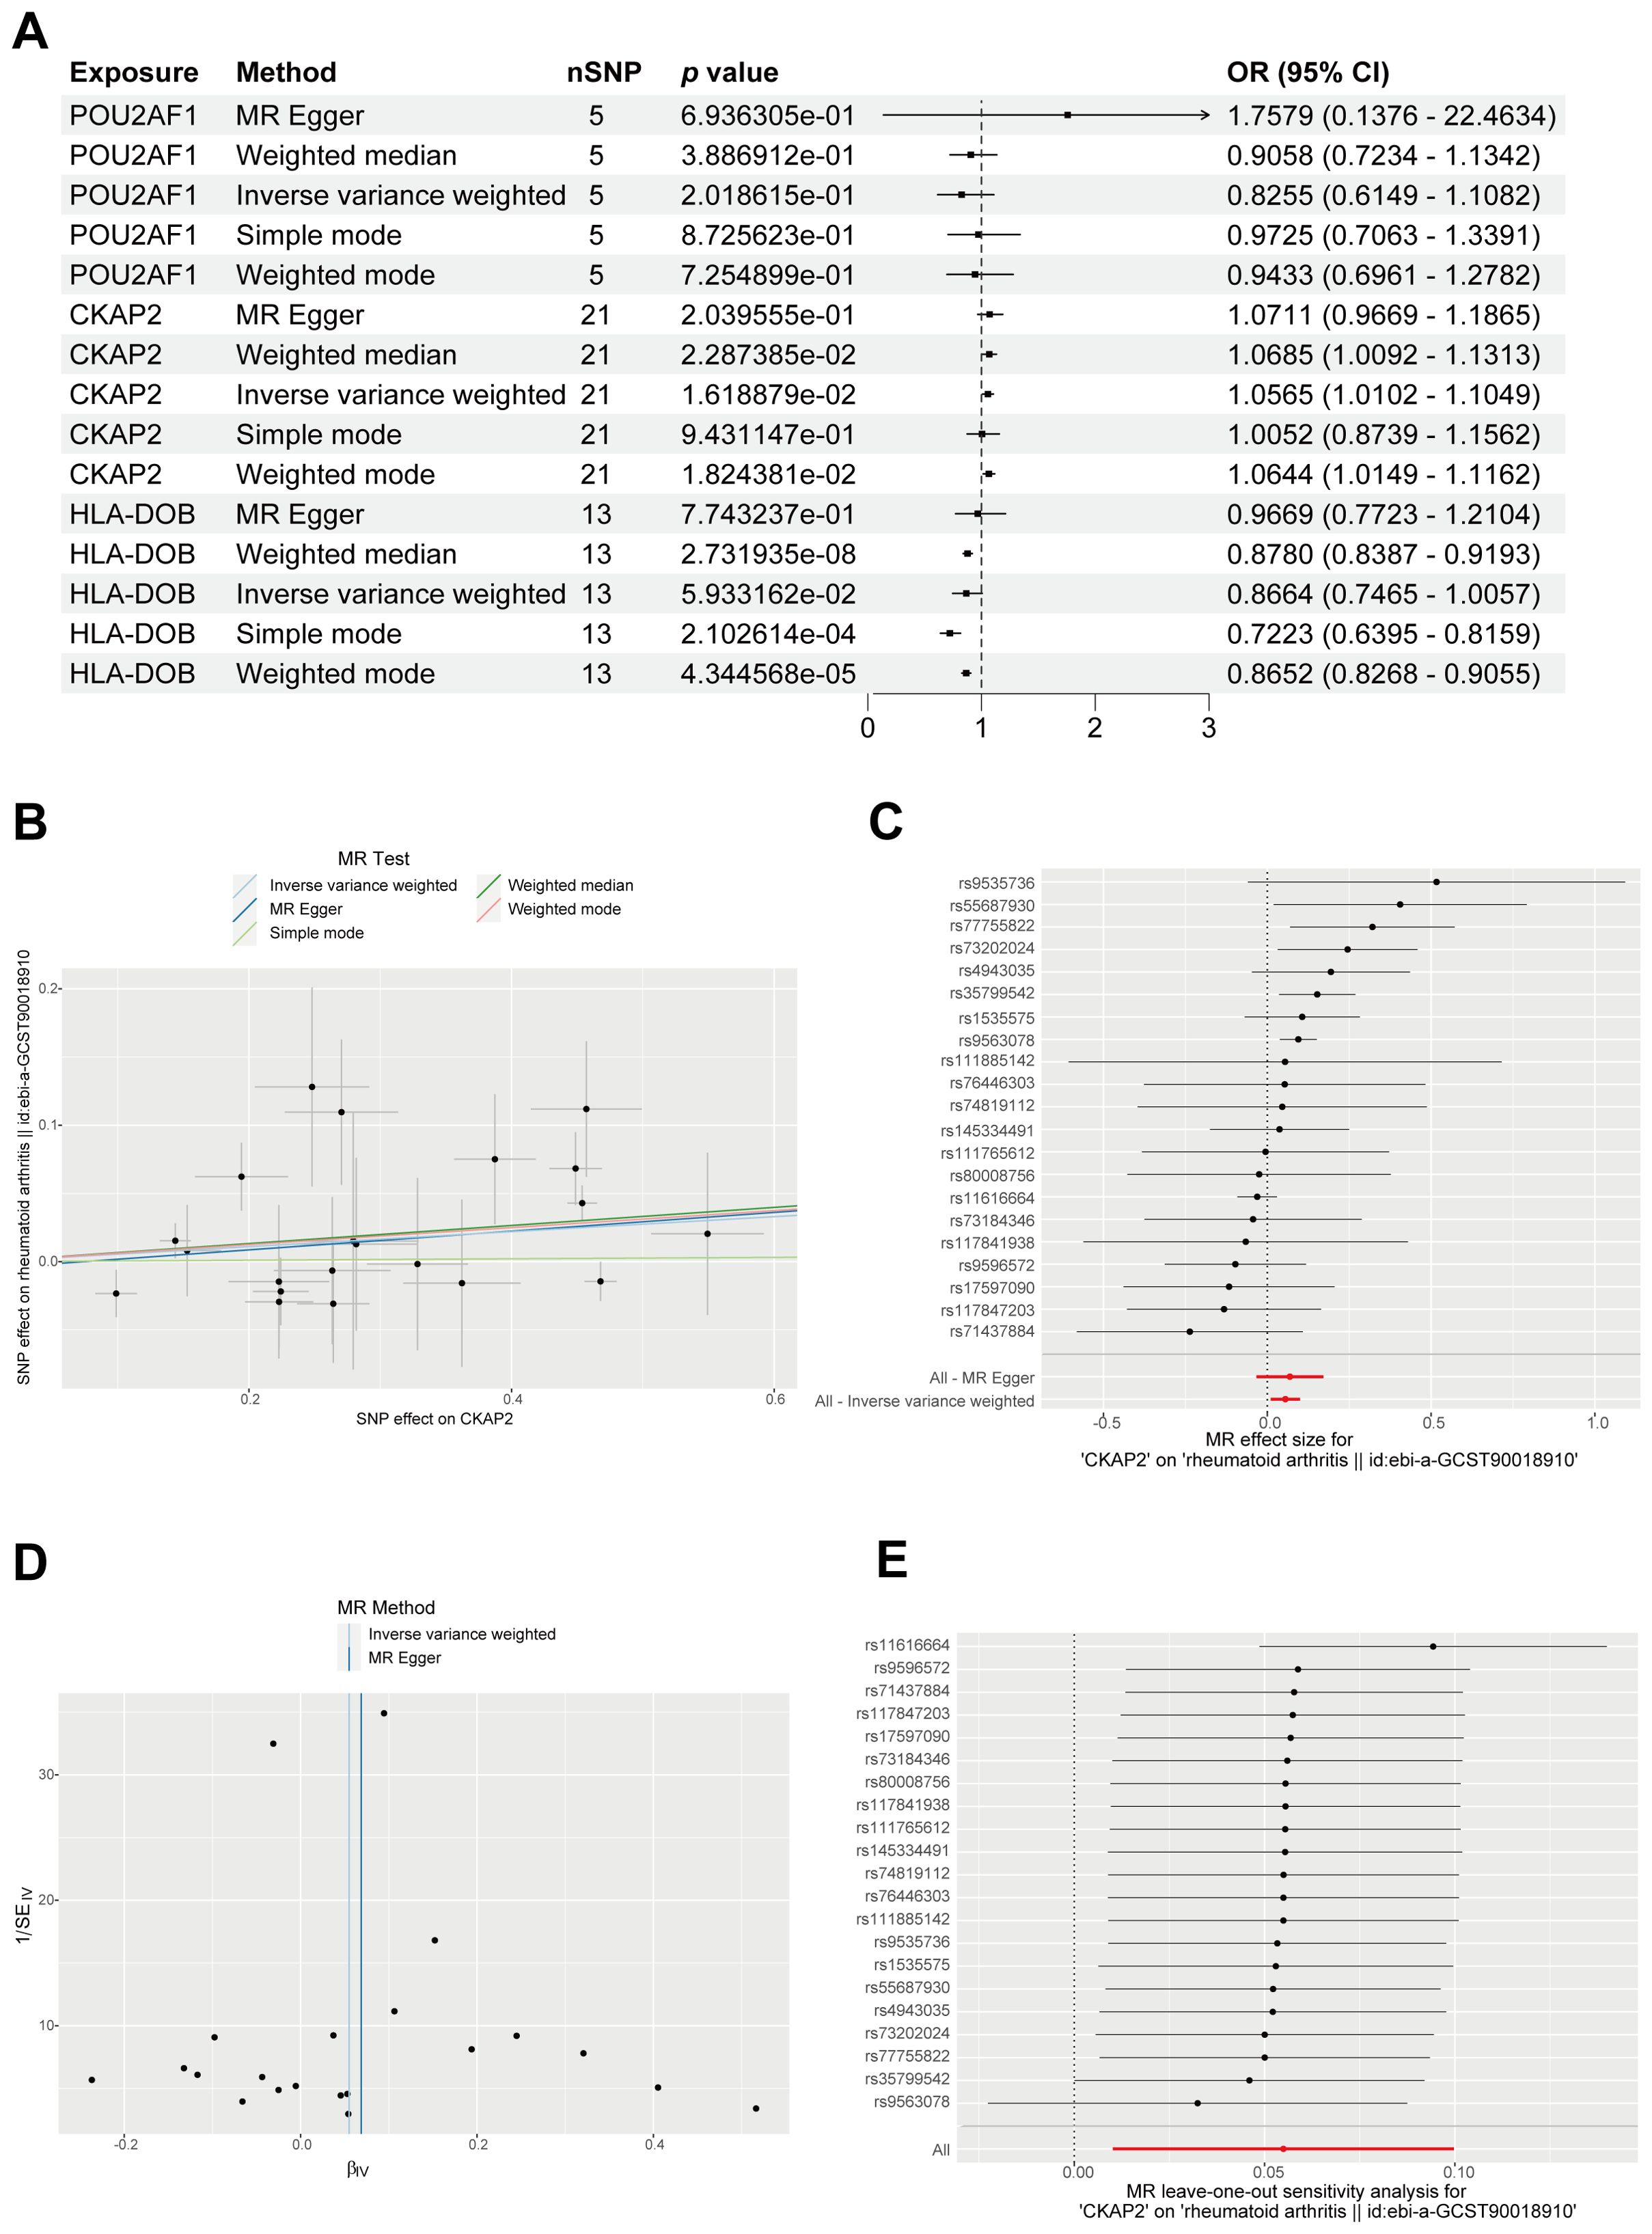
Figure 5. MR analysis identifying the genetically linked gene CKAP2. (A) Forest plot displaying causal effects between the 3 hub genes and RA through multiple MR methods. (B) Scatter plot, employing 5 methods, illustrating causal estimates of CKAP2 on RA. (C) Forest plot for MR pleiotropy testing. (D) MR funnel plot showcasing IVW and MR-Egger methods. (E) Leave-one-out sensitivity analysis forest plot for MR. IVW, Inverse variance-weighted; MR, Mendelian randomization; RA, Rheumatoid arthritis.
CKAP2 expression is increased in synovial tissues from RA patients
We examined CKAP2 expression levels in synovial tissues from patients with RA and OA. qRT-PCR and western blot analyses revealed an upregulation of CKAP2 mRNA (Figure 6A) and protein (Figure 6B) in RA synovial tissues. Histopathological analysis using H&E staining showed marked synovial hyperplasia and increased immune cell infiltration in RA compared to OA (Figure 6C). IHC confirmed CKAP2 expression in both RA and OA synovium, with higher expression in RA synovium, compared to OA synovium (Figure 6D). To determine whether CKAP2 expression is specific to synovial tissue, we analyzed CKAP2 expression levels in peripheral blood mononuclear cells from 232 RA patients and 43 healthy controls using the GSE93777 dataset. No significant difference was observed between the two groups (Supplementary Figure S2).
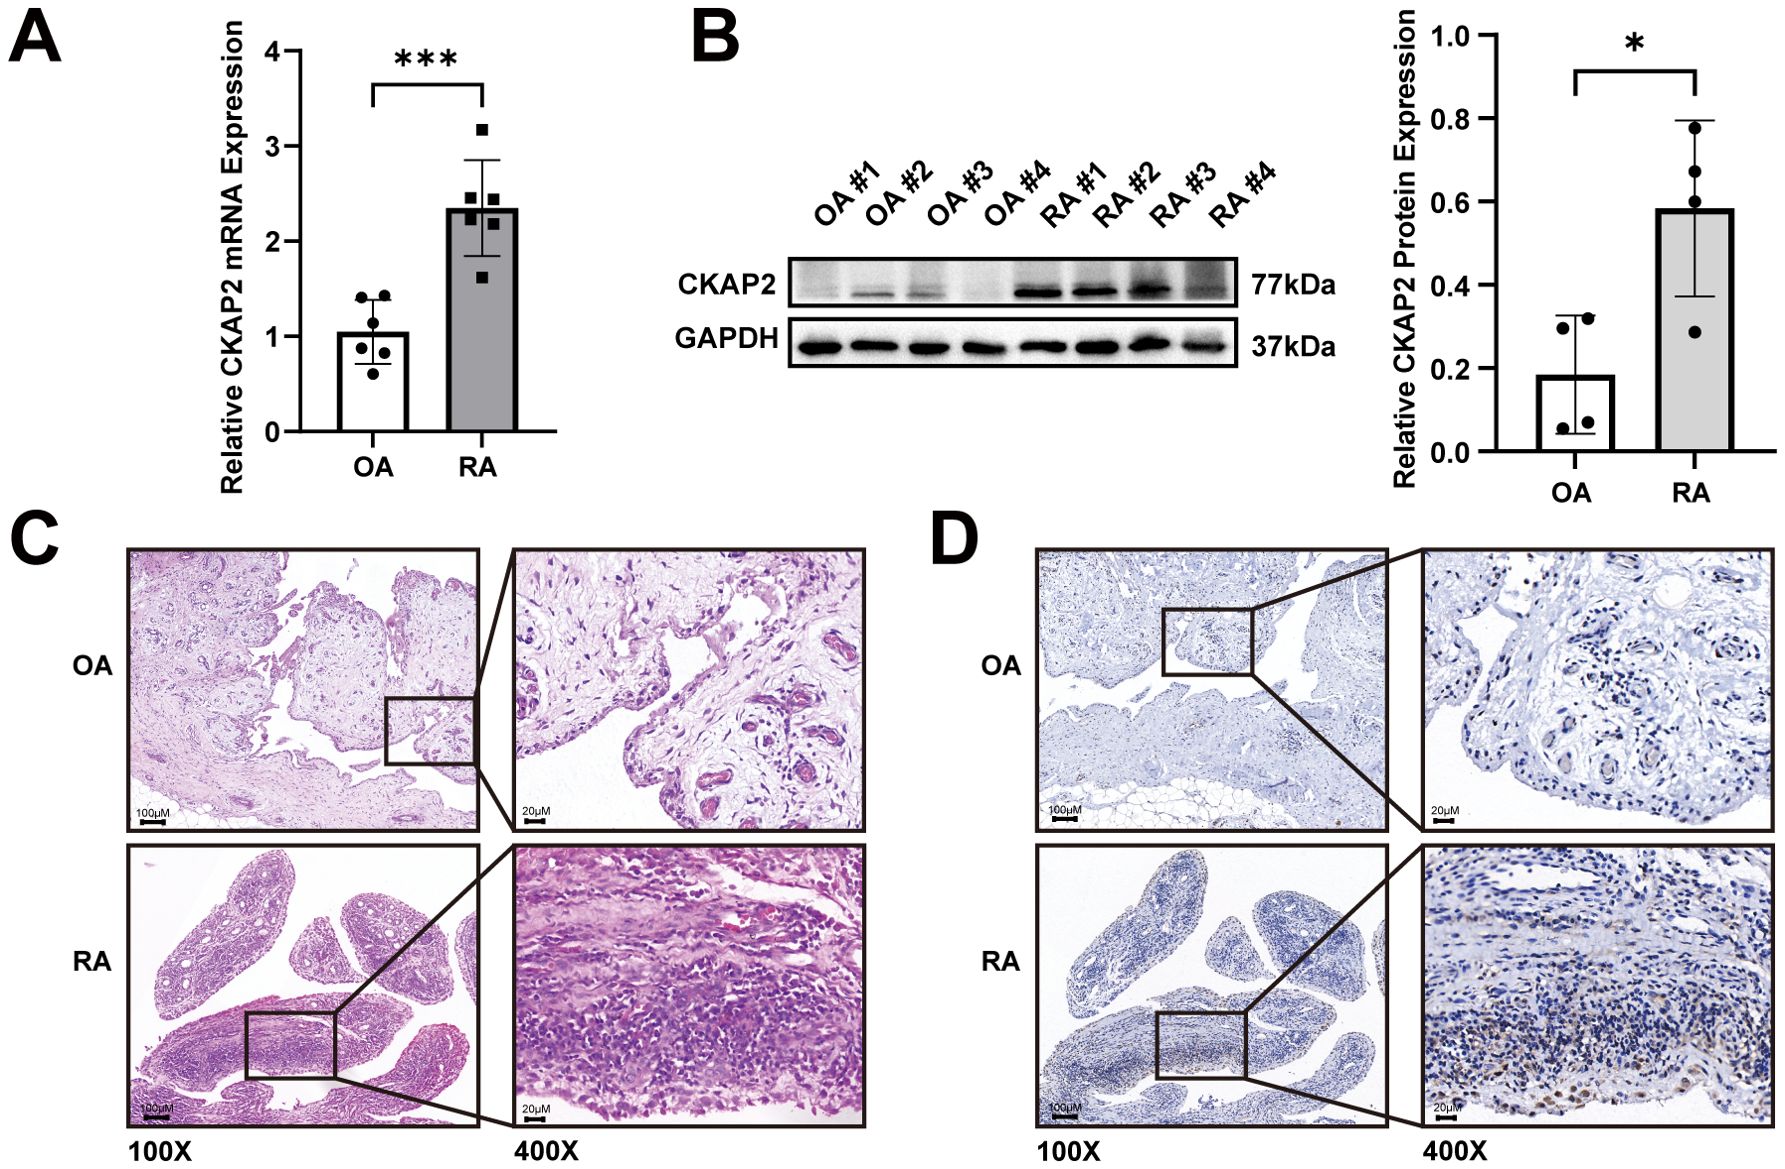
Figure 6. CKAP2 expression is increased in synovial tissues from RA patients. (A) CKAP2 mRNA expression in synovial tissues from RA and OA patients. (B) Western blot analysis revealing CKAP2 protein levels in synovial tissues from RA and OA patients. (C) H&E staining for CKAP2 in synovial tissues from RA and OA patients. (D) IHC staining for CKAP2 in synovial tissues from RA and OA patients. H&E, Hematoxylin and eosin; IHC, Immunohistochemistry; OA, Osteoarthritis; RA, Rheumatoid arthritis. *, p < 0.05; ***, p < 0.001.
CKAP2 promotes the proliferation, migration and invasion of MH7A and HFLS-RA cells
We knocked down CKAP2 in MH7A and HFLS-RA cells, using shRNA, and validated the extent of silencing by qRT-PCR. The results indicated that CKAP2 expression was reduced in the shCKAP2 groups compared to the scramble group.
Meanwhile, CKAP2 sh3 showed the superior silencing efficiency and was thus selected for subsequent experiments. (Figures 7A, B).
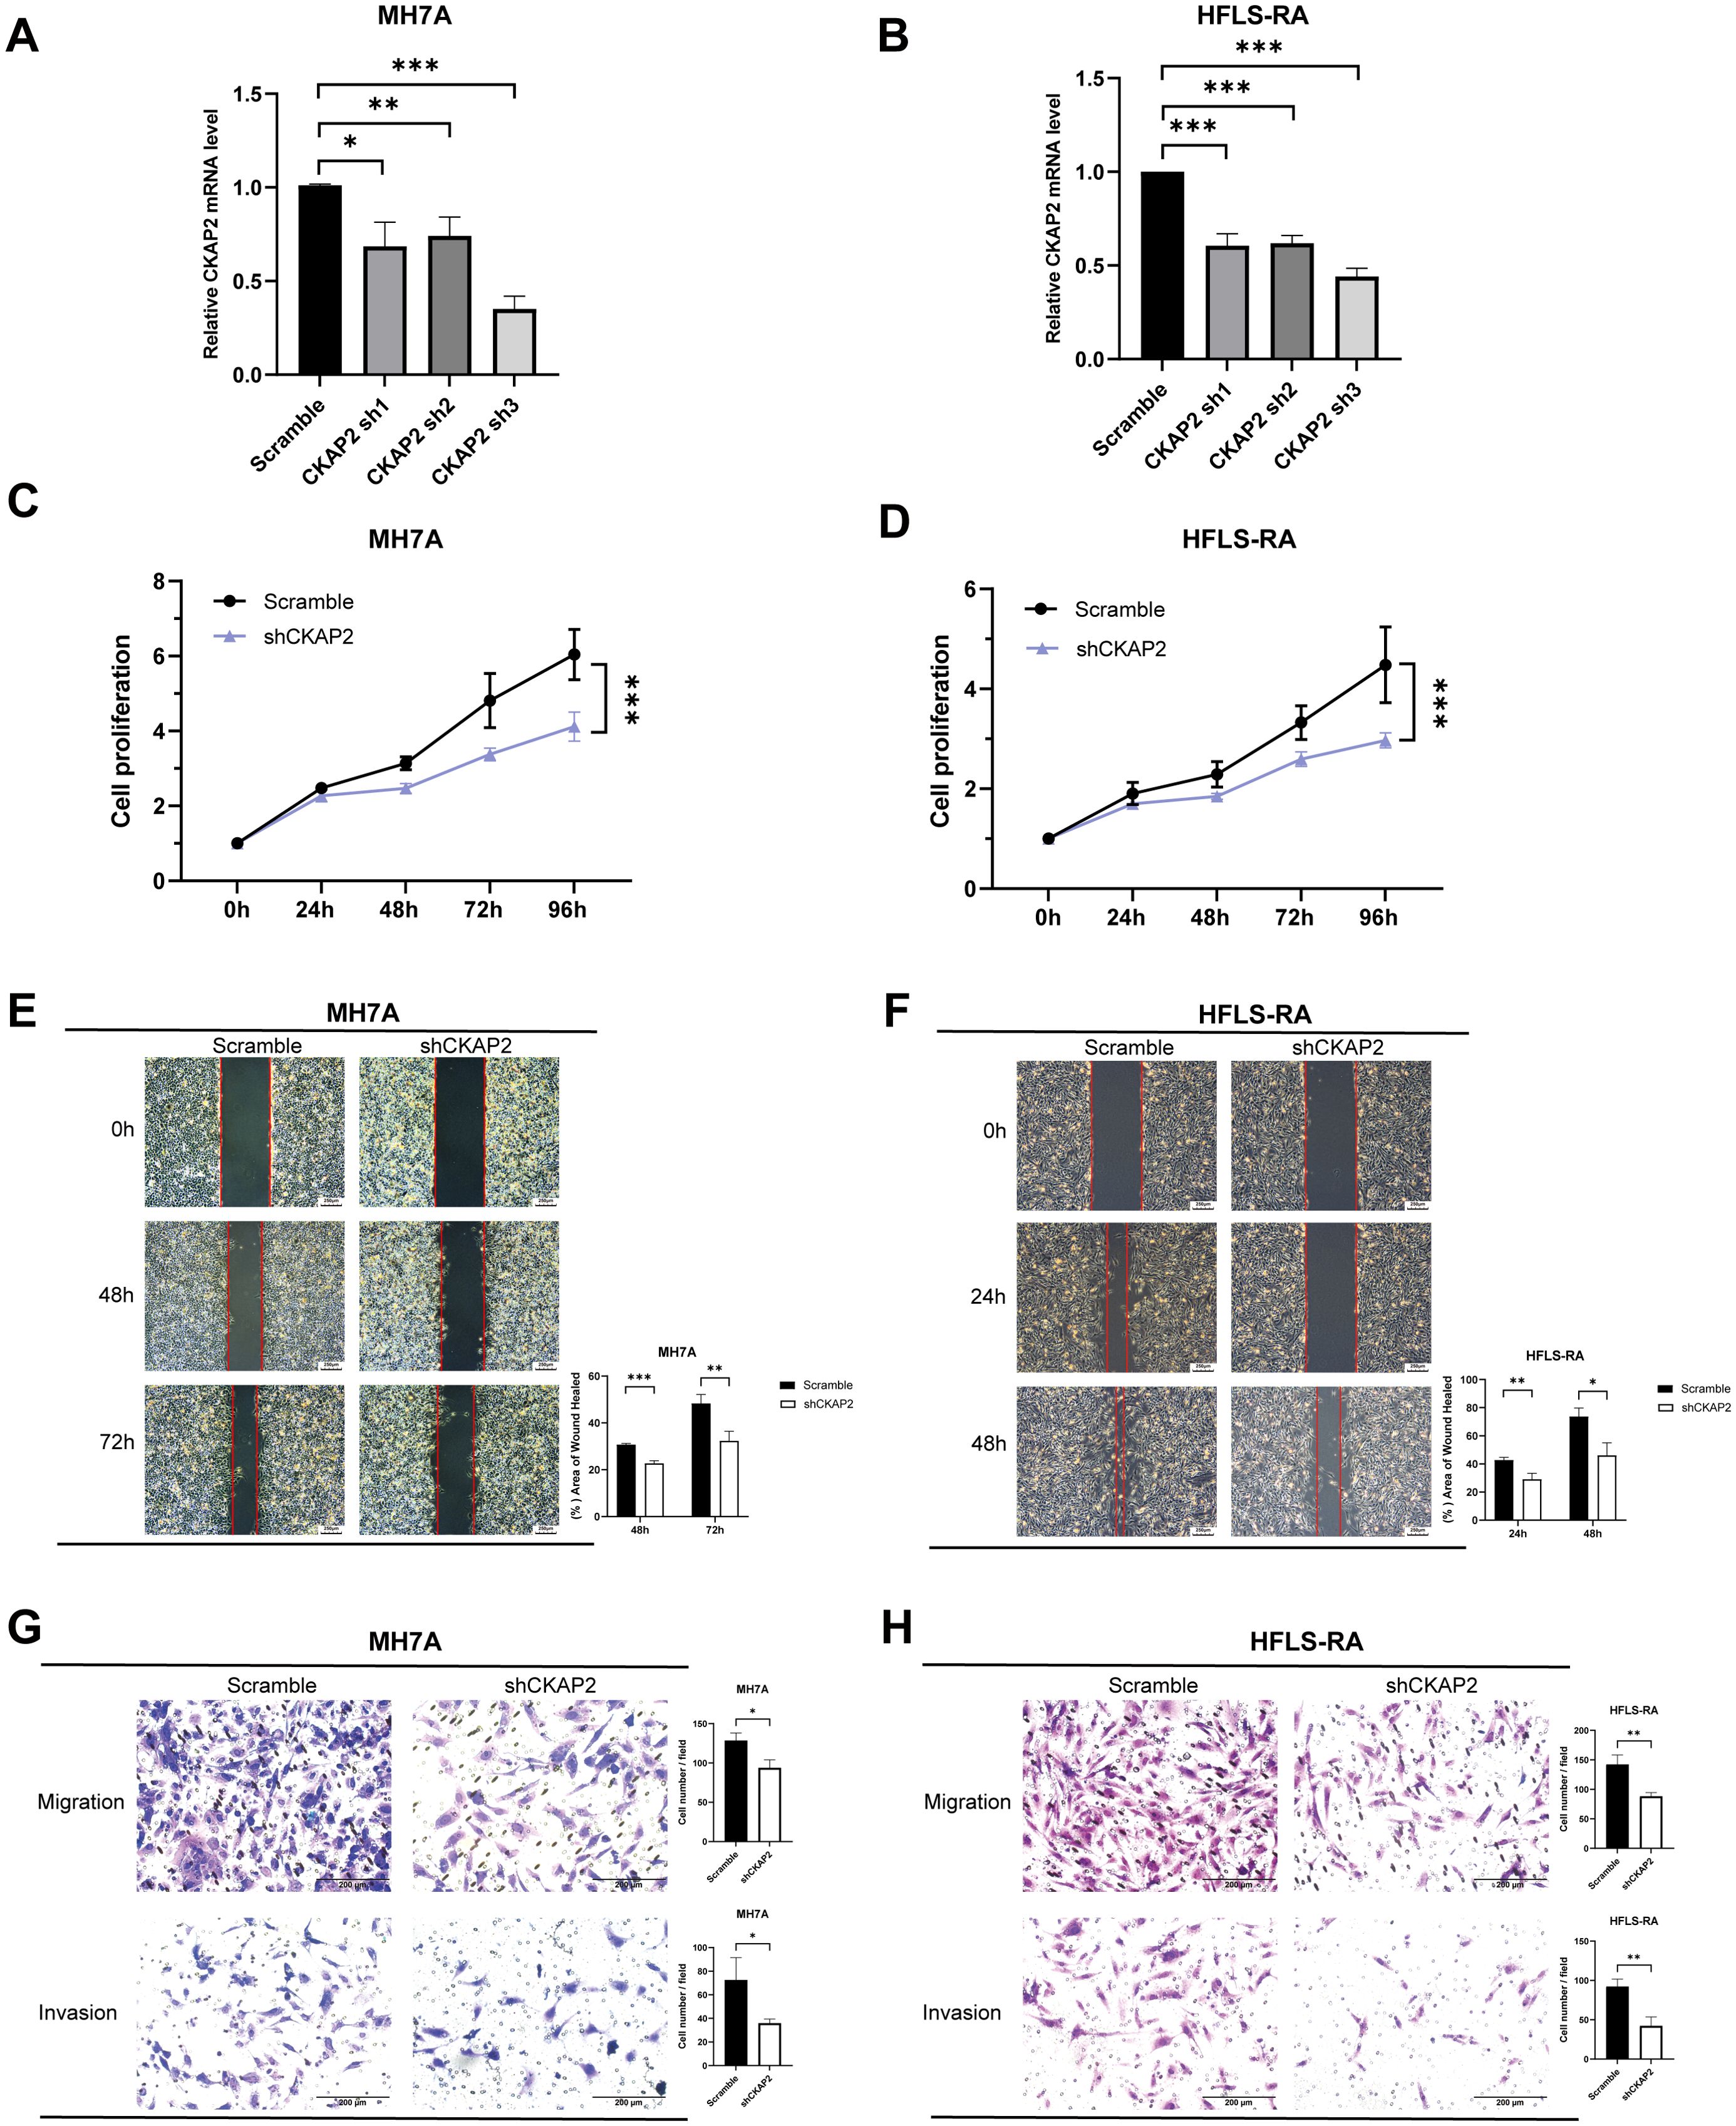
Figure 7. Knockdown of CKAP2 inhibits MH7A and HFLS-RA cell proliferation, migration, and invasion. (A, B) qRT-PCR showing CKAP2 mRNA levels in MH7A and HFLS-RA cells after infection with either scrambled or shCKAP2 lentivirus. (C, D) CCK-8 assay demonstrating inhibition of cell proliferation following CKAP2 knockdown in MH7A and HFLS-RA cells. (E, F) Wound-healing assay indicating reduced migration after CKAP2 knockdown in MH7A and HFLS-RA cells. (G, H) Transwell assay revealing inhibited migration and invasion after CKAP2 knockdown in MH7A and HFLS-RA cells. *, p < 0.05; **, p < 0.01; ***, p < 0.001.
To assess the effect of CKAP2 on cell proliferation, we performed a CCK-8 assay. shCKAP2 reduced the proliferation of MH7A and HFLS-RA cells compared to the scramble group (Figures 7C, D, both p < 0.001), suggesting that CKAP2 knockdown suppressed cell proliferative ability.
To evaluate the impact of CKAP2 on migration and invasion, we conducted wound-healing and transwell migration and invasion assays. Wound-healing assays showed wound surface areas for the shCKAP2 group were larger than for the scramble group in both MH7A and HFLS-RA cells (Figures 7E, F). Similarly, transwell assays demonstrated that knockdown of CKAP2 inhibited both migration and invasion of MH7A and HFLS-RA cells (Figures 7G, H). Therefore, these results suggest that CKAP2 promotes the migration and invasion of MH7A and HFLS-RA cells.
Discussion
Based on bioinformatics analysis combined with machine learning algorithms and MR analysis, we identified and validated CKAP2 as a signature gene of RA. Additionally, our study demonstrates that CKAP2 is involved in RA pathogenesis by promoting the proliferation, migration, and invasion of FLS, as demonstrated by clinical tissue samples and cellular functional assays.
In this study, we retrieved and merged 3 microarray cohorts. Using bioinformatics analysis and machine learning algorithms, we identified 3 hub genes associated with RA: CKAP2, POU2AF1, and HLA-DOB. These genes demonstrated strong diagnostic efficacy in both the training set and external validation set, with significantly higher expression levels in RA patients. This indicates that our approach to identifying hub genes is both reliable and feasible. Previous studies have suggested that these hub genes may be associated with the pathogenesis of RA. Research by Levels et al. has shown that the POU2AF1 were significantly elevated in the synovial tissue of RA patients and revealed that it may be a key transcription factor in the activation of pathogenic B cells (30, 31). Teitell et al. indicated that POU2AF1, as a B lymphocyte-specific coactivator, regulates the expression of immunoglobulins and other immune-related genes, and is involved in immune and inflammatory responses (32). Afroz et al. conducted a meta-analysis and found that HLA-DOB is significantly upregulated in peripheral blood mononuclear cells in RA patients. HLA-DOB, a B cell lineage, MHC-II-related molecule has been reported to exhibit strong immunogenicity in human T cells (33). Kang et al. found that the HLA-DOB232–240 epitope could serve as an immunotherapeutic target for multiple myeloma (34). Therefore, HLA-DOB might also be a potential therapeutic target for controlling inflammation in RA. Currently, there are no reports on the role of CKAP2 in RA, but substantial evidence from previous studies indicated that CKAP2 was associated with cell proliferation, migration, and invasion, which are key factors in joint destruction caused by FLS in RA (24, 25, 35–37).
Immune infiltration analysis suggests that plasma cells and Tfh cells are the primary infiltrating cell types in the RA synovium, potentially playing a pivotal role in the pathogenesis of RA. These findings are consistent with those of previous studies. Zhang et al. utilized single-cell RNA sequencing analysis to demonstrate the expansion of autoimmunity-associated B cells (ABCs) in the synovium of RA patients (38). Similarly, Qin et al. confirmed the expansion of ABCs in both the peripheral blood and synovial tissue of RA patients, suggesting a potential role of ABCs in inflammatory arthritis (39). Furthermore, Li et al. reported an increased number of ABCs, in both mouse models of inflammatory arthritis and human peripheral blood, which are recruited to inflamed joints through chemotactic mechanisms, promoting the progression of chronic synovitis by secreting self-reactive antibodies (40). Additionally, Tfh cells, a subpopulation of CD4+ T cells, promote the activation of autoreactive B cells and the production of high-affinity antibodies. Increased numbers of Tfh cells are strongly associated with exacerbation of rheumatoid arthritis (41–43). Furthermore, we observed a relatively large proportion of M2 macrophages in both RA and healthy controls, which is still an interesting phenomenon even though there was no statistical difference between the two groups. It has been found that an increased proportion of M2 macrophages in RA synovial tissues is associated with lower RA disease activity and synovial inflammation, with anti-inflammatory and homeostatic functions (44), whereas synovial macrophages in healthy synovial tissues are predominantly CD206-positive macrophages, the M2 macrophages, which play an important role in the maintenance of tissue homeostasis (45). A systematic review found no significant difference in the proportion of M2 macrophages in synovial tissue and PBMC between RA and healthy controls, a finding consistent with our results (46).
To further investigate the role of hub genes in RA, we employed MR analysis to examine the causal relationship between hub genes and RA. The results indicated that upregulation of CKAP2 is associated with RA. CKAP2 expression is higher in RA synovial tissue compared to OA synovial tissue. H&E staining showed increased immune cell infiltration in RA compared to OA, as RA is an autoimmune disease characterized by synovial inflammation and hyperplasia as the core pathological changes, while OA is primarily considered a degenerative disease mainly associated with the aging process (47). The number of inflammatory cells in OA synovial tissue is fewer than to RA synovial tissue, which is consistent with the findings of Lange-Brokaar et al. (48). Additionally, cellular functional assays suggested that CKAP2 plays a central role in RA pathogenesis by promoting the proliferation, migration, and invasion of fibroblast-like synovial cells. Numerous studies have suggested that CKAP2 promotes tumor cell proliferation, migration, and invasion through the JAK/STAT3 signaling pathway or the FAK-ERK2 pathway, which could contribute to poor disease prognosis (17, 35, 49, 50), as observed in cancers such as gastric adenocarcinoma, hepatocellular carcinoma, cervical carcinoma, and breast carcinoma (20, 22–24). Moreover, GSVA indicated that CKAP2 may influence RA through the IL-6/JAK/STAT3 pathway, which is consistent with previous research on CKAP2. Zhang et al. demonstrated that the levels of phosphorylated JAK2 and STAT3 are lower in CKAP2 knockdown cells compared to control cells, inducing G0/G1 arrest and apoptosis in osteosarcoma cells (35). Jin et al. showed that inhibiting CKAP2-mediated FAK and STAT3 phosphorylation signaling could suppress the proliferation, adhesion, and migration of triple-negative breast cancer cells (17). Zhang et al. found that hypermethylation-regulated silencing of miR-9, along with CKAP2, activates the IL-6/JAK/STAT3 pathway, potentially contributing to cancer cell growth, migration, and malignant transformation (51). Therefore, CKAP2 may promote the onset and progression of RA by activating the IL-6/JAK/STAT3 pathway.
To summarize, our study may contribute to the molecular diagnosis and targeted therapy of RA. However, the datasets used in our study are mainly from Europe, which may limit the generalizability of our findings. Future multicenter and multiregional data are necessary to confirm our conclusions. Additionally, the relatively small sample size may reduce the statistical power and generalizability of the findings.
Conclusion
This study employed bioinformatics analysis, combining machine learning algorithms with MR analysis, to identify and validate CKAP2 as a signature gene of RA. Clinical tissue samples and cellular function experiments confirmed that CKAP2 is highly expressed in the RA synovium and promotes the proliferation, migration, and invasion of FLS, contributing to RA pathogenesis. As a novel biomarker, CKAP2 may provide valuable insights into molecular diagnosis and targeted therapies for RA.
Data availability statement
The datasets presented in this study can be found in online repositories. The names of the repository/repositories and accession number(s) can be found in the article/Supplementary Material.
Ethics statement
Ethics approval was obtained from the ethics committee of the First Affiliated Hospital, Shantou University Medical College (Approval No. B-2024-060). The studies were conducted in accordance with the local legislation and institutional requirements. The participants provided their written informed consent to participate in this study.
Author contributions
LL: Writing – review & editing, Resources, Funding acquisition, Conceptualization, Supervision. QZ: Conceptualization, Methodology, Formal Analysis, Writing – review & editing, Writing – original draft. YL: Writing – original draft, Formal Analysis, Methodology, Conceptualization, Writing – review & editing. JC: Methodology, Conceptualization, Writing – original draft.
Funding
The author(s) declare that financial support was received for the research and/or publication of this article. This work was supported by grants from the Guangdong Basic and Applied Basic Research Foundation (No. 2024A1515012910), and the Science and Technology Planning Project of Shantou City (No. 2024-124).
Acknowledgments
The authors would like to sincerely thank the Department of Orthopedics at the First Affiliated Hospital of Shantou University Medical College for collecting the clinical samples used in this study. We also wish to acknowledge the Laboratory of Molecular Cardiology, First Affiliated Hospital of Shantou University Medical College, for their support in providing laboratory facilities. We are grateful to the Department of Pathology at Shantou Central Hospital for their assistance in scanning and photographing the immunohistochemical sections using a Pannoramic SCAN. Special thanks are extended to Shaohong Wang, Yuanyuan Wang, Zehuan Zhang, and Shanqing Cai for their invaluable technical support. Finally, we would like to express our appreciation to Prof. Stanley Li Lin from Shantou University Medical College for his assistance with English language editing.
Conflict of interest
The authors declare that the research was conducted in the absence of any commercial or financial relationships that could be construed as a potential conflict of interest.
Generative AI statement
The author(s) declare that no Generative AI was used in the creation of this manuscript.
Publisher’s note
All claims expressed in this article are solely those of the authors and do not necessarily represent those of their affiliated organizations, or those of the publisher, the editors and the reviewers. Any product that may be evaluated in this article, or claim that may be made by its manufacturer, is not guaranteed or endorsed by the publisher.
Supplementary material
The Supplementary Material for this article can be found online at: https://www.frontiersin.org/articles/10.3389/fimmu.2025.1606201/full#supplementary-material
Abbreviations
ABC, Autoimmunity-associated B cell; AUC, Area under the curve; bDMARD, Biological disease-modifying anti-rheumatic drug; CCK-8, Cell Counting Kit-8; CKAP2, Cytoskeleton-associated protein 2; cDNA, Complementary DNA; DEG, Differentially expressed gene; eQTL, Expression quantitative trait locus; FLS, Fibroblast-like synoviocyte; GO, Gene Ontology; GSVA, Gene set variation analysis; H&E, Hematoxylin and eosin; IHC, Immunohistochemistry; IV, Instrumental Variable; IVW, Inverse variance-weighted; KEGG, Kyoto Encyclopedia of Genes and Genomes; LASSO, Least absolute shrinkage and selection operator; LD, Linkage disequilibrium; MR, Mendelian randomization; NCBI, National Center for Biotechnology Information; OA, Osteoarthritis; OD, Optical density; qRT-PCR, Quantitative real-time polymerase chain reaction; RA, Rheumatoid arthritis; RF, Random forest; ROC, Receiver operating characteristic; SNP, Single nucleotide polymorphism; Tfh, Follicular helper T; WGCNA, Weighted gene co-expression network analysis; WM, Weighted median.
References
1. Gravallese EM and Firestein GS. Rheumatoid arthritis - common origins, divergent mechanisms. N Engl J Med. (2023) 388:529–42. doi: 10.1056/NEJMra2103726
2. Gabriel SE. The epidemiology of rheumatoid arthritis. Rheum Dis Clin North Am. (2001) 27:269–81. doi: 10.1016/S0889-857X(05)70201-5
3. Ding Q, Hu W, Wang R, Yang Q, Zhu M, Li M, et al. Signaling pathways in rheumatoid arthritis: implications for targeted therapy. Signal Transduct Target Ther. (2023) 8:68. doi: 10.1038/s41392-023-01331-9
4. Smolen JS, Aletaha D, Barton A, Burmester GR, Emery P, Firestein GS, et al. Rheumatoid arthritis. Nat Rev Dis Primers. (2018) 4:18001. doi: 10.1038/nrdp.2018.1
5. Firestein GS and McInnes IB. Immunopathogenesis of rheumatoid arthritis. Immunity. (2017) 46:183–96. doi: 10.1016/j.immuni.2017.02.006
6. Alamanos Y and Drosos AA. Epidemiology of adult rheumatoid arthritis. Autoimmun Rev. (2005) 4:130–6. doi: 10.1016/j.autrev.2004.09.002
7. Jonsson AH. Synovial tissue insights into heterogeneity of rheumatoid arthritis. Curr Rheumatol Rep. (2024) 26:81–8. doi: 10.1007/s11926-023-01129-2
8. Cox N, Mallen CD, and Scott IC. Pharmacological pain management in patients with rheumatoid arthritis: a narrative literature review. BMC Med. (2025) 23:54. doi: 10.1186/s12916-025-03870-0
9. Pelissier A, Laragione T, Gulko PS, and Rodriguez Martinez M. Cell-specific gene networks and drivers in rheumatoid arthritis synovial tissues. Front Immunol. (2024). 15:1428773. doi: 10.3389/fimmu.2024.1428773
10. Avci AB, Feist E, and Burmester GR. Rheumatoid factors revisited in the age of biologic therapies. Rheumatol (Oxford). (2025) 64(Supplement_2):ii15–24. doi: 10.1093/rheumatology/keaf035
11. Tesi N, van der Lee S, Hulsman M, Holstege H, and Reinders M. Bioinformatics strategies for the analysis and integration of large-scale multiomics data. J Gerontol A Biol Sci Med Sci. (2023) 78:659–62. doi: 10.1093/gerona/glad005
12. Wang Z, Hu D, Pei G, Zeng R, and Yao Y. Identification of driver genes in lupus nephritis based on comprehensive bioinformatics and machine learning. Front Immunol. (2023) 14:1288699. doi: 10.3389/fimmu.2023.1288699
13. Liu F, Ye J, Wang S, Li Y, Yang Y, Xiao J, et al. Identification and verification of novel biomarkers involving rheumatoid arthritis with multimachine learning algorithms: an in silicon and in vivo study. Mediators Inflammation. (2024) 2024:3188216. doi: 10.1155/2024/3188216
14. Eraslan G, Avsec Z, Gagneur J, and Theis FJ. Deep learning: new computational modelling techniques for genomics. Nat Rev Genet. (2019) 20:389–403. doi: 10.1038/s41576-019-0122-6
15. Sanderson E, Glymour MM, Holmes MV, Kang H, Morrison J, Munafo MR, et al. Mendelian randomization. Nat Rev Methods Primers. (2022) 2:6. doi: 10.1038/s43586-021-00092-5
16. Rogne T, Gill D, Liew Z, Shi X, Stensrud VH, Nilsen TIL, et al. Mediating factors in the association of maternal educational level with pregnancy outcomes: A mendelian randomization study. JAMA Netw Open. (2024) 7:e2351166. doi: 10.1001/jamanetworkopen.2023.51166
17. Jin XX, Mei YN, Shen Z, Zhu JF, Xing SH, Yang HM, et al. A chalcone-syringaldehyde hybrid inhibits triple-negative breast cancer cell proliferation and migration by inhibiting CKAP2-mediated FAK and STAT3 phosphorylation. Phytomedicine. (2022) 101:154087. doi: 10.1016/j.phymed.2022.154087
18. Zhong Z, Cheng S, and Liu Y. CKAP2 regulated by TFDP1 promotes metastasis and proliferation of colorectal cancer through affecting the tumor microenvironment. J Microbiol Biotechnol. (2024) 34:2211–22. doi: 10.4014/jmb.2407.07008
19. Feng Y, Wei G, Zhang L, Zhou H, Wang W, Guo P, et al. LncRNA DARS-AS1 aggravates the growth and metastasis of hepatocellular carcinoma via regulating the miR-3200-5p-Cytoskeleton associated protein 2 (CKAP2) axis. Bioengineered. (2021) 12:8217–32. doi: 10.1080/21655979.2021.1982272
20. Bae CD, Sung YS, Jeon SM, Suh Y, Yang HK, Kim YI, et al. Up-regulation of cytoskeletal-associated protein 2 in primary human gastric adenocarcinomas. J Cancer Res Clin Oncol. (2003) 129:621–30. doi: 10.1007/s00432-003-0484-0
21. Zhang S, Li N, Yang Y, Li Y, Lin C, Fu G, et al. CKAP2 overexpression correlates with worse overall survival in patients with lung adenocarcinoma. Med (Baltimore). (2022) 101:e29796. doi: 10.1097/MD.0000000000029796
22. Hayashi T, Ohtsuka M, Okamura D, Seki N, Kimura F, Shimizu H, et al. Cytoskeleton-associated protein 2 is a potential predictive marker for risk of early and extensive recurrence of hepatocellular carcinoma after operative resection. Surgery. (2014) 155:114–23. doi: 10.1016/j.surg.2013.06.009
23. Guo L, Li C, Guo J, Qiu J, and Hua K. CKAP2 promotes cervical cancer progression by modulating the tumor microenvironment via NF-kappaB signaling. Am J Cancer Res. (2023) 13:2376–91.
24. Dos Santos A, Ouellete G, Diorio C, Elowe S, and Durocher F. Knockdown of CKAP2 inhibits proliferation, migration, and aggregate formation in aggressive breast cancer. Cancers (Basel). (2022) 14(15):3759. doi: 10.3390/cancers14153759
25. Lefevre S, Knedla A, Tennie C, Kampmann A, Wunrau C, Dinser R, et al. Synovial fibroblasts spread rheumatoid arthritis to unaffected joints. Nat Med. (2009) 15:1414–20. doi: 10.1038/nm.2050
26. Beckmann D, Romer-Hillmann A, Krause A, Hansen U, Wehmeyer C, Intemann J, et al. Lasp1 regulates adherens junction dynamics and fibroblast transformation in destructive arthritis. Nat Commun. (2021) 12:3624. doi: 10.1038/s41467-021-23706-8
27. Wang G, Zou R, Liu L, Wang Z, Zou Z, Tan S, et al. A circular network of purine metabolism as coregulators of dilated cardiomyopathy. J Transl Med. (2022) 20:532. doi: 10.1186/s12967-022-03739-3
28. Woetzel D, Huber R, Kupfer P, Pohlers D, Pfaff M, Driesch D, et al. Identification of rheumatoid arthritis and osteoarthritis patients by transcriptome-based rule set generation. Arthritis Res Ther. (2014) 16:R84. doi: 10.1186/ar4526
30. Levels MJ, Van Tok MN, Cantaert T, Canete JD, Kroese FG, Germar K, et al. The transcriptional coactivator bob1 is associated with pathologic B cell responses in autoimmune tissue inflammation. Arthritis Rheumatol. (2017) 69:750–62. doi: 10.1002/art.39993
31. Levels MJ, Fehres CM, van Baarsen LGM, van Uden NOP, Germar K, O'Toole TG, et al. BOB.1 controls memory B-cell fate in the germinal center reaction. J Autoimmun. (2019) 101:131–44. doi: 10.1016/j.jaut.2019.04.011
32. Teitell MA. OCA-B regulation of B-cell development and function. Trends Immunol. (2003) 24:546–53. doi: 10.1016/j.it.2003.08.002
33. Afroz S, Giddaluru J, Vishwakarma S, Naz S, Khan AA, and Khan N. A comprehensive gene expression meta-analysis identifies novel immune signatures in rheumatoid arthritis patients. Front Immunol. (2017) 8:74. doi: 10.3389/fimmu.2017.00074
34. Kang YJ, Zeng W, Song W, Reinhold B, Choi J, Brusic V, et al. Identification of human leucocyte antigen (HLA)-A*0201-restricted cytotoxic T lymphocyte epitopes derived from HLA-DObeta as a novel target for multiple myeloma. Br J Haematol. (2013) 163:343–51. doi: 10.1111/bjh.2013.163.issue-3
35. Zhang S, Wang Y, Chen S, and Li J. Silencing of cytoskeleton-associated protein 2 represses cell proliferation and induces cell cycle arrest and cell apoptosis in osteosarcoma cells. BioMed Pharmacother. (2018) 106:1396–403. doi: 10.1016/j.biopha.2018.07.104
36. You S, Koh JH, Leng L, Kim WU, and Bucala R. The tumor-like phenotype of rheumatoid synovium: molecular profiling and prospects for precision medicine. Arthritis Rheumatol. (2018) 70:637–52. doi: 10.1002/art.40406
37. Meng X, Chen Z, Li T, Nie Z, Han H, Zhong S, et al. Role and therapeutic potential for targeting fibroblast growth factor 10/FGFR1 in relapsed rheumatoid arthritis. Arthritis Rheumatol. (2024) 76:32–47. doi: 10.1002/art.42674
38. Zhang F, Wei K, Slowikowski K, Fonseka CY, Rao DA, Kelly S, et al. Defining inflammatory cell states in rheumatoid arthritis joint synovial tissues by integrating single-cell transcriptomics and mass cytometry. Nat Immunol. (2019) 20:928–42. doi: 10.1038/s41590-019-0378-1
39. Qin Y, Cai ML, Jin HZ, Huang W, Zhu C, Bozec A, et al. Age-associated B cells contribute to the pathogenesis of rheumatoid arthritis by inducing activation of fibroblast-like synoviocytes via TNF-alpha-mediated ERK1/2 and JAK-STAT1 pathways. Ann Rheum Dis. (2022) 81:1504–14. doi: 10.1136/ard-2022-222605
40. Li ZY, Cai ML, Qin Y, and Chen Z. Age/autoimmunity-associated B cells in inflammatory arthritis: An emerging therapeutic target. Front Immunol. (2023) 14:1103307. doi: 10.3389/fimmu.2023.1103307
41. Huo FF, Zou XY, Zhang Y, Lu YP, Zhao MW, Yu XY, et al. Aire attenuate collagen-induced arthritis by suppressing T follicular helper cells through ICOSL. Int Immunopharmacol. (2025) 144:113732. doi: 10.1016/j.intimp.2024.113732
42. Lu J, Zhou H, Chen Y, Xia X, Yang J, Ma J, et al. Tfh cell-derived small extracellular vesicles exacerbate the severity of collagen-induced arthritis by enhancing B-cell responses. J Autoimmun. (2024) 146:103235. doi: 10.1016/j.jaut.2024.103235
43. Cao G, Yue X, Chi S, and Zhang Y. Total alkaloids of sophora alopecuroides linn. Attenuates rheumatoid arthritis through regulating follicular helper T cells. J Inflammation Res. (2024) 17:3587–602. doi: 10.2147/JIR.S449330
44. Triaille C, Tilman G, Sokolova T, Loriot A, Marchandise J, De Montjoye S, et al. Disease activity drives transcriptomic heterogeneity in early untreated rheumatoid synovitis. Ann Rheum Dis. (2023) 82:1538–46. doi: 10.1136/ard-2023-224068
45. Kurowska-Stolarska M and Alivernini S. Synovial tissue macrophages in joint homeostasis, rheumatoid arthritis and disease remission. Nat Rev Rheumatol. (2022) 18:384–97. doi: 10.1038/s41584-022-00790-8
46. Tardito S, Martinelli G, Soldano S, Paolino S, Pacini G, Patane M, et al. Macrophage M1/M2 polarization and rheumatoid arthritis: A systematic review. Autoimmun Rev. (2019) 18:102397. doi: 10.1016/j.autrev.2019.102397
47. Boutet MA, Nerviani A, Fossati-Jimack L, Hands-Greenwood R, Ahmed M, Rivellese F, et al. Comparative analysis of late-stage rheumatoid arthritis and osteoarthritis reveals shared histopathological features. Osteoarthritis Cartilage. (2024) 32:166–76. doi: 10.1016/j.joca.2023.10.009
48. de Lange-Brokaar BJ, Ioan-Facsinay A, van Osch GJ, Zuurmond AM, Schoones J, Toes RE, et al. Synovial inflammation, immune cells and their cytokines in osteoarthritis: a review. Osteoarthritis Cartilage. (2012) 20:1484–99. doi: 10.1016/j.joca.2012.08.027
49. Guo QS, Song Y, Hua KQ, and Gao SJ. Involvement of FAK-ERK2 signaling pathway in CKAP2-induced proliferation and motility in cervical carcinoma cell lines. Sci Rep. (2017) 7:2117. doi: 10.1038/s41598-017-01832-y
50. Ma HN, Chen HJ, Liu JQ, and Li WT. Long non-coding RNA DLEU1 promotes Malignancy of breast cancer by acting as an indispensable coactivator for HIF-1alpha-induced transcription of CKAP2. Cell Death Dis. (2022) 13:625. doi: 10.1038/s41419-022-04880-z
Keywords: rheumatoid arthritis, machine learning, bioinformatics analysis, mendelian randomization, CKAP2, fibroblast-like synoviocytes
Citation: Zheng Q, Lan Y, Chen J and Lin L (2025) Identification and validation of CKAP2 as a novel biomarker in the development and progression of rheumatoid arthritis. Front. Immunol. 16:1606201. doi: 10.3389/fimmu.2025.1606201
Received: 04 April 2025; Accepted: 06 June 2025;
Published: 25 June 2025.
Edited by:
Jan Stępniak, Medical University of Lodz, PolandReviewed by:
Mohammad Aqdas, National Institutes of Health (NIH), United StatesAdeel Khan, Southeast University, China
Copyright © 2025 Zheng, Lan, Chen and Lin. This is an open-access article distributed under the terms of the Creative Commons Attribution License (CC BY). The use, distribution or reproduction in other forums is permitted, provided the original author(s) and the copyright owner(s) are credited and that the original publication in this journal is cited, in accordance with accepted academic practice. No use, distribution or reproduction is permitted which does not comply with these terms.
*Correspondence: Ling Lin, bGxpbmNAMTYzLm5ldA==
†These authors have contributed equally to this work