 Taisuke Maruyama
 Daichi Kosugi1,2
 Shunsuke Iwase
 Ken Nakano
 Satoshi Momozono
- 1Core Technology R&D Center, NSK Ltd., Fujisawa, Japan
- 2NSK Tribology Collaborative Research Cluster, Tokyo Institute of Technology, Yokohama, Japan
- 3Faculty of Environment and Information Sciences, Yokohama National University, Yokohama, Japan
The authors have previously developed the electrical impedance method which simultaneously measure the thickness and breakdown ratio of oil films in EHD (elastohydrodynamic) contacts. Furthermore, using a ball-on-disc-type apparatus, the authors have also confirmed that the accuracy of oil film measurement by the developed method is comparable to that of optical interferometry (i.e., glass-steel contacts). In this study, we discussed the experimental results obtained by applying the electrical impedance method to steel-steel contacts using a steel disc instead of a glass disc. It was found that under the mixed lubrication regime where wear occurs, the oil film thickness obtained by this method is calculated to be significantly thicker than the theoretical value. This can be attributed to the increase in the apparent dielectric constant of the lubricant due to wear particles in the lubricant.
1 Introduction
In recent years, with the background of global warming, there has been a demand for further reduction of torque in rolling bearings used in the sliding parts of various machines. To reduce bearing torque, measures such as lowering the viscosity of lubricants or reducing the amount of lubricant filled into the bearing have been implemented. However, these approaches can promote the breakdown of oil films in EHD (elastohydrodynamic) contacts (Gohar and Cameron, 1967) of the rolling bearings, potentially causing various surface damages (Tallian, 1967; Zhu et al., 2007; Maruyama et al., 2017). Of course, various additives are used to improve lubrication properties (Bukvić et al., 2024), but oil film breakdown should be avoided as much as possible. Therefore, the ideal lubrication condition for achieving further torque reduction in rolling bearings is one where the oil film in EHD contacts is as thin as possible without causing metallic contact. Thus, the thickness and breakdown ratio of oil films in EHD contacts are particularly important parameters for visualizing the lubrication condition.
Various studies have been conducted on the visualization techniques of lubrication conditions in EHD contacts (Albahrani et al., 2016). In particular, optical interferometry (Johnston et al., 1991; Yagi and Vergne, 2007; Maruyama and Saitoh, 2010) can accurately measure the oil film thickness in EHD contacts. However, it requires the use of light-transmitting materials, making it difficult to understand the lubrication conditions in practical rolling bearings. As a visualization technique for lubrication conditions in steel-steel contacts, electrical methods (Lord and Larsson, 2008; Jablonka et al., 2018; Spikes, 2020; Schirra et al., 2021; Shetty et al., 2022; Esmaeili et al., 2022; Schneider et al., 2022; Puchtler et al., 2023) have been highlighted. Recently, the electrical impedance method (Nakano and Akiyama, 2006; Manabe and Nakano, 2008; Nihira et al., 2015), which applies an AC voltage to EHD contacts and simultaneously measures the thickness and breakdown ratio of oil films from the complex impedance response, has been proposed. Maruyama and Nakano (2018) applied both optical interferometry and the electrical impedance method to a ball-on-disc-type apparatus and confirmed that the oil film measurement accuracy of the developed method is comparable to that of optical method (i.e., glass-steel contacts). Furthermore, improvements were made to apply this method to practical deep groove ball bearings (Maruyama et al., 2019) and thrust needle roller bearings (Maruyama et al., 2023) (i.e., steel-steel contacts), and it was confirmed that the results were almost consistent with the theoretical oil film thickness under hydrodynamic lubrication. However, in the case of steel-steel contacts, the experimental results for thickness and breakdown ratio of oil films fluctuated under the mixed lubrication regime, suggesting that wear might have influenced the measurement accuracy. Additionally, since multiple rolling elements are used in rolling bearings, the obtained experimental results represent averaged values for all EHD contacts, which is not suitable for investigating the causes of fluctuations in the results.
Therefore, in this study, ball-on-disc tests using steel discs were conducted to simplify the experimental results obtained when applying the electrical impedance method to steel-steel contacts. It is expected that this paper can contribute to a better understanding of lubrication condition monitoring when applying the electrical impedance method to practical rolling bearings. Furthermore, this method is expected to not only contribute to the improvement of rolling bearing performance and the prediction of lubrication life (time until oil film breakdown) but also to the advancement of lubrication theory.
2 Experimental details
2.1 Apparatus
Figure 1 shows a schematic diagram of ball-on-disc-type apparatus used in this study for steel/steel contacts. In this setup, the rotating ball specimen is pressed against the rotating disc specimen from below. An AC voltage from an LCR meter is applied to the EHD contact area via slip rings attached to the ends of both rotational axes. Lubricating oil is supplied to the contact area from an oil bath as the ball specimen rotates. Additionally, a torque meter is connected to the rotational axis of the disc specimen, allowing the measurement of the friction coefficient in the EHD contact.
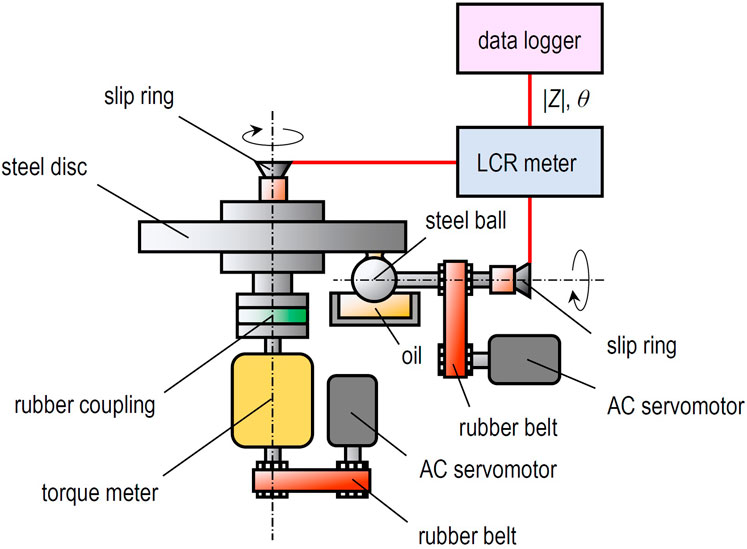
Figure 1. Schematic diagram of ball-on-disc-type apparatus for steel/steel contacts.
2.2 Materials
2.2.1 Test specimens
The ball specimen used in this study (diameter: 25.4 mm, arithmetic mean roughness: Ra1 = 8.2 nm, root mean square roughness: Rq1 = 13.9 nm) was made of AISI 52100 steel (Young’s modulus: 207 GPa, Poisson’s ratio: 0.30). Similarly, the steel disc specimen (diameter: 100 mm, thickness: 10 mm, roughness: Ra2 = 0.6 nm, Rq2 = 2.2 nm) was made of the same material as the ball specimen.
2.2.2 Test oils
Table 1 shows two types of PAO (poly-α-olefin oil) used as test oils, with viscosities of ν = 30 mm2/s and ν = 396 mm2/s at 40°C. For both lubricants, the oil film thickness was calculated using the same dielectric constant ε = εoil ε0 = 2.10 ε0 F/m, where ε0 = 8.85∙10−12 F/m is the dielectric constant in vacuum.
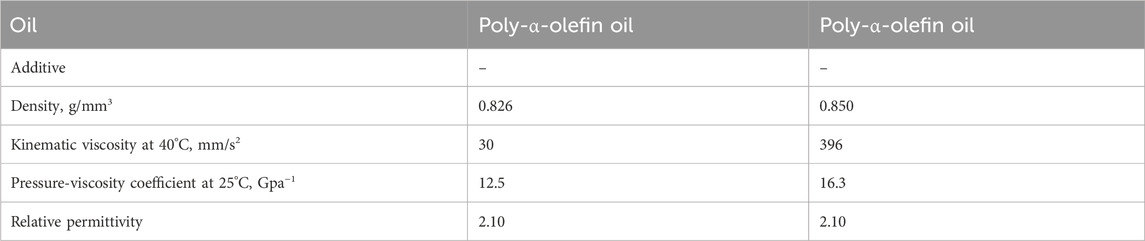
Table 1. Test oil properties.
2.3 Procedures
In this study, all tests were conducted at room temperature (approximately 25°C). Prior to the tests, the oil bath, ball and disc specimen were cleaned with petroleum benzene using ultrasonic cleaning. After cleaning, the oil bath and each specimen were mounted on the ball-on-disc-type apparatus. The lubricating oil was applied to the ball specimen, which was then pressed against the disc specimen. Using an LCR meter (RMS amplitude: Ie = 50 μA, frequency: f = 1.0 MHz), initial values (|Z0| [Ω], θ0 [deg]) under the stationary contacts (i.e., α = 1) were first measured. Subsequently, the ball specimen was separated from the disc specimen, and while rotating, they were brought into contact again to measure the magnitude of the complex impedance |Z| [Ω] and the phase angle θ [deg] in the dynamic contacts. From these measured values in the stationary and dynamic contacts (|Z0|, θ0, |Z|, θ), the average oil film thickness h [m] and the breakdown ratio of oil film α [–] were calculated using the following Equations 1, 2 (Maruyama and Nakano, 2018), respectively.
Here, c [m] denotes the Hertzian contact radius, r [m] is the radius of the ball specimen, ω [rad/s] is the angular frequency of the AC voltage, and
3 Experimental results
3.1 Influence of entrainment speed U
First, h, α and μ were measured when the entrainment speed U [m/s] was varied from U = 0.005–0.5 m/s. This range of U was selected because it represents the operational capabilities of the testing apparatus. The measurement results are shown in Figure 2. Here, low-viscosity PAO (viscosity at 40°C: ν = 30 mm2/s) was used as the test oil, and the normal load Fz = 10 N was held constant. Only the ball specimen was rotated (i.e., slide-to-roll ratio Σ = 2.0), and the speed was gradually reduced from U = 0.5 to 0.005 m/s. The red plots in Figure 2 show the experimental results using the electrical impedance method, and the black dashed line is the theoretical central oil film thickness obtained from the Hamrock-Dowson equation (Hamrock and Dowson, 1977a). From Figure 2, it was confirmed that h measured using the electrical method is in close agreement with the theoretical value under the hydrodynamic lubrication regime (i.e.,
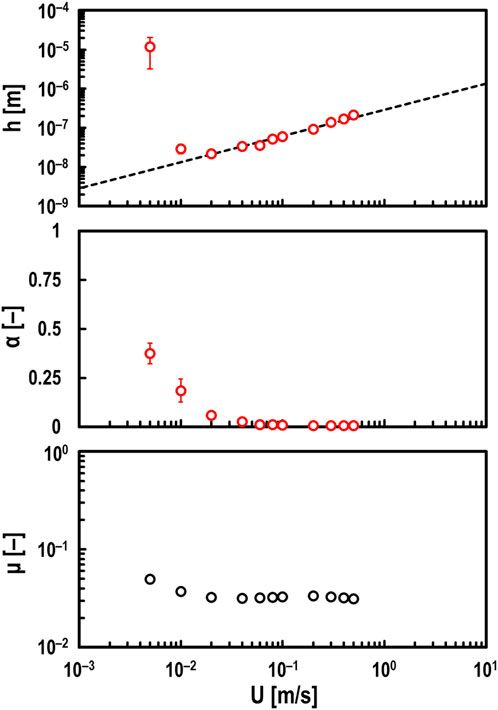
Figure 2. Measured values of oil film thickness h (top), breakdown ratio α (middle), and friction coefficient μ (bottom) for varying entrainment speed U under steel/steel contacts; oil: PAO (viscosity at 40°C: ν = 30 mm2/s), normal load: Fz = 10 N, and slide-to-roll ratio: Σ = 2; red open circles in top and middle graphs: measured values by electrical method; black dashed line in top graph: theoretical prediction by Hamrock and Dowson.
3.2 Influence of slide-to-roll ratio Σ
Figure 3 shows the experimental results only when Σ was varied while keeping U = 0.5 m/s. From Figure 3, it can be confirmed that the measured h using developed method is almost consistent with the theoretical value even when Σ is varied. Moreover, it is evident that μ is significantly affected by Σ. Additionally, the measured α using this method suggest that these tests were conducted in the hydrodynamic lubrication regime. In other words, it was confirmed that the electrical method does not affect the oil film measurement accuracy even when the lubricating oil is sheared in the hydrodynamic lubrication regime.
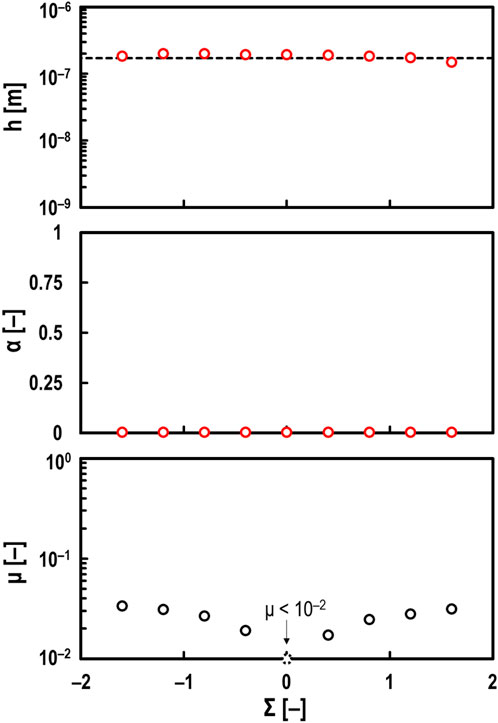
Figure 3. Measured values of oil film thickness h (top), breakdown ratio α (middle), and friction coefficient μ (bottom) for varying slide-to-roll ratio Σ under steel/steel contacts; oil: PAO (viscosity at 40°C: ν = 30 mm2/s), normal load: Fz = 10 N, and entrainment speed: U = 0.5 m/s; red open circles in top and middle graphs: measured values by electrical method; black dashed line in top graph: theoretical prediction by Hamrock and Dowson.
Meanwhile, Figure 2 indicates that the measured h using this developed method is significantly thicker than the theoretical value in the mixed lubrication regime when Σ = 2. Therefore, to investigate the effect of Σ on measured values in detail, h and α at Σ = 0 were measured when U was varied from 0.005 to 0.5 m/s.
The red plots in Figure 4 show the experimental results at Σ = 0. On the other hand, the black plots in Figure 4 are the results at Σ = 2 and are the same as the red plots shown in Figure 2. Figure 4 shows that h measured using the electrical method is almost equal to the theoretical values even in the mixed lubrication regime when Σ = 0. Furthermore, it was found that α at Σ = 0 is smaller than that at Σ = 2. It is thought that in the case of Σ = 2, running-in wear (Ludema, 1984; Grabon, 2018) occurred on the sliding surfaces, increasing the real contact area. Therefore, the surface roughness of the disc specimens after tests were measured using an optical interference microscope, as shown in Figure 5. Figure 5A confirmed that the surface roughness increased due to wear in the case of Σ = 2 (for more detailed surface roughness parameters, see Supplementary Material). This suggests that when wear occurs in the EHD contact, the h measured using the developed method is evaluated to be thicker than the theoretical oil film thickness.
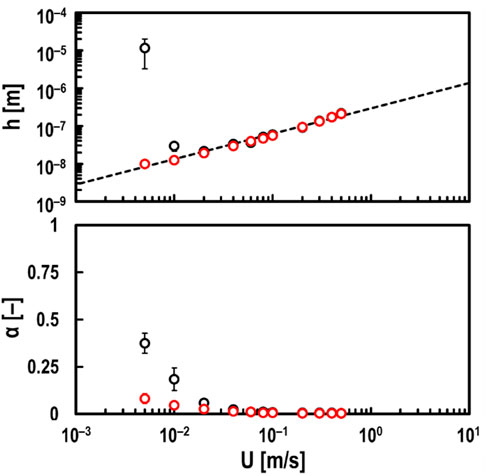
Figure 4. Measured values of oil film thickness h (top) and breakdown ratio α (bottom) by electrical method for varying entrainment speed U under steel/steel contacts; oil: PAO (viscosity at 40°C: ν = 30 mm2/s), and normal load: Fz = 10 N; red open circles in graphs: measured values under pure rolling contacts (i.e., Σ = 0); black open circles in graphs: measured values under pure sliding contacts (i.e., Σ = 2); black dashed line in top graph: theoretical prediction by Hamrock and Dowson.
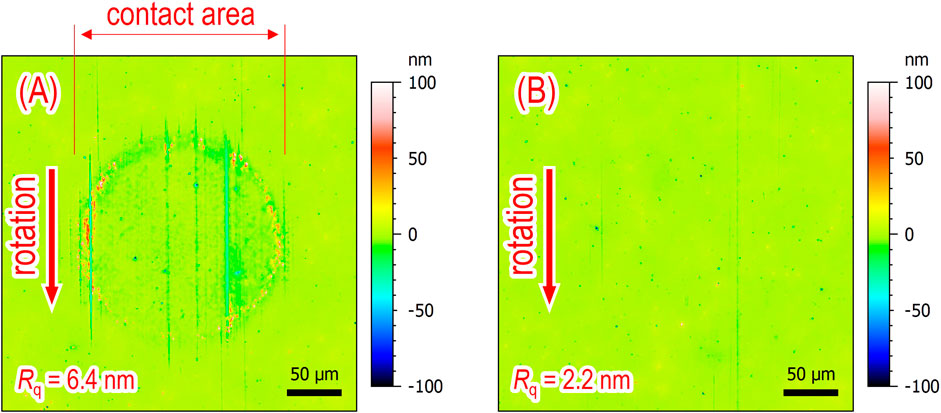
Figure 5. Surface roughness images of steel disc specimens after tests at varying entrainment speeds U from 0.005 to 0.5 m/s; oil: PAO (viscosity at 40°C: ν = 30 mm2/s), and Fz = 10 N; (A) surface roughness image at Σ = 2 and (B) surface roughness image at Σ = 0; red arrows: rotational directions of steel ball specimens.
3.3 Influence of normal load Fz
Figure 6 shows the experimental results when Fz was varied from 1.4 to 59 N. It was confirmed that this developed method can accurately measure the oil film thickness even when Fz (i.e., Hertzian contact circle radius c [m] shown in Equation 1) is varied.
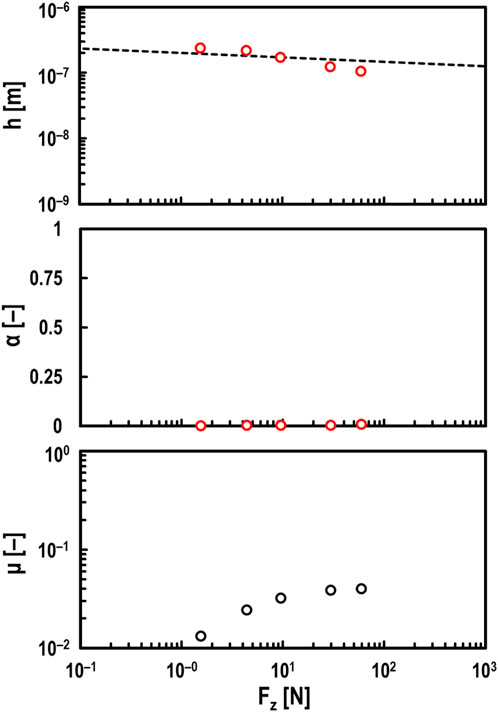
Figure 6. Measured values of oil film thickness h (top), breakdown ratio α (middle), and friction coefficient μ (bottom) for varying normal load Fz under steel/steel contacts; oil: PAO (viscosity at 40°C: ν = 30 mm2/s), entrainment speed: U = 0.5 m/s, and slide-to-roll ratio: Σ = 2; red open circles in top and middle graphs: measured values by electrical method; black dashed line in top graph: theoretical prediction by Hamrock and Dowson.
Next, the thickness h and the breakdown ratio α of oil films were measured under various normal load conditions (Fz = 1.4, 10 and 59 N) while varying the entrainment speed U. However, as shown in Figure 4, under the mixed lubrication regime (i.e., α ≥ 0) in steel/steel contacts, the measured h values are known to be significantly thicker than the theoretical values. Therefore, the tests were conducted under conditions where wear is unlikely to occur (i.e., Σ = 0), as shown in Figure 7. Here, the blue plots show the results for Fz = 1.4 N, the green plots show the results for Fz = 10 N, and the red plots show the results for Fz = 59 N. From Figure 7, it was confirmed that varying Fz from 1.4 to 59 N had little effect on the oil film thickness h. However, it was found that h becomes slightly thinner as Fz increases. This is evident from the Hamrock-Dowson equation (Hamrock and Dowson, 1977a).
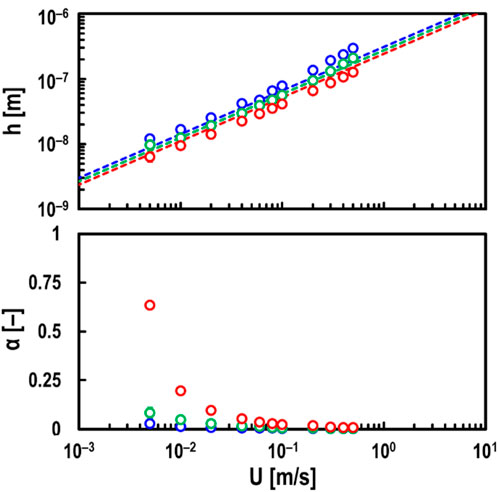
Figure 7. Measured values of oil film thickness h (top) and breakdown ratio α (bottom) by electrical method for varying entrainment speed U and normal load Fz under steel/steel contacts; oil: PAO (viscosity at 40°C: ν = 30 mm2/s), and slide-to-roll ratio: Σ = 0; red open circles in graphs: measured values at Fz = 59 N; green open circles in graphs: measured values at Fz = 10 N; blue open circles in graphs: measured values at Fz = 1.4 N; dashed lines corresponding to each color of Fz in top graph: theoretical predictions by Hamrock and Dowson.
On the other hand, it was found that the breakdown ratio α is greatly affected by Fz. This load dependency of α at Σ = 0 is not considered to be due to wear, as the increase in h shown in Figure 4 was not observed in the mixed lubrication regime.
3.4 Influence of viscosity ν
Finally, tests were conducted using high-viscosity PAO (viscosity at 40°C: ν = 396 mm2/s) with varying speeds from U = 0.005–0.5 m/s, as shown in Figure 8. It was confirmed that in the range of U
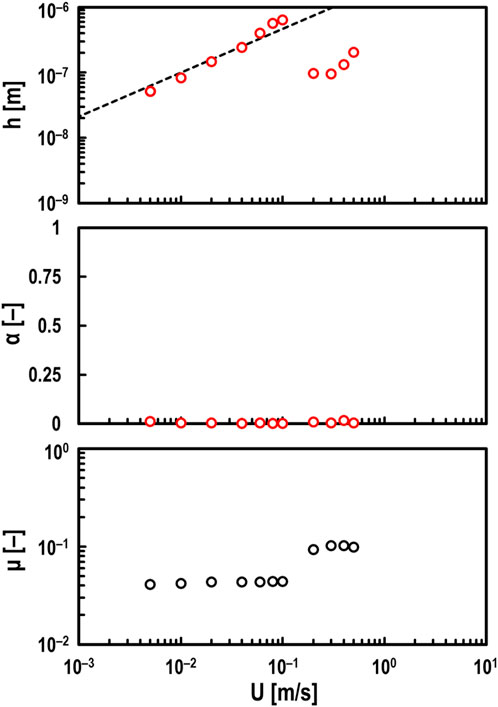
Figure 8. Measured values of oil film thickness h (top), breakdown ratio α (middle), and friction coefficient μ (bottom) for varying entrainment speed U under steel/steel contacts; oil: PAO (viscosity at 40°C: ν = 396 mm2/s), normal load: Fz = 10 N, and slide-to-roll ratio: Σ = 2; red open circles in top and middle graphs: measured values by electrical method; black dashed line in top graph: theoretical prediction by Hamrock and Dowson.
On the other hand, in the range of U
4 Discussion
4.1 Validation of measured oil film thickness
Figure 4 shows that measured h-values using this electrical method are significantly thicker than the theoretical values in the mixed lubrication regime (α ≥ 0) when Σ = 2. Conversely, when Σ = 0, the measured h-values are found to be almost equal to the theoretical values in all speed ranges. Also, the measured α-values in the low-speed ranges at Σ = 2 were larger than those at Σ = 0, suggesting that the wear in the EHD contact area occurred, as shown in Figure 5A. In other words, it is considered that the wear in the contact area may have had some effect on the oil film measurement accuracy of the electrical impedance method. From Equation 1, the oil film thickness obtained by this electrical method is affected by the dielectric constant of the lubricating oil, so it is thought that the wear particles generated in the contact area may have affected the dielectric constant of the lubricating oil. Originally, we should investigate the relationship between the iron powder concentration and the dielectric constant using test oil. However, because the iron powder precipitates when measuring the dielectric constant of oil mixed with iron powder, we substituted the test oil with grease. Commercially available grease (base oil: mineral oil, thickener: Li-soap, base oil viscosity at 40°C: ν = 100 mm2/s, worked penetration: 280) was mixed with iron powder (material: cementite, particle diameter: 70–150 μm, hardness: HV870). Figure 9 shows the dielectric constant of the grease when iron powder was added. Here,
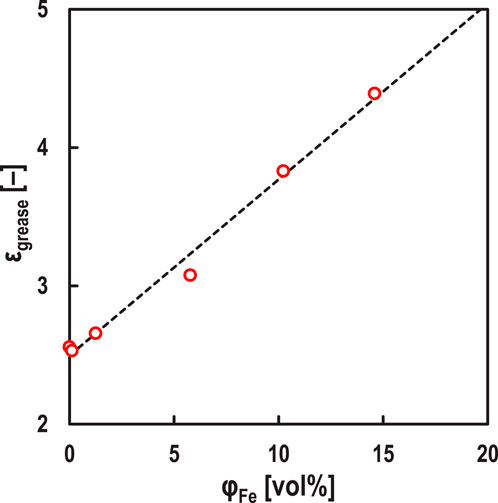
Figure 9. Relationship between volume fraction of iron particles in grease
The simulation result of the oil film thickness h' [m] obtained using the electrical impedance method (see Equation 1), assuming that the dielectric constant ε of the test oil changes to the apparent dielectric constant ε' [F/m], is shown in Figure 10. Here, f = 1.0 MHz, ε = 2.10 ε0 F/m, c = 0.09 mm, and r = 12.7 mm, and it is assumed to be in hydrodynamic lubrication (i.e., α = 0, h = 100 nm, θ = −90 deg). Figure 10 shows that simulated h'-value increases exponentially with increasing ε'. In other words, according to Figures 9, 10, it is suggested that the very thick h-value obtained by the developed method (see Figure 4) in the mixed lubrication regime (i.e., α ≥ 0) when Σ = 2 is due to wear within the EHD contact area, which increases the apparent dielectric constant of the lubricant. From Figure 4, it is clearly unnatural for both h and α to increase simultaneously, and we believe that when such results are obtained, it can be judged that wear is occurring in the contact area. Therefore, we estimated the apparent dielectric constant ε' [F/m] of the lubricant at Σ = 2, assuming that the actual oil film thickness at Σ = 2 in Figure 4 is the same as the experimental results at Σ = 0. Figure 11 shows that ε′ increases at low-speed ranges, especially at U = 0.005 m/s, where the apparent dielectric constant of the lubricant increases about 10 times due to wear shown in Figure 5A. This suggests that the lower the velocity, the more wear particles are mixed in the lubricant due to wear occurring in the EHD contact area.
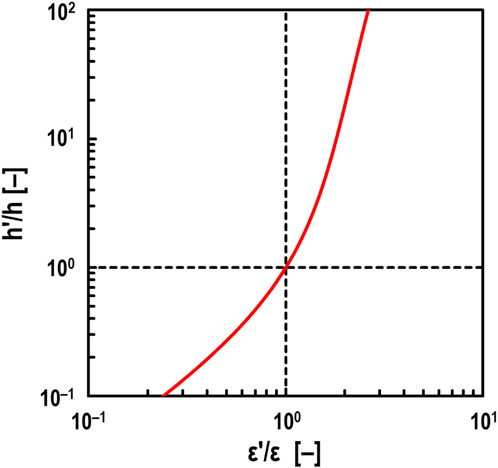
Figure 10. Effect of dielectric constant on measured oil film thickness under Fz = 10 N with no breakdown area (i.e., α = 0); ε: true dielectric constant of oil (ε = 2.10 ε0 F/m), ε': estimated dielectric constant of oil, h: true oil film thickness (h = 100 nm), h': theoretical measured oil film thickness obtained by electrical method; black dashed vertical line: ε' = ε, black dashed horizontal line: h' = h.
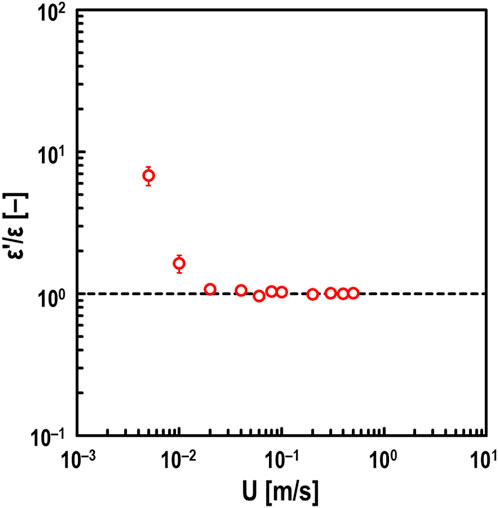
Figure 11. Estimated values of dielectric constant of oil ε′ under pure sliding steel/steel contacts for varying entrainment speed U; oil: PAO (viscosity at 40°C: ν = 30 mm2/s), and normal load: Fz = 10 N; black dashed line: ε' = ε = 2.10 ε0 F/m.
By the way, in the case of glass/steel contact (Maruyama and Nakano, 2018), it has been confirmed that this electrical method can accurately measure the oil film thickness under the mixed lubrication regime (i.e., α ≥ 0) even when Σ = 2. In other words, the measured oil film thickness was not evaluated to be thicker than the actual oil film thickness (i.e., the measured values obtained by optical interferometry or the theoretical values by Hamrock–Dowson equation). This is likely because, in the case of glass/steel contact, adhesion wear (Kalin and Vizintin, 2006) does not occur as much as in steel/steel contact due to the contact between dissimilar materials, resulting in minimal impact on the measurement accuracy of the oil film thickness by the developed method. However, note that the extremely thick measured h-values may be influenced not only by the generation of wear particles but also by changes in surface roughness (see Supplementary Material). Additionally, it is already known that the capacitance around the EHD contact can affect the accuracy of oil film measurement (Jablonka et al., 2018; Maruyama and Nakano, 2018). However, it has been theoretically shown that as the oil film becomes thinner, the influence of the capacitance around the contact becomes very small (Maruyama and Nakano, 2018). In other words, under conditions where the oil film is thin enough for wear to occur, we believe that the influence of wear particles around the contact on the measurement accuracy is minimal.
4.2 Validation of breakdown ratio
Next, using the results from Figure 7, the film parameter Λ [–], defined as the ratio of oil film thickness to surface roughness, was calculated to investigate its relationship with the breakdown ratio of oil films α in steel/steel contacts. Here, Λ is obtained from the following Equation 3 (Tallian, 1967):
where h [m] is the average oil film thickness measured using the electrical method, and Rq1 [m], Rq2 [m] are the root mean square roughness of the ball and disc specimen surfaces before tests under non-load conditions, respectively (see 2.2.1 Test specimens). The film parameter Λ is often defined using the minimum oil film thickness. However, as the oil film generally becomes thinner, the difference between the minimum and central oil film thickness decreases (Hamrock and Dowson, 1977a). Therefore, in this study, Λ was calculated using the average oil film thickness (≈ central oil film thickness) obtained by the electrical method. Tallian (1967) also calculated Λ using the central oil film thickness and found that wear occurs in EHD contacts when Λ < 3.
The relationship between Λ and α is shown in Figure 12. It was found that when Λ > 3, the oil film hardly collapsed regardless of Fz. On the other hand, when Λ < 3, it suggested that the experiments were conducted in the mixed lubrication regime. Johnson et al. (1972) theoretically found that the oil film would collapse when Λ < 3, assuming that the number of asperities directly contacting the surface roughness follows a Poisson distribution relative to the oil film thickness. Thus, it was suggested that this method could quantitatively evaluate α even in steel/steel contacts.
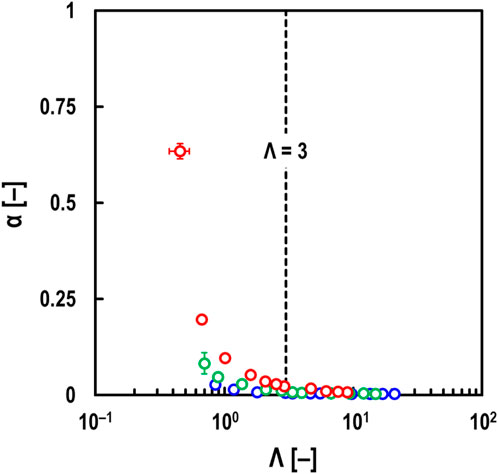
Figure 12. Relationship between film parameter Λ and breakdown ratio α under steel/steel contacts, oil: PAO (viscosity at 40°C: ν = 30 mm2/s), entrainment speed: U = 0.005–0.5 m/s, and slide-to-roll ratio: Σ = 0; red open circles: measured values at Fz = 59 N; green open circles: measured values at Fz = 10 N; blue open circles: measured values at Fz = 1.4 N; black dashed line: Λ = 3.
Furthermore, it was found that when Λ < 3, α increased with increasing Fz even for the same Λ, as shown in Figure 12. Additionally, from the measured h-values shown in Figure 7 (Σ = 0), an increase in h as shown in Figure 4 was not observed in the mixed lubrication regime (α ≥ 0). This indicates that the load dependence of α shown in Figure 12 is not caused by wear. This load dependence is thought to be due to the larger elastic (or plastic) deformation in the real contact area as the load increases. However, as the load increases, the Hertzian contact area also becomes larger, making dielectric breakdown more likely. This could have led to the measured α-values being evaluated as larger than the real contact area. Further investigation is needed to determine the cause of this load dependence.
5 Conclusion
In this study, ball-on-disc tests using a steel disc were conducted to verify whether the electrical impedance method, developed in previous research, can be applied not only to element tests in glass-steel contacts but also to practical bearing tests in steel-steel contacts. The findings are as follows:
1. Tests were conducted by varying the entrainment speed, slide-to-roll ratio, normal load, and viscosity. Then, the oil film thickness measured by the electrical impedance method was compared with the theoretical values calculated using Hamrock-Dowson equation. As a result, except under the mixed or starved lubrication, it was confirmed that this method can accurately measure the oil film thickness even for steel/steel contacts.
2. When wear occurs within the EHD contacts, the oil film thickness obtained using the developed method was found to be significantly thicker than the theoretical value. This is believed to be due to the apparent increase in the dielectric constant of the lubricant caused by the inclusion of wear particles. In other words, this method suggests that the occurrence of wear can also be monitored. Specifically, if the unnatural results of both oil film thickness and breakdown ratio increasing simultaneously are obtained, it may indicate that wear is occurring within the EHD contact.
3. When using high-viscosity oil, the oil film thickness was found to be thinner than the theoretical value at high-speed ranges. Since the friction coefficient μ increased at that time, it suggests that the starved lubrication occurred in the EHD contact. This supports the results obtained using this electrical method, where the oil film thickness was thinner than the theoretical value.
4. The relationship between the film parameter Λ and the breakdown ratio α showed that the α increased within the range of Λ < 3. Additionally, since α and μ increased simultaneously within the range of Λ < 3, it suggests that this method can quantitatively evaluate the α even in steel/steel contacts. Therefore, it was considered that the number of asperities directly contacting the surface roughness might follow a Poisson distribution relative to the oil film thickness.
5. It was confirmed that the breakdown ratio of oil films α increased with larger normal loads within the range of Λ < 3. This is thought to be because the larger the load, the greater the elastic (or plastic) deformation at the asperity in real contact area, leading to an increased α.
In summary, this study reports on the interpretation of the measurement results obtained when applying the electric impedance method to steel-steel contacts where wear occurs. We hope that this paper can contribute to a better understanding of lubrication condition when applying the electrical method to actual rolling bearings.
Data availability statement
The raw data supporting the conclusions of this article will be made available by the authors, without undue reservation.
Author contributions
TM: Writing–original draft, Writing–review and editing, Conceptualization, Data curation, Formal Analysis, Investigation, Methodology, Project administration, Resources, Supervision, Validation, Visualization. DK: Supervision, Writing–review and editing. SI: Supervision, Writing–review and editing. MM: Data curation, Investigation, Validation, Writing–review and editing. KN: Conceptualization, Data curation, Investigation, Methodology, Project administration, Supervision, Validation, Writing–review and editing. SM: Project administration, Supervision, Writing–review and editing.
Funding
The author(s) declare that no financial support was received for the research, authorship, and/or publication of this article.
Acknowledgments
In writing this paper, I received much advice through discussions conducted with Guajardo Duenas Guillermo Andres, Fumiaki Aikawa and Yohei Murata of NSK Ltd. I would like to express my gratitude to these people.
Conflict of interest
Authors TM, DK, SI, and MM were employed by NSK Ltd.
The remaining authors declare that the research was conducted in the absence of any commercial or financial relationships that could be construed as a potential conflict of interest.
Publisher’s note
All claims expressed in this article are solely those of the authors and do not necessarily represent those of their affiliated organizations, or those of the publisher, the editors and the reviewers. Any product that may be evaluated in this article, or claim that may be made by its manufacturer, is not guaranteed or endorsed by the publisher.
Supplementary material
The Supplementary Material for this article can be found online at: https://www.frontiersin.org/articles/10.3389/fmech.2024.1489311/full#supplementary-material
References
Albahrani, S. M. B., Philippon, D., Vergne, P., and Bluet, J. M. (2016). A review of in situ methodologies for studying elastohydrodynamic lubrication. Proc. Institution Mech. Eng. Part J J. Eng. Tribol. 230, 86–110. doi:10.1177/1350650115590428
Ali, F., Křupka, I., and Hartl, M. (2017). Effects of out-of-contact lubricant channeling on friction and film thickness in starved elastohydrodynamic lubrication point contacts. Proc. Institution Mech. Eng. Part J J. Eng. Tribol. 201, 145–150. doi:10.1177/1350650115576943
Bukvić, M., Gajević, S., Skulić, A., Savić, S., Ašonja, A., and Stojanović, B. (2024). Tribological application of nanocomposite additives in industrial oils. Lubricants 12 (1), 6. doi:10.3390/lubricants12010006
Cann, P. M., Damiens, B., and Lubrecht, A. (2004). The transition between fully flooded and starved regimes in EHL. Tribol. Int. 37, 859–864. doi:10.1016/j.triboint.2004.05.005
Esmaeili, K., Wang, L., Harvey, T. J., White, N. M., and Holweger, W. (2022). Electrical discharges in oil-lubricated rolling contacts and their detection using electrostatic sensing technique. Sensors 22, 392. doi:10.3390/s22010392
Gohar, R., and Cameron, A. (1967). The mapping of elastohydrodynamic contacts. ASLE Trans. 10, 215–225. doi:10.1080/05698196708972181
Grabon, W. A. (2018). A new approach to the description of height distribution of plateau honed cylinder liner surface texture during the initial stage of wear. Wear 408-409, 34–42. doi:10.1016/j.wear.2018.04.019
Hamrock, B. J., and Dowson, D. (1977a). Isothermal elastohydrodynamic lubrication of point contacts: Part III-fully flooded results. ASME J. Lubr. Technol. 99 (2), 264–275. doi:10.1115/1.3453074
Hamrock, B. J., and Dowson, D. (1977b). Isothermal elastohydrodynamic lubrication of point contacts: Part IV-starvation results. ASME J. Lubr. Technol. 99, 15–23. doi:10.1115/1.3452973
Jablonka, K., Glovnea, R., and Bongaerts, J. (2018). Quantitative measurements of film thickness in a radially loaded deep-groove ball bearing. Tribol. Int. 119, 239–249. doi:10.1016/j.triboint.2017.11.001
Johnson, K. L., Greenwood, J. A., and Poon, S. Y. (1972). A simple theory of asperity contact in elastohydro-dynamic lubrication. Wear 19 (1), 91–108. doi:10.1016/0043-1648(72)90445-0
Johnston, G. J., Wayte, R., and Spikes, H. A. (1991). The measurement and study of very thin lubricant films in concentrated contacts. Tribol. Trans. 34, 187–194. doi:10.1080/10402009108982026
Kalin, M., and Vizintin, J. (2006). The tribological performance of DLC coatings under oil-lubricated fretting conditions. Tribol. Int. 39 (10), 1060–1067. doi:10.1016/j.triboint.2006.02.040
Lambert, J. H. (1758). Observationes variae in mathesin puram. Acta Helvetica Physico-mathematico-anatomico-botanico-medica 3, 128–168.
Lord, J., and Larsson, R. (2008). Film-forming capability in rough surface EHL investigated using contact resistance. Tribol. Int. 41 (9-10), 831–838. doi:10.1016/j.triboint.2007.11.006
Ludema, K. C. (1984). A review of scuffing and running-in of lubricated surfaces, with asperities and oxides in perspective. Wear 100 (1-3), 315–331. doi:10.1016/0043-1648(84)90019-x
Manabe, K., and Nakano, K. (2008). Breakdown of oil films and formation of residual films. Tribol. Int. 41, 1103–1113. doi:10.1016/j.triboint.2008.02.001
Maruyama, T., Maeda, M., and Nakano, K. (2019). Lubrication condition monitoring of practical ball bearings by electrical impedance method. Tribol. Online 14 (5), 327–338. doi:10.2474/trol.14.327
Maruyama, T., and Nakano, K. (2018). In situ quantification of oil film formation and breakdown in EHD contacts. Tribol. Trans. 61 (6), 1057–1066. doi:10.1080/10402004.2018.1468519
Maruyama, T., Radzi, F., Sato, T., Iwase, S., Maeda, M., and Nakano, K. (2023). Lubrication condition monitoring in EHD line contacts of thrust needle roller bearing using the electrical impedance method. Lubricants 11, 223. doi:10.3390/lubricants11050223
Maruyama, T., and Saitoh, T. (2010). Oil film behavior under minute vibrating conditions in EHL point contacts. Tribol. Int. 43, 1279–1286. doi:10.1016/j.triboint.2009.11.004
Maruyama, T., and Saitoh, T. (2015). Relationship between supplied oil flow rates and oil film thicknesses under starved elastohydrodynamic lubrication. Lubricants 3, 365–380. doi:10.3390/lubricants3020365
Maruyama, T., Saitoh, T., and Yokouchi, A. (2017). Differences in mechanisms for fretting wear reduction between oil and grease lubrication. Tribol. Trans. 60, 497–505. doi:10.1080/10402004.2016.1180469
Nakano, K., and Akiyama, Y. (2006). Simultaneous measurement of film thickness and coverage of loaded boundary films with complex impedance analysis. Tribol. Lett. 22 (1), 127–134. doi:10.1007/s11249-006-9074-z
Nihira, T., Manabe, K., Tadokoro, C., Ozaki, S., and Nakano, K. (2015). Complex impedance measurement applied to short-time contact between colliding steel surfaces. Tribol. Lett. 57, 29. doi:10.1007/s11249-015-0478-5
Nogi, T. (2015). An analysis of starved EHL point contacts with reflow. Tribol. Online 10 (1), 64–75. doi:10.2474/trol.10.64
Puchtler, S., van der Kuip, J., and Kirchner, E. (2023). Analyzing ball bearing capacitance using single steel ball bearings. Tribol. Lett. 71, 38. doi:10.1007/s11249-023-01706-7
Schirra, T., Martin, G., Puchtler, S., and Kirchner, E. (2021). Electric impedance of rolling bearings - consideration of unloaded rolling elements. Tribol. Int. 158, 106927. doi:10.1016/j.triboint.2021.106927
Schneider, V., Bader, N., Liu, H., and Poll, G. (2022). Method for in situ film thickness measurement of ball bearings under combined loading using capacitance measurements. Tribol. Int. 171, 107524. doi:10.1016/j.triboint.2022.107524
Shetty, P., Meijer, R. J., Osara, J. A., and Lugt, P. M. (2022). Measuring film thickness in starved grease-lubricated ball bearings: an improved electrical capacitance method. Tribol. Trans. 65, 869–879. doi:10.1080/10402004.2022.2091067
Spikes, H. A. (2020). Triboelectrochemistry: influence of applied electrical potentials on friction and wear of lubricated contacts. Tribol. Lett. 68, 90. doi:10.1007/s11249-020-01328-3
Tallian, T. E. (1967). On competing failure modes in rolling contact. ASLE Trans. 10 (4), 418–439. doi:10.1080/05698196708972201
Yagi, K., and Vergne, P. (2007). Abnormal film shapes in sliding elastohydrodynamic contacts lubricated by fatty alcohols. Proc. Institution Mech. Eng. Part J J. Eng. Tribol. 221, 287–300. doi:10.1243/13506501jet253
Keywords: electrical impedance method, condition monitoring, oil film thickness, breakdown ratio, elastohydrodynamic lubrication, wear, steel/steel contact
Citation: Maruyama T, Kosugi D, Iwase S, Maeda M, Nakano K and Momozono S (2024) Application of the electrical impedance method to steel/steel EHD point contacts. Front. Mech. Eng. 10:1489311. doi: 10.3389/fmech.2024.1489311
Received: 31 August 2024; Accepted: 22 October 2024;
Published: 06 November 2024.
Edited by:
Michel Fillon, UPR3346 Institut P′ Recherche et Ingénierie en Matériaux, Mécanique et Energétique (Pprime), FranceReviewed by:
Milan Bukvic, University of Kragujevac, SerbiaLiang Guo, SKF, Netherlands
Petr Sperka, Brno University of Technology, Czechia
Copyright © 2024 Maruyama, Kosugi, Iwase, Maeda, Nakano and Momozono. This is an open-access article distributed under the terms of the Creative Commons Attribution License (CC BY). The use, distribution or reproduction in other forums is permitted, provided the original author(s) and the copyright owner(s) are credited and that the original publication in this journal is cited, in accordance with accepted academic practice. No use, distribution or reproduction is permitted which does not comply with these terms.
*Correspondence: Taisuke Maruyama, bWFydXlhbWEtdGFAbnNrLmNvbQ==