 Prasun Dutta
 Naveen Kumar Rajendran2
 Robert Cep
 Yadaiah Nirsanametla
- 1Mechanical Engineering Department, Adamas University, Kolkata, India
- 2Department of Aerospace Engineering, School of Engineering and Technology, JAIN (Deemed to be University), Bangalore, Karnataka, India
- 3Faculty of Mechanical Engineering, VSB-Technical University of Ostrava, Ostrava, Czechia
- 4Department of Mechanical Engineering, Vivekananda Global University, Jaipur, Rajasthan, India
- 5Chitkara Centre for Research and Development, Chitkara University, Baddi, Himachal Pradesh, India
- 6Centre of Research Impact and Outcome, Chitkara University, Rajpura, Punjab, India
The current study focuses on numerically simulating turbulent flow in a 90° pipe bend using the k-ε turbulence model. Following validation of present numerical approach against prior experimental findings, extensive research was conducted to elucidate the development of Dean vortices and the secondary flow within the pipe bend. This study illustrated the distribution of mean axial velocity, secondary flow phenomena, and the occurrence of Dean vortices in various sections. Velocity vector distributions vividly depict the secondary motion induced by fluid transitioning from the inner to the outer wall of the bend, leading to flow separation. The interplay between the centrifugal force from the bend and adverse pressure gradient results in the formation of two counter-rotating vortices in the streamwise direction. This study presents numerical results aimed at providing insights into the behaviour of Dean vortices and the formation of secondary flow in a 90° pipe bend.
1 Introduction
Turbulent flows in 90-degree pipe bends are frequently encountered in various industrial settings. Curved pipes are widely used in engineering applications across mechanical equipment, including in chemical processing, manufacturing, agriculture, and minerals processing. They play crucial roles in fluid transport, heat exchange, petrochemical systems, gas transmission, thermal and nuclear power plants. These pipes serve specific functions such as providing pathways for centrifugal compressors, configuring passages for pumps, and directing fluid flow in pipelines. The combination of turbulent flow and particle presence in these scenarios leads to complex flow conditions. The curvature of the pipe induces centrifugal forces and unstable pressure gradients, resulting in pronounced secondary flows, increased pressure drops, and occurrences of flow separation and reattachment. Given the intricacies involved, the investigation of such systems has garnered significant attention in recent times.
Over the past 20 years, there has been substantial research, both experimental and simulated, on turbulent flows in curved pipes. Kalpakli Vester et al. (2016) provided comprehensive reviews in this field. Experimental studies consistently reveal certain key findings, including the observation that mean streamwise velocity increases along the inner wall of 30-degree pipe bends, coinciding with the formation of Dean vortices. These vortices, resulting from adverse pressure gradients induced by curvature, cause high-velocity fluid to deflect outward, forming counter-rotating vortices. The mean flow deviates from fully developed turbulent profiles at distances approximately one pipe diameter upstream. Sudo et al. (1998) conducted detailed measurements using hot-wire anemometry in a 90-degree pipe bend, widely referenced by subsequent researchers. Sattarzadeh Shirvan (2011) experiments showed greater axial velocity fluctuations along the inner wall of such bends. Takamura et al. (2012) visualized flow fields in a single elbow pipe at high Reynolds numbers, finding slight changes in flow separation and reattachment points with increased Reynolds numbers, leading to expanded separation regions and increased velocity fluctuations. Some researchers (Takamura et al., 2012; Hellstrom et al., 2011; Di Piazza and Ciofalo, 2011; Noorani et al., 2013; El Khoury et al., 2013; Di Liberto et al., 2013) utilized proper orthogonal decomposition of experimental data, though results were inconclusive. As highlighted by Kalpakli Vester et al. (2016), Vester et al. (2016) capturing the spatial evolution of turbulent flow within 90-degree bends experimentally is challenging, suggesting numerical simulations as a valuable alternative for gaining insights into such flows.
A considerable body of research has focused on numerical simulations of flow in curved pipes, predominantly employing Reynolds-averaged Navier-Stokes (RANS) simulations. These studies, often from an engineering perspective, typically aim to simulate high Reynolds number conditions, emphasizing parameters like pressure drop, friction, and average statistics. Duarte et al. (2017) and Dutta et al. (2022a) utilized an unsteady RANS approach to investigate particle wear in 90-degree pipe bends, a significant industrial concern. Kim et al. (2014) employed various RANS models available in Open FOAM to simulate turbulent flow in such bends, with results suggesting that the renormalization group k-ε turbulence model outperforms others, particularly in modeming primary stream wise velocity and secondary swirling velocity profiles. While RANS models offer computational efficiency and reasonable accuracy for mean turbulence statistics, they struggle to capture flow field fluctuations accurately. Centrifugal forces resulting from streamline curvature exert their influence not only on the bulk flow in the vicinity of the pipe’s central axis but also on areas adjacent to the walls, thereby posing challenges to conventional turbulence modelling assumptions (Wallin and Johansson, 2002). Direct numerical simulation (DNS) and large eddy simulation (LES) can resolve turbulent fluctuations by directly simulating the instantaneous turbulent flow field, but they become computationally demanding, especially at high Reynolds numbers. DNS is often impractical for engineering applications due to computational costs, whereas LES is more feasible. DNS and LES are typically employed for low Reynolds number flows in simple geometries, with periodic boundary conditions helping reduce computational costs for statistically steady, fully developed turbulent flows. Hüttl and Friedrich (2001) conducted DNS studies on low curvature bends, while Noorani et al. (2013) used periodic boundary conditions to study the impact of curvature on turbulence, finding that in comparison to straight pipes, curved pipes typically exhibit a higher critical Reynolds number for turbulence transition, often leading to partial laminarization along the highly curved surfaces of the pipe. Despite recent availability, there is still a scarcity of DNS and LES studies on spatially developing turbulence in practical curved pipes. Some researchers (Wang et al., 2018; Hufnagel et al., 2018; Dutta et al., 2016; Dutta and Nandi, 2019; Dutta and Nandi, 2021) investigated unsteady fluid motions downstream of bends, analysing swirl-switching phenomena affecting Dean vortices, highlighting the complexity of bend flow and the need for detailed three-dimensional characterization of these phenomena.
Over the past decade, many researchers have employed soft-computing methodologies to address technical issues, particularly turbulent flow in curved sections. Among these methodologies, artificial neural networks (ANN) have become the most widely used metamodeling tool for tackling highly nonlinear fluid flow problems. For example, Ganesh et al. (2020) recently developed a metamodel using genetic programming to accurately detect fluid flow velocity in a 90-degree curved conduit. Similarly, Narayanan et al. (2020) designed a particle swarm optimization (PSO) tuned support vector machine metamodel to analyze the turbulent flow field at an elbow. They also applied this metamodel to perform a parameter inquiry on a computational fluid dynamics (CFD) simulation dataset, aiming to better understand the impact of various parameters on turbulent fluid behavior at the elbow. Jain et al. (2021) propose a computationally efficient method using machine learning, specifically, random forest regression (RFR) model. They found, RFR models significantly reduce computational costs compared to CFD models, with only a minor loss in accuracy. While the magnitude of complex flow features like additional vortices is accurately predicted, there is some error in their location. Additionally, Gamahara and Hattori (2017) utilized ANN to develop a subgrid model for subgrid-scale stress in large-eddy simulations. Gholami et al. (2016a) combined ANN with decision trees to predict fluid velocity in a severe 90-degree bend. In another study, Gholami et al. (2016b) employed a multilayer perceptron ANN to estimate the velocity and pressure of fluid moving in a channel bed with a 90-degree acute bend.
Recently, researchers in the nuclear sector have shown interest in the fatigue induced by the fluctuating motion of vortices (Takamura et al., 2012; Ono et al., 2011; Sakakibara and Machida, 2012; Tanaka and Ohshima, 2012). On the other hand, the dielectric barrier discharge (DBD) plasma actuator has emerged as an active flow control device in the last decade (Abdolahipour et al., 2022a; Abdolahipour et al., 2022b; Abdolahipour et al., 2021; Mirzaei et al., 2012; Taleghani et al., 2018; Abdolahipour, 2023). In general, studies on vortex dynamics (Al-Rashed et al., 2017; Marmorino et al., 2018; Ghanbari et al., 2022; Gul et al., 2024; Abbasi et al., 2024) and flow accelerated corrosion rate (Rani et al., 2014; Hari Ponnamma et al., 2014; Madasamy et al., 2021) in pipes are attending interest of researchers nowadays in many engineering applications. A comprehensive understanding of the fundamental aspects of this phenomenon remains elusive. The literature presents divergent findings: some studies suggest the dominance of a single pair of Dean vortices, while others propose the existence of a single vortex spanning the entire pipe. This research aims to numerically simulate turbulent flow within a 90-degree pipe bend with a bend curvature ratio of 1.25, focusing on the development and behavior of Dean vortices and secondary flow structures. Employing the k−ε turbulence model, the study seeks to validate the numerical approach against experimental data and provide an in-depth analysis of the mean axial velocity distribution, secondary flow phenomena, and Dean vortex formation at various sections of the pipe bend.
2 Governing equations and numerical methodology
The segregated implicit solver is utilized in order to discover solutions to the Reynolds Averaged Navier–Stokes (RANS) equations in three dimensions. It is well known that dealing with an issue involving turbulent flow in an industrial setting, selecting the appropriate turbulence model is of the utmost importance. This is especially true when the problem involves flow phenomena that occur in three dimensions, which requires precise modelling.
The equations that regulate the flow of an incompressible fluid characterised by constant characteristics are as follows:
To complete the equations mentioned above, an expression for turbulent viscosity (
2.1 Turbulence model
For this particular investigation, the k-ε model is utilized. This model has been utilized by a number of researchers (Kim et al., 2014; Homicz, 2004; Dutta et al., 2022b; Röhrig et al., 2015; Yang et al., 2023; Han et al., 2021; Carloni et al., 2022; Ekat et al., 2023) to analyse single-phase flows in pipe bends. For the purpose of determining the coefficient of turbulent viscosity (µt), the kinetic energy of the turbulence (k) and the rate at which the turbulence dissipates (ε) are taken into consideration and solved in this model.
Transport equation for k-epsilon
In this context, the variable
The current computations make use of the second order upwind technique, and the SIMPLE algorithm is utilized in order to produce a pressure velocity coupling to solve the governing Equations 1–8. All of the models were constructed with the default relaxation factors used in order to facilitate convergence. In ANSYS Fluent 18.0, a three-dimensional solver is used to resolve the discretized equations iteratively through an implicit technique. In simulation, all variables had a convergence requirement of 10–5 absolute residual values.
2.2 Boundary conditions
In the present model, a time averaged velocity profile (U = Uin, V = 0, W = 0) is applied as the Dirichlet condition at the inlet. The no-slip condition (U = 0, V = 0, W = 0) is assumed at the pipe wall, while a zero-stress outflow condition is assumed at the outlet of the straight pipe section downstream. This zero-stress condition implies that all flow variables have a zero-diffusion flux, maintaining an overall mass balance correction.
3 Problem definition
For the purpose of analysing the growth of Dean vortices and the secondary flow motion within the pipe bend, the current work is computational research that employs the k-ε model. The problem that is being studied in this context is the stream of fluid through pipe bend that is 90° in angle and have a diameter of (
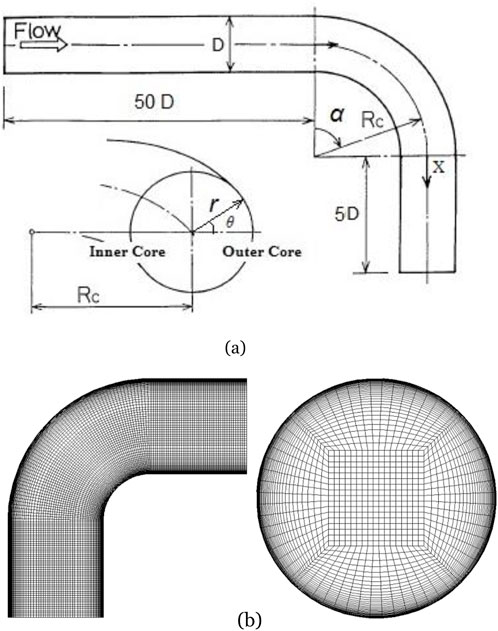
Figure 1. Representation figure of the (A) flow geometry and (B) current mesh configuration.
3.1 Grid test and validation
At the very beginning of the research project, grid test was carried out for different size ranges from 1.2 million to 2.6 million at
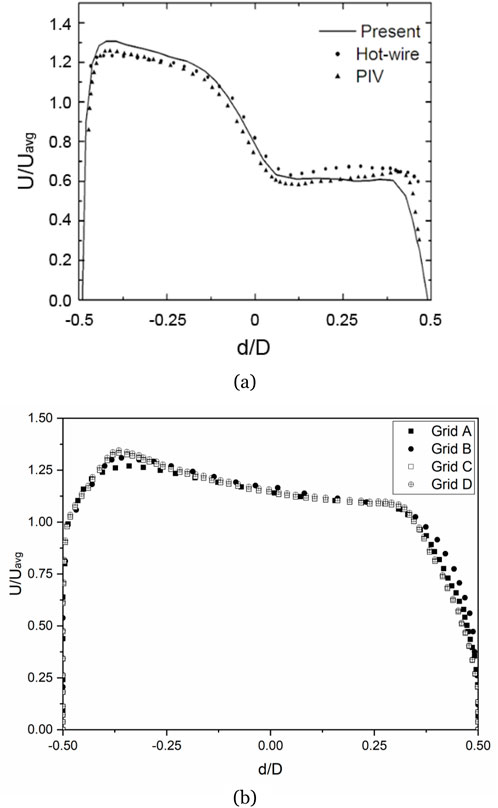
Figure 2. (A) Grid test and (B) Validation of present model against available experimental data (Kalpakli and Örlü, 2013).
4 Results and discussions
Through the use of numerical simulation, the purpose of this work is to investigate the formation of Dean vortices as well as the secondary turbulent flow that occurs by means of a pipe bend that is 90°. This part presents the findings of the mean axial velocity profile, secondary flow, and the creation of Dean vortices. These findings are brought to light in this section.
Figure 3A illustrates the normalized mean axial velocity magnitude within the pipe bend, normalized with the average input velocity, as derived from the present simulation. This presentation aims to provide an insight into the qualitative behaviour of flow within the curved pipe. Figure 3B displays plots showing the distributions of the normalized mean axial velocity at various points (α = 0°, 30°, 60°, and 90°, where α = 0° denotes the bend inlet, α = 90° denotes the bend outlet and X/D denotes positions from bend outlet towards the downstream straight pipe such as X/D = 0 is the bend outlet) along the bend’s central symmetry plane. Negative values on the y-axis indicate positions on the inner wall of the bend. Due to centrifugal force effects, flow is redirected from the bend’s centre towards the outer wall of the curve. Upstream, flow remains unaffected by the pipe’s curvature, retaining its turbulent velocity profile. Between 0 and 60°, acceleration of fluid occurs near the inner core of the bend, with deceleration noted on the outer core. Beyond sixty degrees, the inner wall’s boundary layer thickens while the outer wall’s thins due to centrifugal force influence. Secondary flow emerges after sixty degrees, leading to boundary layer separation from the inner wall as centrifugal force persists. At approximately 90°, the axial velocity reaches its nadir near the inner wall, distinctly revealing the secondary flow pattern in this segment.
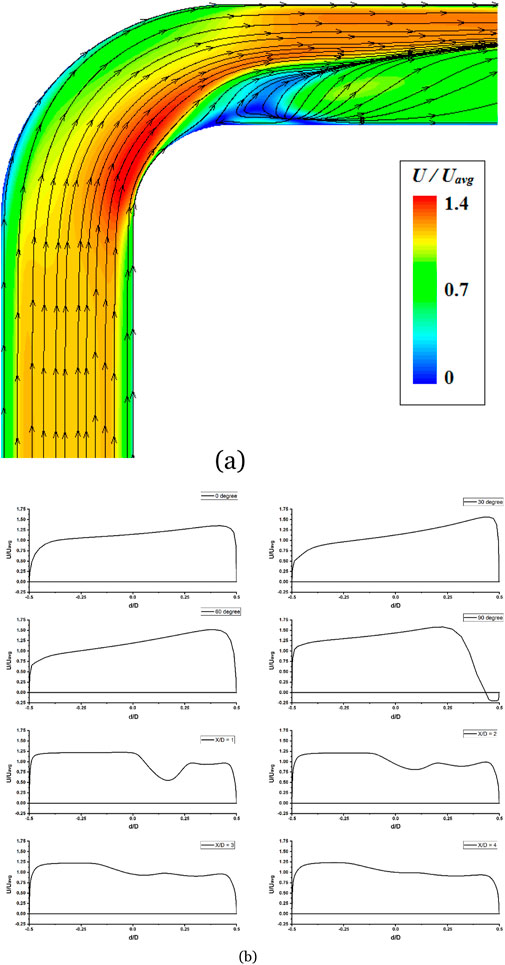
Figure 3. Couture plot of normalized mean axial velocity magnitude (A) and Velocity profiles (normalized) at various positions within the bend along the central symmetry plane (B) for Dn = 63245.
Not only does the existence of a centrifugal force brought about by the bend curvature have an effect on the main flow around the pipe centre, but it also has an effect on the portions that are close to the wall. The contour of the normalized mean axial velocity is displayed in the left portion of each picture in Figure 4, while the vector plot of the mean secondary flow is displayed in the right section of the figure. This is a clear demonstration of the issue. Alternatively, the inner wall is located at the bottom of each figure, while the outside wall is located at the top of each structure. A low velocity zone emerged near the inner wall, which can be readily noticed in the sectional view due to the centrifugal force. As was said before, the velocity moved towards the top wall after sixty degrees, and this region can be seen well. Due to the disproportion between the centrifugal force and the axial pressure gradient, it is reasonable to anticipate that the cross-sectional motion will be of this intensity. By looking at the vector plots of the mean secondary flow, which are displayed in the right-hand section of Figure 4, it is possible to observe this impact quite clearly. Within this context, every instance generates a unique cross-flow boundary layer at the side walls. This secondary motion results in the formation of a vertical velocity component, which in turn accelerates the flow in the direction of the bend centre in the radial direction.
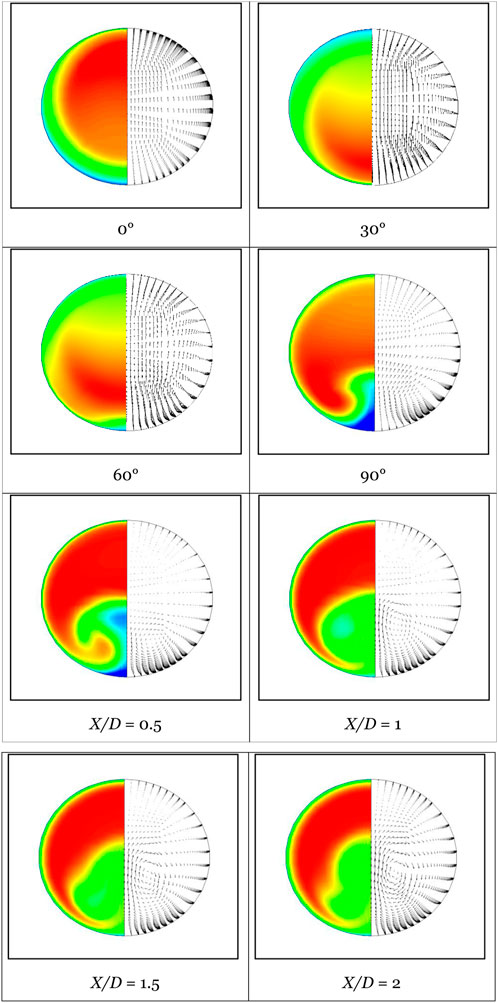
Figure 4. Contour plot (left section) of normalized axial velocity and vector plot (right section) of mean secondary flow in different section plane as indicated in each figure for Dn = 63245. Colour legends are same as Figure 3A.
Figure 5 clearly illustrates the flow direction towards the inner wall at 0°, while between 30 and 60°, a secondary flow gradually develops, leading to the creation of two vortices within the cross-section. This phenomenon arises due to the combined effects of centrifugal and viscous forces. Positioned near the pipe wall on the middle plane between the inner and outer walls, these opposing vortices rotate in opposite directions. As the angle approaches sixty degrees, the boundary layer starts detaching from the inner wall, forming a gap between the boundary layer and the wall. Concurrently, the main flow begins to recirculate, causing the vortices to tilt towards the inner wall. Near the inner wall region, a distinct pair of vortices becomes apparent at the bend outlet (90°). Beyond the bend outlet, located downstream of the curve, there is a noticeable tendency for the vortices to migrate towards the pipe centre as the distance from the bend increases.
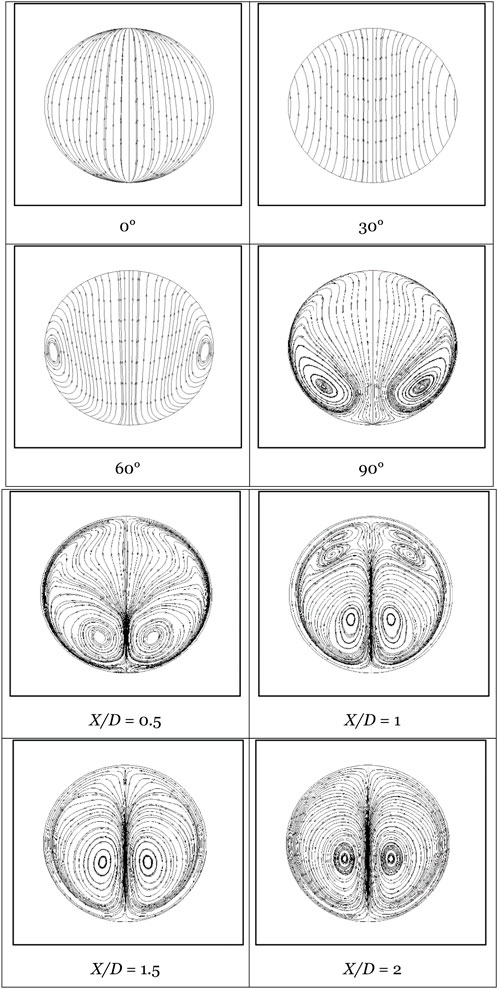
Figure 5. Secondary motion are shown as sectional streamlines in different section plane as indicated in each figure for Dn = 63245.
Figures 6A, B shows contour plots of pressure, normalized by reference pressure (
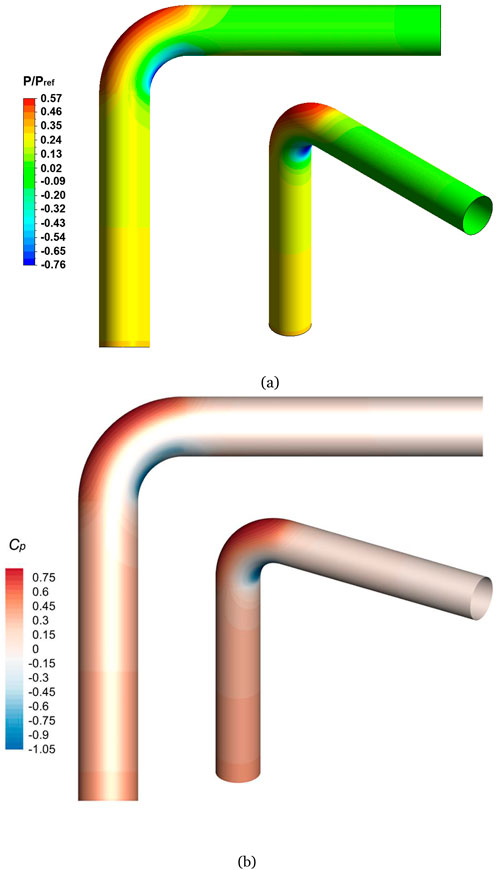
Figure 6. Pressure distribution in pipe wall; Contour plots of (A) normalized pressure and (B) pressure coefficient (Cp).
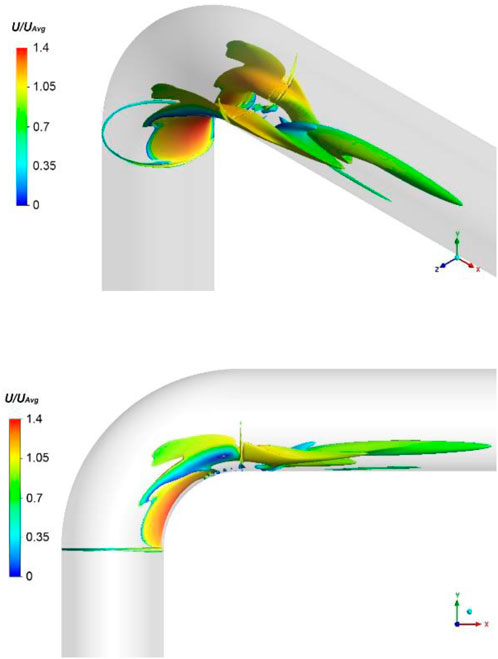
Figure 7. Iso-surfaces of Q-criterion (Q = 0.01, colour based on velocity) for Dn = 63245.
The Q-criterion is defined as follows:
where vorticity (function of rotation) and shear strain (rate of shear)
As can be seen from Figure 7, upstream of the bend, flow remains unaffected by the bend’s curvature. The fluid released from the bend inlet (
5 Conclusion
In this study, a numerical simulation utilizing the k-ε turbulent model was conducted to meticulously investigate the turbulent flow of a single-phase, incompressible fluid as it navigates through a 90-degree pipe bend. Detailed insights into the fluid dynamics within the bend were provided by the simulation. Upstream of the bend, the flow was found to be largely unaffected by the curvature of the pipe, maintaining a steady state. As the fluid progressed through the bend, specifically from 0 to 60°, a distinct pattern was observed: the flow accelerated at the inner core and decelerated at the outer core. This behaviour was driven by centrifugal forces that pushed the fluid away from the bend’s centre towards the outer wall, thereby generating secondary flow. Around the 60-degree mark, it was noted that the boundary layer began to detach from the inner wall, indicating a significant shift in flow characteristics. Furthermore, between 30 and 60°, the gradual formation of two vortices near the pipe wall at the mid-plane between the inner and outer walls was revealed by the simulation. These vortices were inclined towards the inner wall, reflecting complex flow interactions. By the time the fluid reached the bend outlet at 90°, a pronounced pair of vortices became evident near the inner wall region. As the flow moved further downstream from the bend, these vortices progressively migrated towards the centre of the pipe. This comprehensive analysis highlighted the intricate nature of turbulent flow in pipe bends and underscored the importance of understanding centrifugal forces and vortex dynamics for optimizing fluid transport systems.
Data availability statement
The original contributions presented in the study are included in the article/supplementary material, further inquiries can be directed to the corresponding author.
Author contributions
PD: Writing–original draft, Writing–review and editing. NR: Conceptualization, Writing–original draft. RC: Formal Analysis, Funding acquisition, Writing–review and editing. RK: Data curation, Formal Analysis, Writing–review and editing. HK: Investigation, Methodology, Supervision, Writing–review and editing. YN: Supervision, Writing–review and editing.
Funding
The author(s) declare that financial support was received for the research, authorship, and/or publication of this article. This article was co-funded by the European Union under the REFRESH – Research Excellence For REgion Sustainability and High-tech Industries project number CZ.10.03.01/00/22_003/0000048 via the Operational Programme Just Transition and has been done in connection with project Students Grant Competition SP2025/062 “Specific research on progressive and sustainable production technologies” financed by the Ministry of Education, Youth and Sports and Faculty of Mechanical Engineering VŠB-TUO.
Conflict of interest
The authors declare that the research was conducted in the absence of any commercial or financial relationships that could be construed as a potential conflict of interest.
Publisher’s note
All claims expressed in this article are solely those of the authors and do not necessarily represent those of their affiliated organizations, or those of the publisher, the editors and the reviewers. Any product that may be evaluated in this article, or claim that may be made by its manufacturer, is not guaranteed or endorsed by the publisher.
References
Abbasi, W. S., Ehsan, M., Rahman, H., Uddin, Z., Hassan, M. M., and Saleem, K. (2024). Analysis of the wake mechanism in external flow around tandem bluff bodies with different aspect ratios. Front. Mech. Eng. 10. doi:10.3389/fmech.2024.1341618
Abdolahipour, S. (2023). Effects of low and high frequency actuation on aerodynamic performance of a supercritical airfoil. Front. Mech. Eng. 9. doi:10.3389/fmech.2023.1290074
Abdolahipour, S., Mani, M., and Shams Taleghani, A. (2021). Parametric study of a frequency-modulated pulse jet by measurements of flow characteristics. Phys. Scr. 96, 125012. doi:10.1088/1402-4896/ac2bdf
Abdolahipour, S., Mani, M., and Shams Taleghani, A. (2022a). Experimental investigation of flow control on a high-lift wing using modulated pulse jet vortex generator. J. Aerosp. Eng. 35. doi:10.1061/(ASCE)AS.1943-5525.0001463
Abdolahipour, S., Mani, M., and Shams Taleghani, A. (2022b). Pressure improvement on a supercritical high-lift wing using simple and modulated pulse jet vortex generator. Flow. Turbul. Combust. 109, 65–100. doi:10.1007/s10494-022-00327-9
Al-Rashed, A. A. A. A., Roy, N. C., and Hossain, M. A. (2017). Effects of viscous dissipation on unsteady mixed convection heat transfer from a circular cylinder for parallel and contra flows. Front. Mech. Eng. 3. doi:10.3389/fmech.2017.00002
Carloni, A. C. N., de Conde, K. E., Pantaleão, A. V., de Azevedo, J. L. F., and Rade, D. A. (2022). Validation and analysis of turbulence modeling in pipe elbow under secondary flow conditions. J. Braz. Soc. Mech. Sci. Eng. 44, 595. doi:10.1007/s40430-022-03899-9
Di Liberto, M., Di Piazza, I., and Ciofalo, M. (2013). Turbulence structure and budgets in curved pipes. Comput. Fluids 88, 452–472. doi:10.1016/j.compfluid.2013.09.028
Di Piazza, I., and Ciofalo, M. (2011). Transition to turbulence in toroidal pipes. J. Fluid Mech. 687, 72–117. doi:10.1017/jfm.2011.321
Duarte, C. A. R., de Souza, F. J., Salvo, R. de V., and dos Santos, V. F. (2017). The role of inter-particle collisions on elbow erosion. Int. J. Multiph. Flow. 89, 1–22. doi:10.1016/j.ijmultiphaseflow.2016.10.001
Dutta, P., Chattopadhyay, H., and Nandi, N. (2022a). Numerical studies on turbulent flow field in a 90 deg pipe bend. J. Fluids Eng. 144. doi:10.1115/1.4053547
Dutta, P., Chattopadhyay, H., and Nandi, N. (2022b). Numerical studies on turbulent flow field in a 90 deg pipe bend. J. Fluids Eng. 144. doi:10.1115/1.4053547
Dutta, P., and Nandi, N. (2019). Numerical study on turbulent separation reattachment flow in pipe bends with different small curvature ratio. J. Inst. Eng. Ser. C 100, 995–1004. doi:10.1007/s40032-018-0488-9
Dutta, P., and Nandi, N. (2021). Numerical analysis on the development of vortex structure in 90° pipe bend. Prog. Comput. Fluid Dyn. An Int. J. 21, 261. doi:10.1504/pcfd.2021.10039615
Dutta, P., Saha, S. K., Nandi, N., and Pal, N. (2016). Numerical study on flow separation in 90° pipe bend under high Reynolds number by k-ε modelling. Eng. Sci. Technol. Int. J. 19, 904–910. doi:10.1016/j.jestch.2015.12.005
Ekat, A.-K., Weissenbrunner, A., Straka, M., Eichler, T., and Oberleithner, K. (2023). Hybrid LES/RANS simulations of a 90° pipe bend using different CFD solvers. OpenFOAM® J. 3, 49–65. doi:10.51560/ofj.v3.36
El Khoury, G. K., Schlatter, P., Noorani, A., Fischer, P. F., Brethouwer, G., and V Johansson, A. (2013). Direct numerical simulation of turbulent pipe flow at moderately high Reynolds numbers. Turbul. Combust. 91, 475–495. doi:10.1007/s10494-013-9482-8
Gamahara, M., and Hattori, Y. (2017). Searching for turbulence models by artificial neural network. Phys. Rev. Fluids 2, 054604. doi:10.1103/physrevfluids.2.054604
Ganesh, N., Dutta, P., Ramachandran, M., Bhoi, A. K., and Kalita, K. (2020). Robust metamodels for accurate quantitative estimation of turbulent flow in pipe bends. Eng. Comput. 36, 1041–1058. doi:10.1007/s00366-019-00748-7
Ghanbari, J., Dehparvar, A., and Zakeri, A. (2022). Design and analysis of prosthetic heart valves and assessing the effects of leaflet design on the mechanical attributes of the valves. Front. Mech. Eng. 8. doi:10.3389/fmech.2022.764034
Gholami, A., Bonakdari, H., Fenjan, S. A., and Akhtari, A. A. (2016b). Flow variables prediction using experimental, computational fluid dynamic and artificial neural network models in a sharp bend. Int. J. Eng. 29, 14–22.
Gholami, A., Bonakdari, H., Zaji, A. H., Michelson, D. G., and Akhtari, A. A. (2016a). Improving the performance of multi-layer perceptron and radial basis function models with a decision tree model to predict flow variables in a sharp 90° bend. Appl. Soft Comput. 48, 563–583. doi:10.1016/j.asoc.2016.07.035
Gul, F., Nazeer, G., Sana, M., Shigri, S. H., and Islam, S. U. (2024). Extensive study of flow characters for two vertical rectangular polygons in a two-dimensional cross flow. Front. Mech. Eng. 9. doi:10.3389/fmech.2023.1334830
Han, Y., Zhou, L., Bai, L., Shi, W., and Agarwal, R. (2021). Comparison and validation of various turbulence models for U-bend flow with a magnetic resonance velocimetry experiment. Phys. Fluids. 33. doi:10.1063/5.0073910
Hari Ponnamma, R., Teegala, D., Ravi Ranjan, S., Kain, V., and Dipak Kumar, B. (2014). Numerical simulation of turbulent flow in carbon steel pipes leading to flow accelerated corrosion. Arab. J. Sci. Eng. 39, 6435–6451. doi:10.1007/s13369-014-1262-9
Hellstrom, L. H. O., Zlatinov, M. B., Smits, A. J., and Cao, G. (2011). “Turbulent pipe flow through a 90 bend,” in Seventh int. Symp. Turbul. Shear flow phenom. (Danbury, Connecticut, USA: Begel House Inc.).
Homicz, G. F. (2004). Computational Fluid Dynamic simulations of pipe elbow flow. New Mexico, California: Sandia National Laboratories.
Hufnagel, L., Canton, J., Örlü, R., Marin, O., Merzari, E., and Schlatter, P. (2018). The three-dimensional structure of swirl-switching in bent pipe flow. J. Fluid Mech. 835, 86–101. doi:10.1017/jfm.2017.749
Hüttl, T. J., and Friedrich, R. (2001). Direct numerical simulation of turbulent flows in curved and helically coiled pipes. Comput. Fluids 30, 591–605. doi:10.1016/S0045-7930(01)00008-1
Jain, P., Choudhury, A., Dutta, P., Kalita, K., and Barsocchi, P. (2021). Random forest regression-based machine learning model for accurate estimation of fluid flow in curved pipes. Processes 9, 2095. doi:10.3390/pr9112095
Kalpakli, A., and Örlü, R. (2013). Turbulent pipe flow downstream a 90° pipe bend with and without superimposed swirl. Int. J. Heat. Fluid Flow. 41, 103–111. doi:10.1016/j.ijheatfluidflow.2013.01.003
Kalpakli Vester, A., Örlü, R., and Alfredsson, P. H. (2016). Turbulent flows in curved pipes: recent advances in experiments and simulations. Appl. Mech. Rev. 68. doi:10.1115/1.4034135
Kim, J., Yadav, M., and Kim, S. (2014). Characteristics of secondary flow induced by 90-degree elbow in turbulent pipe flow. Eng. Appl. Comput. Fluid Mech. 8, 229–239. doi:10.1080/19942060.2014.11015509
Madasamy, P., Chandramohan, P., Mukunthan, M., Krishna Mohan, T. V., Rangarajan, S., Uttam, N., et al. (2021). Flow accelerated corrosion rate on carbon steel pipe bend by thin layer activation technique and computational modeling: under PHWR operating conditions. Eng. Fail. Anal. 121, 105125. doi:10.1016/j.engfailanal.2020.105125
Marmorino, G. O., Smith, G. B., North, R. P., and Baschek, B. (2018). Application of airborne infrared remote sensing to the study of ocean submesoscale eddies. Front. Mech. Eng. 4. doi:10.3389/fmech.2018.00010
Mirzaei, M., Taleghani, A. S., and Shadaram, A. (2012). Experimental study of vortex shedding control using plasma actuator. Appl. Mech. Mater. 186, 75–86. doi:10.4028/www.scientific.net/AMM.186.75
Narayanan, G., Joshi, M., Dutta, P., and Kalita, K. (2020). PSO-tuned support vector machine metamodels for assessment of turbulent flows in pipe bends. Eng. Comput. 37, 981–1001. doi:10.1108/ec-05-2019-0244
Noorani, A., El Khoury, G. K. K., and Schlatter, P. (2013). Evolution of turbulence characteristics from straight to curved pipes. Int. J. Heat. Fluid Flow. 41, 16–26. doi:10.1016/j.ijheatfluidflow.2013.03.005
Ono, A., Kimura, N., Kamide, H., and Tobita, A. (2011). Influence of elbow curvature on flow structure at elbow outlet under high Reynolds number condition. Nucl. Eng. Des. 241, 4409–4419. doi:10.1016/j.nucengdes.2010.09.026
Rani, H. P., Divya, T., Sahaya, R. R., Kain, V., and Barua, D. K. (2014). CFD study of flow accelerated corrosion in 3D elbows. Ann. Nucl. Energy. 69, 344–351. doi:10.1016/j.anucene.2014.01.031
Röhrig, R., Jakirlić, S., and Tropea, C. (2015). Comparative computational study of turbulent flow in a 90° pipe elbow. Int. J. Heat. Fluid Flow. 55, 120–131. doi:10.1016/j.ijheatfluidflow.2015.07.011
Sakakibara, J., and Machida, N. (2012). Measurement of turbulent flow upstream and downstream of a circular pipe bend. Phys. Fluids. 24, 41702. doi:10.1063/1.4704196
Sudo, K., Sumida, M., and Hibara, H. (1998). Experimental investigation on turbulent flow in a circular-sectioned 90-degree bend. Exp. Fluids. 25, 42–49. doi:10.1007/s003480050206
Takamura, H., Ebara, S., Hashizume, H., Aizawa, K., and Yamano, H. (2012). Flow visualization and frequency characteristics of velocity fluctuations of complex turbulent flow in a short elbow piping under high Reynolds number condition. J. Fluids Eng. 134. doi:10.1115/1.4007436
Taleghani, A. S., Shadaram, A., Mirzaei, M., and Abdolahipour, S. (2018). Parametric study of a plasma actuator at unsteady actuation by measurements of the induced flow velocity for flow control. J. Braz. Soc. Mech. Sci. Eng. 40, 173. doi:10.1007/s40430-018-1120-x
Tanaka, M., and Ohshima, H. (2012). Numerical investigation on large scale eddy structure in unsteady pipe elbow flow at high Reynolds number conditions with large eddy simulation approach. J. Power Energy Syst. 6, 210–228. doi:10.1299/jpes.6.210
Tu, J., Yeoh, G. H., and Liu, C. (2018). Computational fluid dynamics: a practical approach. Butterworth-Heinemann.
Vester, A. K., Sattarzadeh, S. S., and Örlü, R. (2016). Combined hot-wire and PIV measurements of a swirling turbulent flow at the exit of a 90° pipe bend. J. Vis. 19, 261–273. doi:10.1007/s12650-015-0310-1
Wallin, S., and Johansson, A. V. (2002). Modelling streamline curvature effects in explicit algebraic Reynolds stress turbulence models. Int. J. Heat. Fluid Flow. 23, 721–730. doi:10.1016/S0142-727X(02)00168-6
Wang, Z., Örlü, R., Schlatter, P., and Chung, Y. M. (2018). Direct numerical simulation of a turbulent 90° bend pipe flow. Int. J. Heat. Fluid Flow. 73, 199–208. doi:10.1016/j.ijheatfluidflow.2018.08.003
Keywords: pipe bend flow, numerical simulations, Dean vortices, k-e model, turbulent flow in pipelines
Citation: Dutta P, Rajendran NK, Cep R, Kumar R, Kumar H and Nirsanametla Y (2025) Numerical investigation of Dean vortex evolution in turbulent flow through 90° pipe bends. Front. Mech. Eng. 11:1405148. doi: 10.3389/fmech.2025.1405148
Received: 22 March 2024; Accepted: 10 February 2025;
Published: 04 March 2025.
Edited by:
Nitesh Nama, University of Nebraska-Lincoln, United StatesReviewed by:
Hari Ponnamma Rani, National Institute of Technology Warangal, IndiaArash Shams Taleghani, Research and Technology, Iran
Soheila Abdolahipour, Aerospace Research Institute, Iran
Copyright © 2025 Dutta, Rajendran, Cep, Kumar, Kumar and Nirsanametla. This is an open-access article distributed under the terms of the Creative Commons Attribution License (CC BY). The use, distribution or reproduction in other forums is permitted, provided the original author(s) and the copyright owner(s) are credited and that the original publication in this journal is cited, in accordance with accepted academic practice. No use, distribution or reproduction is permitted which does not comply with these terms.
*Correspondence: Prasun Dutta, cGQuaWllc3RAZ21haWwuY29t