 Jin-Ling Chai1
 Yong Wang
- 1Architectural Engineering Department, Henan College of Transportation, Zhengzhou, China
- 2School of Civil Engineering, Zhengzhou University, Zhengzhou, China
In this study, the bridge structure is subjected to fatigue analysis. While the vehicle load application method for medium- and small-span bridges is relatively well-established, methods for fatigue analysis of large-span bridges under vehicle loads are still limited. This paper summarizes the vehicle load application method for fatigue analysis of medium- and small-span bridges in foreign countries. Based on the sling of a large-span suspension bridge, a vehicle load application method for sling fatigue analysis in long-span suspension bridges is proposed. The proposed method is compared and analyzed, and relevant conclusions are drawn, which provides a reasonable approach for the fatigue analysis of cable structures in long-span bridges.
1 Introduction
The fatigue analysis of long-span bridge structures has emerged as a critical concern for engineers and technical professionals, particularly in the context of multiple load factors. Fatigue issues primarily arise from variable actions during bridge operation, including vehicle loads, wind loads, and braking forces, with repeated vehicle loads being the most significant contributor. Although preliminary research exists regarding loading methods for medium- and small-span bridges, systematic results for long-span bridges are still lacking (Ding, 2024; Wang and Zhang, 2023; Xu et al., 2023).
As the economy and infrastructure develop rapidly, the construction of long-span bridges has increased, leading to a heightened incidence of fatigue-related issues, particularly in suspension bridges. This underscores the need for dedicated research on vehicle load application methods to address the fatigue problems associated with these structures, which holds substantial practical value.
Existing standards, such as the British BS 5400 specification, stipulate that only one fatigue vehicle should be considered in a lane at any given time. Each sub-lane must be calculated separately, with loadings applied only to the slow and adjacent lanes. The simultaneous loading of vehicles is also addressed (Chen et al., 2023; Li et al., 2023). Similarly, the European Eurocode1 recommends considering only one fatigue vehicle for calculations, although it allows for two vehicles in the same lane when their center-to-center distance exceeds 40 m (Wang, 2023; Ma, 2023). Wang et al. (2023), in their study on the Hong Kong–Zhuhai–Macao bridge, focused solely on the slow and adjacent lanes, neglecting the longitudinal multi-vehicle effect and addressing only the transverse multi-vehicle effect.
Internationally, vehicle load modeling for fatigue analysis of small- and medium-span bridges has been standardized in codes such as the British BS 5400 and Eurocode 1. These methods typically adopt a single-vehicle assumption within each lane, with empirical correction factors to approximate multi-vehicle effects. For example, BS 5400 considers only one fatigue vehicle per lane at any time, ignoring longitudinal interactions beyond 200 m influence lines. Transverse multi-vehicle effects are simplified via static superposition. Eurocode 1 allows two vehicles in the same lane if their spacing exceeds 40 m, but it limits applicability to spans <150 m.
However, these methods rely on static load envelopes and simplified influence line truncation (e.g., ignoring long-tail effects), making them unsuitable for long-span suspension bridges where stress influence lines exceed 250 m. This gap motivates our proposed dynamic multi-vehicle loading framework.
This study delves into the suspension cables of large-scale suspension bridges with a cross-section, utilizing finite element analysis software for realistic simulations. It reviews the existing body of research from both domestic and international perspectives and performs a comparative analysis of vehicle and horizontal loading effects on the cables of large suspension bridges. The research provides actionable insights for engineering applications and enhances strategies for bridge operation and maintenance. By pinpointing the current state of progress, challenges, and potential areas for future research, this work aspires to make a significant and innovative contribution to the field of bridge fatigue analysis.
2 Project overview, finite element modeling, and standard fatigue vehicle determination
2.1 Project overview
This project relies on a long-span suspension bridge with a span arrangement of 578 m + 1650 m + 485 m. A steel box girder suspension structure is used for the northern and middle spans, and a prestressed concrete continuous box girder is used for the southern span. The main cable height is 165 m, and the ratio of the beam to span is 1/10. The designed running speed of the bridge is 80 km/h, with four lanes in both directions as shown in Figure 1; the stiffened beams are flat and streamlined separated double-box steel box beams, and the suspenders are straddle-type steel rope suspenders. Its structure is shown in Figure 2, which is only set in the northern and middle spans, with 119 pairs in total. The horizontal distance between the side suspenders and the center line of the tower is 24 m, and the horizontal distance between the other suspenders is 18 m (Yang H. et al., 2023; Liu 2024). In this paper, the 45# sling is taken as an example, and its material parameters are shown in Table 1.

Figure 1. Deck lane layout.
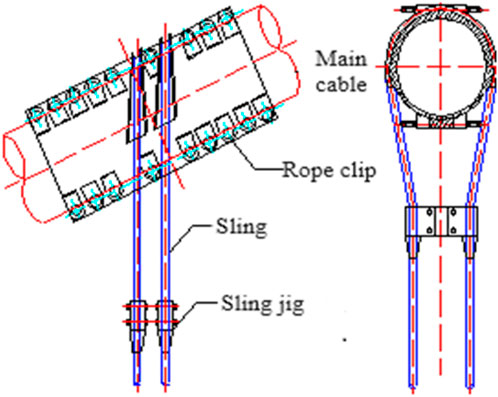
Figure 2. Straddle sling structure.

Table 1. 45# Material parameters of the sling.
2.2 Establishment and verification of the finite element model
The finite element model was developed in ANSYS Mechanical APDL with the following configurations to ensure accuracy and reproducibility: bridge girders and towers were modeled using BEAM44 3D linear elastic beam elements (six degrees of freedom per node), while the main cables and suspenders were simulated with LINK180 uniaxial tension-only spar elements. A uniform mesh size of 10 cm was applied to all structural components to balance computational efficiency and resolution. Boundary conditions included fixed supports at the base of bridge towers to replicate real-world anchorage, rigid constraints at the main cable endpoints to mimic abutment connections, and multi-point constraints (MPCs) to enforce displacement compatibility between the suspenders and the deck. Material properties for the 45# slings were explicitly defined. The model’s validity was confirmed through modal analysis, showing strong alignment with benchmark studies in reference. The integrated rigid nodes connect to the suspension cables, forming a “fishbone”-type bracing system (Yang D. et al., 2023). The main cable is connected to the top of the bridge tower to couple its three flat freedom; rigid constraints are used at the bottom of the bridge tower and the main end of the main cable (Huang et al., 2023). When conducting modal analysis, the NLGEON and PSTRES optionsmust be enabled, and a static analysis must be performed before the modal analysis. According to the modal analysis of the finite element model, the frequency of vibration of the first 10 levels of the bridge is shown in Table 2. Compared with the frequency in other research documents, the two are closer, indicating that the establishment of the model is more applicable.
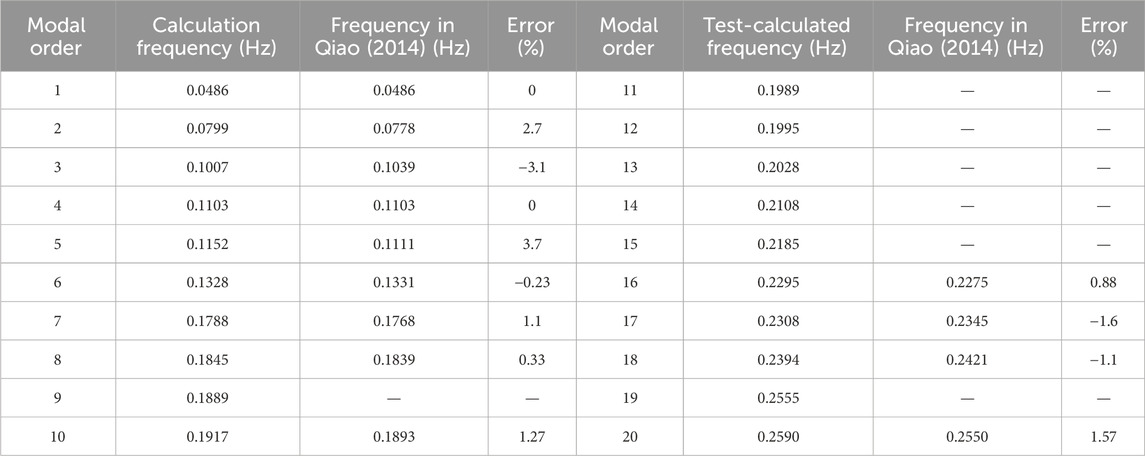
Table 2. Longitudinal drift state frequency of the long-span suspension bridge.
2.3 Determination of standard fatigue vehicles
Under the premise of satisfying the research purpose, in order to facilitate calculation, models that have a smaller impact on the large-span structure of the bridge can be ignored (Qiao, 2014). Therefore, this article ignores models with a weight of less than 30 kN and a model with a proportion of traffic less than 0.1%. Based on the measured traffic data of Zhao Jian-Feng at Chang’an University (Gu et al., 2022), according to the principle of equivalent fatigue damage, various types of vehicles are equivalent to eight typical cars (N1–N8), and the eight typical cars and corresponding standard fatigue are calculated (Yan et al., 2023). The total weight of the car is calculated based on the formula of the typical car and standard fatigue vehicles. The calculation results are shown in Table 3.
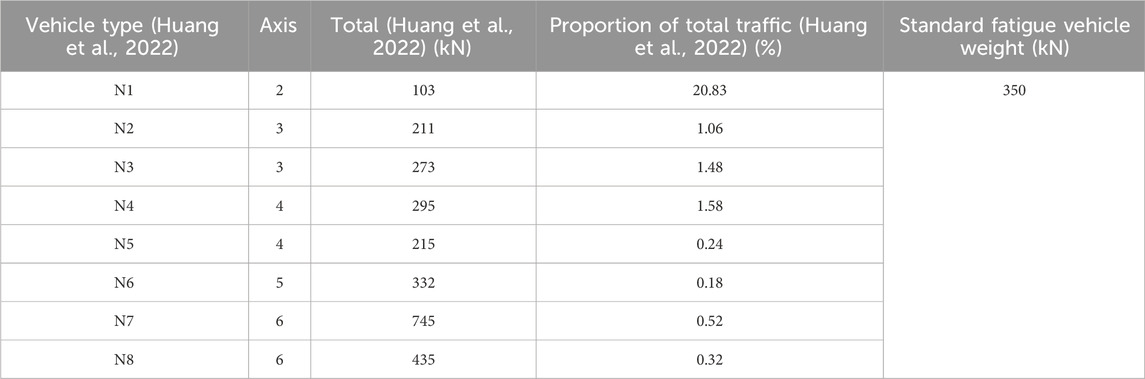
Table 3. Equivalent gross weight of a typical vehicle and a standard fatigue vehicle of the long-span suspension bridge.
In Formula 1,
3 Longitudinal loading method of vehicle load
3.1 Sling fatigue analysis based on the longitudinal loading method of the British BS 5400 standard vehicleload
According to the British BS 5400 specification, each sub-lane on the structure has only one standard fatigue vehicle running at any time, each sub-lane should be calculated separately, and only the slow lane and adjacent lane should be loaded. Finally, the multi-vehicle effect correction coefficient is used to consider the situation of multiple vehicles loading at the same time (Chen et al., 2023), and the calculation steps are as follows:
(1) The stress amplitude (
(2) The equivalent stress range
(3) Formula 3: fatigue S–N curve of the sling is used to calculate the corresponding fatigue failure number N under the effect of equivalent stress amplitude
(4) The fatigue damage D of the sling is calculated using Formula 4, based on the linear damage accumulation criterion.
In the formula,
In this paper, the static method is used to solve the stress influence line of the sling, and the specific steps are as follows (Gu et al., 2022): the finite element model is constructed and verified; the starting and end points of the unit force loading are determined, along with the corresponding node number. The unit force is loaded and solved using the cyclic command of ANSYS. After processing the time history data, the stress influence line of the sling is plotted using the distance from the bridge head as the horizontal coordinate. The calculation results are shown in Figure 3. As shown in Figure 3, the bottom edge length of the stress influence line of the No. 45 sling in the same section with the largest ordinate is approximately 250 m (Yan et al., 2023; Huang et al., 2022; Mei, 2022). Since the British BS 5400 specification does not consider the condition that the length of the bottom edge of the influence line is greater than 200 m, this paper takes the maximum Y = 2 according to the most unfavorable condition and corrects the longitudinal multi-vehicle effect according to Formula 5, where Y is the correction factor for multi-vehicle effect (BS 5400) of the British specification.
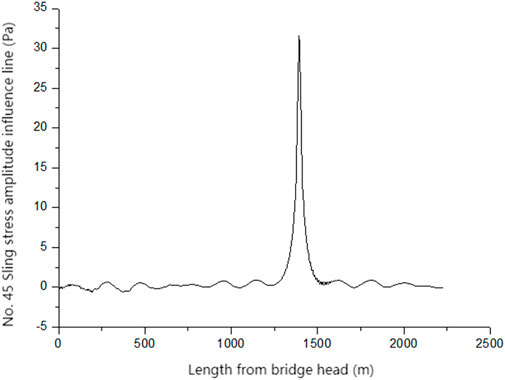
Figure 3. 45# stress influence line of the sling.
3.2 The method of longitudinal loading of vehicle load is proposed
Taking the 45# sling as an example, the stress amplitude of the sling under single-lane action of a standard fatigue vehicle is analyzed. First, the stress influence line of the 45# sling under single-lane action of a standard fatigue vehicle is obtained according to the code. Then, according to vehicle type and vehicle speed, the number of standard fatigue vehicles that can be accommodated at the same time within the influence line is determined to consider the longitudinal multi-vehicle effect.
In this paper, the standard fatigue vehicle is considered heavy, and the running speed of the vehicle corresponds one-to-one with the safety distance (Chen et al., 2022; Shan et al., 2021; Zhou et al., 2021). Assuming that the driving speed of the heavy vehicle is 60 km/h, the center distance of the vehicle is 60 m. The stress influence lines of four sub-lanes of the 45# sling under the action of a single lane of the standard fatigue vehicle are shown in Figure 4. As shown in Figure 4, the length of the bottom edge of the influence line of the 45# sling stress amplitude in the same section with the maximum longitudinal coordinate is approximately 250 m, and up to four fatigue vehicles can be accommodated within the length range of the bottom edge of the influence line. The stress amplitude of the 45# sling when the standard fatigue vehicle runs separately on different lanes is shown in Table 4.
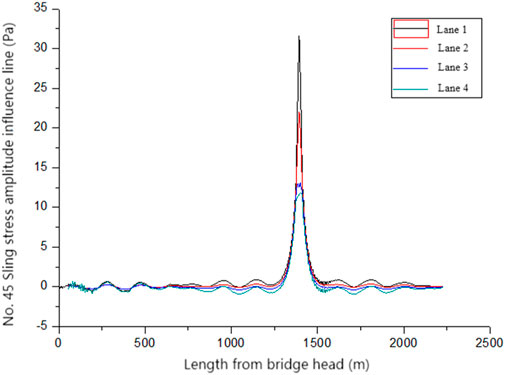
Figure 4. Stress influence line of sling sub-lanes under the action of a single lane of a standard fatigue vehicle.
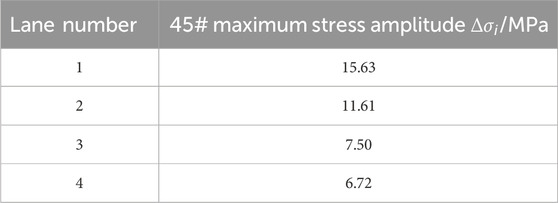
Table 4. Maximum stress amplitude of the 45# sling under the action of a single lane of a standard fatigue vehicle.
3.3 Comparison of equivalent stress amplitude and daily fatigue damage degree of the 45# sling under different longitudinal loading methods
The equivalent stress amplitude and daily fatigue damage of the 45# sling under different longitudinal loading methods calculated according to this research method are shown in Table 5. The stress amplitude and daily fatigue damage are the highest for the proposed longitudinal loading method, intermediate for the European code, and lowest for the British code. Since the method proposed by the British and European codes is relatively suitable for small- and medium-sized-span bridges and the same calculation method is also used for long-span suspension bridges, the calculation results obviously have significant deviations and are not suitable for the actual fatigue state of bridges. The calculation method proposed in this paper has certain applicability to the vehicle loading method for analyzing the suspension fatigue problem of long-span suspension bridges.
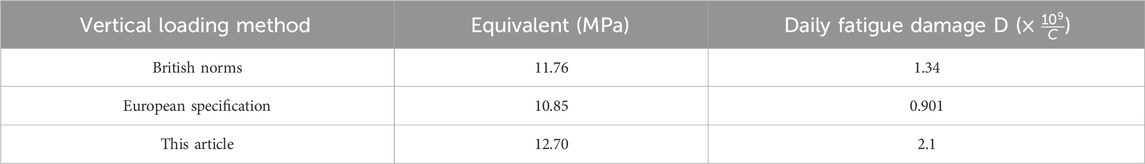
Table 5. 45# sling equivalent stress amplitude and daily damage.
4 Lateral loading method of vehicle load
4.1 The method of lateral loading of vehicle load is proposed
The lateral loading method of tired vehicles focuses on the mutual influence of the lateral multi-vehicle effect. In order to facilitate calculation and simulation, the study condition is only one vehicle in each lane. In the study of this condition, the most unfavorable state of vehicle action is found; that is, when the transverse vehicles meet, they are in the most unfavorable position of each lane. Vehicles in each lane travel at the same and uniform speed. The stress amplitude of each lane vehicle is greater than the fatigue limit of varying amplitude (Cai et al., 2016).
Suppose that the probability of two-lane, three-lane, and four-lane vehicles meeting is respectively P2, P3, and P4 (Chen et al., 2022); then,
In the Formula 6, t is the time required for the standard fatigue vehicle to pass through the most unfavorable position of the lane under the load of the sling, and it is taken as 0.6 s. It is considered that all vehicles pass centrally during the day, and the time domain S is 43,200 s.
The number of encounters of two-lane, three-lane, and four-lane vehicles, namely, m2, m3, and m4, are calculated using Formulas 7−9, respectively, and the results are shown in Table 6.
In the formula, ni, nj, ns, and nt are the number of times that vehicles on four lanes pass a given section of each lane in the time domain S. i, j, s, and t can each take values between 1 and 4 and must not be equal to one another.
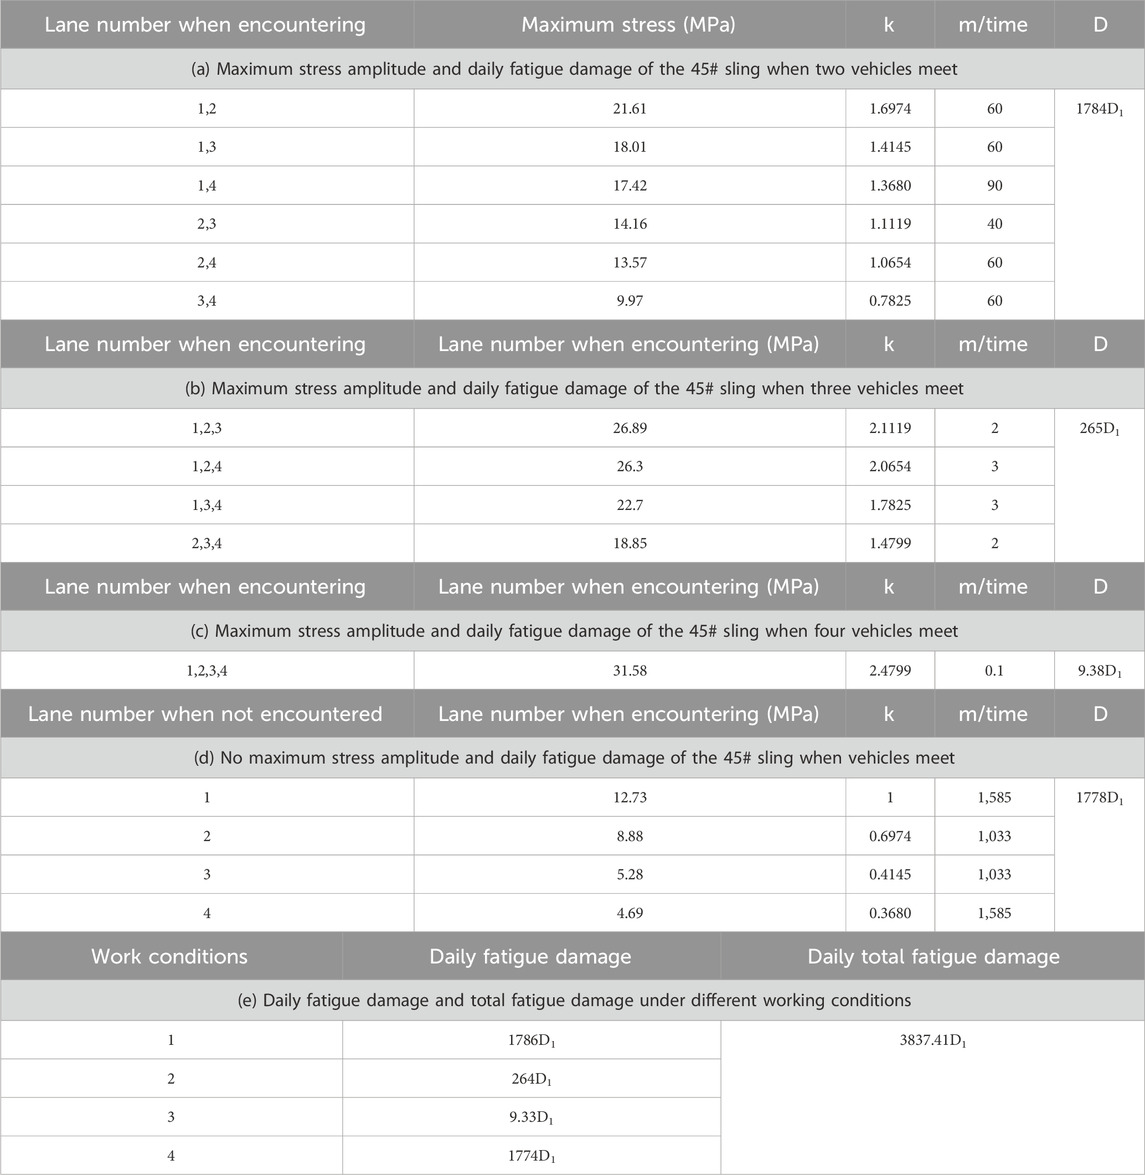
Table 6. Maximum stress amplitude and daily fatigue damage of the 45# sling under different working conditions.
Based on the maximum stress amplitude of the 45# sling obtained under single-lane action of a standard fatigue vehicle in Table 4, this paper calculates the fatigue damage generated each time when the standard fatigue vehicle is independently loaded in the most unfavorable lane of the sling, according to Formula 10. The daily total fatigue damage was calculated according to Formula 11.
In the formula, D is the daily total fatigue damage, D1 is the fatigue damage of the standard fatigue vehicle each time when it is independently loaded in the most unfavorable lane of the sling, m is the number of occurrences, and k is the ratio of the stress amplitude to
4.2 Comparative analysis of daily fatigue damage of the sling using different lateral loading methods
The daily fatigue damage degree of the 45# sling was calculated using the vehicle lateral loading method proposed in this paper and compared with the loading method provided by the British code, as shown in Table 7. The results indicate that the daily fatigue damage obtained by the proposed method is 2.68 times higher than that calculated using the British standard. This difference highlights a critical limitation to the British code, which primarily focuses on small- and medium-span bridges and does not account for the unique fatigue stress characteristics of suspension cables in long-span bridges. By addressing these gaps, the vehicle lateral loading method presented in this study demonstrates enhanced accuracy and broader applicability, making it a valuable tool for engineering applications, particularly in the context of long-span bridge design and analysis.
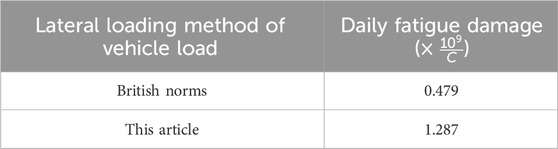
Table 7. Comparison of daily fatigue damage degree of the 45# sling.
5 Conclusion
This research proposes longitudinal and transverse loading methods for fatigue vehicles on long-span suspension bridges, demonstrating their rationality and effectiveness. Notably, the equal fatigue damage calculated using the longitudinal loading method exceeds that derived from foreign standards, indicating a significant difference in analysis outcomes. Furthermore, the fatigue damage determined using the lateral loading method is found to be 2.68 times greater than that calculated using the British standard.
The findings highlight that although vehicle load application methods are well-established for fatigue analysis of small- and medium-span bridges, they are inadequate for addressing the unique challenges associated with the fatigue of long-span suspension bridges. The vehicle load methods introduced in this study offer a more appropriate and rational approach for fatigue analysis in these structures, thereby contributing valuable insights for engineering practice.
This work provides a solid foundation for further research into the fatigue behavior of long-span bridge structures and offers practical reference points for engineers engaged in the analysis and maintenance of such critical infrastructure.
Data availability statement
The original contributions presented in the study are included in the article/supplementary material; further inquiries can be directed to the corresponding author.
Author contributions
J-LC: Methodology and Writing – original draft. YW: Data curation and Writing – original draft. L-XX: Investigation, Methodology, and Writing – review and editing. S-LL: Formal analysis and Writing – review and editing.
Funding
The author(s) declare that financial support was received for the research and/or publication of this article. This study was supported by the Science and technology project of Henan Provincial Department of Transportation (2018J3) and the Key Scientific Research Project Plan of Henan University (23A580005).
Conflict of interest
The authors declare that the research was conducted in the absence of any commercial or financial relationships that could be construed as a potential conflict of interest.
The reviewer PG declared a shared affiliation with the author SL at the time of review.
Publisher’s note
All claims expressed in this article are solely those of the authors and do not necessarily represent those of their affiliated organizations, or those of the publisher, the editors and the reviewers. Any product that may be evaluated in this article, or claim that may be made by its manufacturer, is not guaranteed or endorsed by the publisher.
References
Cai, X., Liu, W., Xie, K., Tan, X., and Zhang, Q. (2021). The seamless lines on the large cross-suspension bridge comparison the longitudinal force analysis and structural scheme. J. China Railway Soc. 43 (2), 160–167.
Chen, Y., Zheng, C., Ma, L., and Zheng, J. (2022). The application research of the new type of damping the vibration control in the large span floating system bridge. Eng. seismic Reinf. 44 (01), 88–94+101. doi:10.16226/J.ISSN.1002-8412.2022.01.011
Chen, Z., Hua, X., Feng, Z., Cui, B., and Zhang, J. (2023). Damping characteristics and identification methods for long-span bridges: a review. China J. Highw. Transp. 36 (07), 1–30. doi:10.19721/J.CNKI.1001-7372.2023.07.001
Ding, L. (2024). Consider the fatigue reliability analysis of the large span steel box beam suspension bridge of material corrosion. Transp. Technol. (01), 76–80.
Gu, Y., Qi, H., and Cui, H. (2022). Digitalization makes traffic more intelligent. Econ. Dly. (006). doi:10.28425/n.cnki.njjrb.2022.006919
Huang, G., Hu, J., Cui, J., Sun, G., and Song, X. (2022). Study on girder end displacement characteristics of steel truss suspension bridge based on measurement data. J. Highw. Transp. Res. Dev. 39 (05), 65–73.
Huang, G., Hu, J., Wan, T., Hua,, X., Feng, Z., and Chen, Z. (2023). The characteristics and mechanism of the vertical change of the suspension bridge under vertical load. J. Hunan Univ. 50 (1), 78–89. doi:10.16339/j.cnki.hdxbzkb.2023.01.008
Li, H., Ruan, X., and Liu, G. (2023). Waiting for the carrier effect analysis of vehicle load effects of 2300M oversized steel box beam suspension bridge vehicle carrier effect. Highway 68 (06), 47–51.
Liu, Z. (2024). Consider the analysis of time domain analysis of large span cable bridges with non -stable characteristics of pulsating air.
Ma, X. (2023). Suspension bridge suspension cable corrosion and fatigue life analysis. Master’s degree. (Hebei, China: Shijiazhuang Railway University). doi:10.27334/d.cnki.gStdy.2023.000604
Mei, D. (2022). Study on the health monitoring and early warning method of large -span high -speed rail bridge health monitoring based on deep learning. Shenzhen, China: Southwest Jiaotong University. doi:10.27414/d.cnki.gxnju.2022.000040
Qiao, J. (2014). Finite element analysis and load test of dynamic characteristics of composite box girder bridge with corrugated steel webs. Henan Sci. 32 (05), 785–789.
Shan, D., Luo, L., and Li, Q. (2021). Bridge health monitoring 2020 research progress. J. Civ. Eng. Environ. Eng. Chin. Engl. 43 (S1), 129–134.
Wang, C., Wang, K., Liu, S., Song, J., and Yao, S. (2023). Bridge damage warning method based on LSTM neural network. World bridge 51 (03), 81–88. doi:10.20052/J.ISSN.16717767.2023.03.012
Wang, R., and Zhang, J. (2023). Yangtze River bridge south channel bridge design innovation. J. Southeast Univ. Nat. Sci. Ed. 53 (06), 979–987.
Wang, Y. (2023). Large-span bridge-side area car-line-bridge dynamic response analysis and rail smoothing research. China Academy of Railway Sciences. PhD. doi:10.27369/d.cnki.gtdky.2023.000006
Xu, W., Wang, D., and Li, S. (2023). The impact of wind barriers on the large span suspension bridge on the bridge deformation. Highway 68 (08), 113–117.
Yan, L., Li, J., and He, X. (2023). Effect of central clamps on fatigue damage of suspenders of suspension bridge under joint action of fluctuating wind and vehicle loads. J. Central South Univ. Sci. Technol. 54 (04), 1393–1406.
Yang, D., Li, W., Li, Z., Zhang, L., Hu, W., Ke, N., et al. (2023b). Laparoscopic versus open central pancreatectomy: a propensity score-matched analysis in a single centre. Enterp. Technol. Dev. 408 (03), 40–43. doi:10.1007/s00423-023-02752-4
Yang, H., Liu, X., Xu, J., and Wang, M. (2023a). The application of the friction-type central buckle on the application of a large-scale single-crossing cable bridge. Highw. Transp. Technol. 40 (05), 92–99.
Keywords: suspension bridges, slings, finite element, vehicle load, loading method
Citation: Chai J-L, Wang Y, Xia L-X and Li S-L (2025) Vehicle load loading method for the fatigue analysis of long-span suspension bridges with straddling slings. Front. Mech. Eng. 11:1450915. doi: 10.3389/fmech.2025.1450915
Received: 18 June 2024; Accepted: 14 April 2025;
Published: 14 May 2025.
Edited by:
Hamid Reza Karimi, Polytechnic University of Milan, ItalyReviewed by:
Guiyang Xin, Dalian University of Technology, ChinaFuyuan Gong, Zhejiang University, China
Zhongxiang Liu, Southeast University, China
Pan Guo, Zhengzhou University, China
Copyright © 2025 Chai, Wang, Xia and Li. This is an open-access article distributed under the terms of the Creative Commons Attribution License (CC BY). The use, distribution or reproduction in other forums is permitted, provided the original author(s) and the copyright owner(s) are credited and that the original publication in this journal is cited, in accordance with accepted academic practice. No use, distribution or reproduction is permitted which does not comply with these terms.
*Correspondence: Yong Wang, aG53eTIwMjJAc2luYS5jb20=