 Abhinav Aggarwal
 Rajesh Ranjan
- Department of Aerospace Engineering, Indian Institute of Technology Kanpur, Kanpur, India
Hypersonic flows generate intense unsteady pressure and thermal loads, posing significant challenges for high-speed aerospace applications such as re-entry vehicles and hypersonic cruise systems. These extreme conditions necessitate effective flow control strategies to enhance aerodynamic performance and structural integrity. This study examines the influence of surface curvature on these loads in a double-wedge geometry, aiming to optimize flow control approaches. Unsteady Mach 7 flow simulations are conducted using a high-fidelity, time-accurate solver with third-order MUSCL as well as seventh-order WENO schemes, ensuring precise resolution of shock interactions and flow structures. A standard double-ramp configuration is analyzed alongside two smooth ramp configurations, where the faceted intersection of the front and aft wedges is replaced with different curvature levels. The computational results are validated against experimental heat-flux data to confirm the accuracy of the numerical approach. The findings reveal that the high-curvature geometry (curvature,
1 Introduction
Hypersonic flows are typically characterized by complex Shock-wave/Boundary-layer interactions (SWBLI) and Shock-Shock interactions. These interactions generate high unsteady pressure and thermal loads, which can lead to structural fatigue, material degradation, and even failure of aerospace vehicles, particularly those constructed with composite materials (Fame et al., 2021; 2023). The intense aerodynamic heating associated with hypersonic speeds can severely impact thermal protection systems (Agarwal, 2024).
The intake, particularly, plays a critical role in managing the conditions of the incoming freestream flow in a scramjet engine. It gradually decelerates the hypersonic flow to supersonic speeds, ensuring conditions suitable for stable combustion. As the flow enters the scramjet intake, a series of oblique shocks and expansion fans form and reflect along the internal flow path. The intake design must achieve an optimal balance between air compression, temperature management, and minimizing drag and total pressure losses.
The high pressure and temperature gradients generated by shocks impose substantial structural and thermal loads on the scramjet engine geometry. Consequently, significant efforts have been made to develop novel flow control techniques to reduce localized heat flux and prevent overheating. Some recent advancements in active and passive flow control approaches include: plasma actuators for aerodynamic and propulsion applications (Mirzaei et al., 2012), pulse jet actuation for flow modulation (Abdolahipour et al., 2021) and placement of subcavities to alter frequencies (Bhaduri et al., 2024).
A relatively simple but commonly found configuration in most hypersonic vehicles is a double wedge or double ramp (see Figure 1a). This geometry is present at the intake of a scramjet engine, the nose of a fuselage, and the corners between the fuselage and control surfaces, among many others.
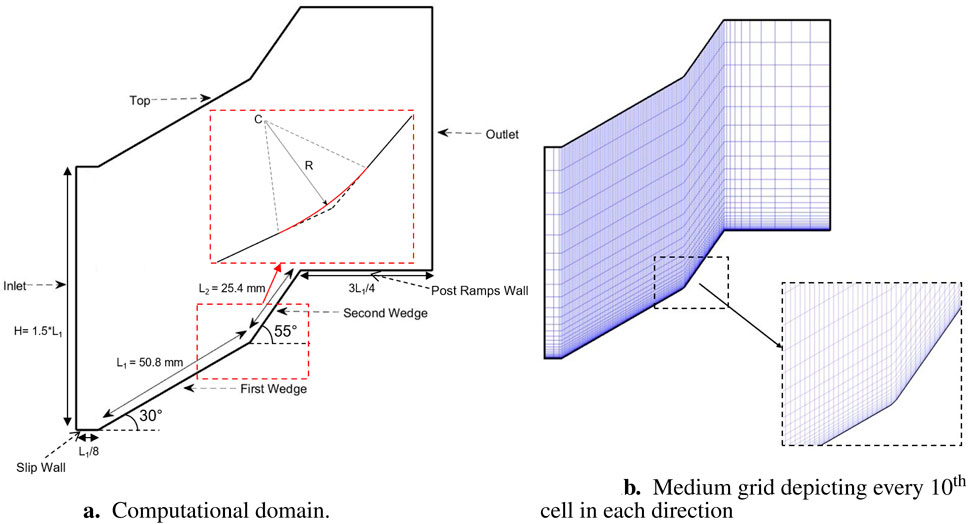
Figure 1. Computational domain and grid. The inset in (a) shows a representative curvature geometry with radius R. (a) Computational domain. (b) Medium grid depicting every 10th cell in each direction.
When a double ramp is subjected to hypersonic inflow conditions in a viscous environment, complicated flow physics consisting of multiple shock-shock interactions, large separation regions, SWBLI, and shock-shear layer interactions can be seen. Additionally, very high heat flux and pressures are observed at the reattachment location. Therefore, understanding flow in this configuration offers the opportunity to improve the designs of hypersonic vehicles.
Swantek and Austin (2012), Swantek and Austin (2015) performed experiments on a
Multiple groups have performed simulations for this flow as a part of NATO STO AVT Task Group 205 activity. Badr and Knight (2014) simulated low and high enthalpy cases using commercial solver GASPex with a two-dimensional setup by taking perfect gas assumptions and achieved a steady state for low enthalpy cases after 3.3 ms. While their results exhibit a good match for the low-enthalpy case (2.1 MJ/kg), the agreement with the high-enthalpy case (8 MJ/kg) was poor. Komives et al. (2014) also simulated the low enthalpy case with perfect gas assumption using the implicit finite volume hypersonic solver US3D. They found a reasonable agreement of wall heating with the experiment (Swantek and Austin, 2012) when simulated till the experimental run time; however, appreciable differences between the computed and measured flowfield structures were found. Further, as the simulation continued, inconsistencies in heating predictions were also observed. The authors emphasized the need for high-fidelity solvers to capture small-scale physical structures and pointed out that the results using lower-order schemes could be spurious.
Due to the significance of double ramp configuration in hypersonic configurations, several attempts have been made to study the change in SWBLI behavior due to various geometrical alterations. Hashimoto (2009) experimentally investigated the effect of different aft wedge angles. They observed minimal flow unsteadiness for
It is clear from the above discussion that a lot of work has been done studying the double ramp configuration with changing wedge length ratios as well as aft angles; however, literature studying the effect of change in curvature at the ramp intersection of a double ramp is relatively scarce. In the context of the compression ramp, some studies are done to study this important aspect. Cao et al. (2023) studied the effect of curvature at the compression corner and found that the size of the separation bubble reduces with curvature and the bubble disappears at a critical value. Some other work on curved compression corners (Tong et al., 2017; Hu et al., 2020; Tang et al., 2021) indicates the presence of bistable states of separation/attachment.
In the current work, we aim to examine the impact of curvature at the ramp intersection in hypersonic double-wedge geometries on unsteady pressure and thermal loads. This is motivated by the need to mitigate structural fatigue and material degradation, particularly in regions like the scramjet engine intake, where such loads are most pronounced. The double ramp flow
Subsequently, for studying the effect of curvature, smooth ramps of two different curvatures,
2 Solution methodology
2.1 Governing equations
Two-dimensional compressible Navier-Stokes equations are solved in the non-dimensional form on a curvilinear
where,
where
where Einstein summation convention over tensor notations is used.
Here
Expressions for other viscous fluxes namely,
2.2 Numerical approach
The in-house compressible flow solver PRAVAH has been used to carry out 2D laminar unsteady simulations of Navier-Stokes equations in a finite-difference curvilinear framework. This code implements higher-order compact schemes as well as Roe shock-capturing scheme in a finite-difference curvilinear setup. For the current simulations, the Roe scheme has been employed for inviscid flux computations with
The solver is used in a non-dimensional form, with scales given by free-stream flow velocity
2.3 Flow domain and boundary conditions
The double-wedge configuration has been adopted with
For the effect of curvature study, two curved geometries are made by adding tangent arcs to both wedges at distances of 0.22

Table 1. Details of curved configurations.
The boundary conditions employed are given in Table 2. A slip wall is given before the first wedge to provide developmental length for the flow before the first wedge. The wall temperature
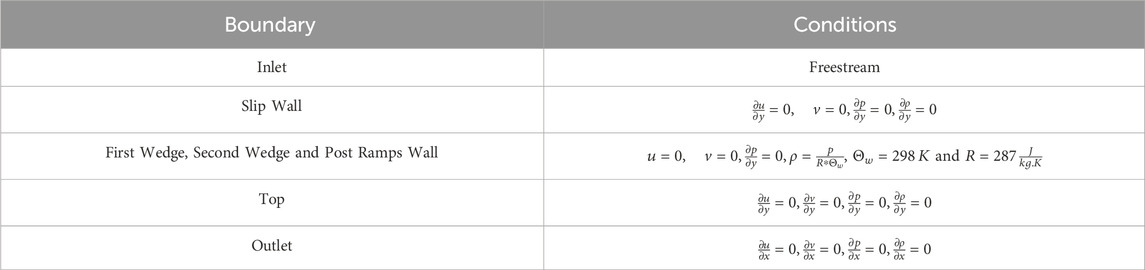
Table 2. Boundary conditions.
Freestream conditions for the flow are tabulated in Table 3 as per the Mach 7 flow experiment in low-enthalpy conditions (2.1
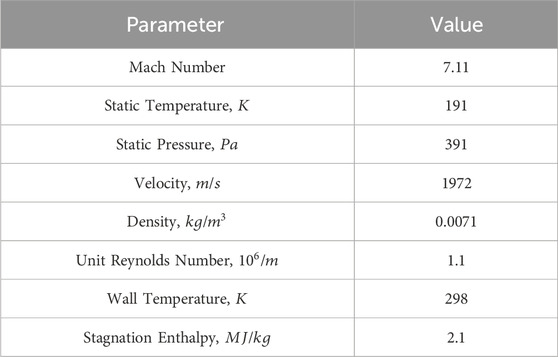
Table 3. Free-stream conditions for the low-enthalpy double ramp flow (Swantek and Austin, 2012).
2.4 Computational grid and numerical convergence
Three non-uniform cartesian grids of 0.1 million, 0.38 million and 0.69 million cells have been constructed. Details for all the grids can be seen in Table 4. For all the grids, in the vertical direction, there is one-sided stretching from wall to top and in the horizontal direction, there is uniform spacing on both wedges, while grid stretching is used on the slip wall and post ramps wall. Since, the topology is same for all the grids, the medium one is depicted in Figure 1b.
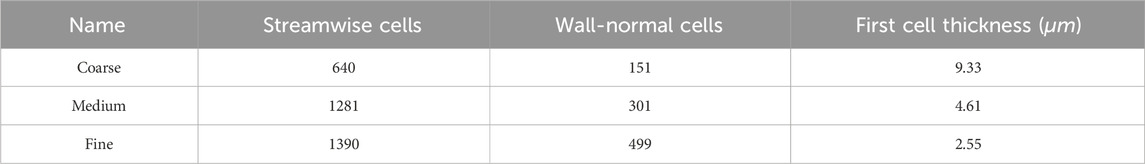
Table 4. Details of computational grids.
For brevity, the results of grid convergence using the Roe-MUSCL scheme are shown in Figure 2a. Wall pressure profiles are used for the comparison between the different grids. A very good agreement in the medium and fine grids demonstrate grid convergence. Similar convergence was also achieved in a hybrid WENO case between the two grids. For future analysis, the numerical data from the medium grid has been used.
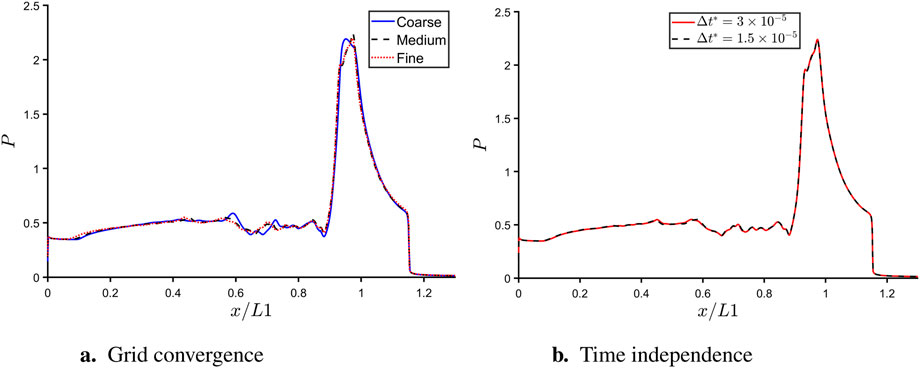
Figure 2. Grid convergence and time independence studies. (a) Grid convergence. (b) Time independence.
The time-step size for simulations is determined using the Courant–Friedrichs–Lewy (CFL) criterion to ensure numerical stability by keeping the CFL number below 1. For the calculations on the medium grid, the non-dimensional timestep
3 Baseline simulations
3.1 Flowfield description
Figure 3 shows a representative flowfield at 185
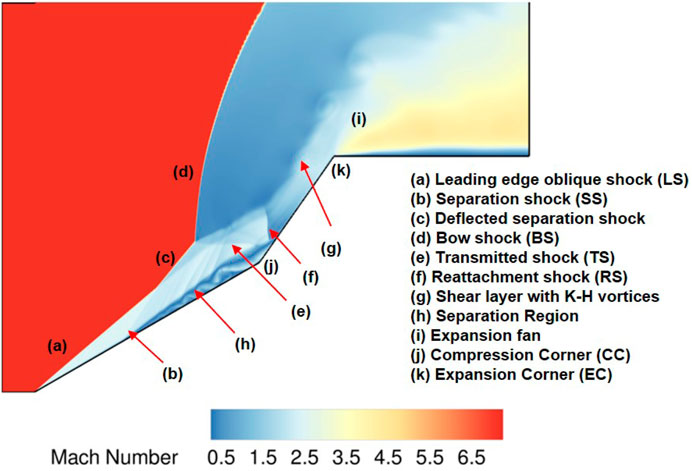
Figure 3. Instantaneous Mach contour at 185
The mechanism behind the formation of flow features is briefly described. The LS is formed due to the first ramp, and the BS is observed due to the high angle of the aft wedge. The difference between the angles of two wedges makes the adverse pressure gradient at the compression corner (CC) high enough to induce a separation region, primary separation, along with the separation and reattachment shocks, termed as SS1 and RS1, respectively. At early
Now, for quantitative validation, the wall heat flux,
Figure 4 shows the average heat flux as obtained with third-order MUSCL and hybrid MUSCL-WENO schemes along with the experimental data. Overall, both schemes provide nearly similar predictions in terms of prediction of separation (where fluctuations begin) and reattachment region of peak heat flux. On the aft wedge, the experiment predicts a peak heat load of about 1.35
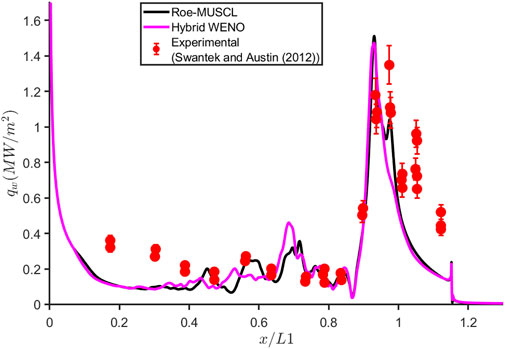
Figure 4. Comparison with experiments.
Slight differences in the predictions of heat load may be due to the alteration of initial dynamics caused by the uncertainty in initial conditions or the averaging window (Komives et al., 2014; Durna et al., 2016; Durna and Celik, 2019; Kumar and De, 2021a; Adityanarayan Ray and De, 2023). However, in an overall sense, the averaged heat flux is in good agreement with the experiments to study the dynamics of the flow.
3.2 Temporal evolution of flowfield
Now, the temporal evolution of the flowfield is discussed that provides key insights into the development of shocks, separation regions, and shear layers in the hypersonic environment. The primary features are marked in Figure 3 using the flow while development. Table 5 lists the major events in the flowfield evolution, and Figure 5 shows these events using density gradient contours.
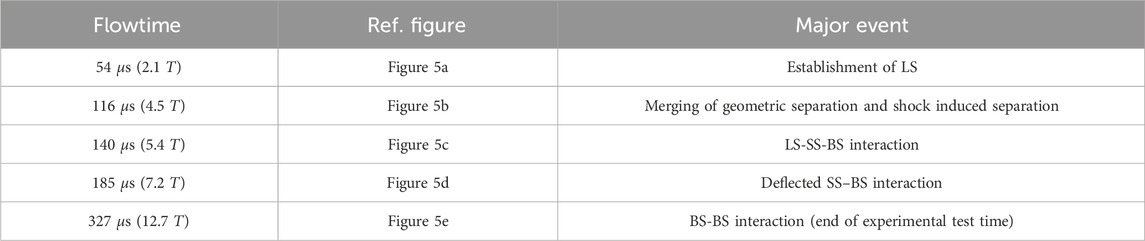
Table 5. Major events in the flowfield evolution.
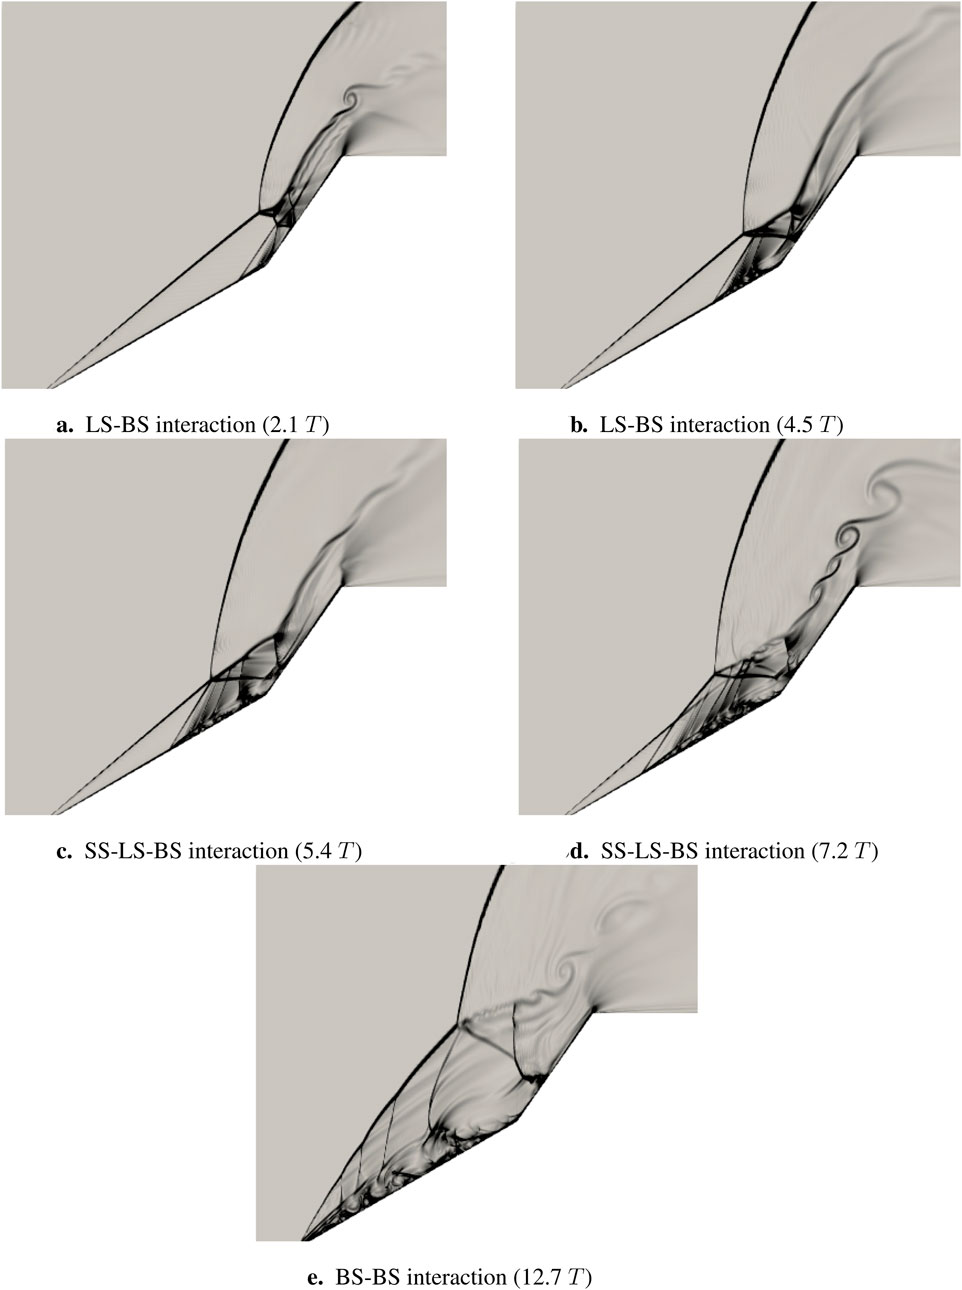
Figure 5. Evolution of flowfield shown using density gradient contours. (a): LS-BS interaction (2.1
Since the simulation was started from free-stream conditions, it took around
As time progresses, the first and second separation regions come closer to each other and finally merge to make one big separation region, as shown in Figure 5b at
The separation region size continues to grow with time, SS moves upstream, and at about 5.4
After this, LS intersects with SS, and the resultant deflected SS interacts with BS to form a triple point. Figure 5d (also Figure 3 shown earlier) at 7.2
At the end of experimental test time, 327
To understand the long-term behaviour of double ramp flow, the simulations were performed for a much longer time as compared to the experimental test time. Figure 6a shows the variation of wall pressure with time using a probe point kept at the intersection of the two wedges, which lies in the separation region. It can be seen that even after 12.7
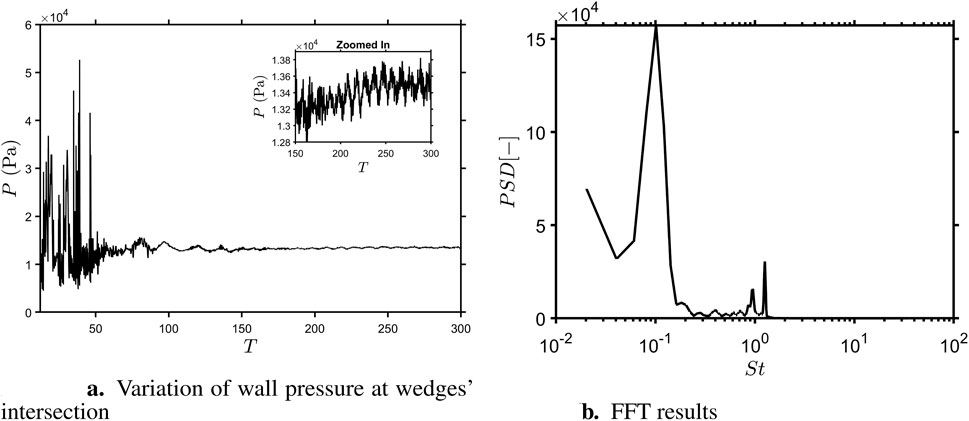
Figure 6. Unsteady pressure signatures for the Sharp geometry along with frequency data. (a) Variation of wall pressure at wedges’ intersection. (b) FFT results.
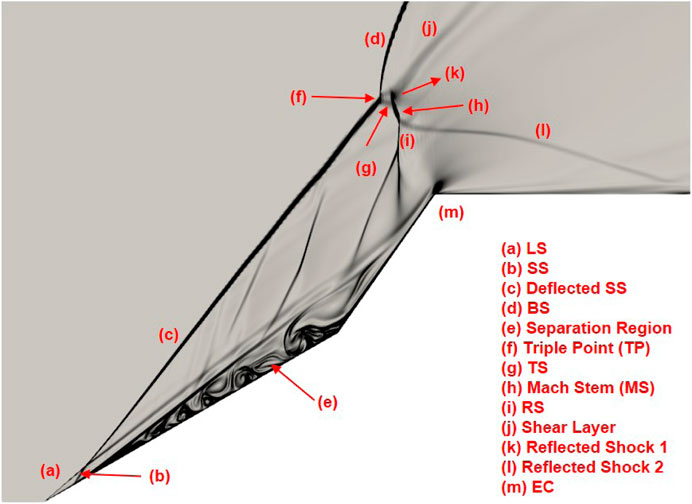
Figure 7. Long-time behavior of double ramp flow. Flow structure at 55
Despite the damping of high-amplitude pressure fluctuations and the establishment of outer shock interactions after 55
4 Effects of curvature
4.1 Mean flow behavior
Now the effect of introducing the curvature at the compression corner is discussed. This effect is first studied using the variation of averaged physical quantities in the streamwise direction. Since high loads are observed due to the initial dynamics of the flow, averaging has been done from the start of the simulation to 12
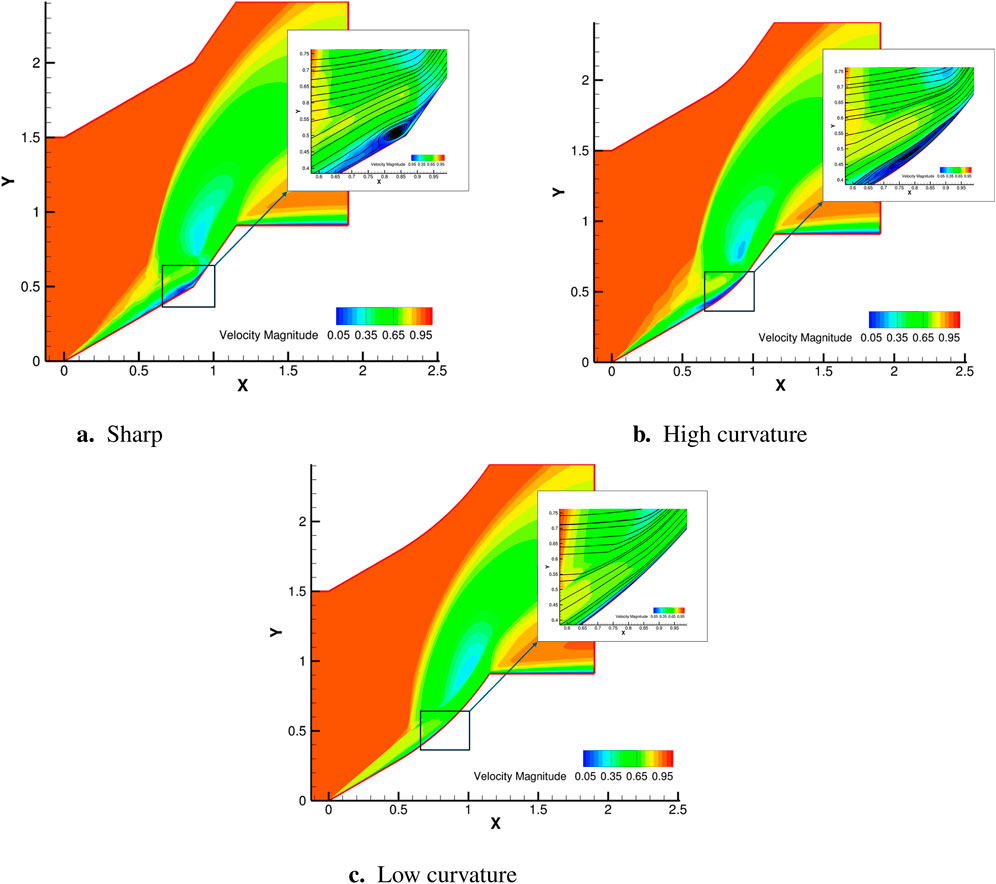
Figure 8. Non-dimensional velocity contours of mean flow for curved and sharp cases. (a) Sharp. (b) High curvature. (c) Low curvature.
Broadly all three configurations show similar flow structures in the outer region; however, there are large changes close to the ramp. The sharp configuration, Figure 8a, shows a large mean separation bubble at the compression corner. In the HC configuration, Figure 8b, the bubble becomes slightly elongated, but there is not much change in the overall dimension. However, in the LC case, Figure 8c, the mean separation bubble is reduced to a large extent. Note that there is no geometry-induced separation for any of the curved cases, hence, separation is only induced by the impinging shock.
These changes influence the pressure load and heat-transfer on the ramps. Figures 9a,b respectively, show the streamwise variations of wall pressure and wall heat flux. For the HC case, the wall pressure distribution is similar to the curved case, albeit the fluctuations have decreased. Further, the peak pressure load is almost the same magnitude as the baseline case. Similar patterns are noted for the heat-flux distribution for the HC case. There is a slight increase in the peak heat flux compared to the sharp case, but a single peak is observed due to smooth geometry.
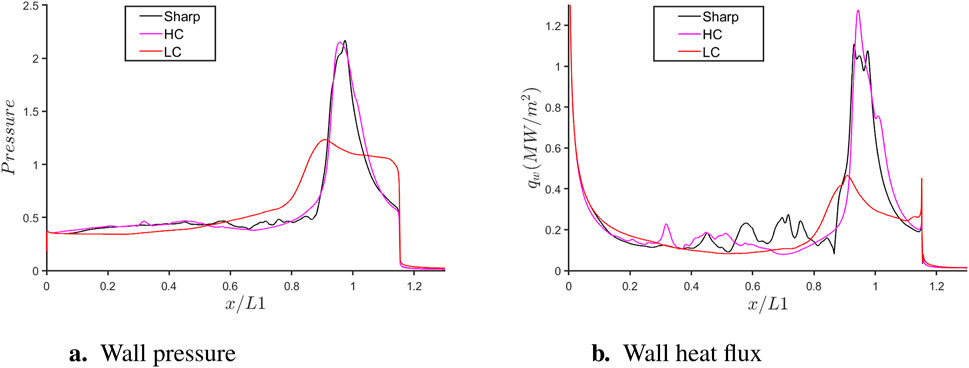
Figure 9. Effect of curvature on averaged flow quantities. (a) Wall pressure. (b) Wall heat flux.
Now the LC case is discussed, for which large changes were observed in the mean separation region. For this case, both pressure and heat-flux distributions are very different from sharp and HC configurations. Both the pressure and heat flux peaks are reduced significantly and are shifted upstream. The peak heat-flux in this case is about
4.2 Changes in transient behavior
To analyze the changes in the transient behavior, the instantaneous flowfields are visualized at four progressive instants (3, 6, 9, and 12
4.3 Short-term behavior
Three flowtimes
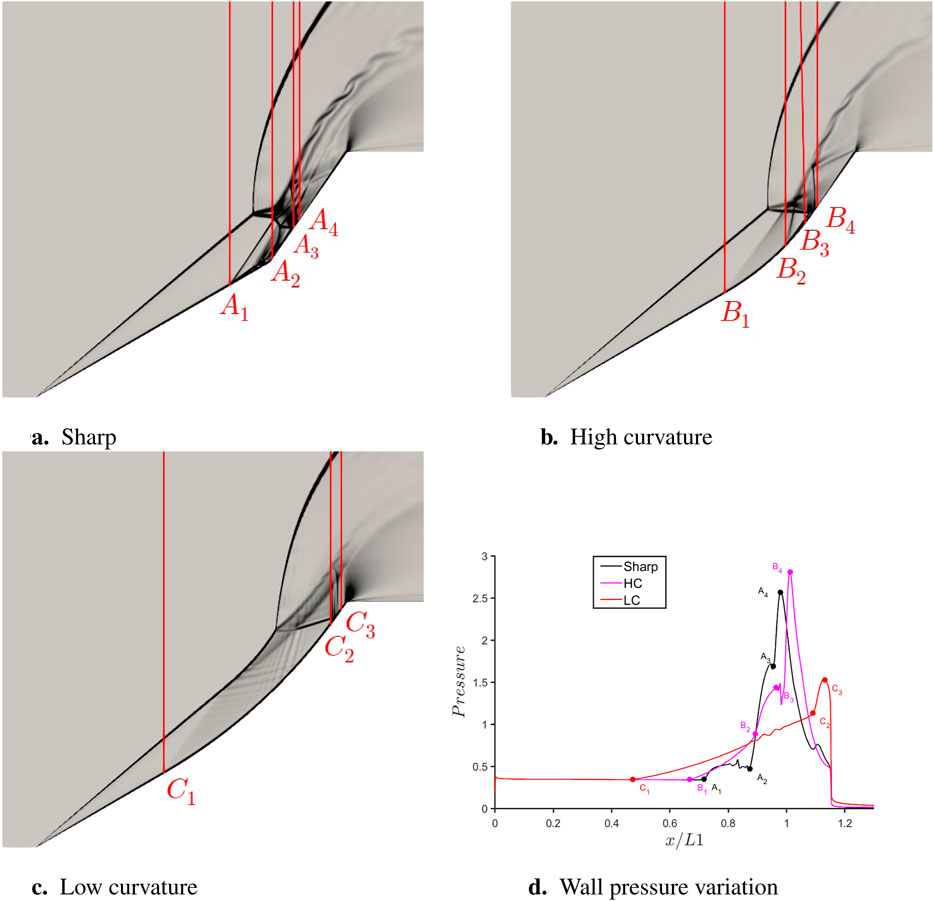
Figure 10. Comparison of different curvatures at 3
For the sharp case, Figure 10a, two strong SWBLIs are observed: (1) between
For both the curvature cases, no primary separation is observed, as there is no steep change in angle at any location. However, one strong SWBLI, between
For the LC geometry, the flowfield looks much more simple at this instant. The leading shock and compression waves between
Six flowtimes
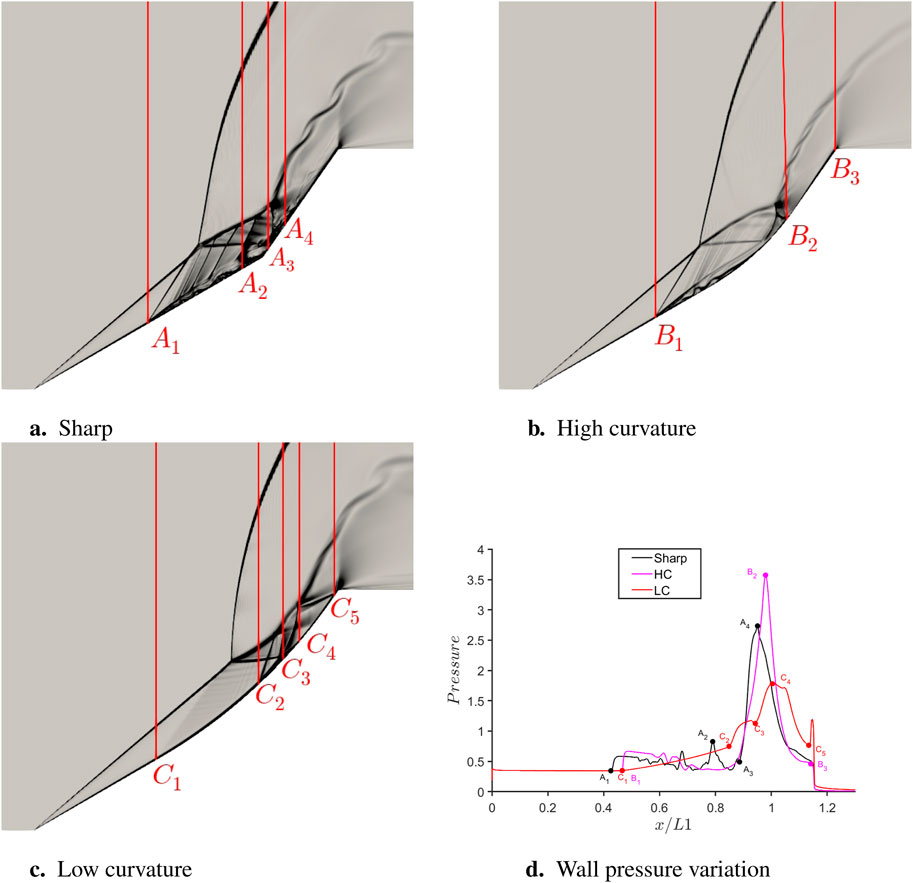
Figure 11. Comparison of different curvatures at 6
The highest peak pressure is observed for the HC geometry here as well, though the difference between the peak values has increased with respect to the sharp configuration. The LC geometry still has quite low peak pressure compared to the other two cases. The difference between the streamwise locations of separation shock for the sharp and HC configurations (
Nine flowtimes
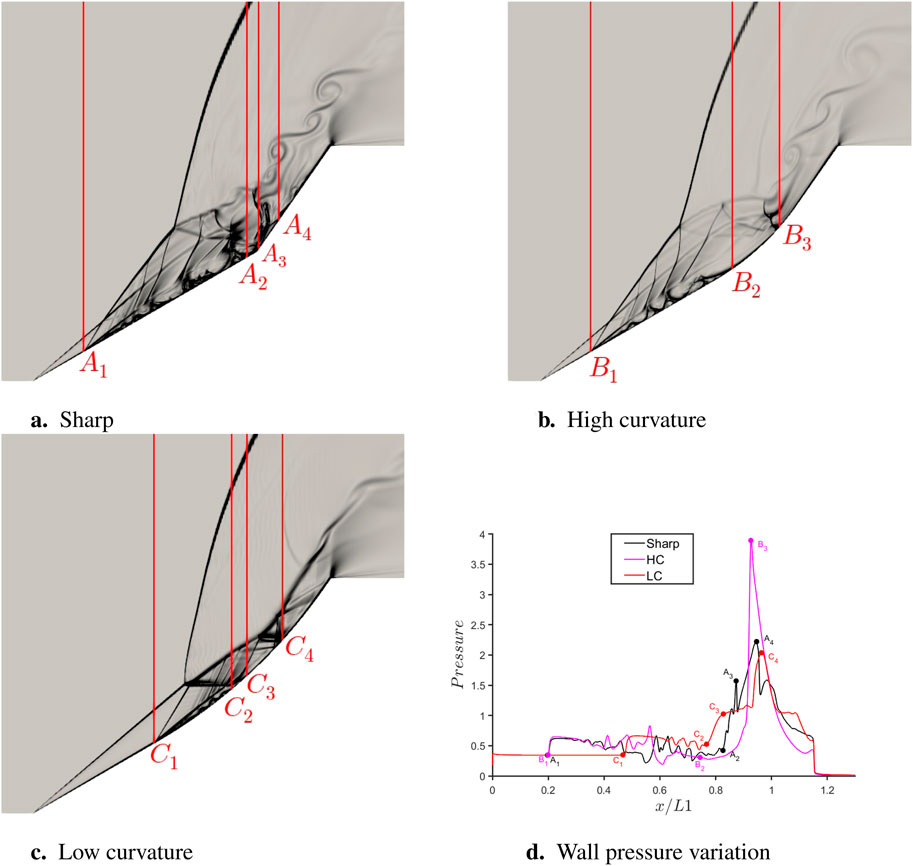
Figure 12. Comparison of different curvatures at 9
The highest pressure load is for the HC geometry, though there is not much difference between the pressure peaks for the sharp and LC cases. The separation shock locations for the sharp and HC configurations (
12 flowtimes
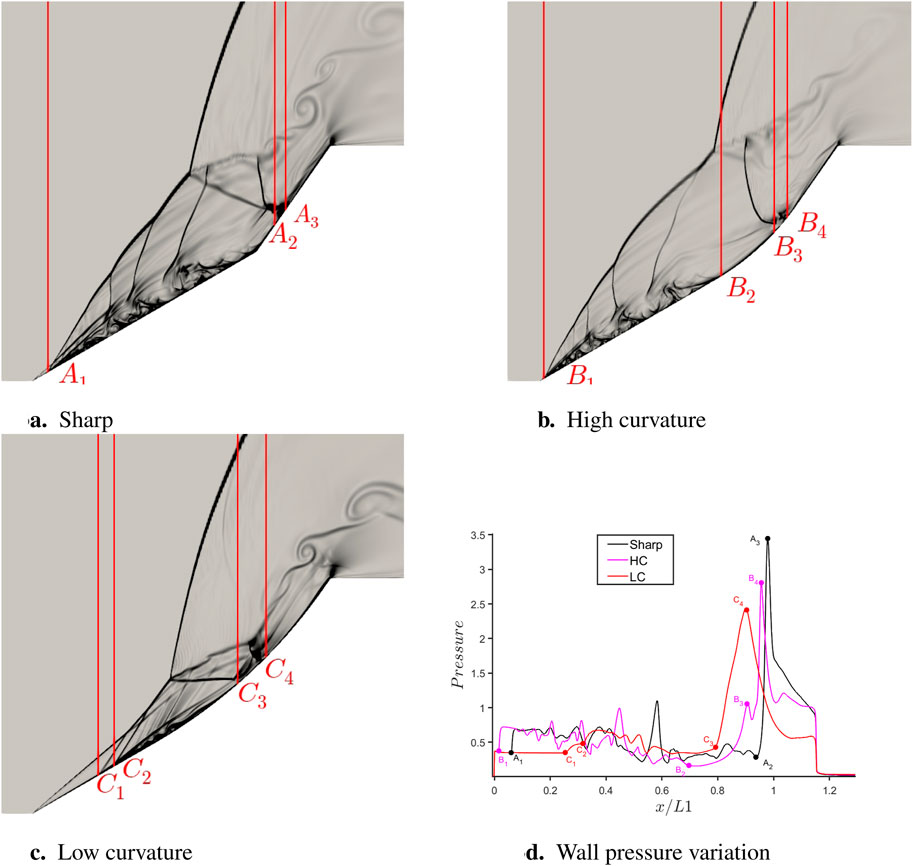
Figure 13. Comparison of different curvatures at 12
Looking at the wall pressure variation, similar features are noted for all three configurations: pressure rise at the separation shock, fluctuating pressure in the separation region, a large increase of pressure at the reattachment location, and a decrease in pressure due to the presence of the expansion fan. The highest pressure load is observed for the sharp case at this instant. Note that the separation shock location for the HC configuration at the final time has surpassed the sharp case and is closer to the leading edge than the latter. For the LC case, pressure loads were quite low for a significant amount of averaging window, which resulted in lower averaged loads. This was caused by the delay in the establishment of a strong SWBLI due to the smoother geometry.
4.4 Long-term behavior
Now, the long-term behavior of curved cases is studied briefly. Simulations were performed for long durations for both curved cases until there were no more high-amplitude oscillations. Figure 14 illustrates the pressure variation over time as measured by probes positioned at the midpoint of the curved outline. Earlier, the long-term behavior of the sharp case, utilizing a probe at a comparable location (the junction of both ramps), was presented in Figure 6a. In this case, quasi-steady conditions were achieved after approximately 150
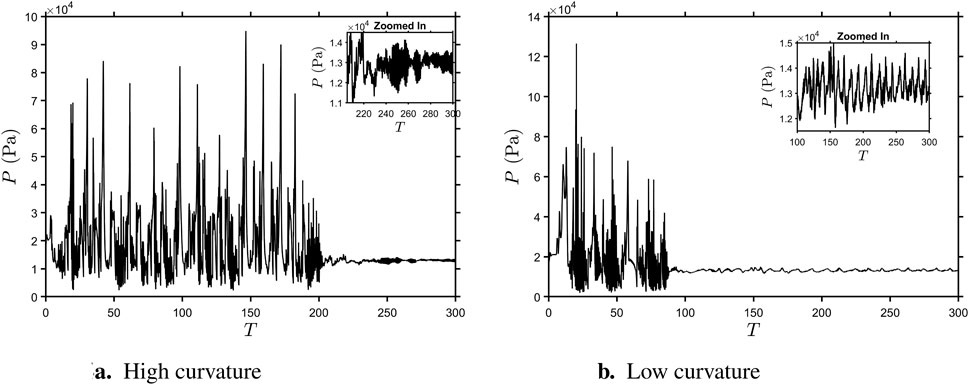
Figure 14. Variation of pressure with time. (a) High curvature. (b) Low curvature.
FFT was done for the curved cases after the high-amplitude fluctuations disappeared using a similar time window as for the sharp case discussed earlier (see Figure 6b). Power-spectral densities of the curved cases are shown in Figure 15. In the HC case, the dominant frequencies, characterized by the highest power spectral density (PSD), were identified at Strouhal numbers of
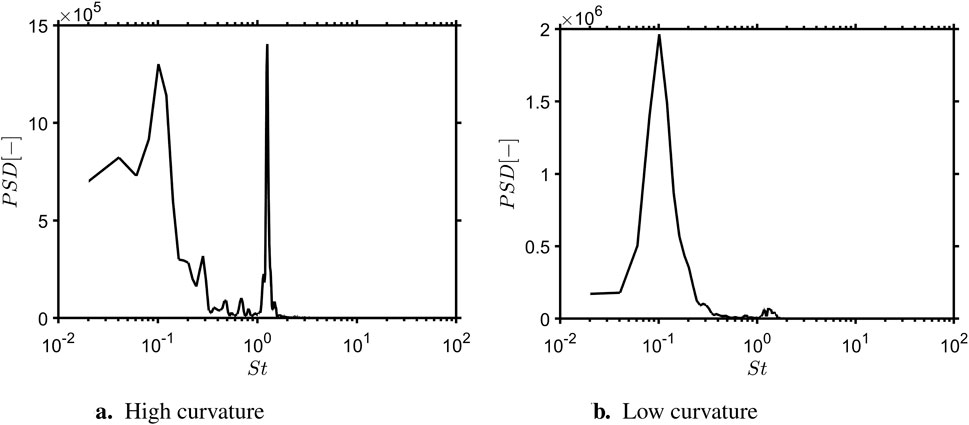
Figure 15. Dominant frequencies in curved cases. (a) High curvature. (b) Low curvature.
5 Concluding remarks
In this work, Mach 7 flow over a
1. The average wall heat-flux in the baseline simulation shows a reasonably good match with the experimental data despite uncertainties in initial conditions and the averaging window. This suggests that the thermochemistry effects are not prominent at low enthalpy conditions.
2. During the temporal evolution of flowfield, different Edney interactions are observed. The long-term simulations suggest a quasi-steady state after about 150 flowtimes. Low-frequency unsteadiness
3. Among the curved cases, the configuration with high curvature (
4. For the low curvature configuration
These findings underscore the efficacy of curvature modifications in reducing unsteady loads and enhancing flow stability in hypersonic applications, offering valuable insights for the design of aerodynamic surfaces subjected to extreme conditions. Although the current study has been conducted using a
Data availability statement
The raw data supporting the conclusions of this article will be made available by the authors, without undue reservation.
Author contributions
AA: Conceptualization, Formal Analysis, Investigation, Validation, Visualization, Writing – original draft, Writing – review and editing. RR: Conceptualization, Data curation, Funding acquisition, Investigation, Methodology, Project administration, Resources, Software, Supervision, Visualization, Writing – original draft, Writing – review and editing.
Funding
The author(s) declare that financial support was received for the research and/or publication of this article. Rajesh Ranjan gratefully acknowledges the support of the ISRO-STC (project number STC/AE/2023664J) grant.
Acknowledgments
The authors would like to thank Prof. Abhijit Kushari (IITK) for the technical discussions. The simulations are performed using the resources at CDAC-AIRAWAT and IIT Kanpur Computer Centre.
Conflict of interest
The authors declare that the research was conducted in the absence of any commercial or financial relationships that could be construed as a potential conflict of interest.
Generative AI statement
The author(s) declare that no Generative AI was used in the creation of this manuscript.
Publisher’s note
All claims expressed in this article are solely those of the authors and do not necessarily represent those of their affiliated organizations, or those of the publisher, the editors and the reviewers. Any product that may be evaluated in this article, or claim that may be made by its manufacturer, is not guaranteed or endorsed by the publisher.
References
Abdolahipour, S., Mani, M., and Taleghani, A. S. (2021). Parametric study of a frequency-modulated pulse jet by measurements of flow characteristics. Phys. Scr. 96, 125012. doi:10.1088/1402-4896/ac2bdf
Adityanarayan Ray, A., and De, A. (2023). Leading-edge bluntness effects on the hypersonic flow over the double wedge at multiple aft-wedge angles. Phys. Fluids 35. doi:10.1063/5.0149939
[Dataset] Agarwal, R. K. (2024). Grand challenges in aerospace engineering. Front. Aerosp. Eng. 3. doi:10.3389/fpace.2024.1383934
Badr, M. A., and Knight, D. D. (2014). “Shock wave laminar boundary layer interaction over a double wedge in a high mach number flow,” in 52nd aerospace sciences meeting, 1136.
Bhaduri, S., Ray, A., De, A., and Sugarno, M. I. (2024). Flow control in a confined supersonic cavity flow using subcavity. Front. Mech. Eng. 10, 1378433. doi:10.3389/fmech.2024.1378433
Cao, S., Hao, J., Guo, P., Wen, C.-Y., and Klioutchnikov, I. (2023). Stability of hypersonic flow over a curved compression ramp. J. Fluid Mech. 957, A8. doi:10.1017/jfm.2023.56
Chen, L., Zhang, Y., Wang, J., Xue, H., Xu, Y., Wang, Z., et al. (2024). Görtler vortices in the shock wave/boundary-layer interaction induced by curved swept compression ramp. Aerospace 11, 760. doi:10.3390/aerospace11090760
Durna, A., and Celik, B. (2019). Time-periodic shock interaction mechanisms over double wedges at mach 7. Shock Waves 29, 381–399. doi:10.1007/s00193-018-0864-7
Durna, A. S., El Hajj Ali Barada, M., and Celik, B. (2016). Shock interaction mechanisms on a double wedge at mach 7. Phys. Fluids 28. doi:10.1063/1.4961571
Edney, B. (1968). “Anomalous heat transfer and pressure distributions on blunt bodies at hypersonic speeds in the presence of an impinging shock,”. Flygtekniska Forsoksanstalten, Stockholm Sweden.Tech. Rep. doi:10.2172/4480948
Fame, C. M., Correia, J. R., Ghafoori, E., and Wu, C. (2021). Damage tolerance of adhesively bonded pultruded gfrp double-strap joints. Compos. Struct. 263, 113625. doi:10.1016/j.compstruct.2021.113625
Fame, C. M., He, L., Tam, L.-h., and Wu, C. (2023). Fatigue damage tolerance of adhesively bonded pultruded gfrp double-strap joints with adhesion defects. J. Compos. Constr. 27, 04022100. doi:10.1061/jccof2.cceng-4015
Hashimoto, T. (2009). Experimental investigation of hypersonic flow induced separation over double wedges. J. Therm. Sci. 18, 220–225. doi:10.1007/s11630-009-0220-4
Hu, Y.-C., Zhou, W.-F., Wang, G., Yang, Y.-G., and Tang, Z.-G. (2020). Bistable states and separation hysteresis in curved compression ramp flows. Phys. Fluids 32. doi:10.1063/5.0029150
Knight, D., Chazot, O., Austin, J., Badr, M. A., Candler, G., Celik, B., et al. (2017). Assessment of predictive capabilities for aerodynamic heating in hypersonic flow. Prog. Aerosp. Sci. 90, 39–53. doi:10.1016/j.paerosci.2017.02.001
Komives, J. R., Nompelis, I., and Candler, G. V. (2014). “Numerical investigation of unsteady heat transfer on a double wedge geometry in hypervelocity flows,” in 44th AIAA fluid dynamics conference, 2354.
Kumar, G., and De, A. (2021a). Modes of unsteadiness in shock wave and separation region interaction in hypersonic flow over a double wedge geometry. Phys. Fluids 33. doi:10.1063/5.0053949
Kumar, G., and De, A. (2021b). Role of corner flow separation in unsteady dynamics of hypersonic flow over a double wedge geometry. Phys. Fluids 33. doi:10.1063/5.0040514
Mirzaei, M., Taleghani, A. S., and Shadaram, A. (2012). Experimental study of vortex shedding control using plasma actuator. Appl. Mech. Mater. 186, 75–86. doi:10.4028/www.scientific.net/amm.186.75
Ninni, D., Bonelli, F., Colonna, G., and Pascazio, G. (2022). Unsteady behavior and thermochemical non equilibrium effects in hypersonic double-wedge flows. Acta Astronaut. 191, 178–192. doi:10.1016/j.actaastro.2021.10.040
Phirke, Y., and Ranjan, R. (2024). “Strategies for efficient gpu acceleration of a high-order 3d les solver using openacc,” in 2024 IEEE 31st international conference on high performance computing, data and analytics workshop (HiPCW), 169–170. doi:10.1109/HiPCW63042.2024.00062
Ray, A. A., and De, A. (2024). Investigation of turbulent high-speed flow over the double wedge at varying aft-wedge deflections. Eur. J. Mechanics-B/Fluids 111, 20–41. doi:10.1016/j.euromechflu.2024.11.012
Reinert, J. D., Gs, S., Candler, G. V., and Komives, J. R. (2017). “Three-dimensional simulations of hypersonic double wedge flow experiments,” in 47th AIAA fluid dynamics conference, 4125.
Shu, C.-W., and Osher, S. (1988). Efficient implementation of essentially non-oscillatory shock-capturing schemes. J. Comput. Phys. 77, 439–471. doi:10.1016/0021-9991(88)90177-5
Smith, H. E. (1967). The flow field and heat transfer downstream of a rearward facing step in supersonic flow Aerospace Research Laboratories. United States: Office of Aerospace Research.
Swantek, A., and Austin, J. (2012). “Heat transfer on a double wedge geometry in hypervelocity air and nitrogen flows,” in 50th AIAA aerospace sciences meeting including the new horizons forum and aerospace exposition, 284. doi:10.2514/6.2012-284
Swantek, A., and Austin, J. (2015). Flowfield establishment in hypervelocity shock-wave/boundary-layer interactions. AIAA J. 53, 311–320. doi:10.2514/1.j053104
Tang, M.-Z., Wang, G., Xie, Z.-X., Zhou, W.-F., Hu, Y.-C., and Yang, Y.-G. (2021). Aerothermodynamic characteristics of hypersonic curved compression ramp flows with bistable states. Phys. Fluids 33. doi:10.1063/5.0069666
Tong, F., Li, X., Duan, Y., and Yu, C. (2017). Direct numerical simulation of supersonic turbulent boundary layer subjected to a curved compression ramp. Phys. Fluids 29. doi:10.1063/1.4996762
Unnikrishnan, S., and Gaitonde, D. V. (2020). Linear, nonlinear and transitional regimes of second-mode instability. J. Fluid Mech. 905, A25. doi:10.1017/jfm.2020.781
Appendix: Validation of the simulation code
The PRAVAH code used in this study has been extensively validated for various compressible flow cases, including the SOD shock tube, 2D Riemann problems, and shock-boundary layer interactions on a flat plate. The code has shown good accuracy and shock-capturing ability for these problems. Here, we present its validation for flow over a backward-facing step (BFS), based on the experimental study by Smith (1967). The flow conditions for this case are a Reynolds number based on step length,
Appendix Figure A1a presents the Mach contours for the BFS flow. The simulation accurately captures key flow features, including the expansion fan near the corner, the reattachment shock, and the recirculation region. The inset provides a closer view of the recirculation region, clearly depicting both primary and secondary vortices. For quantitative validation, Appendix Figure A1b shows the pressure distribution along the bottom wall, normalized by the free-stream pressure. The numerical results are compared with experimental data from Smith (1967), demonstrating a good agreement. PRAVAH effectively captures the pressure plateau associated with the recirculation region, followed by a gradual rise in pressure in the reattachment zone.
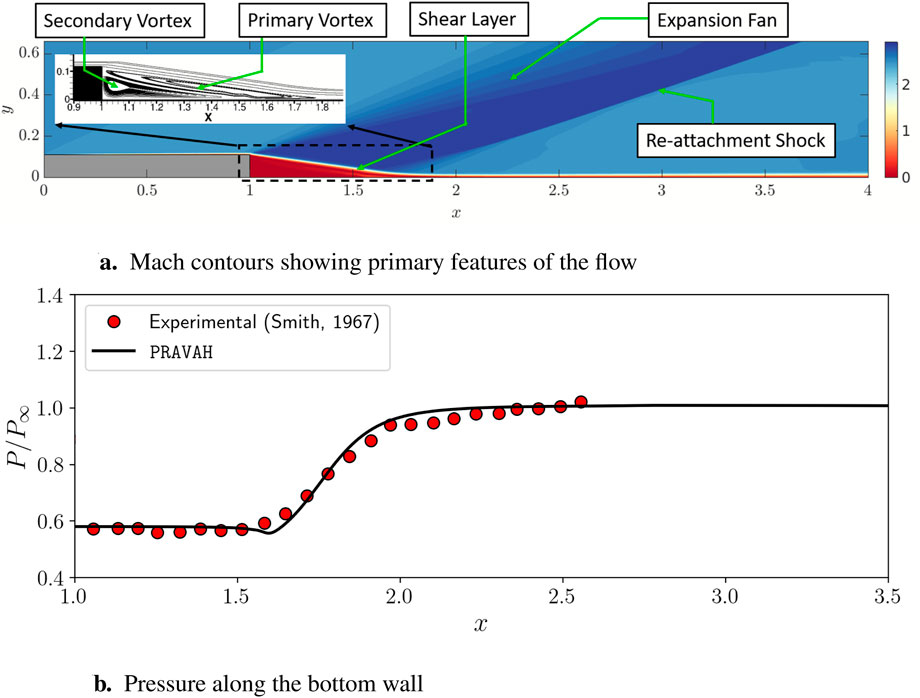
FIGURE A1. Validation of PRAVAH Code for backward-facing step flow. (a) Mach contours showing primary features of the flow. (b) Pressure along the bottom wall.
Keywords: shocks, heat-flux, separation, Edney interactions, flow control, hypersonic flow
Citation: Aggarwal A and Ranjan R (2025) Role of curvature in controlling SWBLI behavior in a hypersonic double ramp flow. Front. Mech. Eng. 11:1550464. doi: 10.3389/fmech.2025.1550464
Received: 23 December 2024; Accepted: 26 June 2025;
Published: 09 July 2025.
Edited by:
Muruganandam Thiruchengode, Indian Institute of Technology Madras, IndiaReviewed by:
Cheikh Makhfouss Fame, Shenzhen University, ChinaSoheila Abdolahipour, Aerospace Research Institute, Iran
Copyright © 2025 Aggarwal and Ranjan. This is an open-access article distributed under the terms of the Creative Commons Attribution License (CC BY). The use, distribution or reproduction in other forums is permitted, provided the original author(s) and the copyright owner(s) are credited and that the original publication in this journal is cited, in accordance with accepted academic practice. No use, distribution or reproduction is permitted which does not comply with these terms.
*Correspondence: Rajesh Ranjan, cmFqZXNockBpaXRrLmFjLmlu