 Amit Gupta1
 Rajeev Ranjan1
 Robert Cep2
 Ajay Kumar3,4*†
 Sanjay Kumar Jha5Faisal Altarazi6Ashish Kumar7Namrata Dogra8
- 1Department of Mechanical Engineering, Sarala Birla University, Ranchi, India
- 2Department of Machining, Assembly and Engineering Metrology, Faculty of Mechanical Engineering, VSB-Technical University of Ostrava, Ostrava, Czechia
- 3Department of Mechanical Engineering, School of Core Engineering, Faculty of Science, Technology and Architecture, Manipal University, Jaipur, India
- 4Department of Mechanical Engineering, School of Engineering and Technology, JECRC University, Jaipur, Rajasthan, India
- 5Department of Production and Industrial Engineering, Birla Institute of Technology Mesra, Ranchi, Jharkhand, India
- 6University of Jeddah, Jeddah, Saudi Arabia
- 7Division of Research and Development, Lovely Professional University, Phagwara, India
- 8Department of Orthodontics, Faculty of Dental Sciences, SGT University, Gurugram, Haryana, India
Aluminium alloys, particularly AA 6065 T6, are widely used in automotive components such as coolers and radiators due to their excellent strength-to-weight ratio and corrosion resistance. However, welding these alloys presents significant challenges, as the weld joints are prone to thermal stresses, leading to defects and eventual failure. To address this issue, optimizing the PCTIG (Pulsed Current Tungsten Inert Gas) welding process parameters is crucial for achieving superior mechanical properties, particularly tensile strength. This study investigates the influence of peak current, base current, and frequency on the tensile strength of AA 6065 T6 aluminium alloy with varying thicknesses (3 mm, 6 mm, and 10 mm). Regression models are developed to predict tensile strength across the factorial space, and ANOVA is applied to assess the significance of each parameter. Experimental results identify optimal tensile strengths of 179.50 MPa, 188.92 MPa, and 201.22 MPa for 3 mm, 6 mm, and 10 mm thick materials, respectively, with process parameters set at 180 A peak current, 60 A base current, and 2 Hz frequency. Validation through simulation software corroborates these findings, confirming the effectiveness of the optimized parameters in producing defect-free, high-strength weld joints suitable for automotive applications.
1 Introduction
The TIG welding method belongs to the fusion-welding category. It involves heating the metal through an arc generated by a non-consumable tungsten electrode, causing it to melt. This welding technique can be executed with or without the use of filler material and typically produces superior weld quality compared to other arc welding methods (Kalita et al., 2023). However, a notable challenge with TIG welding is its relatively slow metal deposition rate, which restricts its application to welding thin metals (Lawal et al., 2023; Goswami et al., 2023; Chandra et al., 2024). Specifically, when working with aluminium alloys, the maximum weldable thickness using TIG welding is 6 mm. Beyond this thickness, multiple weld passes are required.
In traditional fusion welding, the weld typically consists of three zones: the heat affected zone, partially melted zone, and fusion zone. When welding aluminium alloys using this technique, the grain structure in the fusion zone tends to become coarse, resulting in weakened weld strength. Managing this grain structure is crucial but challenging due to the high temperatures and thermal gradients involved in conventional welding (Srivastava et al., 2023). Previous attempts to refine the fusion zone have yielded limited success, despite methods such as incorporating micro coolers, utilizing pulsation in the welding torch, and inducing surface nucleation (Lawal and Afolalu, 2023). Introduced in the 1950s, the practice of pulsing weld current in TIG welding involves cyclically varying the current at a consistent frequency, alternating between high and low levels (Mamgain et al., 2023). Figure 1 demonstrates this concept, where the low-level current is referred to as the base or background current (Ib), and the higher range is termed as peak current (Ip) (Sudarno et al., 2023). Typically, a stable continuous base current is maintained while simultaneously applying peak current to ensure suitable bead contour and penetration (Kudale and Jit Singh, 2023).
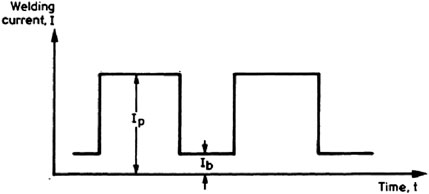
Figure 1. Pulsed current principle.
Numerous researchers have investigated the analysis of aluminium alloys welded using pulsed current TIG welding (PCTIG) processes. In both GMAW and GTAW methods, the fusion zone exhibits a dendritic structure resulting from the rapid heating and subsequent cooling of the molten metal. The primary difference lies in the dendrite arm spacing, slightly wider in GMAW joints and narrower in GTAW joints (Patel et al., 2023).
Researchers have explored Pulsed-TIG (PCGTA) welding, noting the cycling of welding current between high and low levels (Padmanaban and Balasubramanian, 2011; Burande et al., 2024). The high peak current ensures adequate weld penetration and optimal bead contour, while the low-level base current maintains a stable arc, allowing efficient energy utilization to fuse a controlled spot rapidly. Grain refinement in the fusion zone and improved weld mechanical properties are achieved, alongside reduced heat-affected zone (HAZ) width and distortion (Kou, 2003; Saxena et al., 2024). Moreover, grain refinement achieved through pulsing current reduces hot cracking susceptibility in heat-treatable alloys. Additionally, in AC pulsed TIG welding, oxide layer removal is facilitated, melting lower grain boundaries compared to continuous current.
Researchers have explored the effects of peak and base currents as welding parameters in welding aluminium alloys. Their findings suggest that an increase in peak current results in higher heat input, leading to a slower cooling rate during solidification (Lei et al., 2017; Kumar et al., 2024). A slower cooling rate affords more time for grain coarsening. Conversely, reducing peak current accelerates cooling, promoting the formation of finer grains in the fusion zone. As a result, equiaxed grains develop in the fusion zone, leading to increased tensile strength, while coarser, elongated grains tend to result in lower tensile strength (Kumar and Sundarrajan, 2009a). Pulsed current TIG welding parameters significantly influence welded joint strength. For example, peak current directly affects the tensile properties of welded joints, and vice versa. Additionally, higher pulse frequencies induce vigorous agitation in the molten pool, refining grains in the fusion zone. However, the effect of pulse frequency on hardness depends on the duty cycle, with higher frequencies generally lowering hardness (Senthil Kumar et al., 2007). Moreover, pulse frequency is directly related to the tensile properties of welded joints (Kiaee and Aghaie Khafri, 2014a).
Gas Tungsten Arc Welding (GTAW) can utilize various types of current and polarity, including alternating current (AC) and direct current (DC), with both straight polarity (DCEN) and reverse polarity (DCEP) options (Manti and Dwivedi, 2007). In TIG welding, direct current electrode negative (DCEN) is common, where the negative end of the heat source connects to the electrode, enhancing electron emission and resulting in high heat generation in the workpiece, enabling deeper penetration and a narrower weld shape (Kumar and Sundarrajan, 2009b). In contrast, with reverse polarity, the positive end connects to the heat source, generating higher heat in the electrode than the workpiece, leading to a wider weld bead and narrower weld compared to direct polarity. Consequently, a larger electrode diameter is typically used to manage the high-energy concentration in the electrode, and a cooling arrangement is necessary to prevent electrode tip melting (Kumar and Sundarrajan, 2006). The positive ion bombardment effect aids in oxide layer removal on the surface, providing a cleaning effect. Hence, if deep penetration is not required, reverse polarity may be used (Da Cunha et al., 2016). Alternatively, oxide layer removal and penetration actions can be achieved with alternating current, the most common polarity for welding aluminium alloys, as depicted in Figure 1. Figure 2 shows the pulsed TIG welding machine.
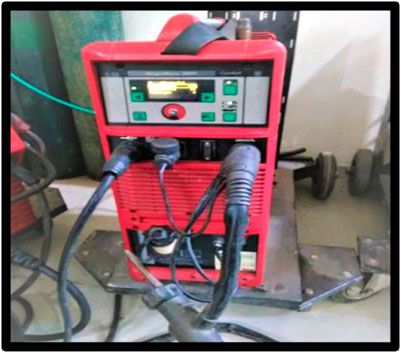
Figure 2. Pulsed TIG welding machine.
This research focuses on optimizing Pulsed Current TIG (PCTIG) welding parameters—peak current, base current, and pulse frequency for AA 6065 T6 aluminium alloys of varying thicknesses (3 mm, 6 mm, and 10 mm) to achieve maximum tensile strength. Conventional TIG welding faces challenges such as grain coarsening, limited weldable thickness, and increased thermal stresses, affecting weld quality. PCTIG welding mitigates these issues by refining the fusion zone microstructure, reducing heat-affected zone width, and improving mechanical properties. A factorial experimental approach, regression modelling, and ANOVA are employed to analyse the effects of process parameters. Experimental results are validated through simulation, ensuring optimized welding conditions for industrial applications, particularly in the automotive sector.
1.1 Design of experiment
Design of experiments (DOE) is a systematic method for investigating any situation in which a response changes as a function of one or more independent variables. DOE is specifically developed to solve complicated situations in which more than one variable influence response and two or more factors interact with one other. DOE eliminates ineffective techniques like the traditional but still widely used technique of investigating the influence of one variable at a time (OVAT). In comparison to DOE, the OVAT technique wastes resources and is incapable of identifying or quantifying the presence of interactions between variables (Kumar and Vishal, 2018; Ranjan et al., 2024).
1.2 Regression analysis
Independent variables are the input variables of a process that can be changed at the user’s choice. Independent variables are the process’s knobs or the controls that allow you to tweak the process. The input variables can be set to an endless number of levels between upper and lower boundaries or limitations because they are quantitative and continuous.
1.3 Analysis of variance
The implementation of (k) independent tests caused the method of multiple comparisons to fail to test for differences between k treatment means. To avoid this issue, a single test that compares all of the means at the same time is required. The analysis of variance (ANOVA) variable provides such a test (Kumar and Gulati, 2018).
2 Selection of weld parameters
As per ASME Section IX guidelines, weld experiments are categorized into three groups: essential parameters, supplementary essential parameters, and non-essential parameters. For TIG welding, particular emphasis was placed on essential and supplementary essential variables, outlined in Table 1. Among these variables, current and thickness were singled out due to their significant impact on the ultimate tensile properties of the weld. In the case of pulsed current TIG (PCTIG) welding, the experiment incorporated peak current (Ip), base or background current (Ib), and frequency (f) as the selected parameters. These variables were considered crucial in determining the outcomes of the welding process (Kiaee and Aghaie Khafri, 2014b).
Table 1. Essential and supplementary essential parameters according to ASME Sec. IX for TIG welding.
The selection of peak current (Ip), base current (Ib), and frequency (f) as key welding parameters for this research is based on their critical influence on the weld’s mechanical properties, particularly tensile strength. Peak current (Ip) directly affects heat input, weld penetration, and fusion zone microstructure, where higher values enhance penetration but may promote grain coarsening. Base current (Ib) maintains arc stability and controls the cooling rate, influencing grain refinement and minimizing thermal distortion. Frequency (f) governs the transition between peak and base current, affecting heat distribution, grain structure, and overall weld quality. By optimizing these parameters, the study aims to achieve superior mechanical performance, reduced defects, and enhanced weld integrity in AA 6065 T6 aluminium alloy components of varying thicknesses.
3 Performance of experiment work for tensile strength
Prior to commencing the actual experimental procedures, a pilot welding experiment was conducted to assess feasibility and parameter ranges. This preliminary experimentation provided insights into potential challenges anticipated during the main experiment. Table 2 outlines the parameter ranges utilized in the pilot experiment. The experimentation employed a digitized TIG AC/DC power supply specifically tailored for aluminium applications, offering a power range from 170 A to 500 A.
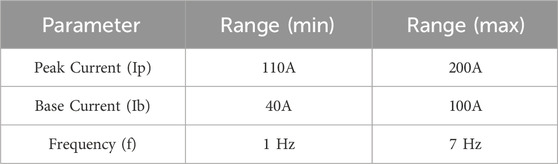
Table 2. Range of pilot experiment work.
These power supplies varied in mobility, ranging from portable units to robust stationary machines. For the experimental work, a Fronius PCTIG welding machine was utilized, known for its sturdy construction and user-friendly interface. Particularly, the magic wave model was selected for its outstanding operational capabilities and intuitive controls. The parameter range selection was informed by prior research findings and the industry experience of the welder. The pilot experiment was designed using the L16 Taguchi Orthogonal Array Design, and a total of 16 experiments were conducted. Welding of AA 6065T6 alloy, including cut and bead-on-plate welding, was carried out by a certified welder. The experimental design for the pilot study is detailed in Table 3.
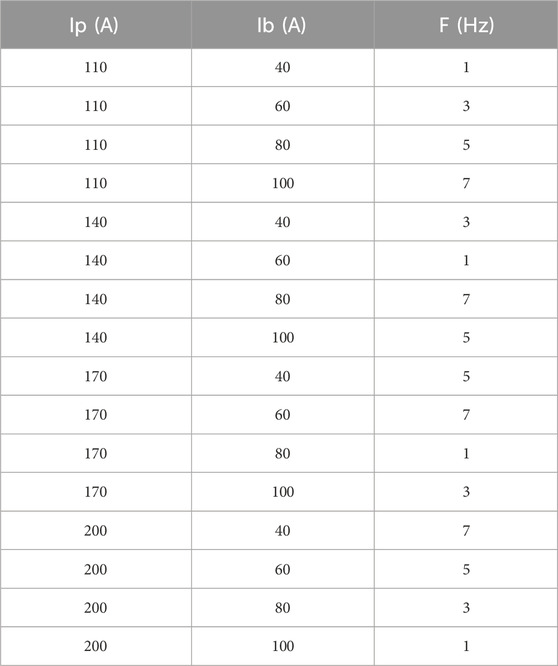
Table 3. Design of experiment for pilot experiment.
The selection of parameters range was based on past research work and the experience of the welder from industries. L16 Taguchi Orthogonal Array Design prepared the pilot experiment and a total 16 number of experiments was performed. The welding of AA 6065 T6 alloys cut and bead on plate welding was performed. The design of experiment for pilot experiment is mentioned in Table 3. The pilot experiment was conducted under standard operating conditions. The selection of consumables for both the pilot and actual experiments, such as shielding gas, gas flow rate, type of filler wire, and tungsten electrode, adhered to guidelines outlined in the AWS handbook and ASME Sec. IX standards, as specified in Table 4.
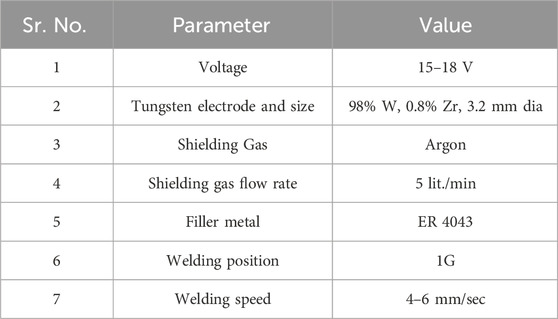
Table 4. Selection of other parameters.
The results of the pilot experiment provided insights into the range for the actual experimental work. The results were visually inspected in accordance with AWS standard B1.11 and are summarized in Table 5.
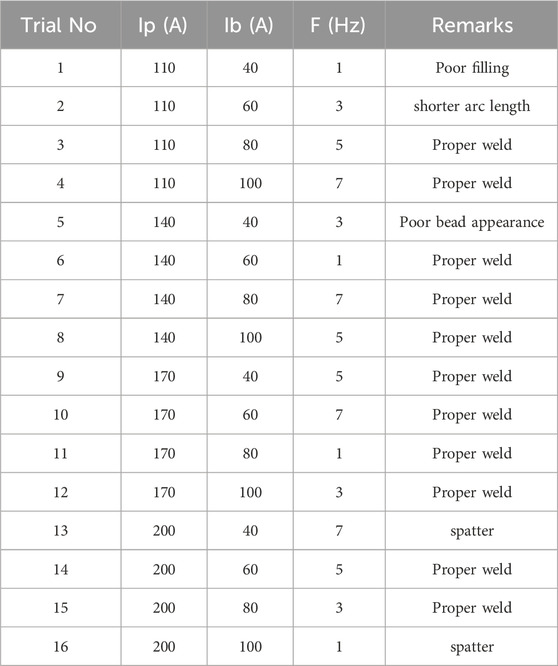
Table 5. Visual inspection of pilot experimentation.
4 Result of pilot experiment work
When the peak current (Ip) reached or exceeded 200 A, the weld displayed lack of fusion and a heightened incidence of spattering. Likewise, when the base current (Ib) reached or exceeded 100 A, arc instability was observed, frequently resulting in arc wandering.
Arc Wandering is the unintended deviation of the welding arc, affecting weld quality and precision. It can be caused by magnetic arc blow (due to residual magnetism or improper grounding), gas turbulence (from excessive shielding gas flow), electrode misalignment, workpiece contamination, or inconsistent arc length. Preventive measures include using AC welding for aluminum, optimizing shielding gas flow, maintaining proper tungsten positioning, and ensuring a clean workpiece. Addressing these factors improves arc stability, weld quality, and defect minimization in PCTIG welding.
Moreover, a frequency (f) surpassing 6 Hz led to an increased incidence of spatter during the welding process. These discoveries emphasize the importance of meticulously controlling welding parameters to achieve optimal outcomes and minimize undesirable effects.
Incomplete filling was observed when the peak current (Ip) fell below 120 A, while a shorter arc length was noted when the base current (Ib) was under 60 A. Frequencies below 2 Hz resulted in bead contour similar to traditional TIG welding.
Consequently, the ranges for actual experiments were determined and executed. The ranges for these actual experiments are detailed in Table 6.
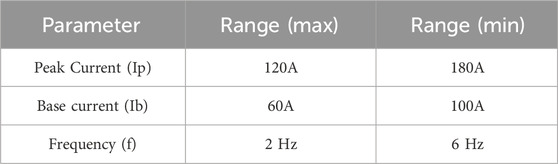
Table 6. Range for actual experiment work.
4.1 Actual experimental work
PCTIG welding was conducted on various thicknesses of AA 6065 T6 material, including 3 mm, 6 mm, and 10 mm, under standard operating conditions by a certified welder using a Fronius welding machine. In accordance with ASME Sec. IX standards, Procedure Qualification Records (PQR) and Welding Procedure Specifications (WPS) were developed for each thickness category.
During the experimental phase, the focus shifted to the practical application of aluminum alloy AA 6065 T6 in industry. Precision-cut plates of this material were prepared to specific dimensions: 200 × 100 × 3 mm, 200 × 100 × 6 mm, and 200 × 100 × 10 mm. ER 4043 filler material with a diameter of 2.4 mm and a 0.8% zirconium-coated tungsten electrode were utilized. Prior to manual PCTIG welding, meticulous cleaning of the components was conducted.
The welding process employed alternating current, with careful adjustment of parameters such as peak current (Ip), base current or background current (Ib), and frequency (f). All welding procedures were conducted by a certified welder following standardized experimental protocols.
Following welding, the components were sectioned into standardized sizes to prepare specimens for mechanical testing. The number of passes for different thicknesses was determined based on relevant literature and standard handbook guidelines, as outlined in Table 7. To optimize the experimental design, the L9 Taguchi method was utilized, with the corresponding range detailed in Table 8. This systematic approach aimed to ensure thorough testing and meaningful analysis of the welding outcomes.
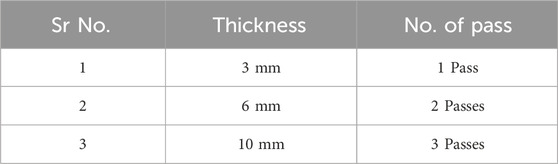
Table 7. No. of passes.
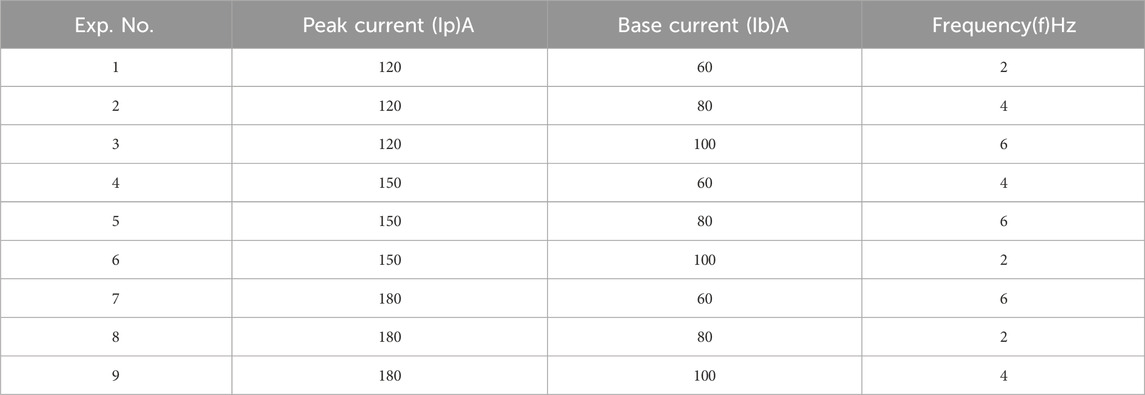
Table 8. Design of experiment (Taguchi method).
The geometry for three different thickness material is mentioned in Figure 3.
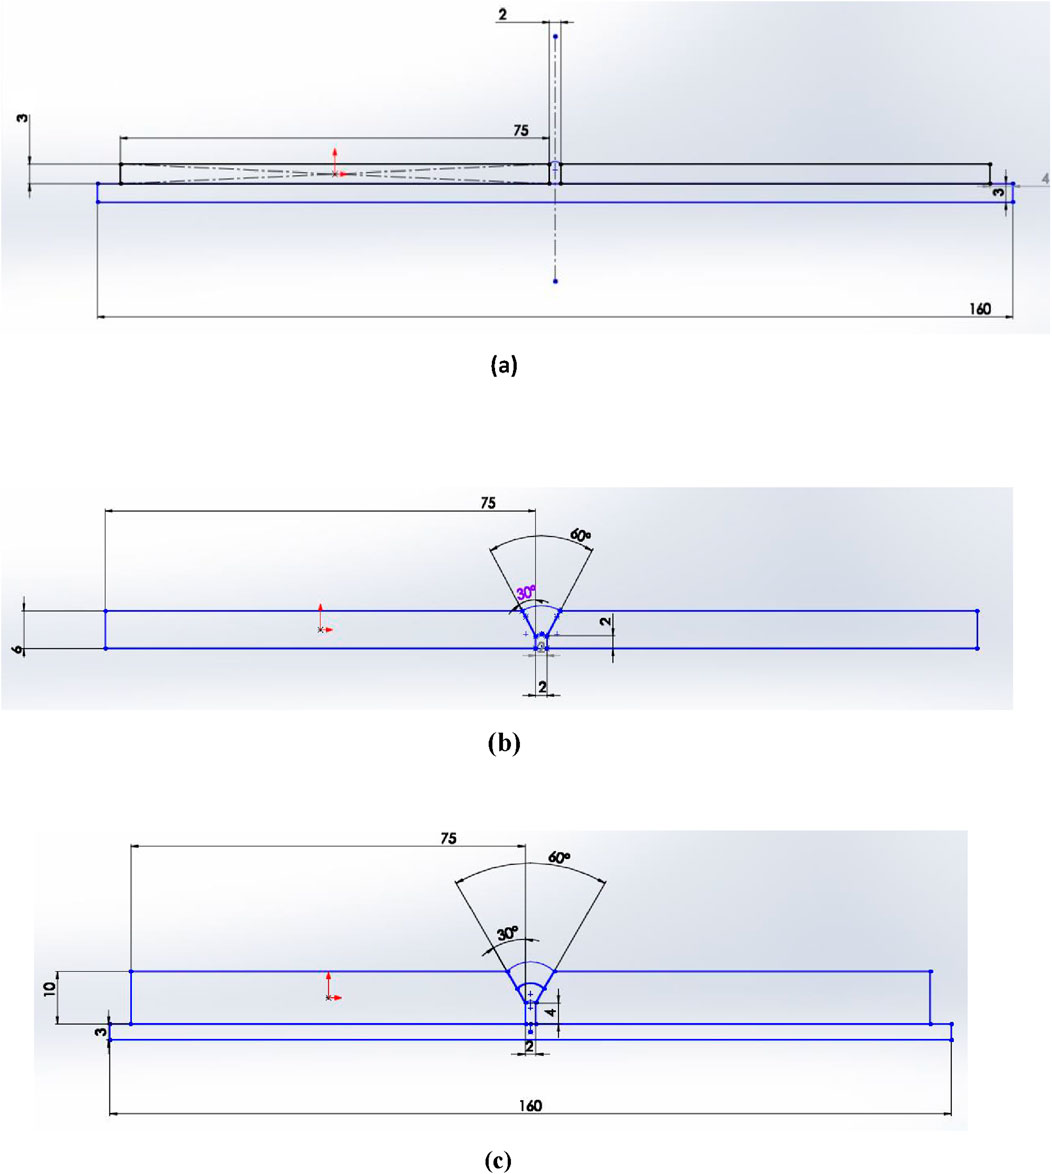
Figure 3. Geometry of different thickness materials. (a) Geometry of 3 mm thick material, (b) Geometry of 6 mm thick material, (c) Geometry of 10 mm thick material.
Following the experimentation with various thicknesses, the welded workpiece was sectioned into standard specimens according to ASTM E8M guidelines (Table 9). The side view of the standard specimen is depicted in Figure 4.
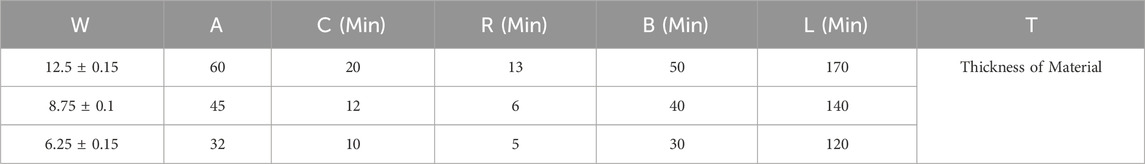
Table 9. Dimensional Specification of different materials.
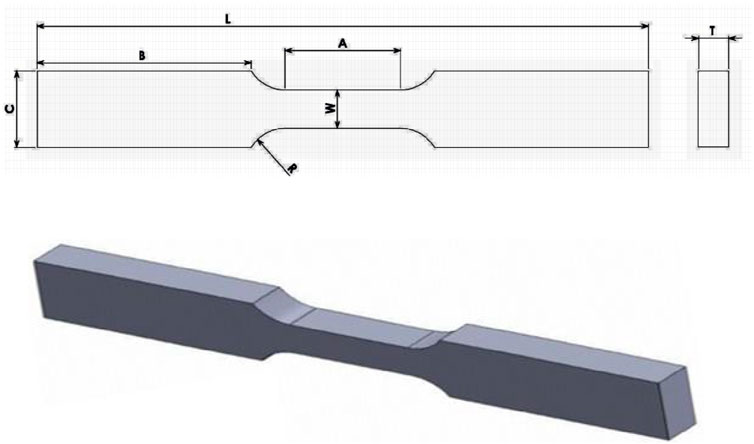
Figure 4. Standard tensile specimen.
Table 9 presents dimensional specifications for different material thicknesses, with parameters W, A, C, R, B, and L given in millimeters. The table includes three thickness categories: 12.5 mm, 8.75 mm, and 6.25 mm, each with specific dimensional tolerances. As the material thickness decreases, corresponding values for A, C, R, B, and L also decrease. The widest and longest dimensions are observed for the 12.5 mm thickness, while the smallest values are recorded for the 6.25 mm thickness. This table provides essential geometric details for material selection and processing.
5 Simulation work
The simulation process encompasses a series of procedures conducted across multiple software platforms. These operations are outlined as follows.
1. Geometry of 3D Model
2. Fine meshing of parts by Gmsh
The table presents the mesh details for different sections of a welded structure at varying element sizes (3 mm, 6 mm, and 10 mm). It includes the number of nodes and elements for the left plate, right plate, and multiple weld passes. The left and right plates exhibit a higher node and element count, especially for finer mesh sizes (3 mm). The weld passes show a decreasing trend in node and element count with successive passes (Table 10). Figure 5 shows 3D geometry of the weld passes. Nodes and elements left plate, weld pass and right plate have been shown in Figure 6. Simulation of Fine meshing of weld pass , right plate, node geometry, selection of boundary condition and weld geometry have been shown in Figure 7.
3. Fine meshing of parts by Gmsh.
4. Import meshed parts of welded joint.
5. Assigning geometries and import material.
6. Generating and assigning welding trajectories.
7. Importing and assigning weld geometries.
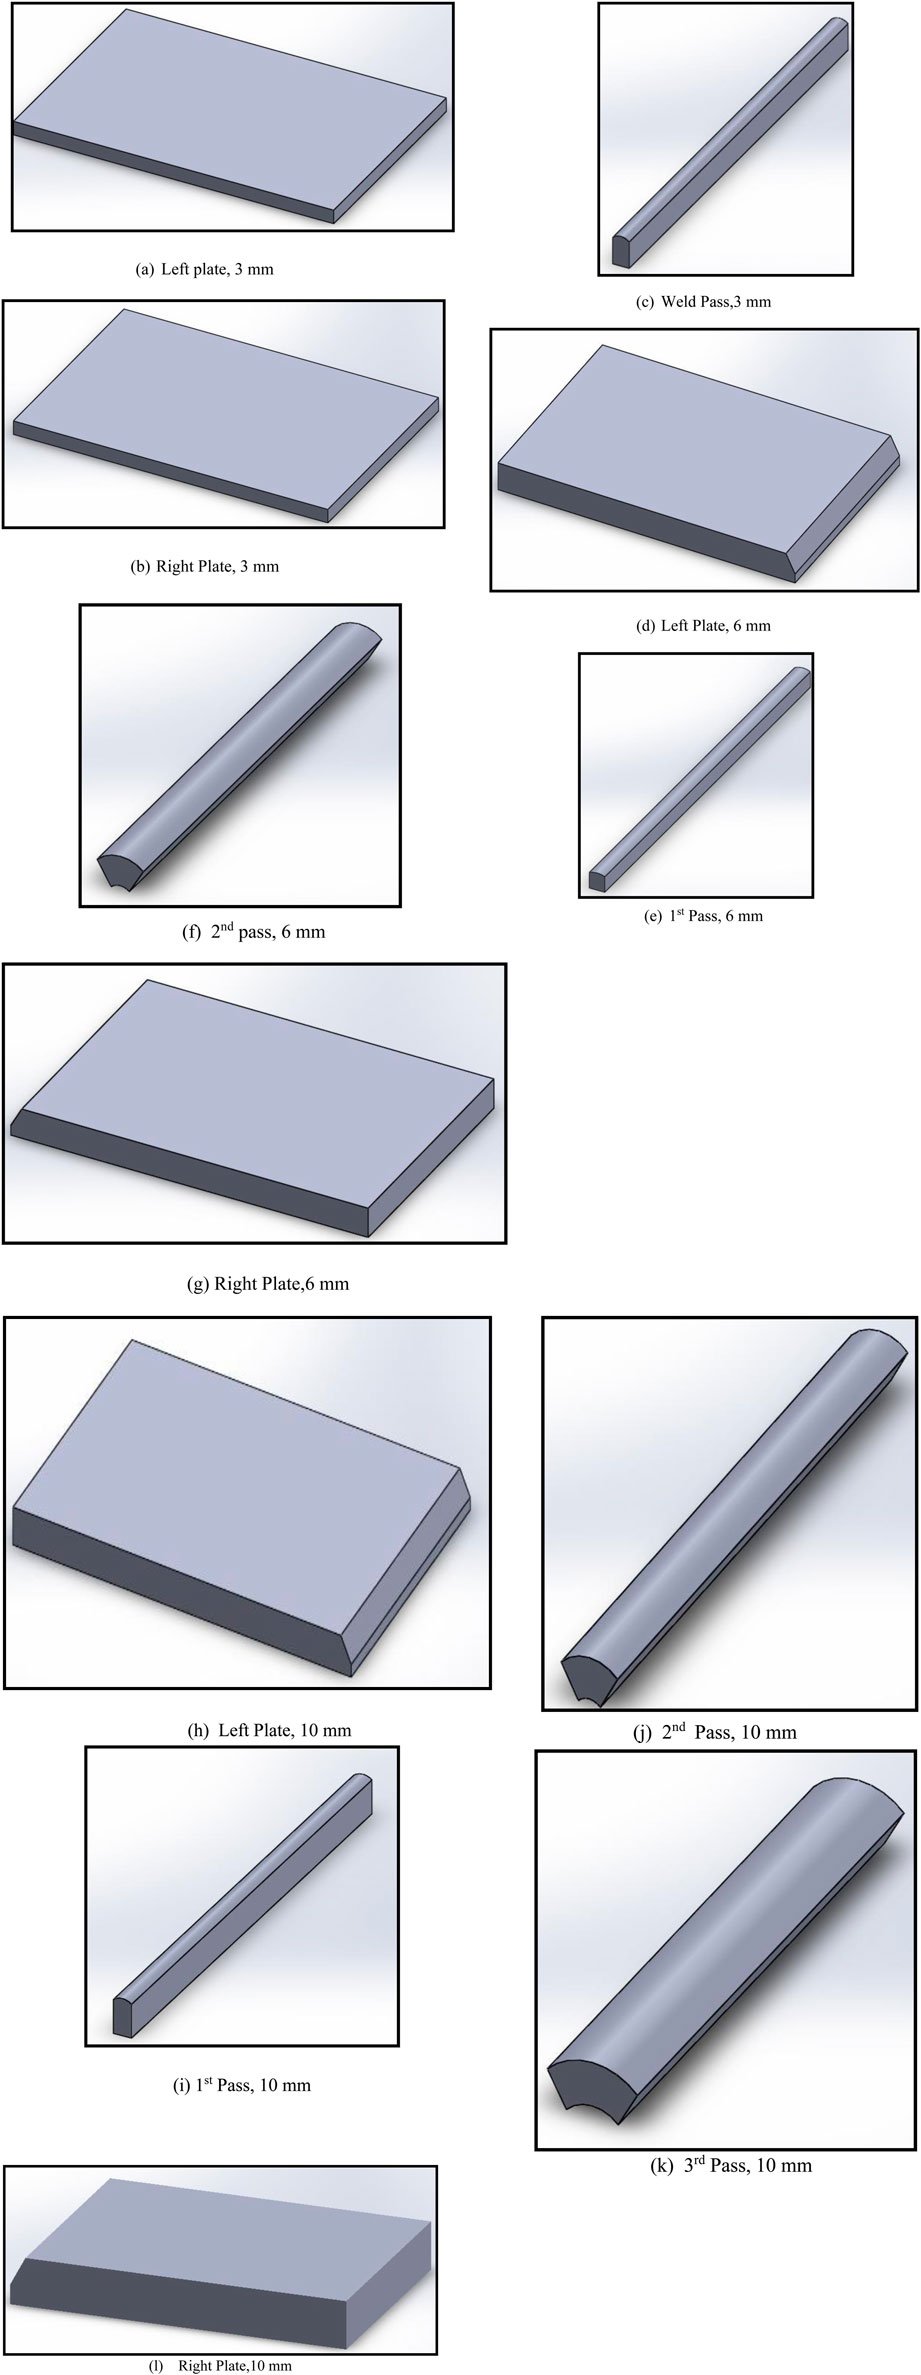
Figure 5. Geometry of 3D Model (a) Left plate, 3 mm (b) Right Plate, 3 mm (c) Weld Pass, 3 mm (d) Left Plate, 6 mm (e) 1st Pass, 6 mm (f) 2nd pass, 6 mm (g) Right Plate, 6 mm (h) Left Plate, 10 mm (i)1st Pass, 10 mm (j) 2nd Pass, 10 mm (k) 3rd Pass, 10 mm (l) Right Plate, 10 mm.
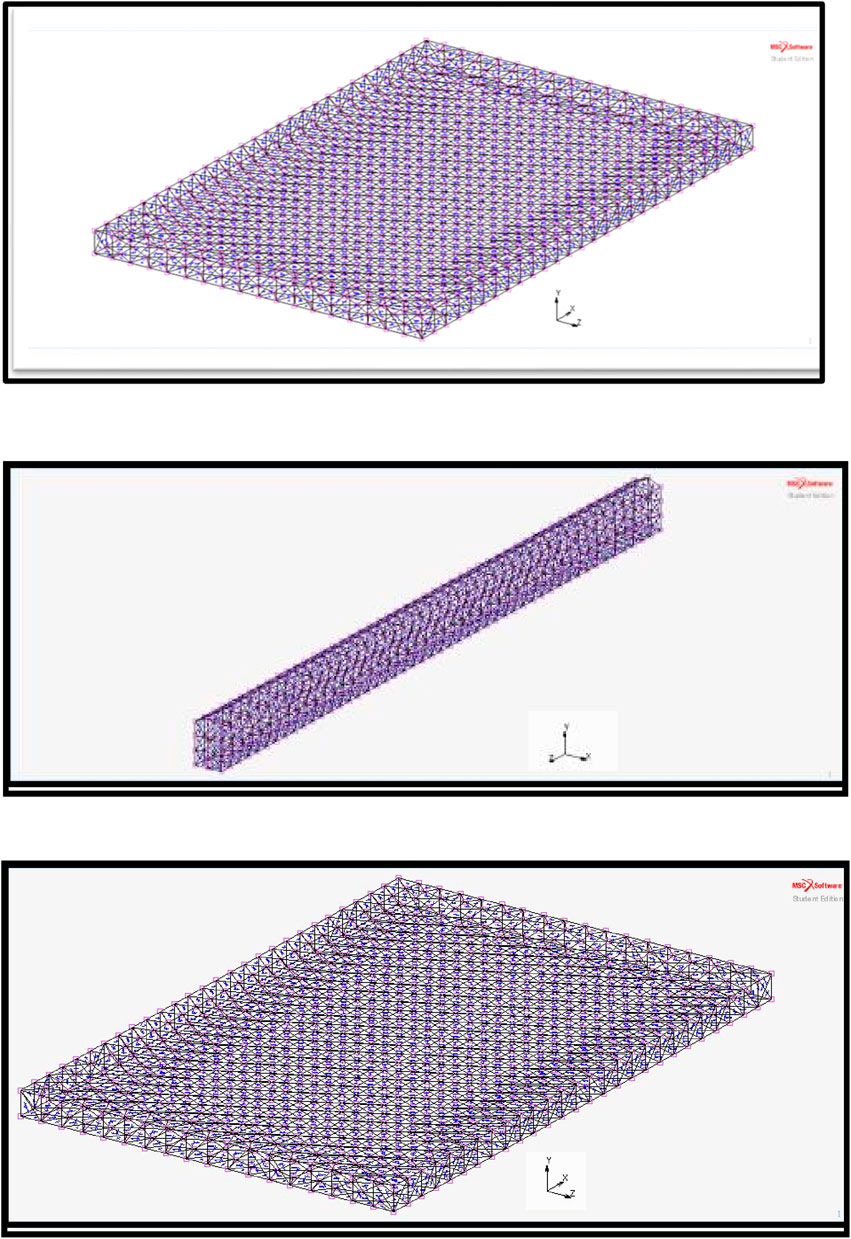
Figure 6. Nodes & elements left plate, weld pass & right plate.
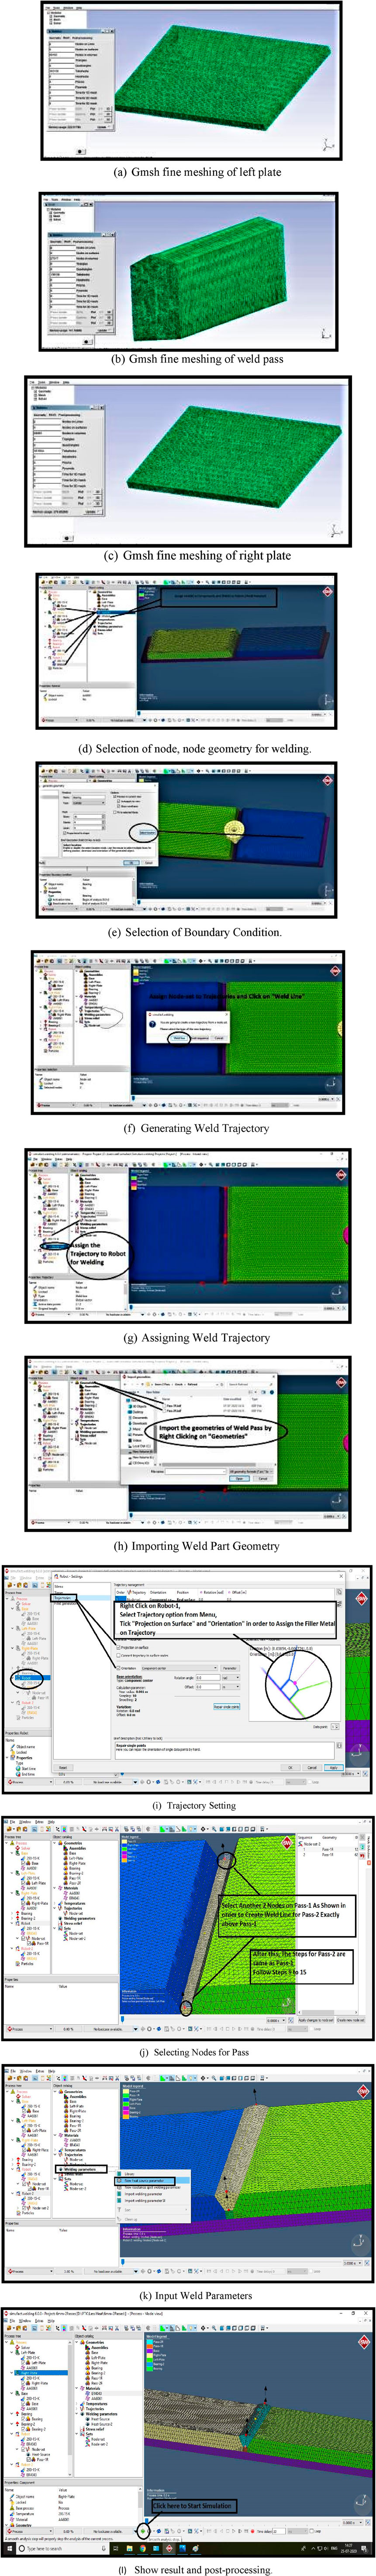
Figure 7. Fine meshing of parts by Gmsh. (a) Gmsh fine meshing of left plate (b) Gmsh fine meshing of weld pass (c) Gmsh fine meshing of right plate (d) Selection of node, node geometry for welding. (e) Selection of Boundary Condition. (f) Generating Weld Trajectory (g) Assigning Weld Trajectory (h) Importing Weld Part Geometry (i) Trajectory Setting (j) Selecting Nodes for Pass (k) Input Weld Parameters (l) Show result and post-processing.
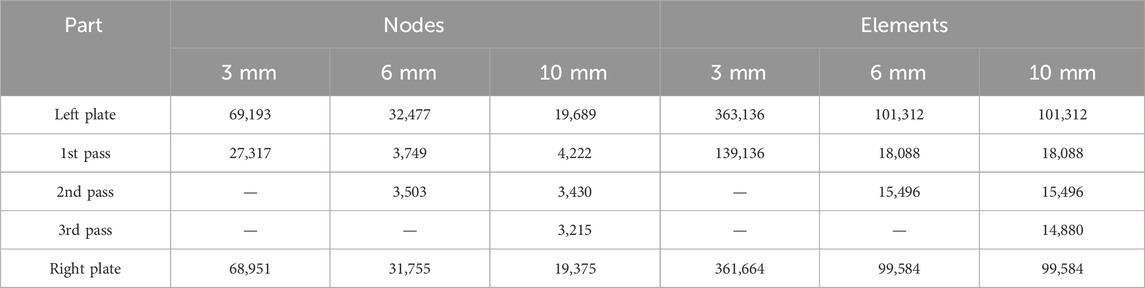
Table 10. Weld passes for nodes and elements.
6 Results
Table 11 presents experimental results for different welding conditions, including peak current (Ip), base current (Ib), and frequency (f) in Hz, with measurements for 3 mm, 6 mm, and 10 mm specimens. The peak current varies from 120 A to 180 A, while the base current ranges from 60 A to 100 A. The recorded values indicate that higher peak and base currents generally lead to increased measurements across all thicknesses. The results also show variations with frequency, affecting different thicknesses uniquely. The highest values are observed at 180 A peak current and 6 Hz frequency, particularly for the 10 mm specimen. Overall, the table highlights the influence of welding parameters on material response across different thicknesses.
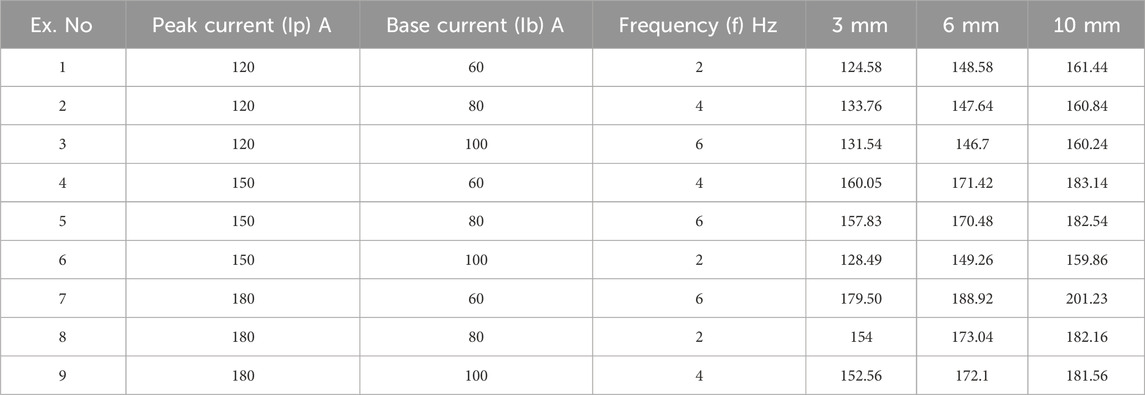
Table 11. Experiment results.
7 Result analysis
Numerous methods exist to optimize welding process parameters. In our investigation, we utilized regression analysis. This approach facilitates the understanding of the relationship between a single response variable and multiple predictor variables.
7.1 Regression analysis
We developed regression equations to forecast the tensile strength value within the utilized factorial space. These equations enable us to explore the interaction effects of Ip, Ib, and f on mechanical properties.
For 3 mm thickness specimen
For 6 mm thickness specimen
For 10 mm thickness specimen
An analysis was conducted to evaluate how the response correlates with the process variables. In Figure 8, the main effect plot illustrates the relationship between peak current, pulsed frequency, and the tensile properties of the welded joint. It's observed that both peak current and pulsed frequency have a significant impact on the tensile characteristics. Increasing either parameter leads to higher tensile strength values. Conversely, the effect of base current on tensile strength is opposite: as base current decreases, tensile strength tends to increase (Babu et al., 2008a).
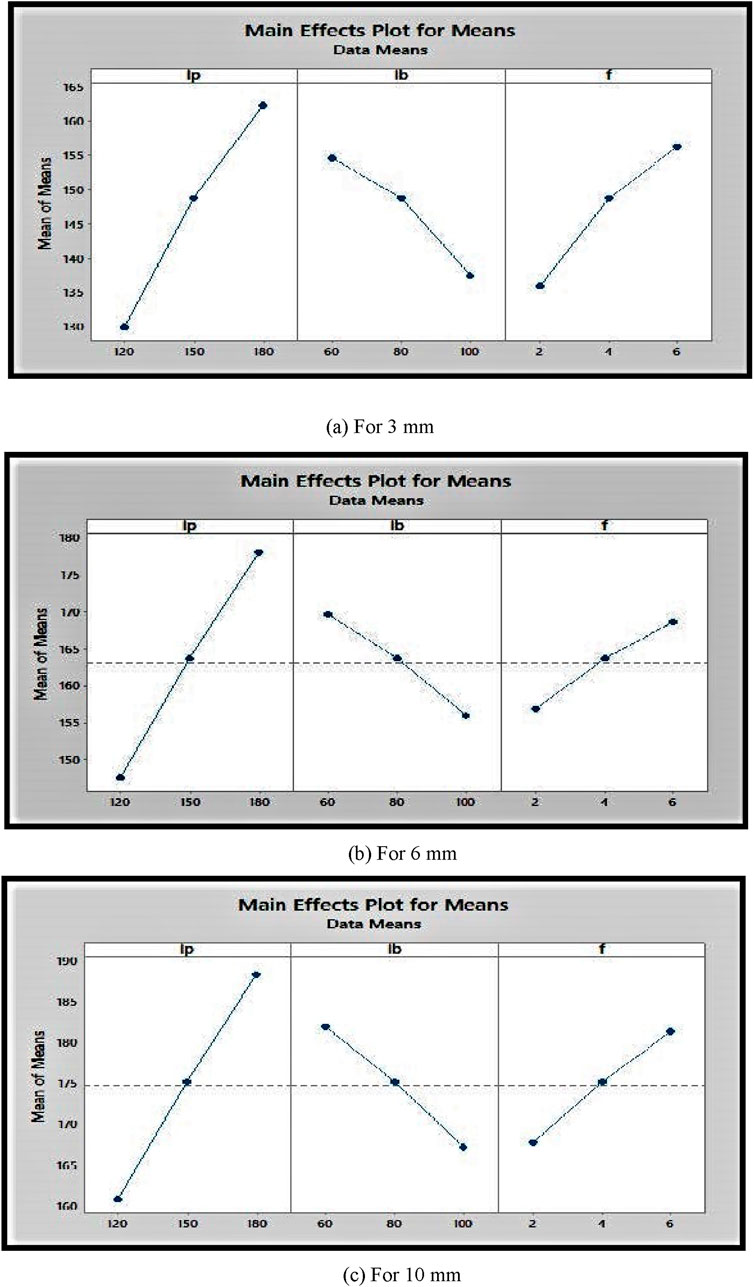
Figure 8. Main effect plot for Tensile strength. (a) For 3 mm (b) For 6 mm (c) For 10 mm.
7.2 Analysis of variance
ANOVA, a statistical method, is employed to scrutinize each process parameter, aiming to establish confidence levels. In our study, ANOVA was utilized to ascertain the contribution of each parameter to tensile strength, offering a comprehensive understanding of their impact on the output parameter.
By comparing mean squares with an estimate of experimental errors at specified confidence levels, ANOVA facilitates a formal assessment of the significance of primary components and their interactions. We examined the optimal joint strength influenced by tensile strength values for the welded workpiece using mean values and following the standard ANOVA procedure. The contribution of each parameter, quantified as a percentage, was determined through ANOVA analysis of the experimental data.
This statistical technique plays a crucial role in objectively assessing the impacts of all major components and their interrelationships. It achieves this by comparing mean squares with estimated experimental errors at predefined confidence levels, providing valuable insights into the significance of each parameter in influencing the outcome. In this analysis, the percentage contribution of each process parameter to achieving optimal joint strength was determined using MINITAB software (Babu et al., 2008b). The most influential process parameter identified through the percentage calculation for 3 mm, 6 mm, and 10 mm thicknesses are peak current (Ip), frequency (f), and base current (Ib), respectively. Their corresponding contributions are approximately 47.13%, 45.45%, and 68.54%. These results highlight the significance of frequency (f) and peak current (Ip) as the most crucial process parameters affecting joint strength. Additionally, studies where the p-values for corresponding parameters are mentioned demonstrate the significance of each parameter.
Table 12 presents the ANOVA results for tensile strength of 3 mm specimens, analyzing the influence of peak current (Ip), base current (Ib), and frequency (f). The regression model explains 99.88% of the variation in tensile strength, with an adjusted R-squared of 99.54% and a predicted R-squared of 92.79%. The F-values indicate that frequency (f) has the most significant effect (F = 47.16, P = 0.021), followed by the interaction of peak current and frequency (Ipf) with F = 35.13 and P = 0.027. The base current (Ib) and its interaction with peak current (IpIb) show relatively lower significance. Overall, the model strongly predicts tensile strength with minimal error (S = 1.25126).
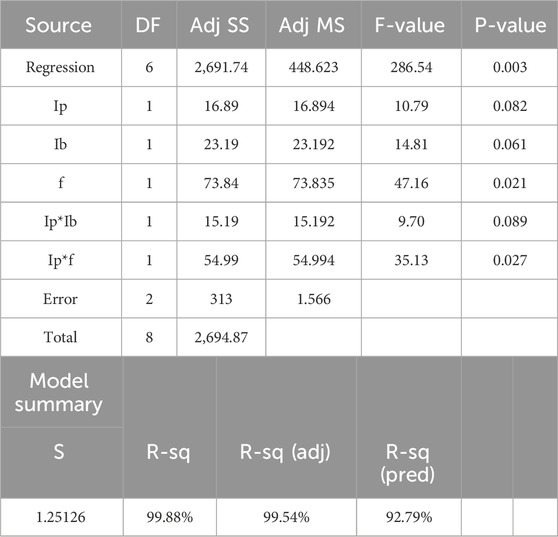
Table 12. ANOVA results for tensile strength (3 mm).
Table 13 presents the ANOVA results for tensile strength of 6 mm specimens, showing the effects of peak current (Ip), base current (Ib), and frequency (f). The regression model explains 99.95% of the variation, with an adjusted R-squared of 99.81% and a predicted R-squared of 97.01%, indicating a highly accurate model. The base current (Ib) has the highest F-value (45.45) but a relatively higher P-value (0.21), suggesting moderate significance. Peak current (Ip) and frequency (f) show notable effects with P-values of 0.039 and 0.057, respectively. The error is minimal (S = 0.672777), confirming the model’s reliability in predicting tensile strength.
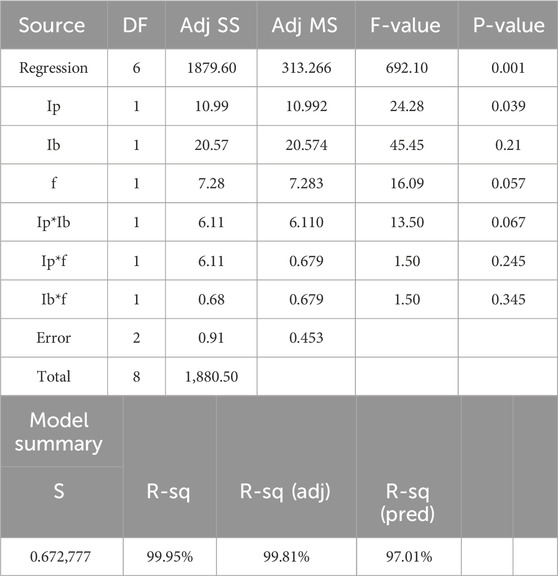
Table 13. ANOVA results for tensile strength (6 mm).
Table 14 presents the ANOVA results for tensile strength of 10 mm specimens, showing the effects of peak current (Ip), base current (Ib), and frequency (f). The regression model explains 99.98% of the variation, with an adjusted R-squared of 99.90% and a predicted R-squared of 98.52%, indicating excellent model accuracy. Base current (Ib) has the highest F-value (68.54) with a significant P-value (0.014), followed by peak current (Ip) and frequency (f) with F-values of 51.76 and 22.86, respectively. Interaction effects (IpIb and Ipf) show moderate significance, while Ib*f has a minimal impact. The low error value (S = 0.454,817) confirms the model’s strong predictive capability.

Table 14. ANOVA results for Tensile strength (10 mm).
8 Result validation
The optimal results were verified using Simufact welding simulation software, renowned for its ability to predict welding-induced distortions and residual stresses while offering solutions to mitigate these effects on workpieces. Additionally, Simufact provides insights into weld joint strength by analysing metallurgical properties such as micro structural properties in the Heat Affected Zone (HAZ). The software also supports the development of favourable clamping arrangements, significantly impacting the welding process. Through clamping optimization, Simufact facilitates the achievement of the most favourable weld sequence, thereby enhancing efficiency and quality.
Moreover, Simufact aids in predicting the final contour and tolerances of components for mass production, ensuring they meet predefined specifications. This comprehensive functionality renders Simufact an invaluable tool for validating experimental results and optimizing welding processes for industrial applications.
Following guidelines outlined by the American Welding Society (AWS) standards, a meticulous PCTIG welding process was designed. A CAD model was prepared, and weld geometry was established. Primary meshing was performed using MARC meshing software, followed by fine meshing. This process facilitated the generation of results regarding residual stress and temperature distribution at each zone, fluid flow characteristics, and the mode of metal transfer, aiding in generating the contour of the weld pool (Hadadzadeh et al., 2014).
The double heat source model proposed by Goldak et al., widely accepted in illustrating the TIG welding process, was employed. In this study, the double ellipsoid heat source, recognized as the most widely accepted, was utilized for the TIG welding process.
Comparisons between experimental and numerical (software-based) results of tensile strength were conducted, as shown in Table 15. It was observed that the deviations in the results were within acceptable limits, i.e., less than 10%. The predicted strength values obtained through numerical methods were slightly higher compared to experimental methods. The maximum predicted strength values by numerical methods were 195.21 MPa, 202.54 MPa, and 215.52 MPa for thicknesses of 3 mm (Table 12), 6 mm (Table 13), and 10 mm (Table 14), respectively.
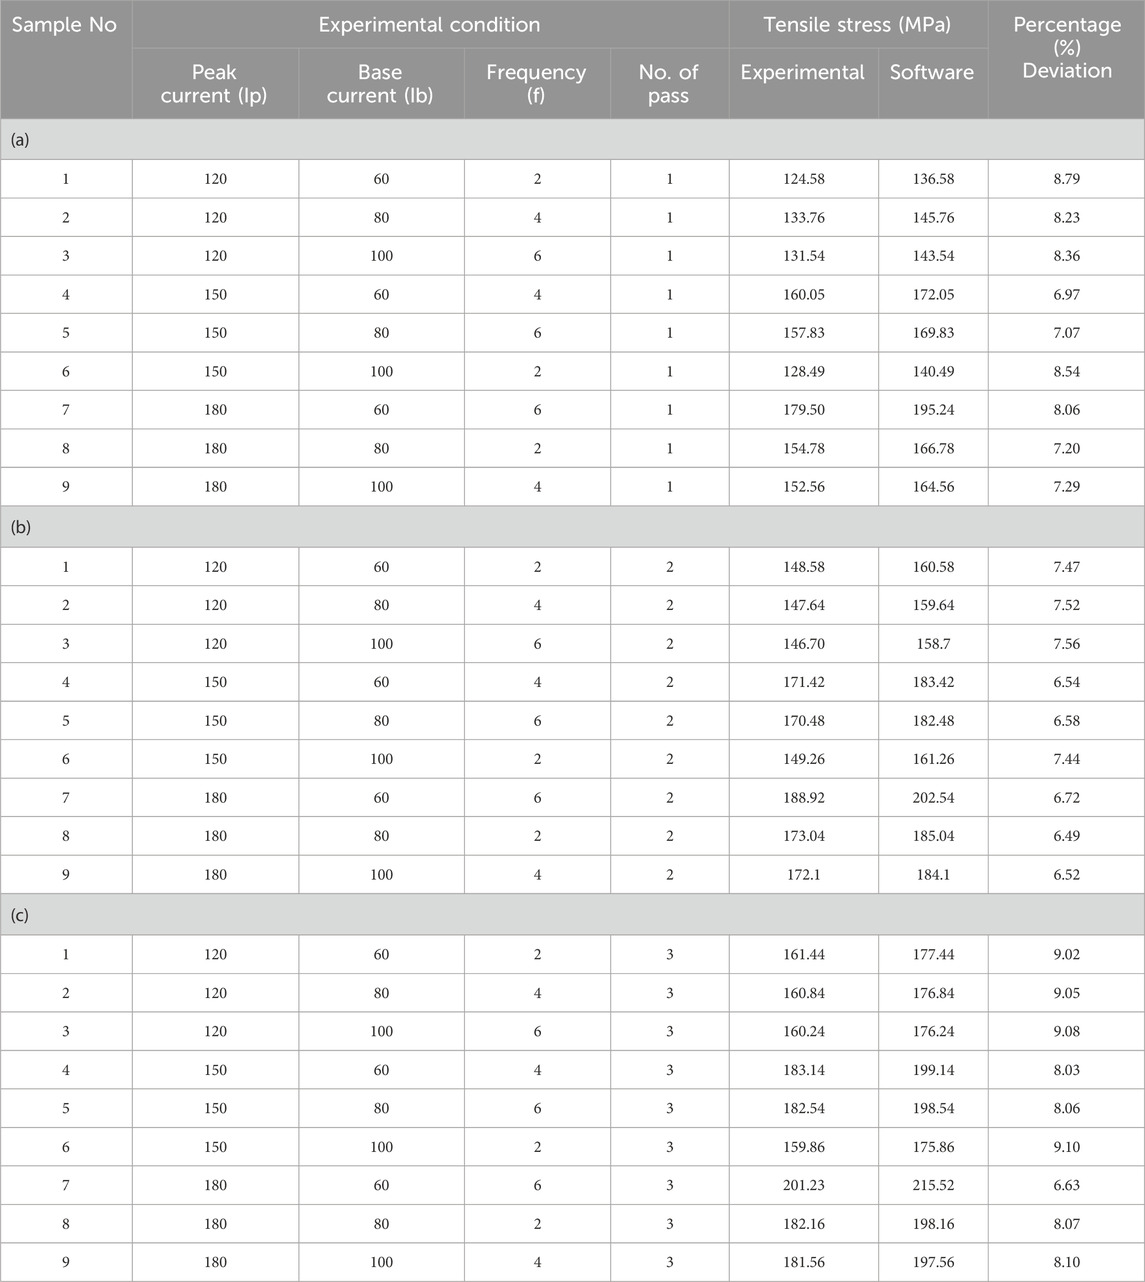
Table 15. Validation of result.
The peak current (Ip) influences the fusion zone microstructure by determining heat input and cooling rate. Higher peak currents promote deeper penetration but can lead to grain coarsening due to slower solidification. Conversely, lower peak currents result in finer grains due to rapid cooling, enhancing tensile strength. The base current (Ib) helps maintain arc stability and controls the solidification rate, reducing thermal cycling effects and minimizing residual stress. Pulse frequency (f) affects grain refinement by increasing the number of thermal cycles, reducing dendritic growth, and promoting the formation of equiaxed grains in the fusion zone, which improves mechanical properties. Higher peak current (180 A) ensures deeper penetration but needs to be optimized to prevent excessive heat input, which can lead to wider heat-affected zones (HAZ) and softening due to grain coarsening. A higher pulse frequency (6 Hz) improves energy distribution, leading to uniform heat input and finer grain structures, reducing the risk of hot cracking and distortion. The pulsation of current in PCTIG welding creates periodic agitation in the molten pool, promoting better fusion between grains and breaking up coarse dendritic structures. A higher frequency contributes to controlled heat dissipation, ensuring improved weld bead morphology and defect minimization, such as porosity and inclusions.
Based on ANOVA results, peak current (Ip) exhibited the highest contribution to tensile strength, followed by pulse frequency (f) and base current (Ib). The dominance of peak current is attributed to its direct effect on heat input and penetration depth, influencing the fusion zone grain structure. A higher peak current (180 A) ensures deeper penetration, stronger metallurgical bonding, and enhanced grain refinement, leading to higher tensile strength. However, excessive peak current can cause grain coarsening, reducing strength. Pulse frequency significantly affects thermal cycling, influencing grain refinement and solidification dynamics. A higher frequency (6 Hz) induces greater agitation in the molten pool, reducing dendrite growth and improving mechanical properties. The base current, while crucial for arc stability, had a comparatively lower influence since it primarily controls heat dissipation and arc maintenance rather than direct fusion characteristics.
8.1 Validation of experimental work with software
Experimental work involves repetitive tasks fraught with various challenges, including heat generation and fume emissions. Conversely, simulation work offers a non-physical, computational approach to understanding welding processes. Validation is paramount to ensuring the reliability of experimental results, and various methods, including analytical and numerical techniques, can be utilized for this purpose.
In our investigation, experimental results were validated using simulation software. This validation process validates the experimental findings by comparing them with simulated outcomes. Simulation work provides insights into the behaviour of actual experiments, enabling virtual experiments to be conducted under standardized conditions. Mechanical properties are then evaluated based on these virtual experiments (Padmanaban et al., 2011). It was observed that the results obtained from simulation closely approximated the optimal values. This alignment between experimental and simulated outcomes validates the experimental work, bolstering its credibility. The average results are summarized in Table 15, demonstrating the convergence between experimental and simulated findings.
8.2 Justification of result deviation
The simulation process performed by Simufact software operates under standardized initial conditions provided to the software. In contrast, actual experimental work is subject to variations due to environmental conditions. Hence, deviations in output results between simulation and experimentation are possible. While simulation results offer an approximation of the expected outcomes, it's important to acknowledge that experimental work is executed by qualified welders. Results obtained through experimentation may contain errors stemming from differences between machines and individuals (Shelwatkar et al., 2016). However, deviations in the achieved results typically fall within an acceptable range, often less than 10%. Therefore, these deviations can be deemed acceptable, considering the inherent variability in the experimental process. Table 15 depicts the validation of PCTIG-welded AA 6065 aluminium alloy experimental results with software results for Tensile Strength, including thicknesses of 3 mm, 6 mm, and 10 mm.
9 Conclusion
This research study aims to assess the impact of PCTIG welding process parameters on plates of varying thicknesses (3 mm, 6 mm, and 10 mm) and optimize these parameters to enhance mechanical properties. Several conclusions have emerged from both experimental work and simulation analysis:
1. Taguchi Design of Experiment Method: The implementation of this robust design technique enhanced process quality and stability while minimizing the number of experiments required. A statistical model incorporating the effects of PCTIG welding parameters was utilized to estimate mechanical properties.
2. Analysis of Variance (ANOVA): ANOVA proved effective in determining the significance of individual, main, and interaction factors of the PCTIG welding process, facilitating process optimization.
3. Optimization for Tensile Strength: A higher tensile strength (201.23 MPa) was attained with high peak current (Ip = 180 A), high frequency (6 Hz), and lower base current (Ib = 80 A), resulting in grain refinement.
4. Effect of Thickness and Passes: Increasing thickness and the number of passes led to higher tensile strength due to increased heat input, resulting in grain refinement and improved mechanical properties.
5. Numerical Validation: Experimental results were validated using numerical methods, particularly with Simufact software. The deviation between experimental and software results was less than 10%, indicating the reliability and predictability of joint strength predictions by Simufact software.
6. Peak current (Ip) had the highest influence on tensile strength, as it directly affects heat input, penetration depth, and grain refinement, leading to stronger welds. Pulse frequency (f) enhanced grain refinement, while base current (Ib) played a secondary role in arc stability and heat dissipation.
These conclusions underscore the effectiveness of optimization techniques and numerical validation methods in enhancing the understanding and predictability of PCTIG welding processes and their impact on mechanical properties.
Data availability statement
The raw data supporting the conclusions of this article will be made available by the authors, without undue reservation.
Author contributions
AG: Conceptualization, Investigation, Methodology, Writing–original draft. RR: Conceptualization, Project administration, Software, Supervision, Writing–review and editing. RC: Investigation, Resources, Software, Supervision, Writing–review and editing. AjK: Conceptualization, Formal Analysis, Methodology, Supervision, Writing–original draft, Writing–review and editing. SJ: Conceptualization, Investigation, Methodology, Supervision, Writing–review and editing. FA: Investigation, Methodology, Resources, Supervision, Validation, Writing–review and editing. AsK: Conceptualization, Formal Analysis, Investigation, Methodology, Writing–review and editing. ND: Conceptualization, Formal Analysis, Methodology, Resources, Software, Writing–review and editing.
Funding
The author(s) declare that financial support was received for the research and/or publication of this article. This research did not receive any specific grant from funding agencies in the public, commercial, or not-for-profit sectors. This article was co-funded by the European Union under the REFRESH–Research Excellence For REgion Sustainability and High-tech Industries project number CZ.10.03.01/00/22_003/0000048 via the Operational Programme Just Transition and has been done in connection with project Students Grant Competition SP 2025/062 “Specific research on progressive and sustainable production technologies” financed by the Ministry of Education, Youth and Sports and Faculty of Mechanical Engineering VŠB-TUO.
Conflict of interest
The authors declare that the research was conducted in the absence of any commercial or financial relationships that could be construed as a potential conflict of interest.
The author(s) declared that they were an editorial board member of Frontiers, at the time of submission. This had no impact on the peer review process and the final decision.
Generative AI statement
The author(s) declare that no Generative AI was used in the creation of this manuscript.
Publisher’s note
All claims expressed in this article are solely those of the authors and do not necessarily represent those of their affiliated organizations, or those of the publisher, the editors and the reviewers. Any product that may be evaluated in this article, or claim that may be made by its manufacturer, is not guaranteed or endorsed by the publisher.
References
Babu, S., Kumar, T. S., and Balasubramanian, V. (2008a). Optimizing pulsed current gas tungsten arc welding parameters of AA6061 aluminium alloy using Hooke and Jeeves algorithm. Trans. Nonferrous Met. Soc. China 18 (5), 1028–1036. doi:10.1016/s1003-6326(08)60176-4
Babu, S., Kumar, T. S., and Balasubramanian, V. (2008b). Optimizing pulsed current gas tungsten arc welding parameters of AA6061 aluminium alloy using Hooke and Jeeves algorithm. Trans. Nonferrous Met. Soc. China 18 (5), 1028–1036. doi:10.1016/s1003-6326(08)60176-4
Balasubramanian, V., Ravisankar, V., and Madhusudhan Reddy, G. (2008). Influences of pulsed current welding and post weld aging treatment on fatigue crack growth behaviour of AA7075 aluminium alloy joints. Int. J. Fatigue 30 (3), 405–416. doi:10.1016/j.ijfatigue.2007.04.012
Burande, D. V., Kalita, K., Gupta, R., Kumar, A., Singh Chohan, J., and Kumar, D. (2024). Machine learning metamodels for thermo-mechanical analysis of friction stir welding. Int. J. Interact. Des. Manuf. (IJIDeM) 19, 597–615. doi:10.1007/s12008-024-01871-6
Chandra, P. C., Mondal, A. K., Nirsanametla, Y., Kumar, A., and Chowdhury, S. (2024). Influence of tool traverse speed on mechanical properties and fracture morphology of friction stir welded pure copper butt joints. J. Adhesion Sci. Technol. 8, 1–14. doi:10.1080/01694243.2024.2411315
Da Cunha, T. V., Louise Voigt, A., and Bohorquez, C. E. N. (2016). Analysis of mean and RMS current welding in the pulsed TIG welding process. J. Mater. Process. Technol. 231, 449–455. doi:10.1016/j.jmatprotec.2016.01.005
Goswami, E., Srivastava, A. K., Kumar, A., Salman, M., Choudhary, M. Z., and Pandey, S. S. (2023). “Review of microstructural and mechanical properties of microwave welding of lightweight alloys,” in Modeling, characterization, and processing of smart materials (IGI Global), 185–204.
Hadadzadeh, A., Ghaznavi, M. M., and Kokabi, A. H. (2014). The effect of gas tungsten arc welding and pulsed-gas tungsten arc welding processes’ parameters on the heat affected zone-softening behavior of strain-hardened Al–6.7Mg alloy. Mater. Des. 55, 335–342. doi:10.1016/j.matdes.2013.09.061
Kalita, K., Burande, D., Kumar Ghadai, R., and Chakraborty, s. (2023). Finite element modelling, predictive modelling and optimization of metal inert gas, tungsten inert gas and friction stir welding processes: a comprehensive review. Arch. Comput. Methods Eng. 30, 271–299. doi:10.1007/s11831-022-09797-6
Kiaee, N., and Aghaie Khafri, M. (2014a). Optimization of gas tungsten arc welding process by response surface methodology. Mater. Des. 54, 25–31. doi:10.1016/j.matdes.2013.08.032
Kiaee, N., and Aghaie Khafri, M. (2014b). Optimization of gas tungsten arc welding process by response surface methodology. Mater. Des. 54, 25–31. doi:10.1016/j.matdes.2013.08.032
Kou, S. (2003). Solidification and liquation cracking issues in welding. JOM 55 (6), 37–42. doi:10.1007/s11837-003-0137-4
Kudale, A. S., and Jit Singh, K. (2023). “Short review on friction stir welding and machining parameters”.
Kumar, A., Gahlot, P., Kumar, A., and Kumar Phanden, R. (2024). A state-of-the-art literature review on friction stir welding of 7075-aluminium alloy for tool geometry selection, environmental parameter and mathematical modelling perspective. Int. J. Interact. Des. Manuf. (IJIDeM) 19, 1549–1562. doi:10.1007/s12008-024-01922-y
Kumar, A., and Gulati, V. (2018). Experimental investigations and optimization of forming force in incremental sheet forming. Sadhana 43 (10), 159. doi:10.1007/s12046-018-0926-7
Kumar, A., and Sundarrajan, S. (2006). Selection of welding process parameters for the optimum butt-joint strength of an aluminum alloy. Mater. Manuf. process. 21 (8), 779–782. doi:10.1080/03602550600728117
Kumar, A., and Sundarrajan, S. (2009a). Optimization of pulsed TIG welding process parameters on mechanical properties of AA 5456 Aluminum alloy weldments. Mater. Des. 30 (4), 1288–1297. doi:10.1016/j.matdes.2008.06.055
Kumar, A., and Sundarrajan, S. (2009b). Effect of welding parameters on mechanical properties and optimization of pulsed TIG welding of Al-Mg-Si alloy. Int. J. Adv. Manuf. Technol. 42 (1–2), 118–125. doi:10.1007/s00170-008-1572-8
Kumar, A., and Vishal, G. (2018). Experimental investigation and optimization of surface roughness in negative incremental forming. Measurement 131 (September 3), 419–430. doi:10.1016/j.measurement.2018.08.078
Lawal, S. L., and Afolalu, S. A. (2023). “Effect of welding process parameters on the mechanical properties of TIG and MIG welds in HSS X65 pipe-A review”.
Lawal, S. L., Afolalu, S. A., Jen, T.-C., and Akinlabi, E. T. (2023). Tungsten inert gas (TIG) and metal inert gas (MIG) welding applications - critical review. E3S Web Conf. 390, 05012. doi:10.1051/e3sconf/202339005012
Lei, Z., Li, B., Ni, L., Yang, Y., Yang, S., and Hu, P. (2017). Mechanism of the crack formation and suppression in laser-MAG hybrid welded 30CrMnSiA joints. J. Mater. Process. Technol. 239, 187–194. doi:10.1016/j.jmatprotec.2016.08.033
Mamgain, A., Singh, V., and Singh, A. P. (2023). Influence of welding parameters on mechanical property during friction stir welded joint on aluminium alloys: a review. jkukm. 35, 13–28. doi:10.17576/jkukm-2023-35(1)-02
Manti, R., and Dwivedi, D. K. (2007). Microstructure of Al – Mg – Si weld joints produced by pulse TIG welding. Mater. Manuf. process. 6914 (December), 57–61. doi:10.1080/10426910601015923
Padmanaban, G., and Balasubramanian, V. (2011). Optimization of pulsed current gas tungsten arc welding process parameters to attain maximum tensile strength in AZ31B magnesium alloy. Trans. Nonferrous Met. Soc. China 21 (3), 467–476. doi:10.1016/s1003-6326(11)60738-3
Padmanaban, G., Balasubramanian, V., and Reddy, G. M. (2011). Fatigue crack growth behaviour of pulsed current gas tungsten arc, friction stir and laser beam welded AZ31B magnesium alloy joints. J. Mater. Process. Technol. 211 (7), 1224–1233. doi:10.1016/j.jmatprotec.2011.02.003
Patel, H. N., Chauhan, V. D., and George, P. M. (2023). Effect of submerged arc welding process parameters on ASME SA 515 Gr 70 – a review. AIP Conf. Proc. 2605, 020037. doi:10.1063/5.0123545
Ranjan, R., Kumar Jha, S., and Kumar, A. (2024). Enhancing hardness in SMAW welded joints with low-frequency vibration assistance: an experimental and analytical study. J. Adhesion Sci. Technol. 27, 1–25. doi:10.1080/01694243.2024.2371227
Saxena, A., Gupta, T. K., Srivastava, R., Srivastava, A. K., and Kumar, A. (2024). A comparison of different experimental approaches in the determination of dynamic fracture toughness (J 1d) behavior for RHA steel cost sustainable MMAW weldments. J. Adhesion Sci. Technol. 9, 1–22. doi:10.1080/01694243.2024.2334267
Senthil Kumar, T., Balasubramanian, V., and Sanavullah, M. Y. (2007). Influences of pulsed current tungsten inert gas welding parameters on the tensile properties of AA 6061 aluminium alloy. Mater. Des. 28 (7), 2080–2092. doi:10.1016/j.matdes.2006.05.027
Shelwatkar, D. A., Reddy, G. M., Gokhale, A. A., Shelwatkar, D. A., Reddy, G. M., and Gokhale, A. A. (2016). “Gas tungsten arc welding studies on similar and dissimilar combinations of Al-Zn-Mg alloy RDE 40 and Al-Li alloy 1441 Gas Tungsten Arc Welding studies on similar and dissimilar combinations of Al ± Zn ± Mg alloy RDE 40 and Al ± Li alloy 1441,” vol. 1718.
Srivastava, A. K., Tiwari, S., Pachauri, P., Gupta, N., Sunil, B., and Kumar, A. (2023). Bonding strength and microstructural features of Al5083-AZ31B alloys laminated sheet through friction stir additive manufacturing. J. Adhesion Sci. Technol. 38 (4), 583–596. doi:10.1080/01694243.2023.2240637
Keywords: TIG welding, universal testing machine, finite element method, ANOVA, regression analysis
Citation: Gupta A, Ranjan R, Cep R, Kumar A, Jha SK, Altarazi F, Kumar A and Dogra N (2025) Optimization of welding strength in the tungsten inert gas welding process for aluminium alloys. Front. Mech. Eng. 11:1569059. doi: 10.3389/fmech.2025.1569059
Received: 31 January 2025; Accepted: 10 March 2025;
Published: 23 May 2025.
Edited by:
Kanak Kalita, Vel Tech Dr. RR & Dr. SR Technical University, IndiaReviewed by:
Hiba K. Hussein, University of Baghdad, IraqRahul Agrawal, Iberian Centre for Energy Storage Research, Spain
Zully Vargas-Galarza, Instituto Tecnologico de Zacatepec, Mexico
Copyright © 2025 Gupta, Ranjan, Cep, Kumar, Jha, Altarazi, Kumar and Dogra. This is an open-access article distributed under the terms of the Creative Commons Attribution License (CC BY). The use, distribution or reproduction in other forums is permitted, provided the original author(s) and the copyright owner(s) are credited and that the original publication in this journal is cited, in accordance with accepted academic practice. No use, distribution or reproduction is permitted which does not comply with these terms.
*Correspondence: Ajay Kumar, YWpheS5rdW1hcjMwODg2QGdtYWlsLmNvbQ==
†ORCID: Ajay Kumar, orcid.org/0000-0001-7306-1902