 Christoph Schneidhofer
 Michael Schandl1
 Nicole Dörr
 Piet M. Lugt
- 1AC2T research GmbH, Wiener Neustadt, Austria
- 2SKF Research and Technology Development, Houten, Netherlands
Introduction: Grease oxidation in rolling bearings causes a loss of grease in the track and hence a loss of lubricity in the bearing. This work addresses loss of grease via evaporation and oxidation due to thermal-oxidative stress applied to two lubricating greases.
Methods: For this purpose, the oxidation stability of two greases was determined using a modified micro-coking test over a wide temperature range from 100°C to 190°C. Grease analyses by means of antioxidant content, oxidation and weight loss were used to develop a lifetime model to describe the change in mass as a function of temperature, time, and grease type due to oxidation based on the Arrhenius equation.
Results and discussion: The developed model describes the correlation between the findings from grease analyses and shows increased oxidation and evaporation after the induction period when antioxidants are almost consumed.
1 Introduction
Oxidation stability is a crucial property of lubricating greases to ensure the long-term functionality of machine components. Grease life is a function of operating temperature, among others, where a rule of thumb is that an increase of 10°C–15°C halves the grease lifetime (Cann et al., 2007; Lugt, 2023). Particularly at higher operating temperatures, grease oxidation stability is a major influencing factor on the grease lifetime (Cann et al., 2007). It is therefore indispensable to take this parameter into account in a lifetime model of lubricating greases.
Such a lifetime model can be used for the prediction and extension of maintenance intervals, allowing the optimum use of the grease, e.g., in a bearing application. However, measuring grease life under ‘normal’ operating conditions is time consuming and, in many cases, impossible. Therefore, a field-to-lab approach is used to predict specific aspects related to grease life such as, in this work, oxidation. The field-to-lab approach (Schneidhofer et al., 2023) is aimed at the elaboration of prediction models for lubricant lifetime using laboratory-based development environments.
The onset of oxidation is given by the so-called oxidation induction time (Rhee, 2001), which is defined as the time after which antioxidants have entirely been consumed (Ito et al., 1988). This means that the induction time is a function of additive concentration and effectiveness but also of oxygen concentration (Lugt et al., 2023). Thermal-oxidative degradation of grease results in an increase in acidification due to base oil oxidation and, to a lesser extent, additive and thickener oxidation. Typical oxidation reaction products are acids, aldehydes, ketones, peroxides, and alcohols (Huang et al., 2016). Degradation results in a loss of mass by evaporation, a loss of lubricity by polymerization and an increase in base oil viscosity (Cen et al., 2025). The latter reduces the base oil mobility, resulting in a reduction of film thickness demonstrated in ball-on disc experiments (Hurley et al., 1998; Huang et al., 2016) but not necessarily in ball bearings (Cen et al., 2025). The thermal degradation rate also depends on the type of grease thickener. Thermal aging at 150 °C revealed a softening of Li-based greases, whereas polyurea-based greases showed hardening (Couronne and Vergne, 2000). Anti-oxidation properties are more effective in polyurea greases than lithium greases (Huang et al., 2016).
As part of the above-mentioned field-to-lab approach, static tests are performed on grease samples in a laboratory where grease is aged under well-controlled conditions. Well known are the artificial alteration methods for the assessment of oxidation stability (Kassler et al., 2018; Dörr et al., 2019) of antioxidants, engine oils or synthetic esters (Besser et al., 2012; 2019; Frauscher et al., 2017). By use of application-oriented laboratory methods in these studies, selected lubricants were benchmarked against each other to make a ranking and pre-selection for specific applications. Eventually, artificial alteration or aging, respectively, can be combined with lubricant sensor development and evaluation to significantly simplify and accelerate the development of algorithms for the determination of lubricant condition out of sensor signals, again driven by the fact that evaluation under controlled conditions is not (easily) possible in the field (Schneidhofer et al., 2018).
Referring to thermal-oxidative degradation of greases, standardized methods like ASTM D942 (ASTM D942-19, 2019) are widely used. Recently, methods based on thermogravimetric analysis (TGA) were reported using stepwise or continuous increase of the temperature to provide kinetic parameters for the oxidation process (Smook et al., 2022).
Several models for grease degradation can be found in the literature. Most empirical models for predicting grease operating life are developed by bearing manufacturers. These can be found in the manufacturers’ catalogues where grease life can be calculated given the bearing size, type, load, speed, operating temperature and grease type (Lugt, 2009). The temperature effect is normally described using an empirical temperature relation inspired by the Arrhenius equation (Booser and Khonsari, 2010; Rezasoltani and Khonsari, 2016; Lugt, 2023). A model for determination of evaporation loss of lubricants is reported in the literature based on a logarithmic trend (Fingas, 2014) or a linear increase with time from the beginning of the degradation process (Naidu et al., 1986; Rezasoltani and Khonsari, 2016). Chemical degradation of greases has been studied applying first-order kinetic models (Naidu et al., 1986; Rohrbach et al., 2005; Rezasoltani and Khonsari, 2016).
This publication contributes to the development of a lifetime model for grease degradation by describing the change in mass as a function of temperature, time, and grease type due to oxidation. The applicability of the model is demonstrated with two commercial greases investigated in laboratory experiments over a wide temperature range. To generate both sufficient sample quantities for the determination of the degree of grease degradation and sufficient data for a reliable model, the standardized “Micro Coking Test for Automotive Lubricants” (GFC Lu 27-T-07, 2012) was modified. The data gained was used to determine coefficients to grease-specific parameters and allow the comparison of the oxidation stability of greases over a temperature range from 100°C to 190°C.
2 Materials and methods
2.1 Lubricating greases
Two commercially available greases were selected for the investigations, see Table 1. Grease A and B are based on a lithium and polyurea thickener, respectively. Grease A and B are formulated from different mineral base oils. Both greases are NLGI (National Lubricating Grease Institute) class 2 in terms of consistency. As expected, the dropping point of 191 °C of the lithium-based grease (Grease A) is significantly lower than that of the polyurea thickener-based grease, which has a dropping point of 288 °C. Grease aging was carried out up to the dropping point of Grease A.
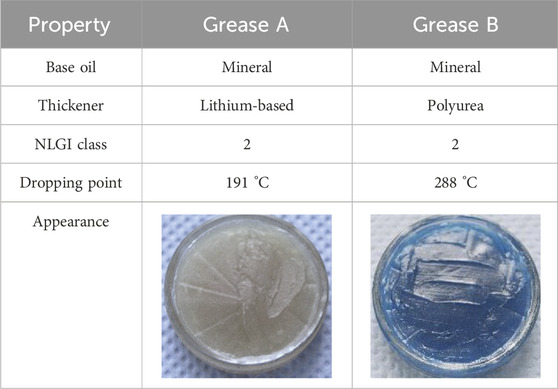
Table 1. Properties of the selected lubricating greases.
2.2 Experimental setup
The original field of application of the standard “Micro Coking Test for Automotive Lubricants” (GFC Lu 27-T-07, 2012) is the evaluation of the thermal stability of lubricating oil towards the formation of coked deposits. In this study, the method was adapted for the characterization of lubricating greases. The original plate with a single large indentation was therefore replaced by an aluminum plate with ten sample pockets each 8 mm wide, 56 mm long and 5 mm deep, with all corners and edges rounded, shown in Figure 1A. The temperature at the various grooves along the plate is depicted in Figure 1B. By sampling after different aging times, the thermo-oxidative stability behavior of lubricating grease was studied as a function of time and temperature. In this work, the temperature varied from 100°C to 190°C, and the aging time was up to 125 days. The upper temperature limit was chosen based on the dropping point of Grease A whereas the lower limit was selected based on experience and temperature limitations of the device.
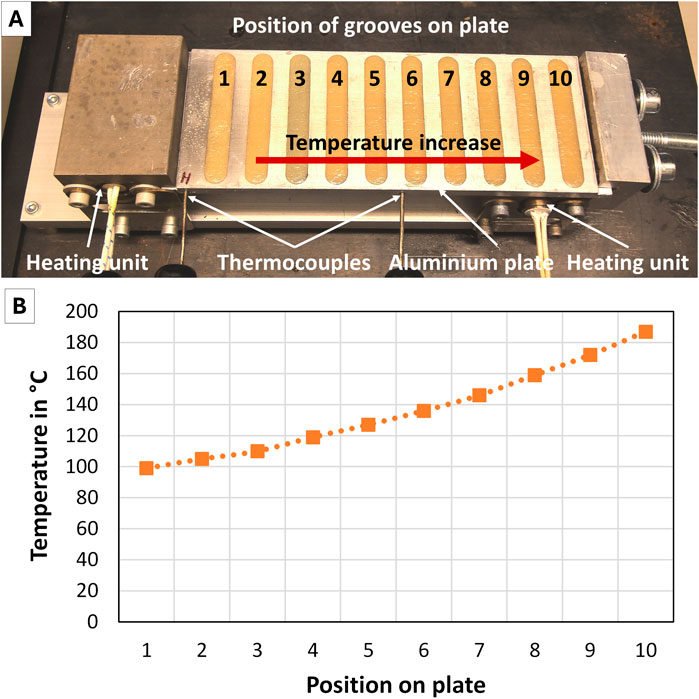
Figure 1. (A) Setup of the modified micro-coking test (MCT) for grease degradation. (B) Temperature profile of the individual positions on the aluminum plate.
To carry out the experiment, grease (about 15 g in total) was placed in the ten sample pockets and weighed to obtain the initial weight of the grease sample. The plate was then heated in a controlled manner for the entire duration of the experiment to ensure the desired temperature profile. The duration was determined in such a way that four grease samples were obtained at each temperature step, distributed over the entire service life of the grease: two samples prior to the induction time and two samples after the induction time. In total, four MCT experiments were carried out for each grease. After each sampling period, the grease sample was removed from the respective groove and stored in a sample container for subsequent analyses, see Section 2.3. The sampling periods ranged from 0.5 to 4 days at the highest temperature of around 190°C and from 16 to 125 days at the lowest experiment temperature of around 100°C.
2.3 Methods for measuring the degree of grease degradation
For the determination of the evaporation loss, the weights of grease samples from the individual grooves after aging were obtained by an analytical balance. It is noted that some grease residues remained in the groove causing small variations in the sampled amount of grease. Pre-evaluation showed that the remaining grease in the grooves was much less than 2% and was therefore defined as negligible.
The concentration of residual antioxidants in the grease samples was determined by gas chromatography coupled with mass spectrometry (GC-MS) to capture these grease components individually. All measurements regarding antioxidants were performed using an instrumental setup composed of a TriPlus autosampler to allow an injection volume of 1 μL, a Trace GC Ultra gas chromatograph for separation and a flame ionization detector (FID) together with a TSQ Quantum XLS mass spectrometer for antioxidant detection, all from Thermo Fisher Scientific (RRID:SCR_008452) (Austin, Texas, USA). Prior to injection, the grease sample was diluted with dichloromethane to a concentration of 7 wt%. For liquid injection, a programmable temperature vaporization injector (PTV) was applied, held at a constant temperature of 300 °C. Helium (He) was used as carrier gas and provided with a constant flow of 2 mL/min. Chromatographic separation of the samples was performed using a medium polar TG-5MS (composed of 5% diphenyl/95% dimethyl polysiloxane stationary phase) capillary column obtained from Thermo Fisher Scientific. The oven temperature program started at 50°C held for 5 min. Subsequently, the oven was heated to 300°C with a 7°C/min temperature ramp, followed by a final isothermal step for 25 min. The transfer line between GC and MS was kept at 250°C and the effluent was ionized by electron impact (EI) ionization (70 eV) at a source temperature of 200°C while the mass analyzer operated in the full scan mode between 40 and 600 mass-to-charge (m/z). For data acquisition and data processing, Thermo Xcalibur (RRID:SCR_014593) v2.0 software including NIST library 2014 was used. The amount of the components dedicated to oxidation inhibition, identified by MS using NIST library, was determined by integrating the specific peaks in the chromatograms (FID signal) while taking the sample concentration in the solvent into account. The antioxidant concentration,
Oxidation of the grease samples obtained from the MCT experiments was determined by applying Fourier-transform infrared spectroscopy (FTIR) with an attenuated total reflectance (ATR) attachment using a Tensor 27 FTIR spectrometer (Bruker, Ettlingen, Germany). Oxidation, denoted as
Acid content of the grease samples, denoted as
Each of the analyses described above was executed twice, and the average values are shown. The deviation between the individual analyses was always significantly below 10%, which were in accordance with the applied standards and therefore considered reasonable.
3 Results and discussion
The following discussion uses Grease A to illustrate the results of the grease analyses. In Section 3.1, the measurement results are discussed. In Section 3.2, the development of the model is discussed for the description of grease degradation by oxidation as a function of temperature, time, and grease type. To reduce the number of figures in this publication, the plots containing the measurement results also show the results of the model simulation.
3.1 Results of grease degradation
As oxidation inhibition is a crucial property of a grease, the focus was put on residual antioxidant content. Figure 2 shows the results for Grease A. The samples obtained from the MCT experiments for each groove of the same temperature zone are displayed in the same color. It can be clearly seen that antioxidant depletion exhibits logarithmic behavior. This will be addressed further in Section 3.2.
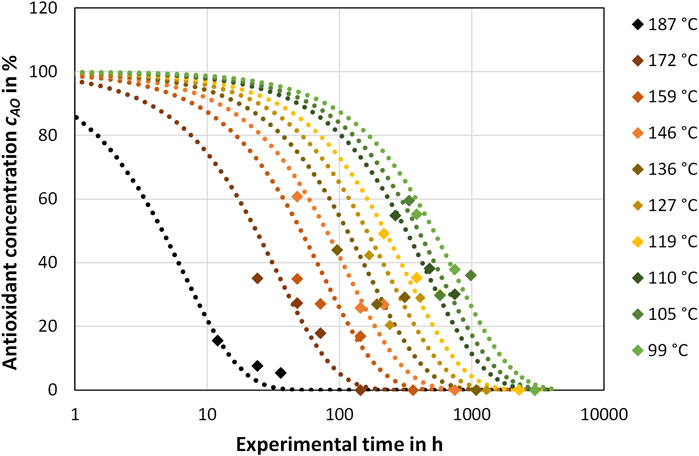
Figure 2. Trend of the antioxidant content
Figure 3 displays the results of the oxidation measurements. Oxidation does not significantly start before the so-called induction time, see Section 1. Oxidation is clearly accelerated by an increasing temperature, see Figure 3A. Figure 3B shows how the acid content, expressed as NN, changes in time for Grease A. Acid content can be well correlated to oxidation. However, during the initial phase, for which the duration is determined by the induction time and no oxidation should take place, a slight decrease in the acid content was observed. The fresh grease apparently also exhibits an initial acid content, most probably caused by additives with acidic moieties. Consumption of these additives in the initial phase explains the slight decrease.
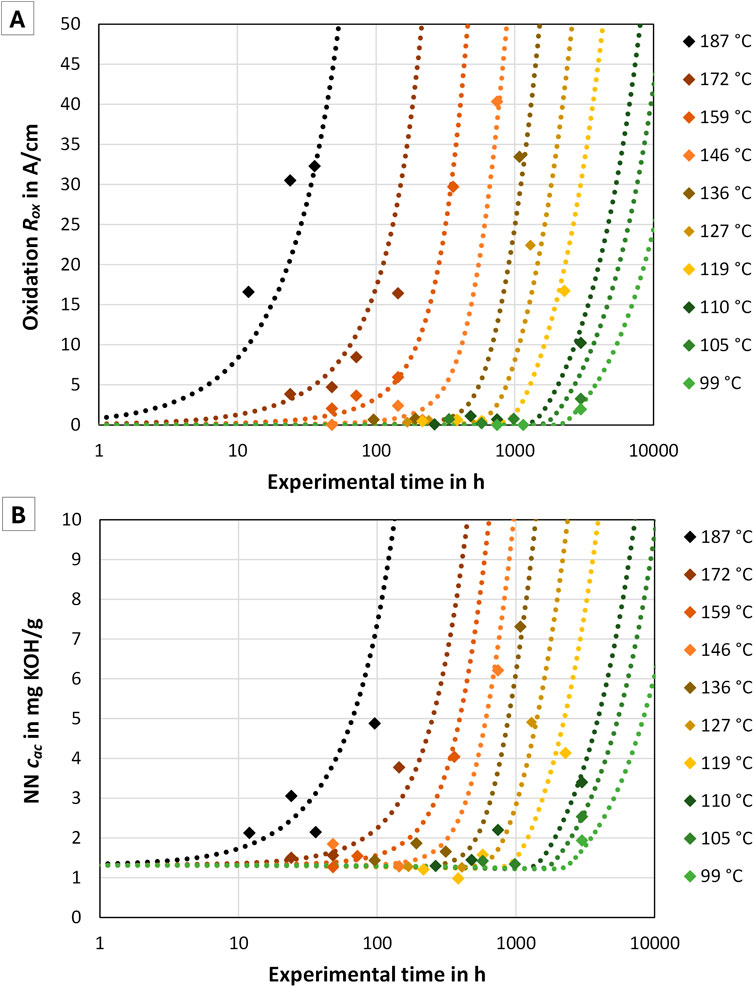
Figure 3. Trend of oxidation
Combining Figures 2 and 3A in Figure 4 reveals that oxidation is only observed after the antioxidant is mostly consumed. This issue will be further addressed in Section 3.2.
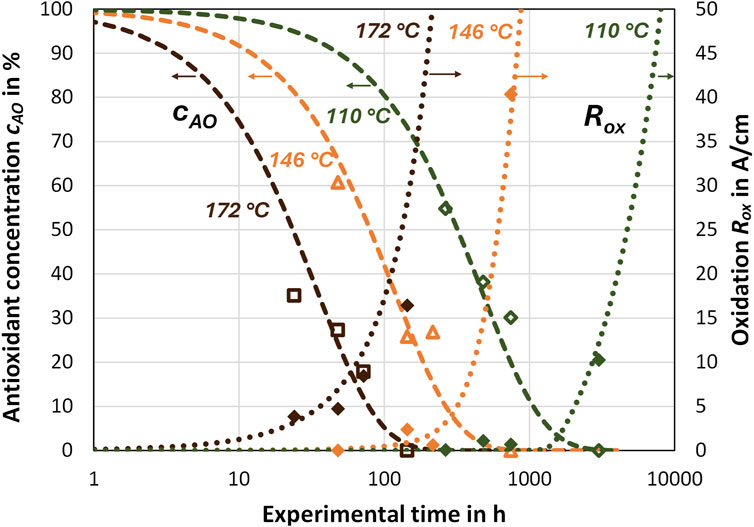
Figure 4. Antioxidant concentration
Figure 5 illustrates the progress of weight loss over time. Like the other parameters, weight loss by evaporation increases with increasing temperature. This figure shows that weight loss by evaporation starts immediately. After a period that corresponds to the oxidation induction time, the weight loss rate increases significantly. This is attributed to the formation of volatile oxidation reaction products. The differentiation between evaporation of original oil components and oxidized reaction products is also reported in oxidation models in the literature (Naidu et al., 1986; Wang et al., 1994; Rezasoltani and Khonsari, 2016).
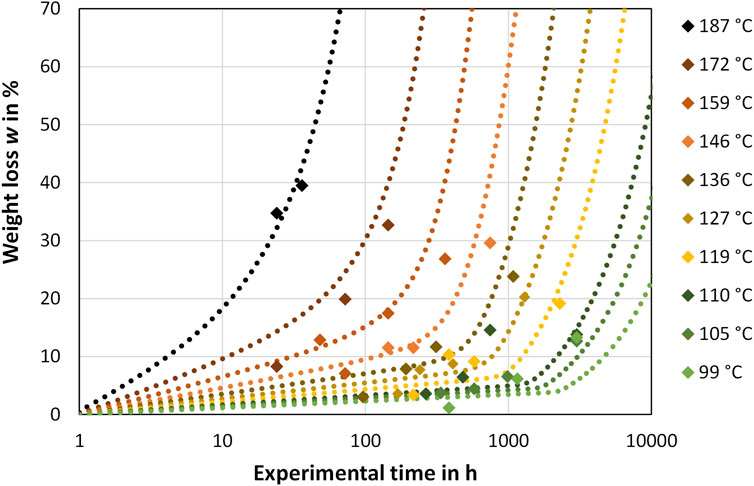
Figure 5. Trend of weight loss
3.2 Grease oxidation model
In this section, a model is set up describing the various degradation processes that determine the mass loss of a grease sample in time. This model was developed based on the observations and results obtained in the performed experiments and complemented by literature, where required.
3.2.1 Antioxidant concentration, oxidation and acid content
Figure 2 showed that the depletion of antioxidant content follows an exponential decay in time, which can be described by Equation 1 with the time constant
This means mathematically that the antioxidants will never be fully depleted. Here, the induction time
By assuming that oxidation does not occur at all during the induction-time period, oxidation can be described with a simple model as given in Equation 3:
where
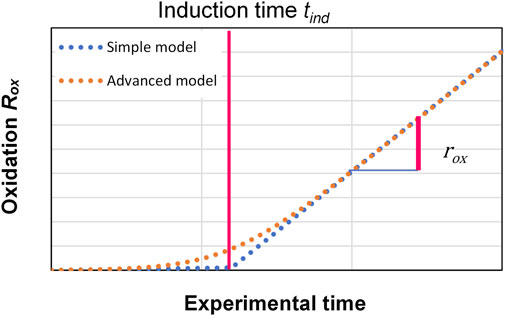
Figure 6. Schematic representation of a simple and advanced model for oxidation
Similar behavior was reported by (Ito et al., 1988; Lugt et al., 2023) who measured the oxidation induction time in bearings. They found a more discrete onset of oxidation (denoted by “simple model” in Figure 6). In our measurements, we find a more continuous, smooth, curve. This is most likely because there are thicker grease layers than those in the raceway of a bearing. This causes a variation of oxygen concentration and reaction along the grease layer due to diffusion of oxygen into the sample and reaction products leaving the sample. For very thin layers or intense mixing, the effect of diffusion is low and therefore a sharp transition between antioxidant depletion and oxidation occurs, which is expressed by zero oxidation until the induction time, then followed by a steady increase of oxidation. In our experiments with relatively thick grease layers, it is more appropriate to assume a smooth transition to account for the time effect of diffusion.
Usually, oxidation can be described by a first-order chemical reaction. In this work, we used an advanced model for the oxidation rate (Equation 4) with A and B as fit parameters.
There was no need to develop a model for the acid content

Figure 7. Correlation between oxidation
3.2.2 Weight loss
The total weight loss
We found a linear relation between the weight loss by oxidation
where
For the model describing the base oil part of the evaporation loss, i.e., evaporation excluding the contribution of volatiles formed by oxidation, an approach as reported in (Fingas, 2014) was used. Fingas showed that the evaporation loss of lubricants is proportional to the logarithm of time t. Consequently, the evaporation loss
Figure 8 shows how the above-mentioned degradation processes contribute to total weight loss in time, i.e., the weight loss due to oxidation
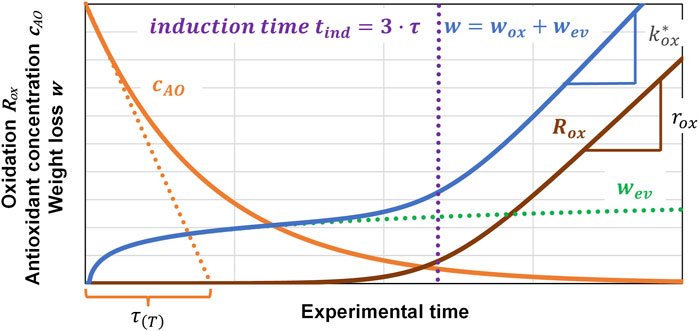
Figure 8. Exemplary trends of oxidation
Initially, the weight loss
Oxidation significantly starts after
3.3 Relevance of the model parameters
The dominating parameter in the model is the oxidation time constant τ, which can be determined from the exponential depletion of the antioxidant content by fitting the measurement points to Equation 1 as can be seen in Figure 2.
Figure 9 shows that the time constant τ exhibits an Arrhenius-type behavior, which is similar to what is observed in grease-lubricated bearings (Lugt, 2023). Grease A is less stable in comparison to Grease B. This finding is consistent with the experience that greases containing polyurea thickener exhibit generally higher oxidation stability than lithium-based greases, for example, reported by (Huang et al., 2016).
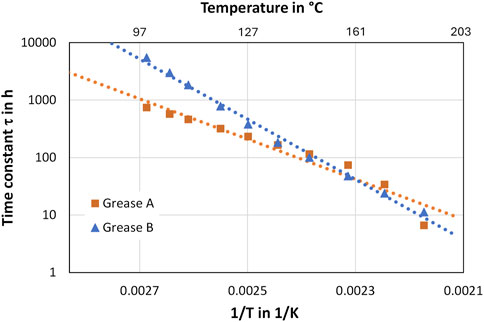
Figure 9. Comparison of time constant
The oxidation rate
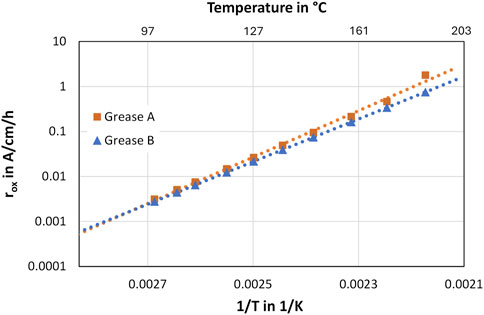
Figure 10. Comparison of oxidation rate
The comparison of the greases according to the evaporation loss based on the parameter
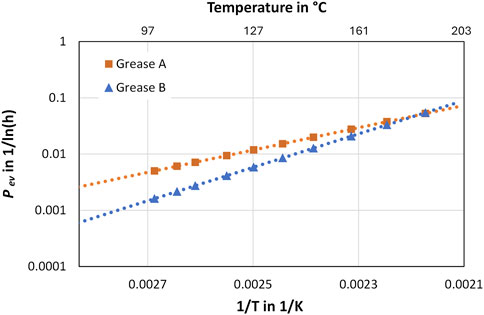
Figure 11. Comparison of parameter
Table 2 shows the values of the remaining parameters of the developed model. These have been used to draw lines in Figures 2–5. As can be seen, these parameters are identical for both greases. It is uncertain if these are universal constants. More greases have to be evaluated to support this assumption.
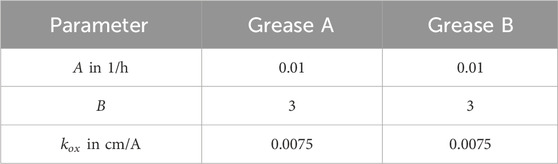
Table 2. Coefficients for the various parameters in the weight loss model.
In terms of accuracy, the root mean square error (RMSE) between experiment and model was calculated by taking into account the deviation between grease analyses in the laboratory and model results at the respective sampling time and temperature. The developed model showed a good agreement to the experiment: For the model of antioxidant concentration, a RMSE of 7% was obtained and for the weight loss model a RMSE of 4%. The oxidation model with an RMSE of 3 A/cm was also qualified as very reasonable.
4 Conclusion
The modified micro-coking test (MCT) was used to age two commercially available greases via a thermal-oxidative degradation mechanism. MCT combined with grease analyses revealed weight loss and oxidation stability versus time and temperature within 125 days. MCT turned out as an efficient tool to generate data from aged greases compared to traditional methods such as aging individual grease samples in petri dishes placed in an oven.
The following conclusions can be drawn regarding thermal-oxidative grease degradation by MCT:
• Conclusions regarding antioxidant content, induction period, and oxidation:
• Oxidation does not take place until the antioxidants have been almost consumed.
• Significant increase in oxidation and acid content was observed after antioxidant depletion referred to as the “induction period”.
• Antioxidant content decrease can be described with a logarithmic behavior determined by the time constant
• Induction period
• Conclusions regarding evaporation loss:
• Weight or evaporation loss is caused by base oil evaporation and by the formation of volatiles due to grease oxidation.
• Evaporation of base oil compounds and volatile oxidation products occurs at different periods during aging.
Grease A is characterized by a higher initial evaporation rate due to the presence of lower molecular weight fractions in the base oil, an effect that was much less pronounced for the polyurea-based Grease B. As to the oxidation stability and known from polyurea-based greases, Grease B exhibited a higher antioxidant depletion time constant
A model was developed to describe thermal-oxidative grease degradation over time, including antioxidant depletion, oxidation, and evaporation loss based on time, temperature, and grease type. The model is suitable to predict grease lifetime based on grease temperature and grease type in view of thermal-oxidative degradation as well as definition of appropriate limits for grease operability.
In this study, only oxidative grease degradation was considered. The contribution of mechanical degradation to the overall grease degradation as well as the changes of tribological behavior due to grease degradation are next steps towards a comprehensive lifetime model of greases. Besides mechanical stress, also the composition of the atmosphere on grease degradation such as humidity, oxygen concentration or gaseous contaminations can be considered to adopt the developed model for special application conditions.
It was demonstrated that within the investigated temperature range of 100°C–190°C, the effect of temperature can be modelled with an Arrhenius approach. Therefore, assuming the same degradation mechanism, the model can be applied to other temperatures. However, if the degradation mechanism changes, this degradation mechanism has to be considered by an extended model.
The findings show that the composition of the grease (base oil, thickener and additives) has a major influence on the thermal-oxidative stability which was considered in the model by grease-specific parameters. Further work could aim at the elaboration of the model’s sensitivity to grease formulation variations resulting in the generation of a database and universal grease parameters depending on the known composition of the grease.
Data availability statement
The original contributions presented are included in the article. Further inquiries can be directed to the corresponding author.
Author contributions
CS: Conceptualization, Formal Analysis, Methodology, Project administration, Writing – original draft. MS: Data curation, Methodology, Resources, Visualization, Writing – review and editing. ND: Funding acquisition, Methodology, Supervision, Writing – review and editing. PL: Methodology, Supervision, Writing – review and editing.
Funding
The author(s) declare that financial support was received for the research and/or publication of this article. This work was supported by the Austrian COMET-Program (K2, program InTribology2, FFG-no. 906860, project coordinator AC2T research GmbH).
Acknowledgments
This work was carried out as part of the COMET Centre InTribology (FFG no. 906860), a project of the “Excellence Centre for Tribology” (AC2T research GmbH). InTribology is funded within the COMET-Competence Centres for Excellent Technologies Programme by the federal ministries BMIMI and BMWET as well as the federal states of Niederösterreich and Vorarlberg based on financial support from the project partners involved. COMET is managed by The Austrian Research Promotion Agency (FFG).
Conflict of interest
The authors declare that the research was conducted in the absence of any commercial or financial relationships that could be construed as a potential conflict of interest.
Generative AI statement
The author(s) declare that no Generative AI was used in the creation of this manuscript.
Publisher’s note
All claims expressed in this article are solely those of the authors and do not necessarily represent those of their affiliated organizations, or those of the publisher, the editors and the reviewers. Any product that may be evaluated in this article, or claim that may be made by its manufacturer, is not guaranteed or endorsed by the publisher.
References
ASTM D942-19 (2019). Standard test method for oxidation stability of lubricating greases by the oxygen pressure vessel method.
Besser, C., Agocs, A., Ronai, B., Ristic, A., Repka, M., Jankes, E., et al. (2019). Generation of engine oils with defined degree of degradation by means of a large scale artificial alteration method. Tribol. Int. 132, 39–49. doi:10.1016/J.TRIBOINT.2018.12.003
Besser, C., Schneidhofer, C., Dörr, N., Novotny-Farkas, F., and Allmaier, G. (2012). Investigation of long-term engine oil performance using lab-based artificial ageing illustrated by the impact of ethanol as fuel component. Tribol. Int. 46, 174–182. doi:10.1016/j.triboint.2011.06.026
Booser, E., and Khonsari, M. (2010). Grease life in ball bearings: the effect of temperatures. Tribol. Lubr. Technol. 66, 36–38+40. Available online at: https://www.stle.org/images/pdf/STLE_ORG/BOK/OM_OA/Lubrication_Fundamentals/Grease%20Life%20in%20Ball%20Bearings_The%20Effect%20of%20Temperatures_tlt%20article_Oct10.pdf.
Cann, P. M., Webster, M. N., Doner, J. P., Wikstrom, V., and Lugt, P. (2007). Grease degradation in R0F bearing tests. Tribol. Trans. 50, 187–197. doi:10.1080/10402000701261003
Cen, H., de Laurentis, N., Bader, N., and Lugt, P. M. (2025). Effect of thermal aging on the grease film thickness in ball bearings. Tribol. Int. 204, 110511. doi:10.1016/j.triboint.2025.110511
Couronne, I., and Vergne, P. (2000). Rheological behavior of greases: Part ii—effect of thermal aging, correlation with physico-chemical changes. Tribol. Trans. 43, 788–794. doi:10.1080/10402000008982409
DIN 51453 (2004). Testing of lubricants - determination of oxidation and nitration of used motor oils - infrared spectrometric method.
DIN 51558 (1979). Testing of mineral oils; determination of the neutralization number, colour-indicator titration.
Dörr, N., Brenner, J., Ristić, A., Ronai, B., Besser, C., Pejaković, V., et al. (2019). Correlation between engine oil degradation, tribochemistry, and tribological behavior with focus on ZDDP deterioration. Tribol. Lett. 67, 62. doi:10.1007/s11249-019-1176-5
Fingas, M. (2014). “Oil and petroleum evaporation,” in Handbook of oil spill science and Technology, 205–223. doi:10.1002/9781118989982.ch7
Frauscher, M., Besser, C., Allmaier, G., and Dörr, N. (2017). Oxidation products of ester-based oils with and without antioxidants identified by stable isotope labelling and mass spectrometry. Appl. Sci. 7, 396. doi:10.3390/app7040396
Huang, L., Guo, D., Cann, P. M., Wan, G. T. Y., and Wen, S. (2016). Thermal oxidation mechanism of polyalphaolefin greases with lithium soap and diurea thickeners: effects of the thickener. Tribol. Trans. 59, 801–809. doi:10.1080/10402004.2015.1106632
Hurley, S., Cann, P. M., and Spikes, H. A. (1998). Thermal degradation of greases and the effect on lubrication performance. Tribol. Ser. 34, 75–83. doi:10.1016/s0167-8922(98)80063-1
Ito, H., Tomaru, M., and Suzuki, T. (1988). Physical and chemical aspects of grease deterioration in sealed ball bearings. Lubr. Eng. 44, 872–879. Available online at: https://api.semanticscholar.org/CorpusID:113442893.
Kassler, A., Pittenauer, E., Doerr, N., and Allmaier, G. (2018). Development of an accelerated artificial ageing method for the characterization of degradation products of antioxidants in lubricants by mass spectrometry. Eur. J. Mass Spectrom. 25, 300–323. doi:10.1177/1469066718811714
Lugt, P. M. (2009). A review on grease lubrication in rolling bearings. Tribol. Trans. 52, 470–480. doi:10.1080/10402000802687940
Lugt, P. M. (2023). On the use of the Arrhenius equation to describe the impact of temperature on grease life. Tribol. Int. 179, 108142. doi:10.1016/j.triboint.2022.108142
Lugt, P. M., Holgerson, M., and Reinholdsson, F. (2023). Impact of oxidation on grease life in rolling bearings. Tribol. Int. 188, 108785. doi:10.1016/j.triboint.2023.108785
Naidu, S., Klaus, E., and Duda, J. (1986). Kinetic model for high-temperature oxidation of lubricants. Industrial & Eng. Chem. Prod. Res. Dev. 25, 596–603. doi:10.1021/i300024a601
Rezasoltani, A., and Khonsari, M. M. (2016). On monitoring physical and chemical degradation and life estimation models for lubricating greases. Lubricants 4, 34. doi:10.3390/lubricants4030034
Rhee, I.-S. (2001). Development of a new oxidation stability test method for lubricating oils using a pressure differential scanning calorimeter (PDSC). NLGI Spokesm. 65, 16–23.
Rohrbach, P., Hamblin, P. C., and Ribeaud, M. (2005). Benefits of antioxidants in lubricants and greases assessed by pressurised differential scanning calorimetry. Tribotest 11, 233–246. doi:10.1002/tt.3020110306
Schneidhofer, C., Dubek, K., and Dörr, N. (2023). “Robust sensors enabling condition-based maintenance of lubricated components in locomotives and wagons,” in Transportation research procedia (Elsevier B.V.), 3236–3243. doi:10.1016/j.trpro.2023.11.866
Schneidhofer, C., Grafl, A., and Adam, K. (2018). Online Zustandsüberwachung von Hydraulikölen in der Stahlindustrie. BHM Berg- Hüttenmännische Monatsh. 163, 193–198. doi:10.1007/s00501-018-0707-y
Smook, L. A., Sathwik, S. C., and Lugt, P. M. (2022). Evaluating the oxidation properties of lubricants via non-isothermal thermogravimetric analysis: estimating induction times and oxidation stability. Tribol. Int. 171, 107569. doi:10.1016/J.TRIBOINT.2022.107569
Wang, C. C., Duda, J. L., and Klaus, E. E. (1994). A kinetic model of lubricant deposit formation under thin film conditions. Tribol. Trans. 37, 168–174. doi:10.1080/10402009408983280
Nomenclature
A fit parameter in 1/h
B fit parameter
Keywords: grease degradation, field-to-lab, oxidation, lifetime model, antioxidant content, evaporation
Citation: Schneidhofer C, Schandl M, Dörr N and Lugt PM (2025) A model describing the oxidation rate of lubricating greases. Front. Mech. Eng. 11:1591795. doi: 10.3389/fmech.2025.1591795
Received: 11 March 2025; Accepted: 07 May 2025;
Published: 06 June 2025.
Edited by:
Jens Kondratiuk, Hilti, LiechtensteinReviewed by:
Milan Bukvic, University of Kragujevac, SerbiaDeepika Shekhawat, Malaviya National Institute of Technology, India
Copyright © 2025 Schneidhofer, Schandl, Dörr and Lugt. This is an open-access article distributed under the terms of the Creative Commons Attribution License (CC BY). The use, distribution or reproduction in other forums is permitted, provided the original author(s) and the copyright owner(s) are credited and that the original publication in this journal is cited, in accordance with accepted academic practice. No use, distribution or reproduction is permitted which does not comply with these terms.
*Correspondence: Christoph Schneidhofer, Y2hyaXN0b3BoLnNjaG5laWRob2ZlckBhYzJ0LmF0