 Haarika Manda1,2†
 Liang Zhao1†Rahul Reddy Kancharla1Xianghui Xiao3Charith Purushotham1,4Yalei Tang1Peng Xu1
 Tiankai Yao1*
 Fei Xu1‡*
- 1Idaho National Laboratory, Materials and Fuels Complex, Idaho Falls, ID, United States
- 2University of California Santa Barbara, Computer Science, Santa Barbara, CA, United States
- 3Brookhaven National Laboratory, National Synchrotron Light Source II, Upton, MA, United States
- 4University of Colorado Boulder, Computer Science, Boulder, CO, United States
Uranium dioxide (UO2), widely used as driver fuel in light water reactors, experiences microstructure and property change by nuclear fission reactions. This paper bridges the characterization of fresh UO2 fuel at different length scales, serving as a baseline for future post irradiation examination of irradiated UO2 fuel. To characterize the microstructural change of nuclear fuel, modern approaches cover a wide range of length scales through different characterization techniques, such as mm scale for Synchrotron-based X-ray computed tomography (SXCT) and microscale for focused ion beam (FIB) and scanning electron microscopy (SEM). It is challenging to bridge the data and knowledge of the same sample in different length scales. This paper proposed a deep learning framework leveraging transfer learning to detect microstructural defects, trained from a sparse FIB, SEM, and SXCT images. The proposed model achieved superior performance in defect segmentation on multiscale microscopic data compared to four of the latest deep learning models.
1 Introduction
Uranium dioxide (UO2) fuel (Zinkle and Was, 2013) is widely used in light water reactors due to its high stability, outstanding corrosion resistance, and acceptable thermal conductivity. Nuclear fission reactions generate thermal spikes and collision cascades in UO2 fuel matrix, leading to significant defect production, microstructure, and property change.
Although UO2 fuel has been studied in the past several decades (Lyons et al., 1972; Gong et al., 2019; Miao et al., 2018), quantifying fuel defects remains challenging due to the lack of method to bridge characterization results from different length scale (Porter and Crawford, 2022; Crawford et al., 2007; Carmack et al., 2009). Fuel defects are critically affecting fuel performance. For example, gaseous fission products from nuclear fission reactions tend to form gas bubbles and coalesces to pore and form cracks of various shapes and sizes within the nuclear fuel. The behavior of these fission gas pores and cracks dictates fuel performance through gas release, grain growth, swelling, and fuel cladding interaction (Mariani et al., 2011; Di Lemma et al., 2022; Keiser, 2019). Defect migration and their movements are critical as they can lead to deterioration of the fuel’s mechanical properties. Additionally, lanthanide particles or nodules are often located around the periphery of pores (Mariani et al., 2011; Keiser, 2019). Understanding the distribution changes of pores and cracks in the cross-section of UO2 fuel provides valuable insights into these phenomena. Accurate defect detection allows for trustworthy morphological distribution changes of pores and cracks along the thermal gradient from the hot fuel region to the cold cladding rim, providing an understanding of defect variation and movements.
The evolution of UO2 nuclear fuel involves microstructure transformation, phase redistribution, and thermal property degradation in the fuel phase, along with embrittlement, hardening, and corrosion of the cladding and encapsulating materials during irradiation (Carmack et al., 2009), (Aitkaliyeva, 2022), (Cassagne et al., 2021). These interconnected phenomena form a complex multi-factor problem, making it difficult for conventional fuel models to accurately predict fuel behavior from estimated burnup and cladding temperature (Greenquist and Powers, 2021), (Hirschhorn et al., 2022). Advanced post-irradiation examination (PIE) technologies provide qualitative understanding of the irradiation behavior of UO2 fuel. Data collected from different instruments may vary in image types and microscopic length scales, resulting in large variances in the appearance of defects in micrographs. As illustrated in Figure 1, image patches appear in different formats, such as scanning electron microscopy (SEM) from focused ion beam (FIB), transmission electron microscopy (TEM), and synchrotron-based X-ray computed tomography (SXCT) (Böhm et al., 2019). SXCT images have better resolution than SEM in a non-destructive manner, visualizing microstructure features and defects in more detailed spatial structures.
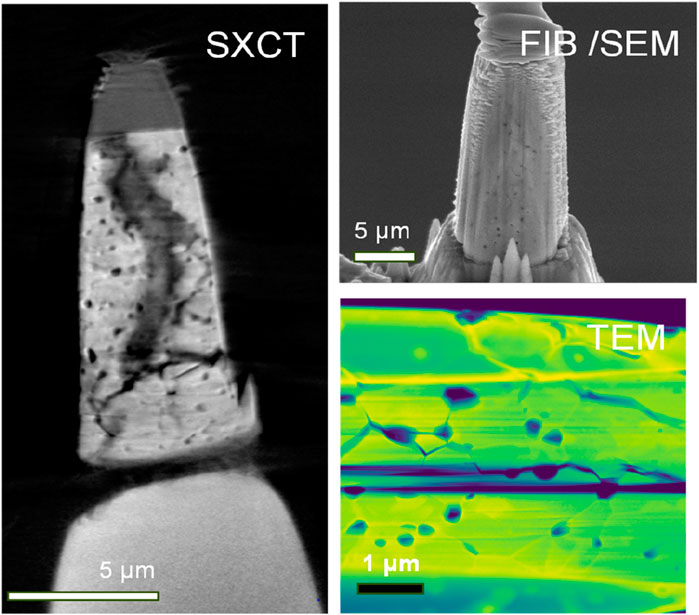
Figure 1. Image cross-sections of UO2 fuel captured from different instruments with varying spatial resolutions.
Although SXCT provides better resolution for visualizing defects, a major challenge is quantitatively extracting defect information especially in the presence of high-Z materials, such as Uranium (U), which leads to increased X-ray absorption, beam hardening, and scattering. The beam hardening and scattering of the X-rays is so strong that it leads to severe photon starvation. This photon starvation introduces artifacts which can be seen as streaks in the reconstructed volume, see Figure 2. Historically, characterization of defects in irradiated nuclear fuel relied on traditional image segmentation techniques, such as image thresholding (Otsu, 1975). The significant morphological variance, color, and texture differences in the images, making accurate defect segmentation challenging with traditional approaches, see Figure 3c.
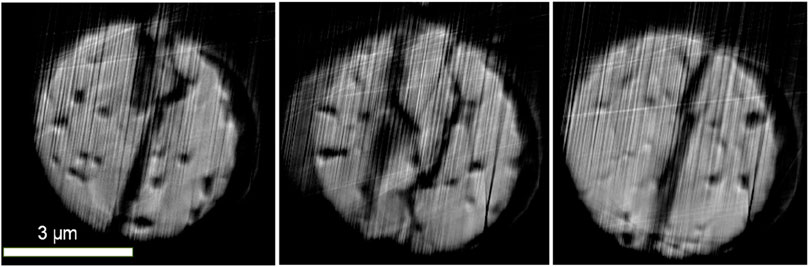
Figure 2. Axial cross-sections of the UO2 fuel from SXCT reconstructed volume showing the streak artifacts due to photon starvation.
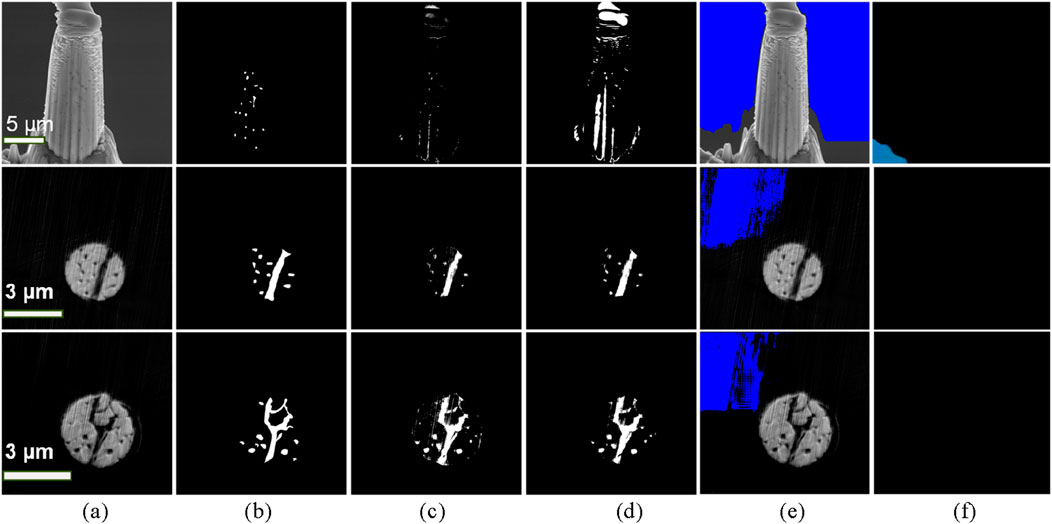
Figure 3. (a) Reconstructed Images from SXCT (b) The ground truth for the training phase (c) Segmented noisy image using image thresholding (Schneider et al., 2012) (d) Segmented images using the retrained DL model (Wang et al., 2023) (e) Prediction and overlay with original images from original SAM model (Kirillov et al., 2023) (f) Prediction from original Micro_sam model (Archit et al., 2025).
Machine learning (ML) algorithms (Cai et al., 2022)outperformed traditional approaches in terms of reliability and accuracy on material images (Cai et al., 2022; Morgan et al., 2022; Shen et al., 2021; Li et al., 2018), (Song et al., 2020; Sun et al., 2023; Huang et al., 2017; Shen et al., 2021; Wang et al., 2023; Kirillov et al., 2023; Archit et al., 2025; Abebe et al., 2025; Van Opbroek et al., 2014), natural images (Minaee et al., 2021), (He et al., 2019), and biomedical images (Tajbakhsh et al., 2020). For instance, Cai et al. used a decision tree model to classify the bubbles into different categories in U-10Zr fuels (Cai et al., 2022). However, this hybrid framework failed to separate pores very well, with the introduction of streak artifacts, leading to incorrect calculations of physical properties like size, shape, and orientation. More recently, convolutional neural networks (CNNs) have shown tremendous performance and robustness in segmenting both natural and microscopy images (Morgan et al., 2022; Huang et al., 2017; Shen et al., 2021). Wang et al. utilized a dense CNN architecture, combined with ResNet-50 and U-Net, for pore characterization on U-10Zr fuel (Wang et al., 2023). However, this method still came short, segmented defects on fuel cross-sections remain challenging due to inherent variations in the images using existing methods, as can be seen in Figure 3. These ML based models also depend on the amount of annotated data received. Advanced experimental characterization tools provide high-resolution images but lack sufficient annotated data. Furthermore, no existing models handle multiscale instrumental data for the same sample. Recently, segmenting anything model serial models (Archit et al., 2025)- (Schneider et al., 2012)were proposed to tackle real-time segmentation for natural images and microscopy images. The Segment Anything Model (SAM) is a state-of-the-art model designed to perform image segmentation tasks (Kirillov et al., 2023). SAM excels in generalizing across various types of images and can segment objects with minimal user input. It is particularly useful for applications where precise segmentation is required but annotated data is scarce. SAM’s architecture is typically based on advanced CNNs and incorporates attention mechanisms to enhance its ability to focus on relevant parts of the image. The SAI_I_AM model (Segmentation and Annotation Integration for Multiscale Instrumental Analysis and Modeling) is an innovative framework designed to integrate segmentation and annotation tasks across multiple scales of instrumental data (Archit et al., 2025). This model addresses the challenge of handling multiscale data by combining insights from different imaging modalities and scales. The Micro_sam model is a specialized version of SAM, tailored for microscopic images (Abebe et al., 2025). This model is optimized to handle the unique characteristics of microscopic data, such as high resolution and intricate details. Micro_sam leverages transfer learning from models trained in natural images and fine-tunes them on microscopic datasets. This approach enhances its performance by segmenting complex structures found in biomedical and material science images. Although SAM and Micro_sam models were proposed for multiscale microscopy images and handle the interesting region detections and relatively large object detections, they still cannot detect small defects in our cases, as Figures 3e,f.
To leverage existing deep learning models for small object detection, like pore detection (Sun et al., 2023)on SEM and SXCT images, we utilized a transfer learning strategy to efficiently detect defects from a small training set combined with limited labeled SEM and SXCT images. The transfer learning strategy helps to train the deep learning model from already available larger training data originating from a different source, which are somewhat similar, but not exactly representative of the target data (Wang et al., 2023).The proposed workflow includes the following major components, as shown in Figure 4 1) preparing data, including reconstructing SXCT slices using the existing SIRT algorithm (Gilbert, 1972) and labeling limited images for transfer learning; 2) designing and evaluating the proposed model; 3) utilizing the proposed model on unseen SXCT and FIB data. The proposed model adopts a base model (Wang et al., 2023) which is a fully convolutional deep neural network containing encoder-decoder architecture for accurate pore segmentation on U-Zr metal fuel SEM images and is fine-tuned using new labeled images to accomplish instance segmentation of defects on UO2 fuel. With limited annotated data, the method achieves the best performance compared to the other models on the new UO2 multiscale dataset. In the following sections, we will outline the major advancements of our work: first, the data collection and reconstruction methodology to obtain clean and high-quality SXCT data for extracting further insights; and subsequently, the process behind selecting a suitable model for segmenting defects and cracks in the SXCT data by utilizing the transfer learning capabilities of machine learning models.
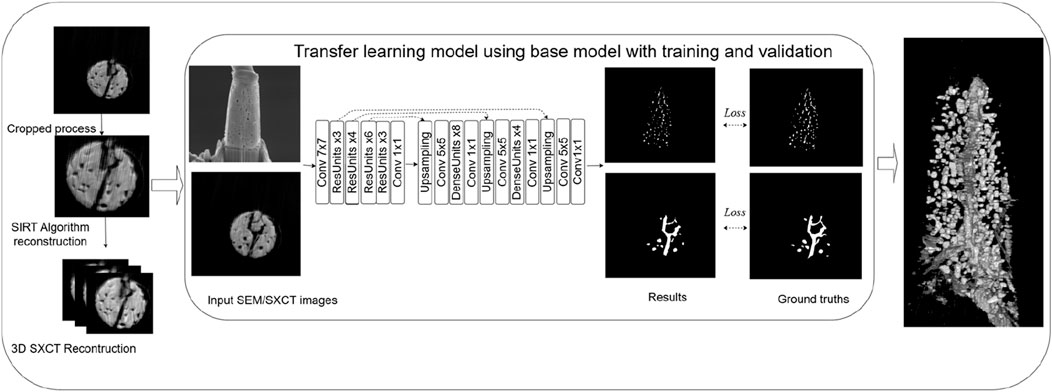
Figure 4. Pipeline for the proposed framework.
2 Materials and methods
2.1 Experimental data
The material analyzed in this study was fresh uranium dioxide (UO2). SEM images on the material with sized 5.91 μm × 1.7 μm × 13.85 μm were collected at 8000x magnification using backscattered electrons (BSE) with a Helios NanoLab G3 Dual Beam Plasma FIB instrument at the Irradiated Material Characterization Laboratory (IMCL). A total of 67 sectioning SEM images were obtained with a resolution of 0.183 μm/pixel. Each SEM image was 1024 × 1512 pixels with a resolution of 0.015 μm/pixel. Some images from the sectioning sequence are shown in Figure 5. The XCT data was collected using the synchrotron source with a rotation speed of 6°/sec and an overall angular range of 200° from Brookhaven National Laboratory (BNL). The raw SXCT data consisted of 638 projections across 200 degrees of rotation, taken at a speed of 3°/sec with a 0.1-s exposure time. Exactly 24 slices of the 638 sample projections were omitted due to obstructions to the sample. The UO2 tip with dimensions 5.198 μm × 5.176 μm × 21.522 μm was scanned where a spatial resolution of 0.0215 μm/pixel was achieved. XCT provided volumetric data with each tip reconstructed consisting of 2160 2D slices showing the cross-sectional view along the z-axis, a 2D cross-sectional slice along axial view can be seen in Figure 6a. To efficiently reconstruct the data, we removed irrelevant areas with respect to the viewfinder of the Synchrotron and cropped the SXCT data from 2560 × 2560 pixels to 540 × 540 pixels to match the sample size, as shown in Figure 6b. Additionally, we utilized the SIRT algorithm for 300 iterations to remove multiple streak artifacts from the projection data, resulting in a cleaner reconstruction, as shown in Figure 6c. After reconstruction, we obtained 2160 slices of the UO2 samples. The 3D structural view is illustrated in Figure 6d.
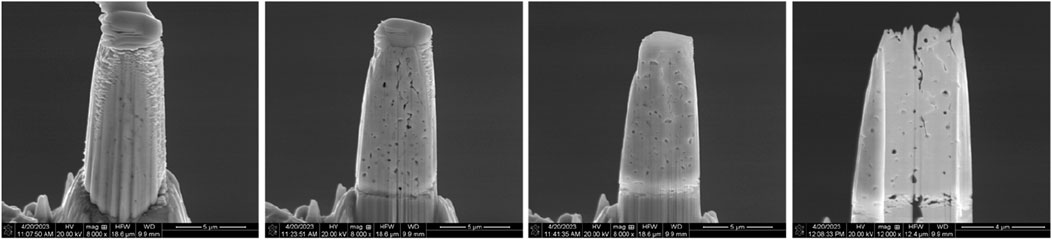
Figure 5. SEM images from sectioning sequence.
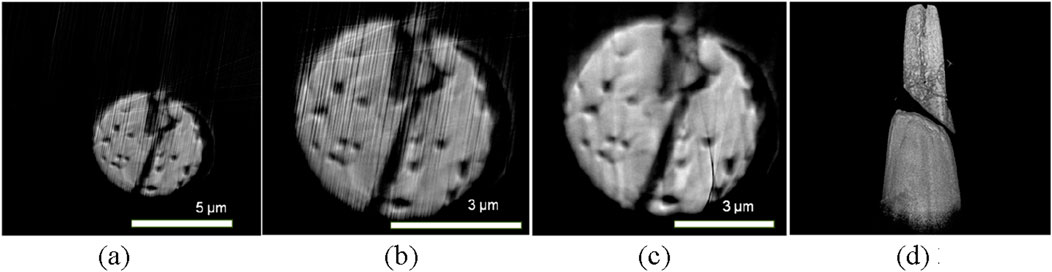
Figure 6. SXCT image preprocessing. (a) original SXCT image (b) cropped image (c) removed noise (d) 3D reconstructed.
2.2 Methods
Given the lack of ground truth/labeled data for the SXCT and FIB SEM data identifying the defects (i.e., the cracks and pores) at different scales, it was challenging to train a model from scratch. Under these circumstances, we decided to leverage the inherent transfer learning capabilities of machine learning models on the new generated dataset. Fine-tuning is a specific type of transfer learning involving retraining some or all of a pre-trained model’s layers to better suit a new task with limited labeled data. More details for each component of the proposed framework are provided as follows.
2.2.1 Data preparation
To label necessary training images, we used a click-based interactive segmentation model (Sun et al., 2024) which extracts the object of interest by integrating the users’ inputs of background and foreground. 17 SEM images and two SXCT images of the studied sample were labeled as shown in Figure 3b. After collecting all the images of 17 of the FIB Images together with the two SXCT images label pairs, we opt to apply the patch-based approach where each of the 540 × 530 images are divided into patches of 270 × 270 pixels in addition to applying augmentation techniques, such as Gaussian blur, median blur, brightness, contrast, vertical flip, horizontal flip and center crop. These augmentation techniques allowed us to increase the size of the dataset without requiring extra expert annotated labels. After applying augmentation and patch-based splitting, we were left with 3,884 unique image labels pairs for training with 1,020 image patches used for validation after every epoch.
2.2.2 Model development
Wang et al. proposed an encoder-decoder-based deep fully convolutional network to segment pores accurately from different resolution scale SEM images and demonstrated the model’s performance with sufficient comparison experiments (Wang et al., 2023). We adopted the model and fine-tuned it with new labeled images. The model architecture is shown in Figure 7. The learning objective of the model was to segment out the defects such as the cracks and pores in the material from the unaffected area. Therefore, we opted to utilize the summation of the Binary Cross Entropy Loss (BCE) as well as the Dice Score of the corresponding image, annotation pair for a robust dual loss strategy.
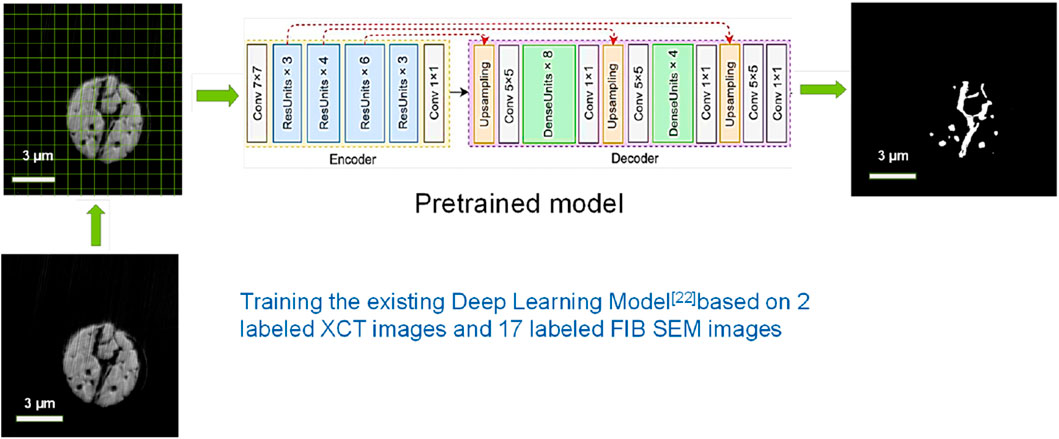
Figure 7. Complete end-to-end pipeline of the Model.
2.2.3 Training setup
The experiments were conducted on Nvidia RTX 3090 GPUs, with the primary software environment being CUDA 11.8 and Python 3.8. The deep learning framework used was PyTorch, version 1.13.0. We trained the model for exactly 100 epochs with a learning rate of 10−4 and a weight decay of 10−6 for the Adams optimizer.
2.2.4 Post-processing
After receiving the output probabilities from the model, we applied morphological operations such as binary filling operation to fill out any pores that might not have been classified correctly but were surrounded by a border of positive pixels. In addition to some other operations to remove any noise from the generated image, we evaluated the fidelity of this generated result with the original ground truth mask for each patch. In the case where we needed to evaluate the model, we simply split the image for inference into patches of the same size as mentioned earlier and performed inference on each of the individual patches. After performing inference, the patches were combined in the end for evaluation using parameters that will be detailed in the following sections.
3 Results
3.1 Dataset and evaluation metrics
We evaluated the performance of our model on the test dataset of corresponding images and label pairs. Additionally, we opted to use pixel level evaluation metrics in the form of Precision, Recall, F1 score and intersection over union (IoU). Mathematically they are defined using the equations below.
Here TP, FP and FN represent the raw pixel numbers for True Positive, False Positive and False negative. Precision is the total percentage of pixels that were correctly classified in relation to the binary mask. While recall shows the percentage of pixels that were correctly segmented out as pores or cracks in comparison to the total number of annotated defects. Finally, F1-score represents a harmonic mean between precision and recall and is used to relay the overall predictive performance of the model and the higher score indicates the model’s performance was better. IoU is a metric used to evaluate the accuracy of an object detection model. It measures the overlap between the predicted bounding box and the ground truth bounding box. The higher value indicates the better performance.
Due to the small scale of our dataset, we evaluated our model using the leave-one-out cross validation (LOOCV) technique to use a size-able amount of our dataset for the purpose of training and validation of our model. In this study, LOOCV splits the images as 18 images for training and leaving one image for test. We conducted LOOCV for each image as test image and used the average performance as the evaluation as shown in Table 1.
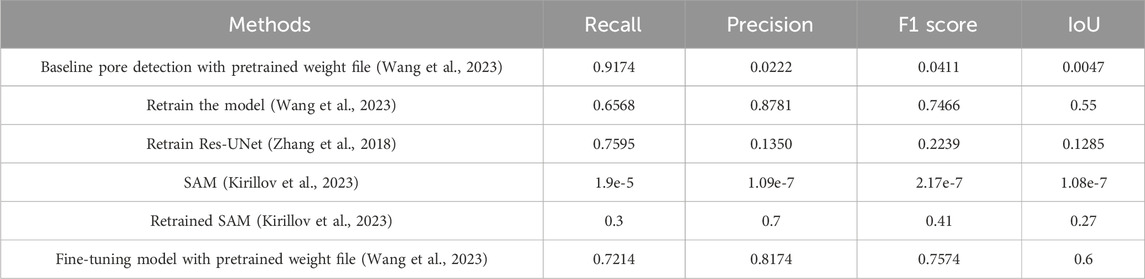
Table 1. Comparison performance.
3.2 Performance comparison
In this study, we utilized the existing source codes for the models listed in Table 1. Initially, we applied the original SAM model to the new dataset, which yielded very poor results. Subsequently, we retrained the SAM model by using a single bounding box encompassing the entire pore region, but the model’s performance was still poor. To enhance the model’s accuracy, we adopted a multiple bounding box technique for retraining. In this approach, we generated individual bounding boxes for each pore based on the mask using the connectedComponentsWithStats method from the OpenCV package. This method performs connected component analysis on a binary image and provides statistics for each detected component (Bradski, 2000). The resulting bounding boxes were then individually fed into the model for training. The retrained model’s performance was significantly better than the original SAM model.
The performance of various models for defect segmentation in UO2 fuel was evaluated using recall, precision, and F1 score metrics, as summarized in Table 1. The baseline pore detection model with a pretrained weight file (Wang et al., 2023)exhibited a high recall of 0.9174 but suffered from extremely low precision (0.0222), and F1 score (0.0411). indicating a high rate of false positives. Retraining the model (Wang et al., 2023)from scratch using the labeled 17 FIB images and two SXCT images significantly improved its performance, achieving a recall of 0.6568, precision of 0.8781, and an F1 score of 0.7466, reflecting a more balanced and accurate detection. Conversely, retraining the Res-UNet model (Zhang et al., 2018) from scratch resulted in poor performance, with a recall of 0.0156, precision of 0.4518, and an F1 score of 0.0299, highlighting its ineffectiveness in this context. The latest SAM serial models which achieved great performance on natural images cannot perform well in the study. One of the major reasons is that the SAM models are designed for relatively large object detection with high image quality. The proposed fine-tuning the model (Wang et al., 2023) with pretrained weight file demonstrated the best overall performance, with a recall of 0.7214, precision of 0.8174, and an F1 score of 0.7574. This approach effectively balanced the trade-off between recall and precision, resulting in the most accurate and reliable defect segmentation.
Regarding IoU metrics, which highlight the importance of accurate localization in object detection tasks, all the models are not achieving high values. Poor IoU performance can often be traced back to issues such as inaccurate boundary prediction, lower image quality, or inadequate training data. In our dataset, the defects on the images are now showing clear boundaries which may cause the ground truth and detected results cannot overlap well. Moreover, the FIB SEM data were collected under lower magnification and many defects, like weak cracks, can be captured by human labeling, but are challenging for the model to precisely localize the defects. Fine-tuning and retraining models with representative and high-quality datasets can significantly enhance detection accuracy and improve IoU scores.
3.3 Overall performance
The overall results from performing leave-one-out cross validation can be seen in Table 2 based on the transfer learning with fine-tuning model. We found that the overall F1-score for the entire dataset was 0.76 with diverging results between the FIB and SXCT Images. The latter had a higher F1 score, precision, recall of 0.83, 0.91 and 0.76 in comparison to the results exhibited on the FIB Images. This can be explained through the difference in both the resolution and the size of the defects in the two different types of microscopic images. When focusing on Figure 8, which shows a comparison of the ground truth and the model prediction for the FIB images, the model’s prediction missed some of the very faint cracks and pores due to the similarity with the background. Furthermore, we can argue that these defects were barely visible to the human eye making it extremely difficult for the model to segment them as shown by the overall lower metrics as compared to SXCT. On the other hand, when looking at the SXCT slices in Figure 8, we can see that we had a much closer field of view of the same defect, i.e., cracks and pores. There was also a clearer demarcation between the material and the defects through a distinct color difference. Henceforth we observed a significant improvement in the evaluation metrics.
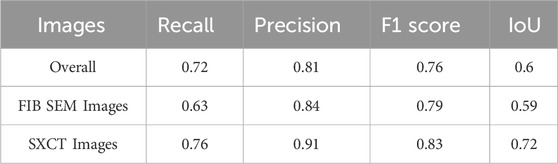
Table 2. Evaluation metrics for FIB and SXCT images using the proposed method.
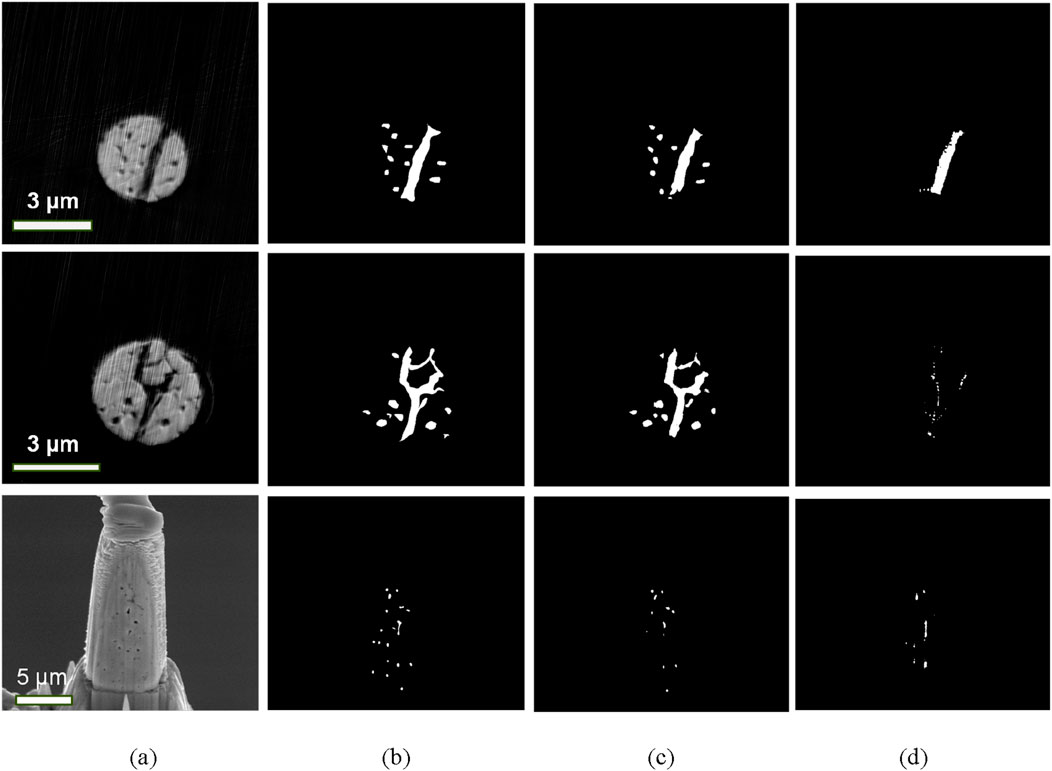
Figure 8. Visual prediction results. (a) Input images. (b) Ground truths. (c) Prediction of the proposed method. (d) Prediction from retrained SAM model.
3.4 Visualizing the uranium dioxide defects in the 3D space
After completing the model training, we performed inference using our trained model on all 2,160 SXCT (Synchrotron X-ray Computed Tomography) images and unseen FIB (Focused Ion Beam) sectioning SEM (Scanning Electron Microscope) images. Given that a majority of the images consisted of either the base holder of the sample or the top of the sample which had no defects, we opted to remove those slices in the beginning and the end for a clear visualization of the 3D model structure after stacking them. To achieve a clear and accurate 3D representation of the uranium dioxide defects, we first preprocessed the images by removing any unnecessary sections that did not contribute to the defect analysis. This preprocessing step ensured that the final 3D visualization focused solely on the regions of interest, thus providing a more precise view of the defect distribution within the sample.
The visualization of the SXCT results is shown on Figure 9. This figure illustrates the 3D reconstruction of the uranium dioxide defects, allowing us to observe the spatial distribution and morphology of the defects (pores and cracks) within the sample. The reconstructed 3D model highlights the intricate details of the defects, providing valuable insights into their characteristics and potential impact on the material’s properties. Figure 10 shows the results of the FIB SEM images. These images offer a complementary perspective by providing high-resolution, localized views of the defects. The combination of SXCT and FIB SEM images enhances our understanding of the defects by integrating both macroscopic and microscopic details. This dual approach enables a comprehensive analysis of the defect structures, facilitating better-informed decisions for further research and material optimization.
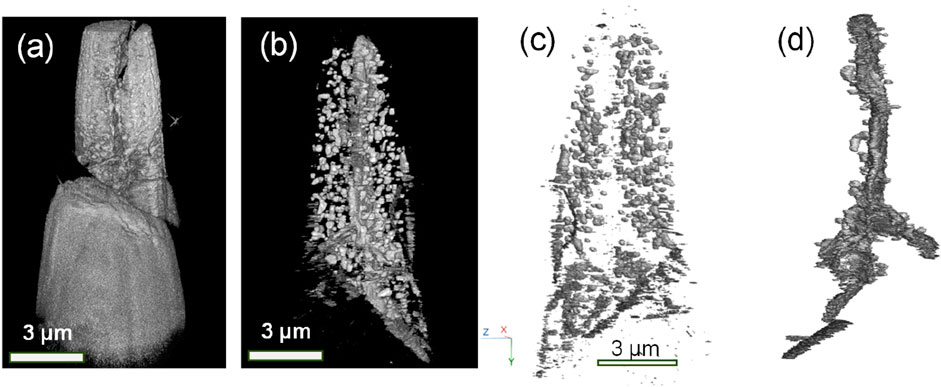
Figure 9. (a) 3D Representation of UO2 sample (b) 3D Representation of the defects in the top portion of a UO2 sample in (a, c) Pores’ 3D structure of the sample (d) Crack structure of the sample.
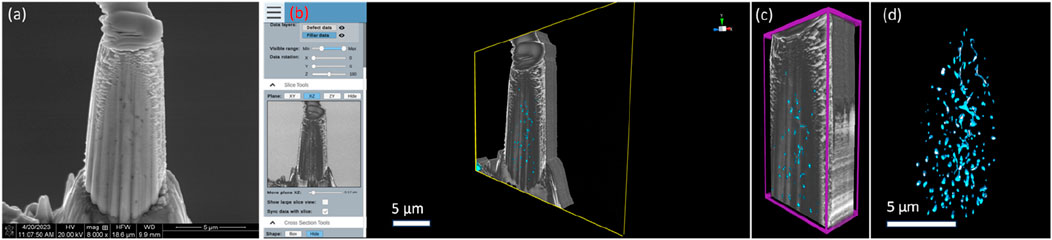
Figure 10. (a) Raw single FIB SEM image; (b) The software interface with loading 3D Quanta FIB SEM image of UO2 material; (c) Selecting Region of Interest with overlay of defects in 3D view; (d) 3D structure view of defects.
In summary, the 3D visualization of uranium dioxide defects, achieved through careful preprocessing and the integration of SXCT and FIB SEM images, provides a detailed and informative representation of the defect landscape. This visualization serves as a crucial tool for researchers at Idaho National Laboratory, aiding in the advancement of nuclear material science and engineering.
4 Discussion and conclusion
In this study, we proposed a deep learning framework utilizing transfer learning to effectively detect and segment microstructural defects in fresh uranium dioxide (UO2) nuclear fuel. Our approach leveraged high-resolution SXCT and FIB SEM images, overcoming the challenges posed by noise, artifacts, and the limited availability of annotated data. We arguably achieved utilizing transfer learning for segmentation using a diverse and multimodal microscopic image dataset. Our model significantly outperformed baseline and retrained models in terms of recall, precision, and F1 score. Specifically, the transfer learning method achieved the highest F1 score of ∼0.76, indicating a balanced defect detection capability and accuracy. Our future work will bridge multiscale instrumental data, such as FIB SEM, XCT/SXCT, TEM, to gain comprehensive understanding of materials’ microstructure change and defect evolution from irradiation.
Data availability statement
The raw data supporting the conclusions of this article will be made available by the authors, without undue reservation.
Author contributions
HM: Validation, Methodology, Investigation, Writing – original draft, Visualization, Formal Analysis. LZ: Writing – original draft, Formal Analysis, Methodology, Validation. RR: Writing – review and editing, Formal Analysis, Methodology, Visualization, Validation. XX: Data curation, Visualization, Resources, Writing – review and editing. CP: Methodology, Validation, Investigation, Writing – review and editing, Visualization, Formal Analysis. YT: Data curation, Investigation, Visualization, Resources, Writing – review and editing. PX: Visualization, Funding acquisition, Validation, Investigation, Writing – review and editing. TY: Conceptualization, Resources, Investigation, Data curation, Supervision, Writing – review and editing. FX: Methodology, Data curation, Visualization, Supervision, Investigation, Funding acquisition, Resources, Conceptualization, Writing – review and editing, Project administration, Writing – original draft.
Funding
The author(s) declare that financial support was received for the research and/or publication of this article. This work was supported by the U.S. Department of Energy, Office of Nuclear Energy under DOE Idaho Operations Office Contract DE-AC07-05ID14517 (LDRD project of 24A1081-149FP and Advanced Fuel Campaign SiC Crosscut R&D program). This research used resources FXI/18ID of the National Synchrotron Light Source II, a U.S. Department of Energy (DOE) Office of Science User Facility operated for the DOE Office of Science by Brookhaven National Laboratory under Contract No. DE-SC0012704.This research made use of the resources of the High Performance Computing Center at Idaho National Laboratory, which is supported by the Office of Nuclear Energy of the U.S. Department of Energy and the Nuclear Science User Facilities under Contract No. DE-AC07-05ID14517. We would like to express our gratitude to Emily M. Hoadley for edit reviewing this paper, Xingyue Yang, Rajiv Khadka and Stacey Ray Whitmore in INL for their valuable contributions and support for providing the 3D visualization website tool during the course of this research.
Conflict of interest
The authors declare that the research was conducted in the absence of any commercial or financial relationships that could be construed as a potential conflict of interest.
The reviewer TC declared a past collaboration with the author TY to the handling editor at the time of the review.
Generative AI statement
The author(s) declare that no Generative AI was used in the creation of this manuscript.
Any alternative text (alt text) provided alongside figures in this article has been generated by Frontiers with the support of artificial intelligence and reasonable efforts have been made to ensure accuracy, including review by the authors wherever possible. If you identify any issues, please contact us.
Publisher’s note
All claims expressed in this article are solely those of the authors and do not necessarily represent those of their affiliated organizations, or those of the publisher, the editors and the reviewers. Any product that may be evaluated in this article, or claim that may be made by its manufacturer, is not guaranteed or endorsed by the publisher.
References
Abebe, W., Strube, J., Guo, L., Tallent, N. R., Bel, O., Spurgeon, S., et al. (2025). SAM-I-Am: semantic boosting for zero-shot atomic-scale electron micrograph segmentation. Comput. Mater. Sci. 246 (2025), 113400. doi:10.1016/j.commatsci.2024.113400
Aitkaliyeva, A. (2022). Recent trends in metallic fast reactor fuels research. J. Nucl. Mater. 558, 153377. doi:10.1016/j.jnucmat.2021.153377
Archit, A., Freckmann, L., Nair, S., Khalid, N., Hilt, P., Rajashekar, V., et al. (2025). Segment anything for microscopy. Nat. Methods 22, 579–591. doi:10.1038/s41592-024-02580-4
Böhm, T., Joseph, K., Kirsch, M., Moroni, R., Hilger, A., Osenberg, M., et al. (2019). Quantitative synchrotron X-ray tomography of the material-tissue interface in rat cortex implanted with neural probes. Sci. Rep. 9, 7646. doi:10.1038/s41598-019-42544-9
Cai, L., Xu, F., Di Lemma, F. G., Giglio, J. J., Benson, M. T., Murray, D. J., et al. (2022). Understanding fission gas bubble distribution, lanthanide transportation, and thermal conductivity degradation in neutron-irradiated α-u using machine learning. Mater. Charact. 184, 111657. doi:10.1016/j.matchar.2021.111657
Carmack, W., Porter, D., Chang, Y., Hayes, S., Meyer, M., Burkes, D., et al. (2009). Metallic fuels for advanced reactors. J. Nucl. Mater. 392 (2), 139–150. doi:10.1016/j.jnucmat.2009.03.007
Cassagne, T., Marchebois, H., and Mesquita, T. (2021). A review of hydrogen embrittlement of nickel-based alloys for oil and gas applications. NACE CORROSION.
Crawford, D. C., Porter, D. L., and Hayes, S. L. (2007). Fuels for sodium-cooled fast reactors: us perspective. J. Nucl. Mater. 371 (1-3), 202–231. doi:10.1016/j.jnucmat.2007.05.010
Di Lemma, F. G., Trowbridge, T. M., Capriotti, L., Harp, J. M., Benson, M. T., and Mariani, R. D. (2022). Postirradiation characterization of palladium as an additive for fuel cladding chemical interaction mitigation in metallic fuel. J. Nucl. Mater. 558, 153403. doi:10.1016/j.jnucmat.2021.153403
Gilbert, P. (1972). Iterative methods for the three-dimensional reconstruction of an object from projections. J. Theor. Biol. 36, 105–117. doi:10.1016/0022-5193(72)90180-4
Gong, B., Frazer, D., Yao, T., Hosemann, P., Tonks, M., and Lian, J. (2019). Nano- and micro-indentation testing of sintered UO2 fuel pellets with controlled microstructure and stoichiometry. J. Nucl. Mater. 516, 169–177. doi:10.1016/j.jnucmat.2019.01.021
Greenquist, I., and Powers, J. J. (2021). 25-pin metallic fuel performance benchmark case based on the ebr-ii x430 experiments series. J. Nucl. Mater. 556, 153211. doi:10.1016/j.jnucmat.2021.153211
He, J., Deng, Z., Zhou, L., Wang, Y., and Qiao, Y. (2019). “Adaptive pyramid context network for semantic segmentation,” in Proceedings of the IEEE/CVF conference on computer vision and pattern recognition, 7519–7528.
Hirschhorn, J. A., Powers, J. J., Greenquist, I., Sweet, R. T., Hu, J., Porter, D. L., et al. (2022). Metallic fuel performance benchmarks for versatile test reactor applications. Nucl. Sci. Eng. 196 (Suppl. 1), 123–147. doi:10.1080/00295639.2022.2043539
Huang, G., Liu, Z., Maaten, L. V. D., and Weinberger, K. Q. (2017). “Densely connected convolutional networks,” in Proceedings of the IEEE conference on computer vision and pattern recognition, 4700–4708.
Keiser, J. , D. D. (2019). Fuel cladding chemical interaction in metallic sodium fast reactor fuels: a historical perspective. J. Nucl. Mater. 514, 393–398. doi:10.1016/j.jnucmat.2018.09.045
Kirillov, A., Eric, M., Ravi, N., Mao, H., Rolland, C., Gustafson, L., et al. (2023). Segment anything. doi:10.48550/arXiv.2304.02643
Li, W., Field, K. G., and Morgan, D. (2018). Automated defect analysis in electron microscopic images. npj Comput. Mater. 4 (1), 36. doi:10.1038/s41524-018-0093-8
Lyons, M. F., Boyle, R. F., Davies, J. H., Hazel, V. E., and Rowland, T. C. (1972). UO2 properties affecting performance. Nucl. Eng. Des. 21 (2), 167–199. doi:10.1016/0029-5493(72)90072-6
Mariani, R. D., Porter, D. L., O’Holleran, T. P., Hayes, S. L., and Kennedy, J. R. (2011). Lanthanides in metallic nuclear fuels: their behavior and methods for their control. J. Nucl. Mater. 419 (1-3), 263–271. doi:10.1016/j.jnucmat.2011.08.036
Miao, Y., Yao, T., Lian, J., Zhu, S., Bhattacharya, S., Oaks, A., et al. (2018). Nano-crystallization induced by high-energy heavy ion irradiation in UO2. Scr. Mater. 155, 169–174. doi:10.1016/j.scriptamat.2018.04.006
Minaee, S., Boykov, Y., Porikli, F., Plaza, A., Kehtarnavaz, N., and Terzopoulos, D. (2021). Image segmentation using deep learning: a survey. IEEE Trans. pattern analysis Mach. Intell. 44 (7), 3523–3542.
Morgan, D., Pilania, G., Couet, A., Uberuaga, B. P., Sun, C., and Li, J. (2022). Machine learning in nuclear materials research. Curr. Opin. Solid State Mater. Sci. 26 (2), 100975. doi:10.1016/j.cossms.2021.100975
Otsu, N. (1975). A threshold selection method from gray-level histograms. Automatica 11 (285-296), 23–27.
Porter, D. L., and Crawford, D. C. (2022). Fuel performance design basis for the versatile test reactor. Nucl. Sci. Eng. 196 (Suppl. 1), 110–122. doi:10.1080/00295639.2021.2009983
Schneider, C. A., Rasband, W. S., and Eliceiri, K. W. (2012). NIH Image to ImageJ: 25 years of image analysis. Nat. Methods 9 (7), 671–675. doi:10.1038/nmeth.2089
Shen, M., Li, G., Wu, D., Yaguchi, Y., Haley, J. C., Field, K. G., et al. (2021). A deep learning based automatic defect analysis framework for in-situ tem ion irradiations. Comput. Mater. Sci. 197, 110560. doi:10.1016/j.commatsci.2021.110560
Song, Y., Huang, Z., Shen, C., Shi, H., and Lange, D. A. (2020). Deep learning-based automated image segmentation for concrete petrographic analysis. Cem. Concr. Res. 135, 106118. doi:10.1016/j.cemconres.2020.106118
Sun, S., Xu, F., Cai, L., Salvato, D., Capriotti, L., Xian, M., et al. (2023). An efficient instance segmentation approach for studying fission gas bubbles in irradiated metallic nuclear fuel. Sci. Rep. 13, 22275. doi:10.1038/s41598-023-47914-y
Sun, S., Xian, M., Xu, F., Capriotti, L., and Yao, T. (2024). CFR-ICL: cascade-forward refinement with iterative click loss for interactive image segmentation. Proc. AAAI Conf. Artif. Intell. 38 (5), 5017–5024. doi:10.1609/aaai.v38i5.28306
Tajbakhsh, N., Jeyaseelan, L., Li, Q., Chiang, J. N., Wu, Z., and Ding, X. (2020). Embracing imperfect datasets: a review of deep learning solutions for medical image segmentation. Med. image Anal. 63, 101693. doi:10.1016/j.media.2020.101693
Van Opbroek, A., Ikram, M. A., Vernooij, M. W., and Bruijne, M. D. (2014). Transfer learning improves supervised image segmentation across imaging protocols. IEEE Trans. Med. Imaging 34 (5), 1018–1030. doi:10.1109/tmi.2014.2366792
Wang, H., Xu, F., Cai, L., Salvato, D., Di Lemma, F. G., Capriotti, L., et al. (2023). A fine pore-preserved deep neural network for porosity analytics of a high burnup U-10Zr metallic fuel. Sci. Rep. 13, 22274. doi:10.1038/s41598-023-48800-3
Zhang, Z., Liu, Q., and Wang, Y. (2018). Road extraction by deep residual U-net. IEEE Geoscience Remote Sens. Lett. 15, 749–753. doi:10.1109/lgrs.2018.2802944
Keywords: nuclear fuels, uranium dioxide (UO2), deep learning, transfer learning, multimodal microscopy
Citation: Manda H, Zhao L, Reddy Kancharla R, Xiao X, Purushotham C, Tang Y, Xu P, Yao T and Xu F (2025) Bridging multimodal microscopy for advanced characterization on nuclear fuel using machine learning. Front. Mech. Eng. 11:1619834. doi: 10.3389/fmech.2025.1619834
Received: 28 April 2025; Accepted: 08 September 2025;
Published: 15 October 2025.
Edited by:
Mark D. DeHart, Abilene Christian University, United StatesReviewed by:
Shingo Tamaki, Osaka University, JapanTianyi Chen, Oregon State University, United States
Cody Nizinski, Pacific Northwest National Laboratory (DOE), United States
Copyright © 2025 Manda, Zhao, Reddy Kancharla, Xiao, Purushotham, Tang, Xu, Yao and Xu. This is an open-access article distributed under the terms of the Creative Commons Attribution License (CC BY). The use, distribution or reproduction in other forums is permitted, provided the original author(s) and the copyright owner(s) are credited and that the original publication in this journal is cited, in accordance with accepted academic practice. No use, distribution or reproduction is permitted which does not comply with these terms.
*Correspondence: Tiankai Yao, dGlhbmthaS55YW9AaW5sLmdvdg==; Fei Xu, eHVmZWk3MzVAZ21haWwuY29t
‡Present address: Fei Xu, University of Texas, Computer Science, El Paso, Texas, USA
†These authors have contributed equally to this work