 Renzun Zhu
 Jinhe Chen
 Simin Li2
- 1Tianyou College, East China Jiaotong University, Nanchang, Jiangxi, China
- 2School of Civil Engineering and Architecture, East China Jiaotong University, Nanchang, Jiangxi, China
As high-speed rail networks continue to expand, the workload for train maintenance has risen correspondingly, and the conventional experience−based manual adjustment of spring compression during bogie overhauls introduces significant uncertainty and safety risks. To address this challenge, we develop a theoretical model for static spring-load adjustment in two-axle railway vehicles, applicable to all four-axle bogie configurations, including locomotives, urban metro cars, high-speed passenger units, and freight wagons. By idealizing the bogie as a planar rigid body, we derive a coupling matrix that relates the loads among the springs. To solve this model, we propose an enhanced Grey Wolf Optimizer (S-GWO) designed to rapidly and accurately identify the optimal adjustment strategy. Specifically, S-GWO introduces three key enhancements to the standard Grey Wolf Optimizer: a Gaussian-distributed nonlinear convergence factor that promotes extensive global exploration in early iterations and rapid, precise convergence in later stages, thereby improving both speed and accuracy; an adaptive learning and exploration scheme that strengthens global search capabilities; and a Cauchy perturbation mechanism applied to the α-wolf, which effectively balances local search refinement with global jumping behavior. We validate the algorithm’s performance by benchmarking S-GWO against several state-of-the-art metaheuristics on twelve classical test functions and the engineering spring function, employing rank-sum tests to confirm the superiority of our enhancements. An ablation study is conducted to isolate and quantify the independent contributions of each proposed modification. We apply the model to the CRH2 bogie parameters and compare S-GWO’s performance with that of several widely cited optimization algorithms. Experimental results demonstrate that S-GWO offers significant advantages in convergence speed, solution accuracy, practicality of shim placement schemes, and robustness. These improvements further enhance the efficiency of controlling static bogie center-of-gravity deviations. This study thus provides robust technical support for precise center-of-gravity adjustment and prediction in four-axle rail vehicles.
1 Introduction
According to the International Union of Railways (UIC) statistics for 2024, the global railway network spans 1,305,000 km, of which 48,000 km are high-speed lines, representing approximately 68% of the world’s total high-speed railway mileage (Malott, 2023). Against this macro backdrop, the large-scale operation and maintenance demands of high-speed electric multiple units (EMUs; CRH series) have also grown explosively. By 2024, the fleet of EMUs had rapidly risen to over 4,000 trainsets, and the total volume of corresponding maintenance operations had increased several-fold (Tong et al., 2016). Roughly estimated, each CRH trainset requires approximately 180 first-level inspections and 12 second-level inspections per year, amounting to tens of thousands of first- and second-level maintenance operations system-wide annually (Hong et al., 2014). Such immense maintenance demands pose unprecedented challenges to repair efficiency, technical workforce capacity, and equipment performance stability.
During EMU maintenance, the load distribution of the vehicle suspension system critically affects wheel–rail forces, dynamic performance, and passenger ride comfort. In particular, precise adjustment of the secondary suspension load is crucial, as it directly relates to optimizing vehicle dynamic performance and ensuring running stability (Wickens, 1991). However, most current methods for adjusting EMU suspension loads rely on manually adding shims to regulate spring deflection, a process characterized by high randomness and trial and error, often failing to meet design specifications in one iteration and thus significantly extending maintenance time (Ao and Wu, 2023). Moreover, the exponential increase in the electric multiple-unit fleet has precipitated a pronounced shortage of skilled technicians, rendering it difficult to satisfy the substantial demands of both manufacturing and maintenance markets and thereby further exacerbating the bottleneck in overhaul efficiency.
In recent years, researchers have conducted comprehensive investigations into rail vehicle safety and maintenance from a variety of perspectives. Xu et al. carried out a multi-objective optimization and decision-making study on metal/CFRP hybrid energy-absorbing structures, leveraging a hyper-volume/energy absorption (HFEAS) model together with a gain matrix–cloud model best–worst (G-CBW) method to deliver an efficient Pareto-optimal solution screening strategy for absorber design and demonstrated exceptional performance in localized impact response (Xu et al., 2024). Yang et al. conducted a systematic investigation into the fatigue damage behavior of subway platform screen doors under aerodynamic loads induced by passing trains, integrating wind-tunnel experiments with finite-element fatigue simulations. They proposed an enhanced hinge design and localized reinforcement scheme, achieving an average increase in fatigue life exceeding 20% (Yang et al., 2025a). Chengxing Yang et al. drew inspiration from the biomimetic cross–hexagonal lattice (HQLS) configuration to propose a novel energy-absorbing concept based on steel/CFRP-filled square tubes. They developed a high-precision parametric model that exhibits simulation errors below 4% and applied a design-of-experiments coupled with a surrogate-model approach to optimize wall thickness and unit-cell height, thereby achieving a remarkable 24.6% increase in total energy absorption and an 8% improvement in specific energy absorption (SEA) (Yang et al., 2025b).
Despite the significant advances in structural energy absorption and fatigue-life prediction, the rapid and precise control of static spring-load deviations during EMU bogie maintenance still relies predominantly on manual trial and error, resulting in low efficiency, high variability, and numerous iterative cycles. To address this bottleneck, intelligent optimization algorithms have been introduced for load-distribution modeling and adjustment in rail vehicle suspension systems, thereby enhancing both adjustment efficiency and model accuracy. Bajpai (2014) investigated the impact of suspension spring parameters on ride comfort; Abhishek et al. used the Grasshopper algorithm to optimize the snubber-spring structure (Neve et al., 2020); Xiao and Wu (2025) employed a high-power Harris Hawk optimization algorithm for bogie load deviation control.
This study proposes an improved Grey Wolf Optimization algorithm (S-GWO) with strong global search capabilities, which has attracted widespread scholarly attention for its proficiency in solving nonlinear optimization problems. To address the static-spring load adjustment problem in rail vehicles presented here, we made targeted enhancements to the standard GWO: we improved the nonlinear convergence factor via a Gaussian distribution (Hou et al., 2022), enabling extensive early exploration and rapid late-stage convergence to boost both speed and accuracy; second, this article integrates opposition-based learning and exploration strategies (Adegboye et al., 2024) to enhance global search; finally, we introduce a Cauchy-perturbation mechanism for the α wolves (Liu et al., 2023), effectively balancing local search. Experimental evidence confirms that the proposed enhanced Grey Wolf Optimizer (S-GWO) possesses strong global search capabilities. Both simulation and on-site validations demonstrate that, relative to comparative algorithms, S-GWO delivers faster convergence, improved load-distribution accuracy, and superior shim count and thickness optimization across twelve benchmark functions, the spring function (Paredes et al., 2002), and the actual parameters of the CRH2 bogie, achieving design specifications in a single run without iterative stacking trials.
1. We develop a theoretical model for the static adjustment of spring loads in twin-axle railway vehicles. This modeling methodology is universally applicable to all four-axle bogie platforms, including locomotives, urban metro cars, high-speed passenger units, and freight wagons, and markedly streamlines the computational procedure.
2. By improving the linear convergence factor with a Gaussian distribution, this strategy ensures thorough early exploration and rapid late convergence, enhancing both convergence speed and accuracy.
3. The integration of opposition-based learning with exploration not only broadens the search space via opposite solutions but also injects fresh diversity through random perturbations, markedly improving global optimization capability.
4. The Cauchy perturbation mechanism for α wolves is simple to implement and computationally inexpensive yet effectively balances local search and global jumps.
5. This study evaluates the enhanced algorithm on three categories of problems: twelve classical benchmark functions, the engineering spring function, and a bogie-specific engineering function, and compares its performance against several highly cited classical algorithms to verify the superiority of the proposed enhancements, followed by ablation studies to demonstrate the independent contributions of each enhancement.
6. We integrate the CRH2 bogie parameters into the static spring-load adjustment model for twin-axle railway vehicles. Experimental results demonstrate that the enhanced Grey Wolf Optimizer (S-GWO) offers marked improvements in convergence speed, solution accuracy, and robustness. Moreover, its minimal-shim-quantity scheme proves the most rational, enabling rapid and precise resolution of bogie spring-load adjustment challenges, thereby underscoring the algorithm’s theoretical significance and engineering value in practical applications.
2 Standards and applications of shim-load adjustment in railway bogies
2.1 National standards for shim usage specifications
The railway industry and national standards provide explicit requirements and guidelines for bogie height and load adjustment via shim placement (TB/T 1490-2004, 2025). This document stipulates that the bogie structure must allow for the adjustment of coupler height, carbody tilt, and wheel-load differences. Under the vehicle’s dead-weight condition, the height difference between the first-stage and second-stage coil springs must remain within the standard’s prescribed limits (which vary by speed classification) and may be corrected by inserting shims, with shim thickness accounted for in the spring-seat height calculation. This provision thus recognizes shim placement beneath the spring seats as an approved means of eliminating corner-height deviations in the bogie.
2.2 Shim thickness specifications and permissible tolerances
Shim stacks used for bogie adjustment are typically manufactured in standardized thicknesses to facilitate combination and stacking to achieve the required correction. Common shim thicknesses include 0.2 mm, 0.5 mm, 1 mm, and 2 mm. In practice, various thicknesses may be paired and layered to obtain the desired total height. To ensure adjustment precision, maintenance regulations limit both the maximum total shim-stack height and the individual shim thickness: for CRH-series EMUs, the total shim stack must not exceed 21 mm, and thick shims are placed beneath thinner ones when stacking (Maintenance regulations for Harmony 2C/CRH380A EMUs, excerpted from a document issued by the National Railway Administration, 2025).
2.3 Investigation of suspension spring parameters in CRH2 EMU bogies
The primary suspension of the CRH2 high-speed EMU is located between the wheelset and the bogie frame, employing metallic helical cylindrical coil springs to bear vertical loads (Jia et al., 2023).
2.4 Thresholds of shim-stack adjustments and their nonlinear response characteristics
According to the CRH2 EMU maintenance regulations, newly manufactured vehicles shall employ no more than three spring shims per axle-box assembly, whereas vehicles following a Level-3 overhaul may use up to five shims. Each adjustment shim is approximately 2 mm thick, resulting in a maximum total stack height of approximately 10 mm when five shims are applied (Wang et al., 2014).
3 Modeling of bogie load distribution and establishment of kinematic equations
The bogie is a running gear that supports, guides, and brakes the carbody while permitting relative rotation, featuring vibration buffering and steering functions, and plays a key role in train operation safety, reliability, and ride quality. It is chiefly assembled from the frame, primary suspension, secondary suspension, and traction and braking units. The support structure of the CRH3 bogie is shown in Figure 1.

Figure 1. Bogie of the CRH-type EMU.
The primary suspension system consists of the first-stage suspension and the second-stage suspension. The primary suspension is shown in Figure 2, and the secondary suspension is shown in Figure 3. The first-stage suspension (axle−box suspension assembly) is comprised of the axle−box spring, the vertical damper, and the axial locating device. The axial locating device transmits and cushions loads between the wheel and the frame, affecting the system’s critical speed and hunting stability; the vertical damper reduces vertical vibrations, improving dynamic performance; the circular axle spring transmits and cushions vertical loads between the wheel and frame, influencing ride comfort. Because the effect of the axle−box locating device on vertical load transmission is negligible, it is omitted in this study.
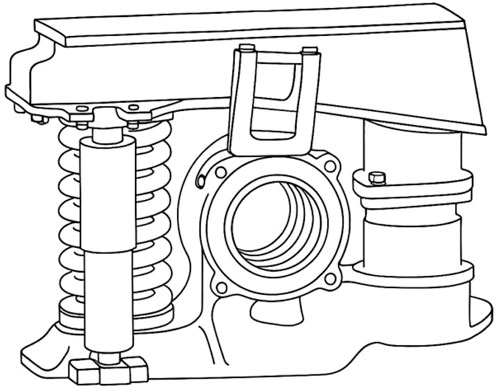
Figure 2. Components of the primary suspension in a rail vehicle.
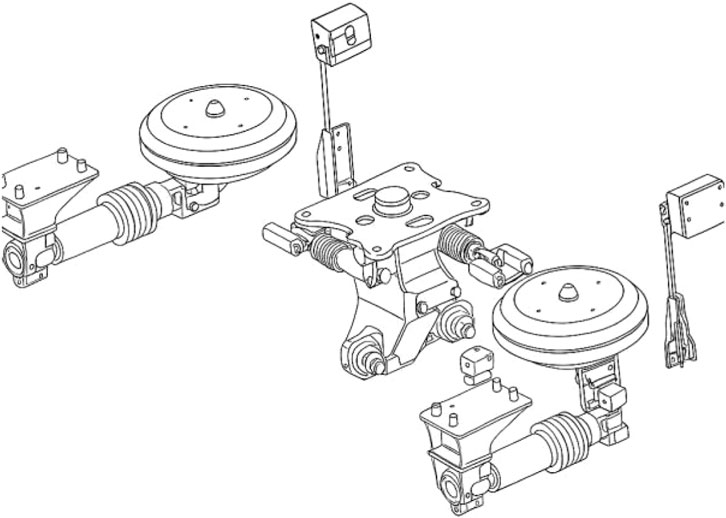
Figure 3. Components of the secondary suspension in a rail vehicle.
The secondary suspension comprises a central coil spring, lateral dampers, lateral buffers, and anti-hunting dampers, with the vertical damper transmitting vertical forces between the bogie frame and the carbody..
In summary, the primary suspension of a two-axle bogie is located at the connection between each wheelset and the frame, with one axle−box coil spring installed per wheelset, totaling four; the secondary suspension is a central spring assembly comprising two central coil springs.
This study focuses on the issue of center-of-gravity shift caused by vertical load distribution in the bogie and puts forward the following assumptions:
1. The dual-axle bogie contains six springs that influence the vertical load distribution;
2. Neglecting the vertical height differences among the six springs, we assume they all lie in a common horizontal plane. We then model the four-wheel, two-axle bogie as a homogeneous, planar rectangular rigid body of length 2 b and width 2 a (with negligible thickness), with vertices labeled A, B, C, and D. The carbody’s weight F is represented as a concentrated force acting at the center of gravity, whose initial eccentricity is defined as
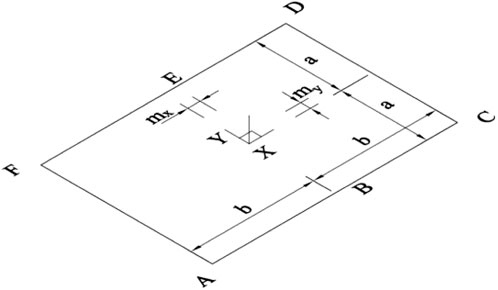
Figure 4. Equivalent mechanical model of the bogie.
The springs are arranged at the suspension load application points, with coordinates in sequence: (−b, −a), (0, −a), (b, −a), (b, a), (0, a), and (−b, a). Fi denotes the force of the spring (for i = 1, 2, 3, 4, 5, and 6 corresponding to A, B, C, D, E, and F, respectively), in N; the spring stiffness coefficient is k, in N/mm. Each spring is fitted with a shim to adjust its compression, having a thickness
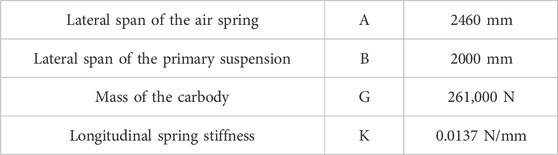
Table 1. Structural parameters of the CRH2 vehicle.
The theoretical model of the static suspension system load for the two-axle EMU bogie is as follows:
According to Hooke’s law, as shown in Equation 2
where
The physical meaning of this equation (Hong et al., 2014) is that the combined change resulting from adjusting multiple shim thicknesses corresponds to the load variation caused at a single support point. The initial load on each spring is
The matrix
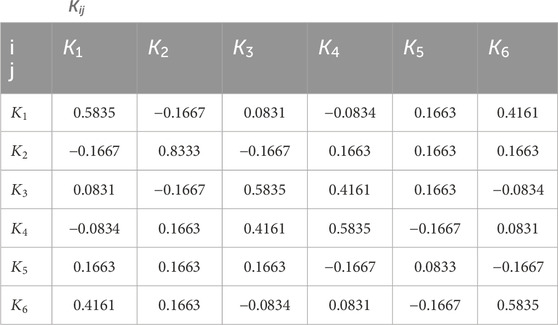
Table 2.
After changing the shims, the load distribution of each spring is given by Equation 4.
Wickens (1991) represents the load-adjustment formula of the static suspension system for a dual-axle EMU bogie and serves as a key theoretical basis for center-of-gravity deviation control. By combining the equations of Tong et al. (2016) and Wickens (1991), Equation 5 is obtained
Meanwhile, because the rectangular plate model is simply supported in its connection to the bogie, the springs cannot provide tensile force along the Z-axis; thus, constraint Equation 6 is proposed as follows
Define
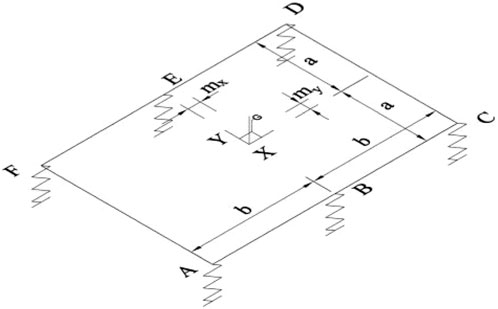
Figure 5. Simplified suspension model of the CRH2 bogie.
By substituting Equation 5 into Equation 8, Equation 9 (Bajpai, 2014) is obtained.
The physical meaning of Equation 9 (Bajpai, 2014) is that the static load on each spring satisfies the static equilibrium equations, and
4 Optimization scheme for the mathematical model
4.1 Penalty for exceeding limits
In the section on shim-stack thresholds and nonlinear behavior, it is noted that, during actual bogie production and machining, the total shim thickness typically does not exceed 10 mm. Therefore, any solution proposing a shim stack greater than 10 mm should incur a penalty to prevent the algorithm from selecting such boundary cases, thereby ensuring that the springs remain within their linear operating range.
Define the shim adjustment vector as
If
4.1.1 Priority penalty
4.1.1.1 First priority
Once the load variance requirement is met, if two or more shim-position–thickness combinations are available, select the solution with the smaller total shim thickness as the secondary optimization objective. The mathematical derivation is shown in Equations 12–14.
The aim is to minimize the number of nonzero components in
4.1.1.2 Second priority
After the variance requirement is met, select the scheme with the smallest total shim thickness.
4.1.1.3 Third priority
Once the above priorities are met, ensure that the loads at the six suspension support points are as close to one another as possible, thereby minimizing their dispersion.
5 Improvement strategies for the Grey Wolf algorithm
5.1 Introduction to the standard Grey Wolf algorithm
The Grey Wolf Optimizer (GWO) is a population-based intelligence optimization algorithm inspired by the social behaviors of gray wolves in nature, particularly their hunting, encircling, and social interactions (Mirjalili et al., 2014). The core idea of the GWO algorithm is to simulate how a pack of gray wolves encircles and cooperates to capture prey. The algorithm performs optimization search by mimicking the hunting behaviors of gray wolves; the specific process is as follows:
Step 1: Prey encirclement
Wolves encircle prey by gradually approaching it, a process analogous to information exchange among individuals. In this manner, agents update their positions and progressively converge toward the target solution.
Step 2: Prey tracking
Once the prey’s position is determined, wolves commence tracking it. During the optimization process, the algorithm continuously adjusts agent positions to approach the optimal solution. This tracking behavior represents an intensive exploration of the solution space.
Step 3: Prey attack
After encirclement and tracking, the wolf pack ultimately captures the prey, analogous to the algorithm’s combination of global and local searches to find the global optimum. The GWO algorithm updates agent positions using the following mathematical model to simulate wolf hunting behavior: Assume there are nnn gray wolves in the population, and their positions are denoted by
5.2 Algorithm improvement strategies
5.2.1 Nonlinear convergence factor based on a Gaussian distribution
In the original GWO, the convergence factor
Here, t represents the current iteration, T is the maximum number of iterations, and
5.2.2 Opposition-based learning and exploration strategy
To enhance global search capability, we integrate opposite-based learning (OBL) with stochastic exploration. Specifically, for a subset of the population (e.g., the 50% of individuals with the lowest fitness), we compute their opposite solutions as shown in Equation 17
To enhance global search performance, we integrate opposite-based learning (OBL) with stochastic exploration. Specifically, for a subset of the population (e.g., the 50% of individuals exhibiting the poorest fitness), we compute their opposite solutions as follows: As shown in Equation 18
Here,
5.2.3 The alpha wolf’s Cauchy perturbation mechanism
For the optimal solution (α wolf) within the Grey Wolf social hierarchy, we introduce a Cauchy-perturbation mechanism. The probability density function of the Cauchy distribution is shown in Equation 19.
Here, λ serves as a scaling factor that governs the tail “thickness.” Compared with the Gaussian distribution, the heavy-tail characteristic of the Cauchy distribution entails occasional large perturbations, thereby enabling the α-wolf to escape from local optima.
After each iteration, a Cauchy-distributed perturbation is applied. The perturbation formula is as shown in Equation 20
Here, C denotes the perturbation vector randomly sampled from the Cauchy distribution. The heavy-tail property of the Cauchy distribution entails occasional large jumps, aiding the α-wolf in escaping local traps and discovering new advantageous regions. If
5.3 Workflow of the enhanced algorithm
The algorithm’s parameters are listed in Table 3. All values were determined through extensive preliminary tuning experiments to strike a balance between search capability and convergence efficiency. When transferring the method to other optimization problems, these parameters may be fine-tuned as appropriate to the problem’s complexity.
Step 1: Randomly generate N wolf pack individuals
Step 2: Calculate the Gaussian-based nonlinear convergence factor.
Step 3: Opposition-based learning and exploration. Generate opposite solutions
Step 4: Traditional encirclement and position update—compute three candidate positions for each non-leader wolf X and update its position.
Step 5: Alpha wolf Cauchy perturbation—sample vector C from a Cauchy distribution, compute candidate
Step 6: Reevaluate the fitness of the entire wolf pack and update individuals
Step 7: Output the results.
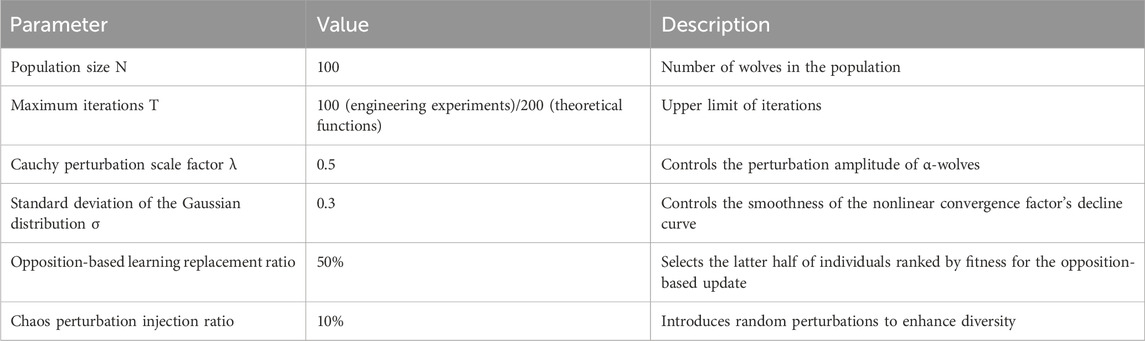
Table 3. Algorithm parameters.
5.4 Pseudocode of the S-GWO algorithm
Algorithm S-GWO (pop, dim, maxIter, lb, ub, fobj)
Inputs:
pop ← population size
dim ← problem dimensionality
maxIter ← maximum number of iterations
lb, ub ← vectors of lower and upper bounds (length = dim)
fobj(x) ← objective function
Outputs:
Best_pos ← best solution found
Best_fitness ← objective value at Best_pos
─── Initialization ───
1. Generate initial population X ∈ ℝ^{pop × dim}:
for i in 1 … pop:
X[i] ← lb + rand(dim) ⊙ (ub–lb)
2. Evaluate fitness:
for i in 1 … pop:
f[i] ← fobj(X[i])
3. Identify α, β, δ wolves:
Sort wolves by f ascending.
α_pos ← position of best wolf; α_score ← best fitness
β_pos ← position of 2nd-best; β_score ← 2nd-best fitness
δ_pos ← position of 3rd-best; δ_score ← 3rd-best fitness
Best_pos ← α_pos; Best_fitness ← α_score
─── Main Loop ───
for t in 1 … maxIter:
a ← 2 · (1 – t/maxIter)//convergence factor
for each wolf i in 1 … pop:
for each dimension j in 1 … dim:
//Random coefficients
A1 ← 2·a·rand() – a;
C1 ← 2·rand()
A2, C2 and A3, C3 likewise
//Distance to α, β, δ
Dα ← |C1·α_pos[j] – X[i,j]|
Dβ ← |C2·β_pos[j] – X[i,j]|
Dδ ← |C3·δ_pos[j] – X[i,j]|
//Candidate positions
X1 ← α_pos[j] – A1·Dα
X2 ← β_pos[j] – A2·Dβ
X3 ← δ_pos[j] – A3·Dδ
//Combine with OBL and Cauchy perturbation
avgX ← (X1 + X2 + X3)/3
oblX ← lb[j] + ub[j] – avgX
newPos ← 0.5·(avgX + oblX) + γ tan(π·(rand() – 0.5))
//Enforce bounds
X[i,j] ← clip(newPos, lb[j], ub[j])
end for
//Update fitness
f[i] ← fobj(X[i])
end for
//Update α, β, δ wolves if better
Resort wolves by f ascending; update α_pos, β_pos, δ_pos, and scores
if α_score < Best_fitness:
Best_pos ← α_pos
Best_fitness ← α_score
end if
end for
6 Algorithm performance experiments and analysis
The experiments were conducted on a computer equipped with an 11th-generation Intel® Core™ i7-11700 processor clocked at 2.50 GHz, 16 GB of RAM, and a 64-bit Windows 11 operating system. The algorithm was implemented in MATLAB R2021a. To evaluate the performance of S-GWO, twelve representative functions were selected from a pool of 23 classical benchmark functions, together with an engineering test function for compression-spring design. The test functions are listed as follows.
The unimodal functions are given by Equations 21–24:
The multimodal functions are given by Equations 25–27:
The fixed-dimension multimodal test functions are given by Equations 28–31:
Engineering test function: spring
The objective of the compression-spring design problem is to minimize the mass function f(x) subject to four inequality constraints: minimum deflection, shear stress, natural (oscillation) frequency, and outer-diameter limits, using three design variables: the mean coil diameter
The objective functions are given by Equations 32, 33:
The constraints are given by Equations 34, 35;
6.1 Comparative algorithms and parameter settings
This study selects five algorithms: the improved Grey Wolf Optimizer (S-GWO), Whale Optimization algorithm (WOA), Heap-based Optimization (HBO), Standard Multi-verse Optimizer (MVO), and Harris Hawks Optimizer (HHO) for comparative simulation experiments on twelve test functions, evaluating mean fitness (mean) and fitness standard deviation (std). In this experiment, the population size for each algorithm is set to 50, and the dimensionality of the non-fixed-dimension test functions is dim = 30.
6.2 Benchmark function testing and analysis
Table 4 presents the mean fitness values (mean) and fitness standard deviations (std) obtained by running the S-GWO algorithm and its comparative optimizers independently for 30 trials. GWO.
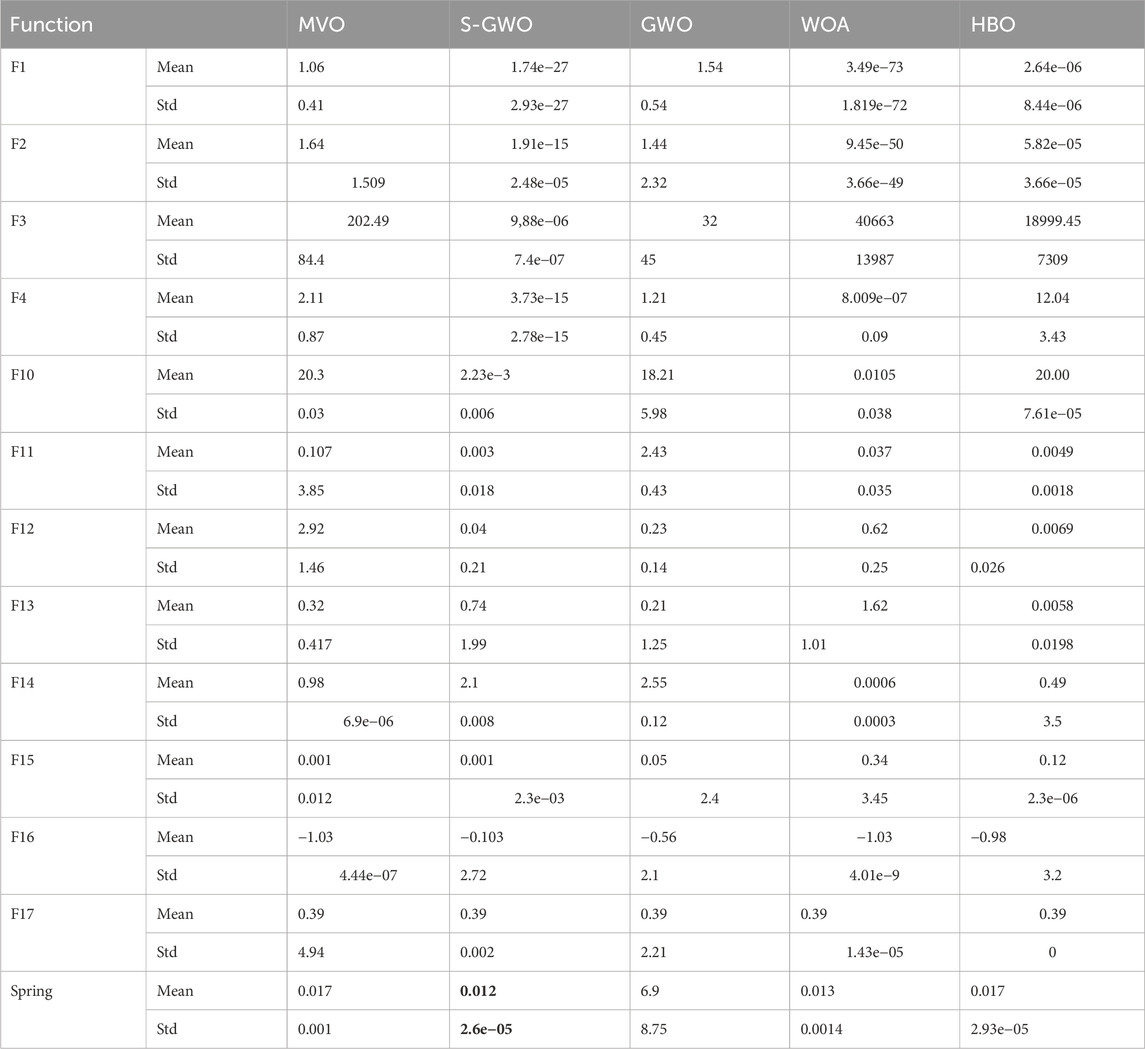
Table 4. Mean and standard deviation for twelve test functions.
The best results in the experimental data have been highlighted in bold. The S-GWO algorithm achieved the best mean fitness and the lowest standard deviation on functions F3, F4, F11, F15, and spring, and also demonstrated advantages in both mean and standard deviation over some comparison algorithms on functions F1, F2, F3,x F4, F11, F15, F16, and F17. Compared to the standard GWO, S-GWO achieved better fitness and lower standard deviation on all functions except F12 and F13. The results indicate that the improved Grey Wolf Algorithm (S-GWO) significantly outperforms the standard GWO in benchmark tests and maintains an advantage over high-performance algorithms such as WOA and MVO. These findings show that S-GWO provides a substantial improvement across the twelve benchmark functions.
As shown in Figure 6, convergence curves for five optimization algorithms on twelve test functions are plotted. Panels (c), (i), (g), and (j) indicate that the improved Grey Wolf Optimizer converges more rapidly on functions F15, F11, F4, and F3, with especially pronounced performance on F11, demonstrating S-GWO’s superior efficacy on multimodal landscapes. Panel (m) confirms that S-GWO performs well on the engineering spring function. Conversely, panels (h) and (d) show that S-GWO becomes trapped and fails to reach the global optimum on F10 and F14. These observations corroborate the results reported in Table 4.
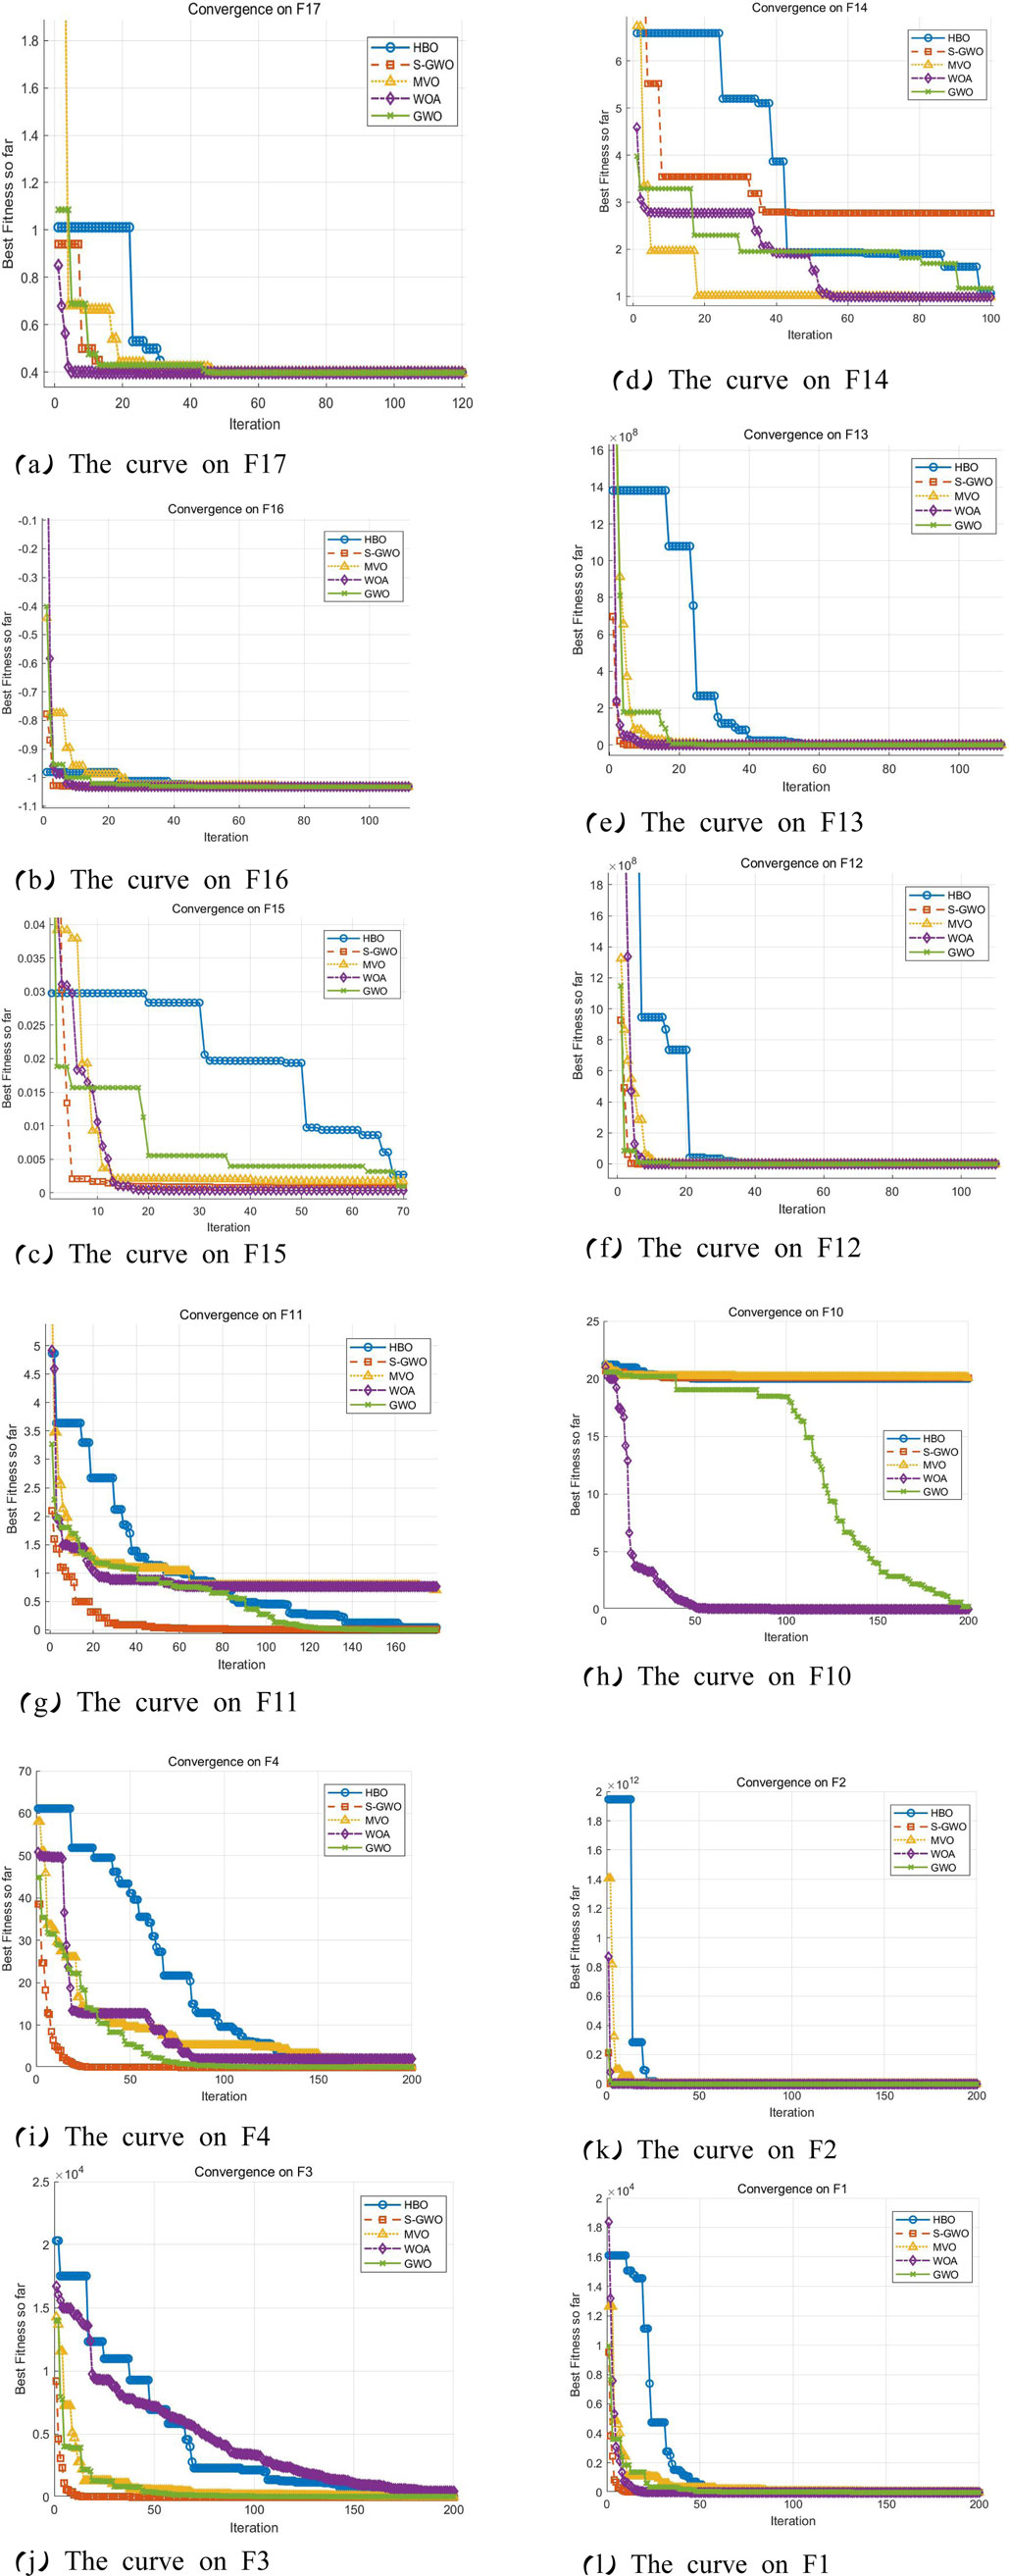
Figure 6. Comparative plot of convergence curves of the algorithms on the test functions. (a) The curve on F17, (b) The curve on F16, (c) The curve on F15, (d) The curve on F14, (e) The curve on F13, (f) The curve on F12, (g) The curve on F11, (h) The curve on F10, (i) The curve on F4, (j) The curve on F3, (k) The curve on F2, and (l) The curve on F1.
6.3 Wilcoxon rank-sum test on function data
The rank-sum test—also known as the Wilcoxon rank-sum test or Mann–Whitney U Test—is a nonparametric statistical method employed to assess whether two independent samples originate from distributions that differ significantly. By definition, the p-value in the rank-sum test indicates the test’s significance level; the indicator variable hhh denotes the test outcome: h = 0 implies failure to reject the null hypothesis, whereas h = 1 indicates rejection of the null, thereby signifying a statistically significant difference between the two algorithms.
In this study, we evaluated the performance of five metaheuristic optimization algorithms: Grey Wolf Optimizer (GWO), improved Grey Wolf Optimizer (S-GWO), Multi-verse Optimizer (MVO), Whale Optimization algorithm (WOA), and Heap-based Optimizer (HBO) across a suite of test functions, including the spring function and functions F1–F4 and F10–F17. Each algorithm was executed 30 independent times, with the best objective value recorded in each run. The means of these optimal values were then computed, and pairwise Wilcoxon rank-sum tests were conducted among all algorithms to determine whether performance differences were statistically significant.
The results revealed that all hhh values equaled 1, indicating that every pairwise comparison exhibited statistically significant performance differences. As shown in Table 5, a smaller mean optimal value reflects stronger search capability on the corresponding test function, that is, a greater propensity to discover lower objective function values (better feasible solutions or closer approximations to the global optimum). Comparing the algorithms’ mean optimal values leads to the conclusion that S-GWO demonstrates the best performance on the spring function as well as functions F3, F4, F12, and F13, while exhibiting comparable performance to WOA and HBO on function F16.
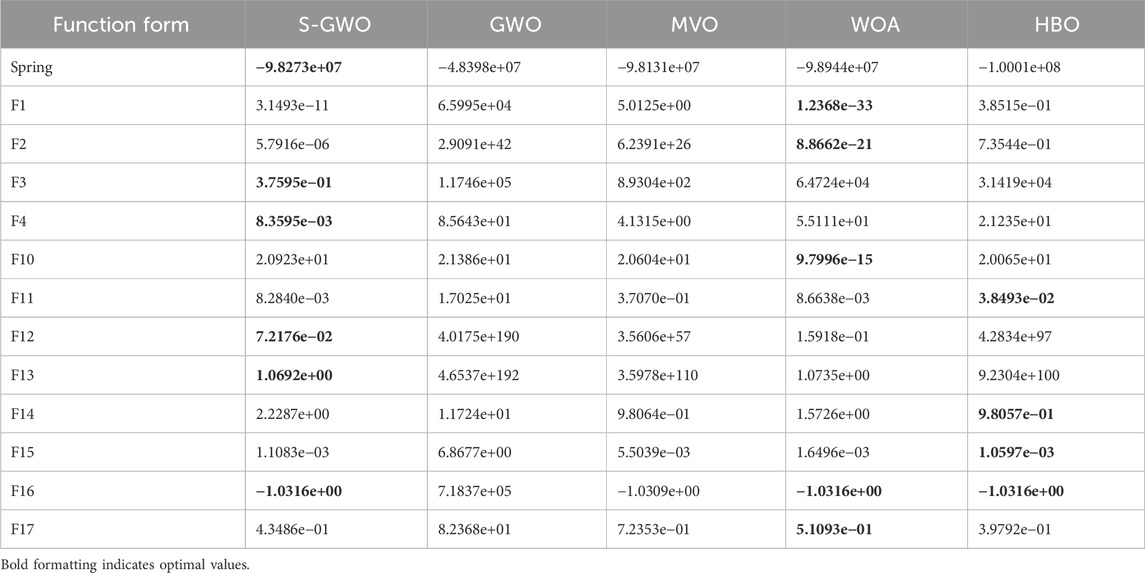
Table 5. Mean Mean optimal values of the optimization algorithms.
6.4 Ablation study
With respect to the three major enhancements in the improved S-GWO—the Gaussian-distributed nonlinear convergence factor, the opposite-based learning and exploration strategy (OBL), and the Cauchy perturbation mechanism applied to the α-wolf—this study proposes a comprehensive ablation experimental framework. By forming four comparative groups, each isolating individual modules as well as a fully integrated configuration, and conducting experiments on both single-dimension and multi-dimension standard benchmark function suites, we compare the mean fitness (mean) and fitness standard deviation (std) to quantitatively evaluate the independent and synergistic contributions of each enhancement.
Control group design: as shown in Table 6.
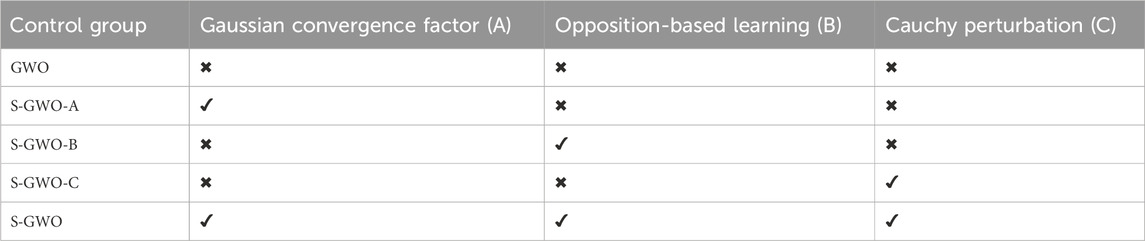
Table 6. Control group design for ablation experiments.
Benchmark test function suite: the classical unimodal function F1 and the multimodal function F10 were selected as the test set. In this experiment, each algorithm’s population size was set to 50, the dimensionality of the non-fixed-dimension test functions was set to D = 30, the number of runs N = 30, and the search interval was [−100, 100].
As shown in Table 7, the integration of the three enhancement strategies confers a comprehensive advantage to the fully augmented S-GWO. On F1, S-GWO’s mean error is nearly zero (on the order of 10−27), representing an approximately 27-orders-of-magnitude reduction compared to the original GWO’s 1.54; the std is likewise effectively zero, indicating exceptional solution accuracy and stability. On F10, S-GWO achieves a mean value of 0.00223—an improvement of four orders of magnitude over GWO’s 18.21—and the lowest std (0.006), demonstrating its reliable ability to escape multimodal traps and converge to the global optimum. Ablation results for individual modules: with only the Gaussian convergence factor (S-GWOA), F1 still exhibits a substantial residual error (6.94 × 10⁻⁴) and an std of approximately 6.7 × 10⁻³, indicating that while the Gaussian factor alone accelerates convergence, it becomes trapped away from zero without local exploration or escape mechanisms. On F10, its mean value approaches the boundary (≈20), and the std reaches 9.22, severely compromising its ability to handle multimodal landscapes.
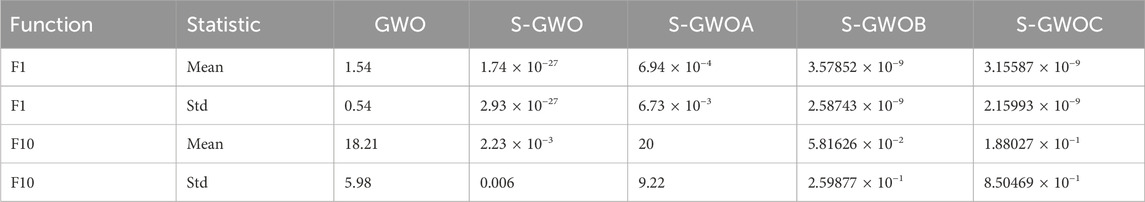
Table 7. Ablation experiments based on F1 and F10.
With only opposite-based learning (S-GWOB), F1 converges near the global optimum (3.6 × 10⁻⁹) with an std of the same order; on F10, it achieves a mean of 0.058 and an std of 0.26. Although this is not as strong as S-GWO, it represents roughly a 300-fold improvement over the original GWO, demonstrating OBL’s powerful global escape capability in multimodal problems.
With only Cauchy perturbation (S-GWOC), F1 also converges to the ∼10−9 level, with an std similarly on the order of 10−9, on par with OBL; on F10, it records a mean of 0.188 and an std of 0.85—an obvious improvement, though with slightly inferior performance and stability than OBL, indicating that Cauchy perturbation favors local fine-grained search.
Robustness (std) comparison: S-GWO exhibits the smallest std, indicating virtually no random fluctuation when all three modules are combined; S-GWOB follows with an average std below 0.3 across the two functions; S-GWOC and S-GWOA show significantly larger stds, particularly on F10 at 0.85 and 9.22, respectively, reflecting the insufficient stability of single modules in multimodal environments.
Conclusion: The synergy of the three modules in S-GWO yields the optimal convergence accuracy (smallest mean) and consistency (smallest std). Opposite-based learning is the most effective single enhancement, maintaining global search capability while providing robustness. Cauchy perturbation excels in unimodal problems but exhibits greater fluctuation in multimodal settings; the Gaussian factor performs worst when used alone and must be combined with other modules to demonstrate value. Therefore, in practical optimization, it is recommended to enable opposite-based learning at a minimum, supplemented by Cauchy perturbation or the Gaussian factor to achieve comprehensive performance improvements.
7 Engineering experiment verification and analysis
To validate the superiority of the improved Multi-verse Optimizer proposed in this study, experiments were conducted on a simplified CRH2 bogie structural model to assess the convergence curves, the variance of uniformly distributed loads, and the number and magnitude of shim adjustments produced by different algorithms. The model’s input parameters are presented in Table 8.
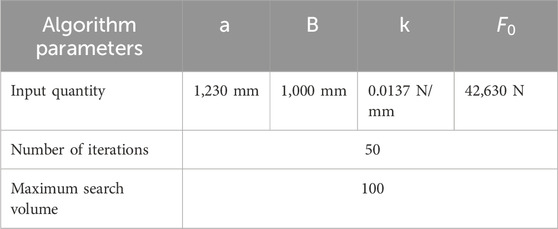
Table 8. Model input parameters.
7.1 Experimental validation
The solutions and simulations were performed using the standard GWO, the S-GWO, the Multi-Verse Optimizer (MVO), and the Heap-based Optimization (HBO) algorithms, respectively.
Figure 7 depicts the convergence curves of the four algorithms. The algorithms were configured with 50 iterations and a population size of 100. The ideal objective-function threshold is 0, and we take
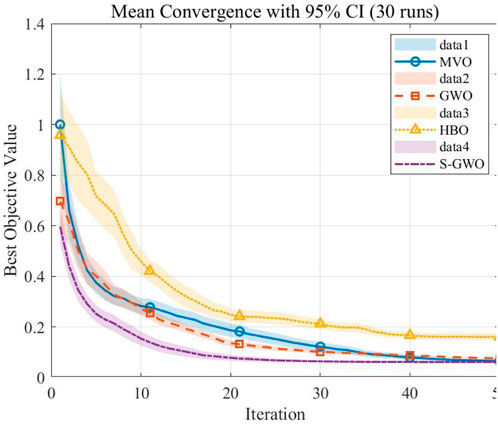
Figure 7. Comparison of convergence curves based on the engineering function.
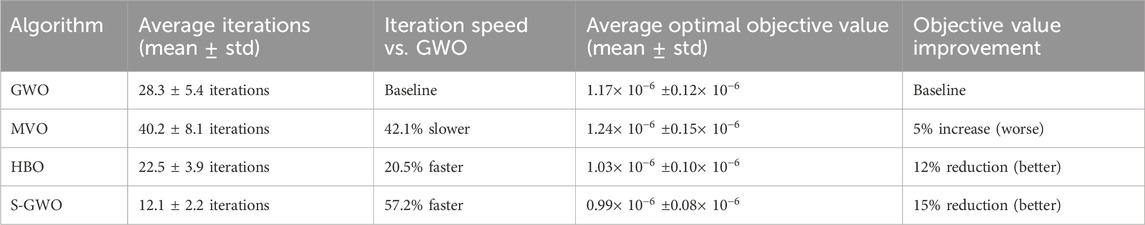
Table 9. Quantitative analysis of algorithm convergence performance.
7.2 Shim filling experiment
Figure 8 presents the shim filling schemes produced by the five algorithms for solving the mathematical model proposed in this study. The horizontal axis denotes the positions of the load-suspension points, while the vertical axis indicates the shim-fill height at each suspension point.
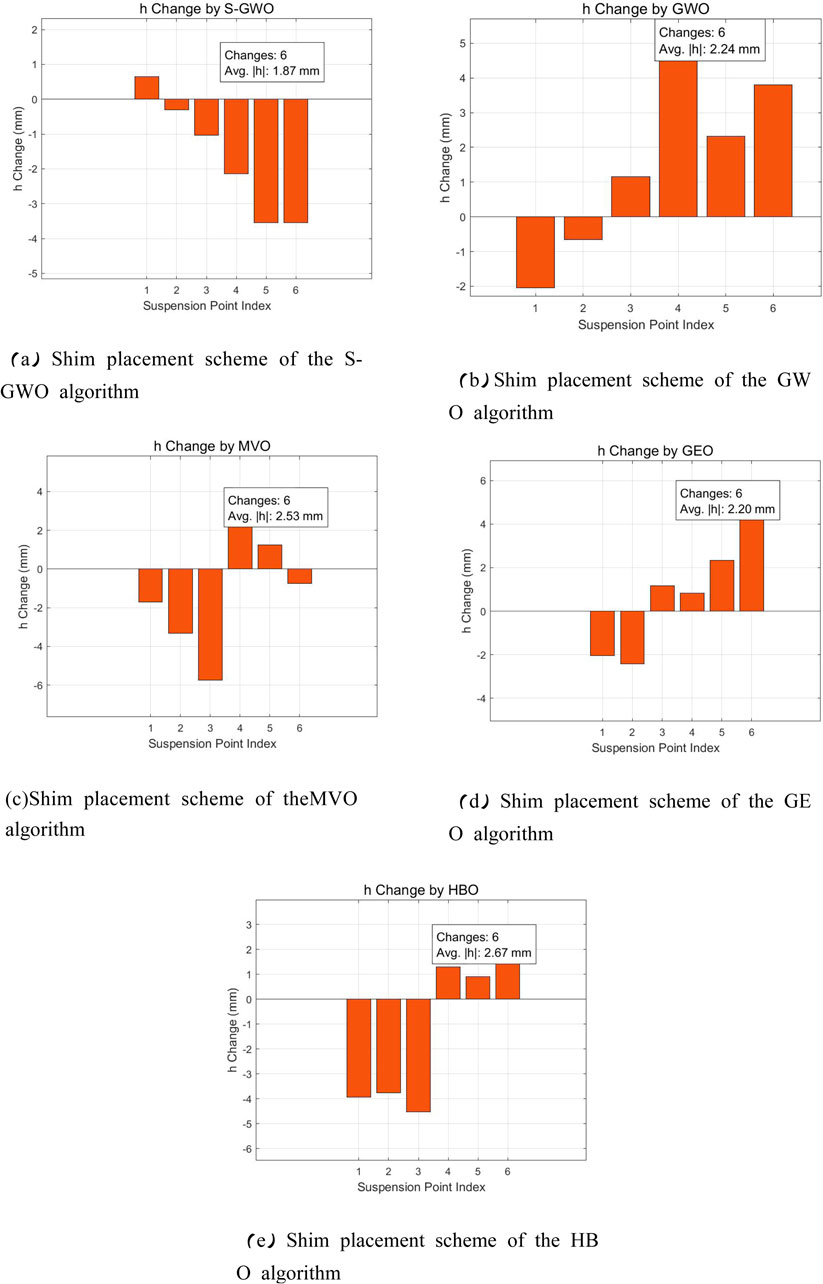
Figure 8. Comparison of shim-filling schemes for the algorithms. (a) Shim placement scheme of the S-GWO algorithm. (b) Shim placement scheme of the GWO algorithm. (c) Shim placement scheme of the MVO algorithm. (d) Shim placement scheme of the GEO algorithm, and (e) Shim placement scheme of the HBO algorithm.
The results indicate that all algorithms produced shim adjustment schemes requiring six shims, among which the S-GWO achieved the smallest mean absolute shim adjustment value, denoted as
7.3 Model generalizability and parameter sensitivity analysis
This study presents a universally applicable computational framework for bogie load-distribution control. Specifically, the model formulation is governed by key parameters: spring transverse span, primary-suspension transverse span, carbody mass, and longitudinal spring stiffness, and its generality lies in its ability to adapt these parameters for locomotives, metro vehicles, high-speed EMUs, and freight-train bogies.
8 Conclusion
1. This study proposes a theoretical framework for static spring-load adjustment in two-axle railway vehicles, in which the bogie suspension system is idealized as a planar rigid body and the primary and secondary suspension springs are represented as six discrete loads on a common plane. This modeling approach is universally applicable to two-axle rail vehicles, including locomotives, metro cars, and EMUs.
2. This work develops an application model of the improved Grey Wolf Optimizer for static center-of-gravity deviation control in rail vehicles. The model overcomes the drawbacks of manual spring-load adjustment in traditional bogie maintenance, enhancing both efficiency and precision of load calibration, and can advance practices in rail-vehicle manufacturing and production.
3. We introduce a Gaussian-based nonlinear convergence factor to allow extensive exploration early and rapid convergence later, improving both convergence rate and accuracy; incorporate an opposition-based learning and exploration strategy to strengthen global search; and add a Cauchy-perturbation mechanism for the α wolf to effectively balance local exploitation and global jumps.
4. This study evaluates the enhanced algorithm on three categories of problems: twelve classical benchmark functions, the engineering spring function, and a bogie-specific engineering function, and compares its performance against several highly cited classical algorithms to verify the superiority of the proposed enhancements, followed by ablation studies to demonstrate the independent contributions of each enhancement.
5. We integrate the CRH2 bogie parameters into the two-axle railway vehicle’s static spring-load adjustment model. Experimental results demonstrate that the S-GWO offers marked advantages in convergence speed, optimal solution accuracy, and robustness, produces the most rational minimal-shim filling scheme, and can rapidly and precisely resolve bogie spring-load adjustment challenges, thereby underscoring the algorithm’s theoretical significance and engineering value in real-world applications.
9 Limitations and future directions
Although the proposed enhanced Grey Wolf Optimizer (S-GWO) demonstrates strong performance in static spring-load adjustment, several limitations remain. First, the current model is grounded in a simplified two-dimensional rigid-body theory; its modeling fidelity must be extended to accommodate more complex bogie geometries and scenarios involving nonlinear deformations. Second, the present formulation does not account for dynamic loading effects encountered during operation, such as lateral forces, torsional stiffness, and the nonlinear characteristics of the suspension system, focusing solely on the static equilibrium of body-weight-induced loads.
Future work will seek to integrate multi-source sensor data fusion and leverage real-world operating data to calibrate model parameters and will explore novel hybrid schemes that couple deep-learning-based predictive modules with heuristic optimization algorithms, thereby advancing the model’s intelligence and enhancing its suitability for practical, deployable engineering applications.
Data availability statement
The original contributions presented in the study are included in the article/Supplementary Material; further inquiries can be directed to the corresponding author.
Author contributions
RZ: Methodology, Data curation, Investigation, Writing – review and editing, Conceptualization, Formal Analysis. JC: Writing – original draft. SL: Writing – original draft.
Funding
The author(s) declare that no financial support was received for the research and/or publication of this article.
Conflict of interest
The authors declare that the research was conducted in the absence of any commercial or financial relationships that could be construed as a potential conflict of interest.
Generative AI statement
The author(s) declare that no Generative AI was used in the creation of this manuscript.
Any alternative text (alt text) provided alongside figures in this article has been generated by Frontiers with the support of artificial intelligence and reasonable efforts have been made to ensure accuracy, including review by the authors wherever possible. If you identify any issues, please contact us.
Publisher’s note
All claims expressed in this article are solely those of the authors and do not necessarily represent those of their affiliated organizations, or those of the publisher, the editors and the reviewers. Any product that may be evaluated in this article, or claim that may be made by its manufacturer, is not guaranteed or endorsed by the publisher.
References
Adegboye, O. R., Feda, A. K., Ojekemi, O. S., Agyekum, E. B., Hussien, A. G., and Kamel, S. (2024). Chaotic opposition learning with mirror reflection and worst individual disturbance grey wolf optimizer for continuous global numerical optimization. Sci. Rep. 14 (1), 4660. doi:10.1038/s41598-024-55040-6
Ao, Y., and Wu, Y. (2023). The static adjustment method of secondary suspension load for six-axle locomotives via modified mayfly optimization algorithm. IEEE Trans. Intelligent Transp. Syst. 24 (9), 9165–9174. doi:10.1109/tits.2023.3270906
Bajpai, N. (2014). “Suspension spring parameter's optimization of an Indian railway freight vehicle for better ride quality[C],” in 2014 international conference on advances in engineering and technology research (ICAETR-2014). IEEE, 1–6.
Hong, M., Wang, Q., Su, Z., and Cheng, L. (2014). In situ health monitoring for bogie systems of CRH380 train on beijing–Shanghai high-speed railway. Mech. Syst. Signal Process. 45 (2), 378–395. doi:10.1016/j.ymssp.2013.11.017
Hou, Y., Gao, H., Wang, Z., and Du, C. (2022). Improved grey wolf optimization algorithm and application. Sensors 22 (10), 3810. doi:10.3390/s22103810
Jia, X., Jin, A., Chen, L., and Yang, D. (2023). Effect of inter-vehicle suspension on variable speed curve running of train under crosswinds. Appl. Sci. 13, 12278. doi:10.3390/app132212278
Liu, W., Sun, J., Liu, G., Fu, S., Liu, M., Zhu, Y., et al. (2023). Improved GWO and its application in parameter optimization of elman neural network. Plos one 18 (7), e0288071. doi:10.1371/journal.pone.0288071
Maintenance regulations for Harmony 2C/CRH380A EMUs (Level-4 overhaul), excerpted from a document issued by the National Railway Administration (2025).
Malott, P. (2023). High-Speed Rail vs. High-Frequency Rail[C]//International Workshop on HSR Socioeconomic Impacts. Cham, Switzerland: Springer Nature, 111–121.
Mirjalili, S., Mirjalili, S. M., and Lewis, A. (2014). Grey wolf optimizer. Adv. Eng. Softw. 69, 46–61. doi:10.1016/j.advengsoft.2013.12.007
Neve, A. G., Kakandikar, G. M., Kulkarni, O., and Nandedkar, V. (2020). “Optimization of railway bogie snubber spring with grasshopper algorithm[C]//Data Engineering and Communication Technology,” in Proceedings of 3rd ICDECT-2K19. Singapore: Springer, 941–952.
Paredes, M., Sartor, M., and Masclet, C. (2002). Obtaining an optimal compression spring design directly from a user specification. Proc. Institution Mech. Eng. Part B J. Eng. Manuf. 216 (3), 419–428. doi:10.1243/0954405021519906
Tong, J., Nie, L., and He, Z. (2016). “Calculation of first-level maintenance capacity in EMU depot based on the EMU circulation plan,” in 2016 3rd international conference on materials engineering, manufacturing technology and control. Paris, France: Atlantis Press, 653–657.
Wang, F., Lin, J., and Lei, H. (2014). Analysis and recommendations for cases where the number of shims used in axle Spring adjustment exceeds the specified value during Level-3 overhaul of CRH2 EMUs. Enterp. Technol. Dev. 10, 73–74. doi:10.1016/j.ymssp.2014.02.008
Wickens, A. H. (1991). Steering and stability of the bogie: vehicle dynamics and suspension design. Proc. Institution Mech. Eng. Part F J. Rail Rapid Transit 205 (2), 109–122. doi:10.1243/pime_proc_1991_205_224_02
Xiao, Y., and Wu, Y. (2025). The suspension load deviation control method for high-power locomotives via harris Hawk optimization. ISA Trans. 161, 289–301. doi:10.1016/j.isatra.2025.03.023
Xu, P., Guo, W., Yang, L., Yang, C., and Zhou, S. (2024). Crashworthiness analysis and multi-objective optimization of a novel metal/CFRP hybrid friction structures. Struct. Multidiscip. Optim. 67 (6), 97. doi:10.1007/s00158-024-03795-x
Yang, H., and Liu, D. (2017). Numerical study on the aerodynamic noise characteristics of CRH2 high-speed trains. J. Vibroengineering 19 (5), 3953–3967. doi:10.21595/jve.2017.18427
Yang, C., Huo, Y., Meng, K., Zhou, W., Yang, J., and Nan, Z. (2025a). Fatigue failure analysis of platform screen doors under subway aerodynamic loads using finite element modeling. Eng. Fail. Anal. 174, 109502. doi:10.1016/j.engfailanal.2025.109502
Keywords: control method for locomotive center-of-gravity deviation, spring-load correlation matrix, Gaussian distribution-enhanced nonlinear convergence factor, opposition-based learning and exploration, Cauchy perturbation mechanism for the α wolf
Citation: Zhu R, Chen J and Li S (2025) A control method for center-of-gravity deviation in locomotive bogies based on an improved Grey Wolf Optimization algorithm. Front. Mech. Eng. 11:1646395. doi: 10.3389/fmech.2025.1646395
Received: 18 June 2025; Accepted: 13 August 2025;
Published: 30 September 2025.
Edited by:
Kanak Kalita, Vel Tech Dr. RR and Dr. SR Technical University, IndiaCopyright © 2025 Zhu, Chen and Li. This is an open-access article distributed under the terms of the Creative Commons Attribution License (CC BY). The use, distribution or reproduction in other forums is permitted, provided the original author(s) and the copyright owner(s) are credited and that the original publication in this journal is cited, in accordance with accepted academic practice. No use, distribution or reproduction is permitted which does not comply with these terms.
*Correspondence: Jinhe Chen, anVhbmp1YW5AZWNqdHUuZWR1LmNu