 Parveen Sharma1
 Kashmir Singh Ghatorha1
 Lenka Cepova2Nillohit Mitra Ray3
 Ajay Kumar4*†Saneh Lata Yadav5Vladimira Schindlerova2
 Rakesh Kumar Phanden6,7
- 1School of Mechanical Engineering, Lovely Professional University, Phagwara, Punjab, India
- 2Department of Machining, Assembly and Engineering Metrology, Faculty of Mechanical, Engineering, VSB-Technical University of Ostrava, Ostrava, Czechia
- 3School of Bioengineering and Biosciences, Lovely Professional University, Phagwara, India
- 4Department of Mechanical Engineering, School of Core Engineering, Faculty of Science, Technology & Architecture, Manipal University, Jaipur, Rajasthan, India
- 5Centre of Excellence - Cloud Computing, School of Engineering & Technology, K.R. Mangalam University, Sohna, Haryana, India
- 6School of Business and Law, Central Queensland University, Rockhampton, VIC, Australia
- 7Department of Engineering, Sat Kabir Institute of Technology & Management, Bahadurgarh, Haryana, India
The strategic layout of a facility is crucial for achieving optimal productivity, operational efficiency, and ergonomic functionality in manufacturing systems. The availability of resources on the shop floor has a direct impact on how effectively each industry performs its tasks. The current study proposes a combined approach for selecting the optimal layout design from several options for a specific small-scale manufacturing industry. To achieve this, authors employed the FAHP to make decisions in the presence of uncertainty, the Entropy method to assign objective weights to different criteria, and the TOPSIS method to rank design options based on their proximity to the ideal solution. Five different facility layout designs were evaluated, with three qualitative factors examined: layout flexibility, shop floor utilisation, and ergonomics. The method is designed for use in a car parts manufacturing company that has experienced operational bottlenecks and poor shop floor layout for years. The people in charge, as well as the industry management, were unsatisfied with the setup. The results show that Layout 5 is superior to the others because it can be modified and outperforms all the other criteria used to evaluate it. The current study provides a comprehensive model to help small-scale industries, which are often at the bottom of the industrial hierarchy, transition from simple methods to more advanced ones in making decisions about layout design.
1 Introduction
In today’s competitive market, the layout of a manufacturing company’s resources is of paramount importance, as it affects how efficiently the company utilises its resources, how quickly it can produce goods, and its cost-effectiveness. A well-structured and planned layout enhances the flow of operations, reduces the time and cost of material movement, and optimises the use of available space and resources (Odeyinka and Omoegun, 2023).
On the other hand, bad layouts can lead to more blocking, longer cycle times, wasted floor space, and higher operating costs. In small-scale manufacturing units where resources are sparse, it is even more important to plan the layout so that one can maximise the use of available resources.
An industry, whether small or large, constantly strives to maximise its use of resources. The resources of an industry can be the people, machines, or other things that businesses use to turn input into output. Thus, machines are also a resource. Their correct placement on the shop floor will facilitate the other resources to work more effectively, as they all depend on each other. Facility layout planning is the process of strategically placing resources, such as equipment, departments, and pathways, to ensure a streamlined information flow regarding materials and workers (Stephens and Meyers, 2013). However, the division of floor space among different resources is a cumbersome process, as many factors that need to be considered are at odds with each other. These factors can either be qualitative or quantitative. While the quantitative factors can be directly measured or calculated (for example, how long it takes to make something or how far it must travel), the qualitative factors are not as easy to measure (like how flexible the layout is, how comfortable it is to use, how well it utilises the space), but they are just as important.
Many factors influence the position of a machine on the shop floor. For a layout designer, it is challenging to consider all factors simultaneously; however, the objective is to take into account most of them. While some mathematical data is available to help ascertain quantitative factors, additional data is also available that lacks numeric values but still influences planning. These are called qualitative factors (Ding, 2011; İnce and Taşdemir, 2024).
It is pretty challenging to deal with such a problem. In this regard, Multi-criteria decision-making (MCDM) techniques have become increasingly popular (Taherdoost and Madanchian, 2023). These MCDM methods or approaches enable the user to investigate a range of layout options based on various performance criteria or indicators. The current study proposes a mixed MCDM framework that utilises the FAHP to gather expert opinions, the Entropy method to derive unbiased weights, and TOPSIS to rank the available options. The goal of this study is to develop a comprehensive and adaptable approach for small businesses to select their facility layout, with a focus on its practical application in the real world (Sharma and Singhal, 2017, Torfi et al., 2010).
2 Literature review
In this study, a wide range of research papers published in the last 20 years have been analysed to aid the layout design. The research has taken into account various scientific literature that has reported significant improvements in facility layout planning, multi-criteria decision-making methods, and hybrid evaluation techniques and tools. The scientific papers were carefully curated from reputable publishing houses and high-impact academic journals to ensure they are relevant to the work reported here, in-depth, and of high quality. The selected works have provided helpful information about both traditional and modern methods, on which the current study is based.
Facility layout planning (FLP) is crucial for enhancing the efficiency of production processes and ultimately improving the overall performance of any industry. According to Pérez-Gosende et al. (2021), the arrangement of resources is a strategic choice that significantly affects the efficiency of the workforce on the shop floor, the time required to complete tasks, and the amount of energy used. Layout design is important not only for traditional manufacturing but also for dynamic environments where flexibility and quick response are important (Pérez-Gosende et al., 2020).
Monga and Khurana (2015) conducted a thorough study on the evolution of strategies for facility layout over time. The authors have stressed that in all types of businesses, the top priorities are maximum utilisation of space and ensuring smooth workflow. Peron et al. (2020) stated that digital FLP methods can help with design efficiency and environmental and sustainability goals, as the focus on digitisation and sustainability grows. The layout of the facility is important not only for manufacturing but also for other aspects. For instance, Mishra (2024) reported on its role in healthcare services and emphasised the importance of a hospital managing patient flow and utilising resources effectively. Rubbo and Cecconello (2025) stated that changing the layouts can significantly improve the operational throughput in the Beverage Machinery sector.
Amar and Abouabdellah (2016) also developed a method to check the reliability of a layout design. They reported that a well-structured evaluation can improve both performance and safety. All of the aforementioned studies support the idea that Facility Layout Planning (FLP) is more than just placing machines in the right locations. It also means ensuring that the layout strategy aligns with the organisation’s broader goals, such as productivity, flexibility, and sustainability.
2.1 Traditional and modern layout evaluation techniques
The approach to evaluating facility layouts, along with the tools involved, has changed considerably over the years. They have transformed from simple trial-and-error methods to more structured, model-driven approaches/tools. Ahmad et al. (2004) divided the main parts of layout planning into preferences, constraints, and evaluation goals. This set the stage for more analytical methods to be involved in layout planning.
One of the most well-known, old-fashioned methods of layout planning is known as the Systematic Layout Planning (SLP). Jasrotia and Sengottaiyan (2024) discussed how the SLP method works appreciably well for changing the layouts of buildings to meet today’s standards and benchmarks. Gao et al. (2023) took a step further by combining SLP with a simulation tool, particularly in agriculture, to enhance process efficiency and optimise resource utilisation. Liu and Zhao (2015) also discussed the importance of SLP for planning logistics centres.
In the last few years, a clear trend has been observed towards using more advanced decision-making methods in modern practices (Ojha et al., 2024; Kumar et al., 2024; Basu et al., 2024; Sharma et al., 2024; Rani et al., 2023; Bhatia et al., 2024). Shahin and Poormostafa (2011); Singla, 2025), for example, combined simulation techniques with quality tools to make better layout decisions. This demonstrates how computational tools can be used in conjunction with qualitative assessments. Sharma and Singhal (2016) also used MCDM evaluation techniques to analyse different layout options. Thus, from these studies, it can be inferred that combining systematic models with mathematical approaches not only enhances the efficiency of the layout but also facilitates a more transparent decision-making process.
2.2 Use of FAHP and TOPSIS in facility layout planning
The Fuzzy Analytic Hierarchy Process (FAHP) is a valuable tool for planning building layouts, particularly when uncertainties exist or expert opinions are unreliable. Lin and Wang (2019), for instance, demonstrated how FAHP can enhance the design of operating rooms in healthcare by considering the reliability of personnel. Rodriguez and Oliveira (2022) also combined FAHP with VIKOR to enhance Systematic Layout Planning (SLP) (SLP), resulting in a multi-dimensional evaluation model.
Suman et al. (2021) employed FAHP to determine the optimal locations for facilities in the Bangladeshi furniture industry, demonstrating its applicability in various contexts. Agarwal and Singholi (2018) also analysed different combinations, such as AHP-TOPSIS and FAHP-FTOPSIS. They found the FAHP-based methods to be more flexible and accurate. In 2017, Sharma and Singhal used the fuzzy TOPSIS method to choose a procedural approach for layout design. In 2024, İnce and Taşdemir employed a hybrid FAHP method to plan furniture sector activities, utilising the CORELAP tool for support. These and many other studies demonstrate that FAHP can be utilised independently or in conjunction with other tools and methods. This makes it a highly flexible method for dealing with subjective data in various fields, including decisions about facility layout.
The TOPSIS method is a proven and effective approach for making decisions with multiple criteria. Its main objective is to determine the best option by analysing how far each option is from both the best and worst solutions. Ding developed an early model in 2011 that utilised fuzzy data in TOPSIS, making it particularly valuable in situations where information was unclear. In 2010, Torfi and his team created a hybrid model that combined Fuzzy AHP and TOPSIS. This demonstrated that it could weigh and rank options simultaneously.
In a recent study by Alshamrani et al. (2023), a new approach to sustainability in renewable energy was developed, called the BWM-TOPSIS-I hybrid approach. Li et al. (2023) employed an NR-TOPSIS-based method that integrated simulation and entropy weighting to enhance the layouts of container terminals. The flexibility of the TOPSIS method was utilised by Liu et al. (2024) in their application to the layouts of construction project sites.
Sirbiladze et al. (2021) developed a selection index that utilises fuzzy TOPSIS to aid in planning emergency facilities. Dresanala et al. (2023) demonstrated the effectiveness of TOPSIS in conjunction with traditional layout methods by integrating it with systematic layout planning, thereby achieving a sustainable layout design (Firouz et al., 2025).
2.3 Application of the entropy method
The entropy method is a popular approach for determining objective weights in MCDM problems, particularly when dealing with data that changes without human bias. Van Dua et al. (2024) demonstrated the value of the method in selecting materials by combining it with other objective weighting methods to enhance consistency.
According to Libório et al. (2024), entropy enhances the utility of composite indicators when they are combined with an expert opinion. Ali et al. (2024) employed Shannon entropy in conjunction with fuzzy VIKOR to rank risks in industrial experiments as part of their risk assessment work. Similarly, Shemshadi et al. (2011) demonstrated the use of entropy in supplier selection, providing a clear example of its applicability beyond layout planning.
Wu et al. (2022) looked at the differences between entropy and principal component analysis and concluded that entropy is better at making weight assignments clearer. Wang et al. (2022) employed this method to assess transportation sustainability, while Balcerzak (2020) applied entropy with TOPSIS to evaluate institutional quality across EU countries. These examples demonstrate that entropy weighting is a flexible and reliable method for objectively evaluating various decision-making scenarios. Table 1 represents a summary of the literature review conducted for the work presented in this scientific journal.
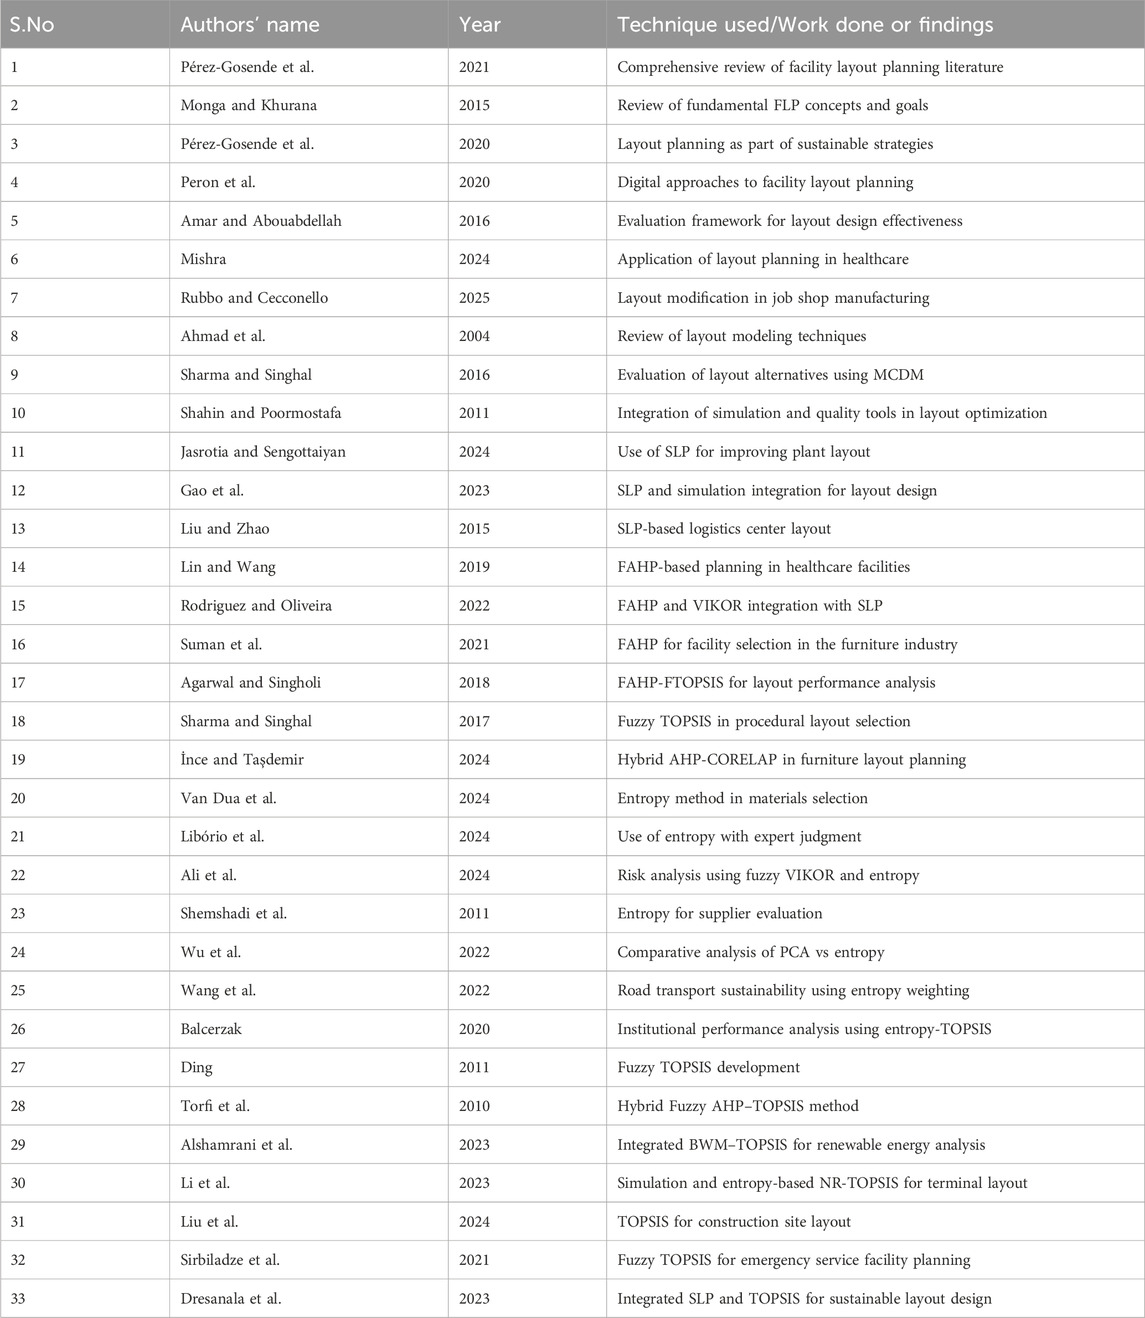
Table 1. Tools and techniques used by researchers.
3 Research methodology
This section focuses on the hybrid decision-making framework employed in the study, which comprises the Fuzzy Analytic Hierarchy Process (FAHP), Entropy weighting, and the Technique for Order of Preference by Similarity to Ideal Solution (TOPSIS). There are three main steps to the approach: using FAHP and Entropy to figure out the weights of the criteria, followed by using TOPSIS to compare different layout options. Using both subjective (FAHP) and objective (Entropy) weights provides a fair and accurate assessment of options.
3.1 Identification of criteria and alternatives
Based on expert discussions and observations from the industrial cases, three qualitative criteria were identified as critical in layout planning:
• Flexibility of the layout (C1): how well the layout can adapt to changes in production needs, material flow, and the arrangement of equipment.
• Shop Floor Utilisation (C2): Making the best use of the available floor space, including space for moving around, expanding, and moving materials.
• Ergonomics (C3): The design of the workplace that makes it easier to supervise workers, keeps them safe and comfortable, and reduces physical strain while increasing productivity.
Five layout alternatives (L1 to L5) were considered, each representing a distinct arrangement of machines and departments within the existing floor area.
The choice of just three qualitative criteria was not random. It is required to be focused and clear about the expectations of expert evaluation. The criteria, such as Layout Flexibility, Shop Floor Utilisation, and Ergonomics, were established by conducting preliminary interviews with experts and identified as the main drivers of the performance in the chosen industrial case. Omitting factors may make the experiment cumulatively less influential and result in a lower consistency of the comparisons between pairs. Furthermore, the three criteria represent a significant concern to the company: flexibility of operations, space utilisation, and employee comfort, which have been mentioned among the key points during previous audits. The criteria (C1: Layout Flexibility, C2: Shop Floor Utilisation, C3: Ergonomics) were finalised based on expert consultations and prior internal audits, which identified these factors as the most critical to the company’s operational performance.
3.2 Fuzzy Analytic Hierarchy Process (FAHP)
The FAHP was selected for this study because it incorporates fuzzy logic into traditional AHP, allowing expert judgments to be expressed with linguistic terms rather than precise numbers. This is particularly useful in layout planning, where human evaluations are often uncertain or subjective. The FAHP method is an expansion of the common AHP involving the use of fuzzy logic to solve the ambiguity and imprecision in human judgment. In real-life-based decisions, such as in layout design, professionals will be very slow or inconsistent in providing precise numbers in their preferences. FAHP enables decision-makers to employ linguistic (e.g., moderately more important) variables that are transformed to triangular fuzzy numbers (TFNs), denoting the scope of the uncertainty.
This research has followed the extent analysis technique of Chang wherein fuzzy synthetic extent measures are calculated per criterion. The following steps are:
Step 1: Hierarchical Structuring - the decision goal (optimal layout selection) has been prioritised to the top level, criteria (C1C3) at the middle level and layout alternatives (L1,L5) at the bottom level.
Step 2: Fuzzy Pairwise comparison matrix- Experts were asked to compare criteria in linguistic terms, which were converted into TFNs (see Table 2). Symmetric fuzzy numbers (such as (2,3,4) in moderately more important) make it easy to perform the calculation and spreads on both sides of the central point. To remain consistent with the Saaty scale, the terminal linguistic set was defined as (9, 9, 9). This choice avoids extrapolation beyond the scale and reduces ambiguity at the upper bound.
Step 3: Calculation of Fuzzy Synthetic Extent Analysis- Performed comparison extent analysis with each of the fuzzy comparisons to obtain relative importance.
Step 4: Defuzzification and Normalisation- Final weights were obtained after obtaining crisp values by use of the centroid method and normalisation.
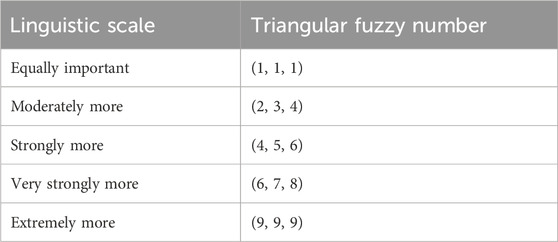
Table 2. linguistic scale and respective fuzzy number.
This method offers mathematical completeness and meaning by having symmetric fuzzy sets. Doing so (keeping the lower and upper bounds at the same distance as the modal value) makes the comparisons easier. The comparisons become more understandable and less biased, particularly in a group decision-making scenario.
Experts use words like “equally important” and “moderately more important” to compare criteria. These words are then turned into triangular fuzzy numbers (TFNs). Table 2 shows the linguistic scale below:
The fuzzy numbers in Table 2 are symmetric triangular fuzzy numbers. Hence, the mode (supposedly accurate judgment) is at the centre between the low and the high value. This symmetry eases the process of comparison and depicts that the doubt of expert opinions is balanced. Symmetric sets provide consistency in their respective group decision-making, and less bias in their calculations might occur in terms of overly-skewed calculations of preferences.
In the context of the current research, the expert contribution was obtained throughsystematic interviewing and in situ communication with experienced staff. Five experts working in the production and planning departments in the plant were chosen; they had at least 7 years of experience in layout planning, operations, or ergonomics. These specialists were requested to do two-by-two comparisons with the help of the linguistic scale, which is presented in Table 2. The geometric mean of the judgments was taken to build the fuzzy pairwise matrixusingthe fuzzy AHP process.
3.3 Entropy weighting method
The entropy method is a set of methods that are based on mathematical calculations to find objective weights according to the level of information and variation in the dataset. In contrast to FAHP, which makes use of human assessment, Entropy uses only the variance of information in its alternatives. A criterion that allows a wide range of differences between options contains more information and consequently will have a greater average weight.
The following steps were applied:
Step 1: Construct the Decision Matrix: Using the raw scores provided by experts for each layout across all criteria.
Step 2: Normalise the Matrix: Ensures uniformity by scaling the data between 0 and 1.
Step 3: Calculate Entropy (Ej): Measures the uncertainty associated with each criterion.
Step 4: Compute Degree of Diversification (dj = 1 – Ej): Captures how varied the values are.
Step 5: Calculate Final Entropy Weights (wj = dj/∑dj): Higher variation leads to greater weight.
Entropy weights indicate the original information provided by each of the criteria in order to clarify the differences between alternatives. Combining the FAHP (subjective expert judgment) and the Entropy (objective variation) in the present research results in a more balanced and reliable decision-making framework. An illustrative example of the entropy weight calculation is provided in Section 4.3 before Table 3.
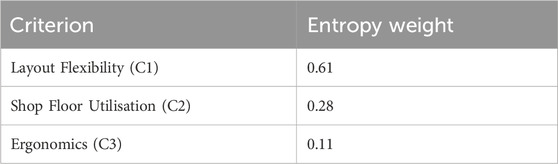
Table 3. Criterion and respective entropy weight.
3.4 Hybrid weight calculation
To ensure a balance between expert judgment and data-driven analysis, the final weight for each criterion is calculated using a simple average of FAHP and Entropy weights:
3.5 TOPSIS method for layout ranking
Using the final weights, TOPSIS ranks the different layout options. The method includes:
Step 1: Make the Weighted Normalized Matrix
To get the final weight for each criterion, the normalized values are multiplied by the final weight.
Step 2: Find the Positive Ideal Solution (PIS) and the Negative Ideal Solution (NIS).
PIS is the best value for each criterion, and NIS is the worst.
Step 3: Find the Euclidean Distances between PIS and NIS
Step 4: Find the Relative Closeness (Ci)
Step 5: Put the options in order of preference
Alternatives are ranked from highest to lowest based on their Ci values. The layout with the highest Ci is thought to be the best.
3.6 Research flow and model architecture
The hybrid model suggested has an orderly pattern that is predictable in the process of assessing the alternatives of layouts. The flow of the localised research that was conducted in this study is represented in Figure 6, as an FAHP, Entropy and TOPSIS method. The steps are:
Step 1: Definition of Evaluation Criteria and Layout Alternatives
Three qualitative characteristics (Layout Flexibility, Shop Floor Utilisation, Ergonomics) were chosen according to the consultation with specialists.
Step 2: Weighting of criteria
The importance weights of criteria were determined with both FAHP (subjective) and Entropy (objective) methods, which were used separately.
Step 3: Calculation of Hybrid Weight
The results of the final criterion weights were obtained through the average of FAHP and the Entropy values.
Step 4: TOPSIS Alternative Evaluation
The TOPSIS method was applied to the five alternatives of layouts, considering the hybrid weights.
Step 5: Ranking and Validation
The ranking of layouts was done according to the scores obtained using TOPSIS, and outcomes were verified by the VIKOR method.
The flowchart (Figure 1) illustrates the integration of MCDM techniques. FAHP (subjective weights) and Entropy (objective weights) are applied independently to determine criterion weights, which are then averaged to form the hybrid weights. This ensures transparency in the process before applying TOPSIS for ranking.
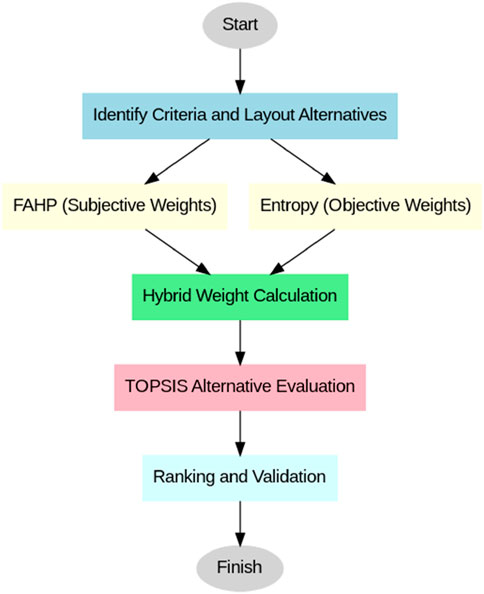
Figure 1. Research methodology flowchart.
4 Case study and application
4.1 Problem description
To use the suggested FAHP–Entropy–TOPSIS framework, a small-scale automotive parts manufacturing unit near Majholi village in Himachal Pradesh, India, was selected for case study analysis. The company manufactures precise parts for several tractor manufacturers in the United States Over time, the management observed that operations were not running as smoothly as they should have been. For example, the production flow was inflexible, floor space was not being utilised to its full potential, and it was challenging to monitor what was happening on the shop floor. The current layout of the facility was to blame for these problems.
There are 15 sections in the production unit, each with 40 different machines. The shop floor is a rectangle that is 39 × 25.2 m2. To address these issues, five different layout designs were proposed: L1, L2, L3, L4, and L5. The goal was to rate these layouts on three qualitative scales:
• Flexibility of layout (C1)
• Use of shop floor (C2)
• Ergonomics (C3)
Figures 1–6 show these five layout options. In Figures 1–6, the alphabets represent different machines and functional areas within the facility. For clarity, the codes used in the figures correspond to specific machines or sections as shown: L (Lathe), G (Grinding), Gs (Gear Slotting), Gsp (Gear Shaping), GTR (Gear Tooth Rounder), S, I (Store and Inspection), L1 (Extra Space), C (CNC), Dr (Drilling), VMC (Vertical Milling Machine), HMC (Horizontal Milling Machine), O (Office), M (Milling), Bo (Boring), and Hb (Hobbing). This coding was used consistently in all layout diagrams for simplicity and to maintain readability.
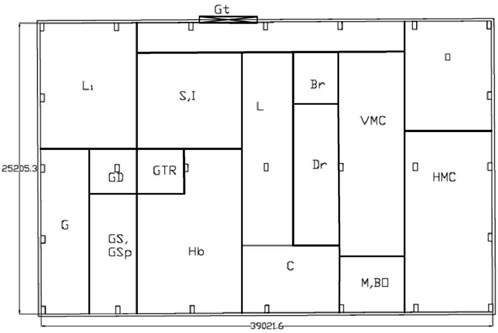
Figure 2. Layout 1 for the selected industry.
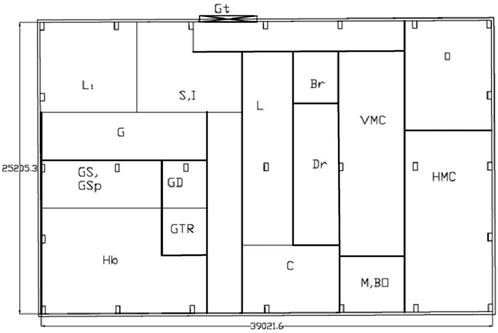
Figure 3. Layout 2 for the selected industry.
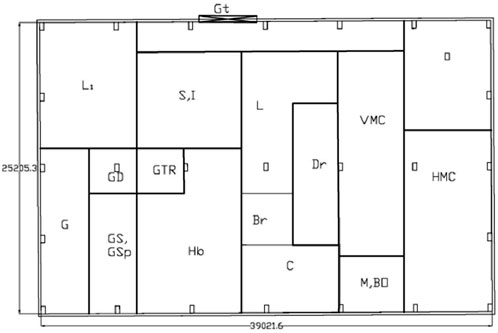
Figure 4. Layout 3 for the selected industry.
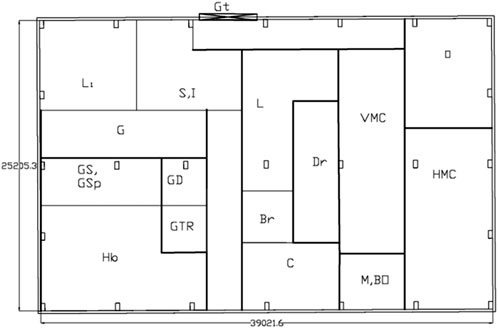
Figure 5. Layout 4 for the selected industry.
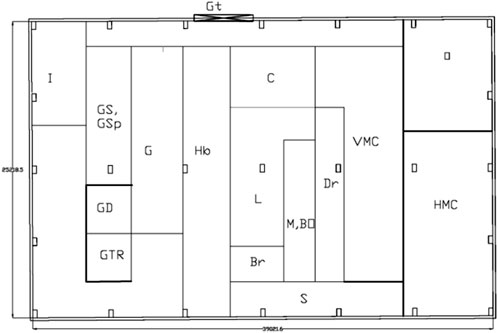
Figure 6. Layout 5 for the selected industry.
Even though the present research does not formally distinguish between make-to-order (MTO) and make-to-stock (MTS) systems, the company in question presents the attributes of a hybrid production model, as both custom components and standardised ones are produced. Layout decisions are also increasingly critical in such flexible environments because batch sizes can change frequently, there is much retooling and demand changes. To this end, the suggested layout structure will support both these types of production flows as it incorporates the nature of flexibility, space utilisation, and ergonomic effectiveness.
4.2 FAHP-based criteria weight calculation
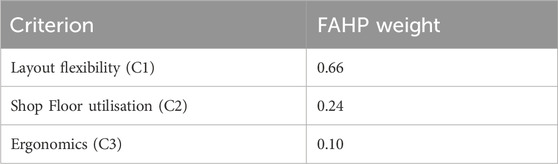
A group of five experts from the plant operations team used triangular fuzzy numbers to compare the three criteria in pairs. The FAHP-based weights that were obtained after fuzzy synthesis and defuzzification (see Section 3.2 for more information on the method) were as follows:
4.3 Entropy-based criteria weight calculation
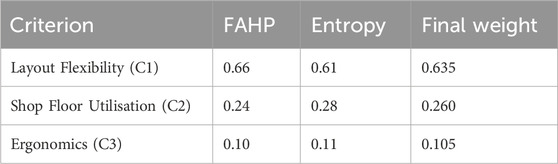
The normalised decision matrix was developed using performance scores of each layout against the three criteria, based on structured inputs from plant supervisors. Using entropy calculations (as explained in Section 3.3), the following entropy weights were derived: Table 3 shows the Criterion and respective entropy weight. For illustration, the normalised decision matrix was constructed using expert scores. Entropy values Ej were calculated using Ej = –k Σ (pij ln pij), where pij is the normalised performance of alternative i on criterion j and k is a constant. The degree of diversification (dj) was then obtained as dj = 1 – Ej. Finally, the entropy weights (wj) were derived by dividing dj by Σdj. For instance, for Layout Flexibility (C1), the calculated entropy was 0.39, leading to dj = 0.61 and wj = 0.61.
4.4 Final weights (hybrid FAHP–Entropy)
The final hybrid weights for the three criteria, obtained by averaging the FAHP and Entropy values, are:
4.5 Layout alternatives evaluation
Experts rated each of the five layout alternatives against all three criteria using a scale of 1–9 (1 = worst performance, 9 = best). The performance matrix is shown below (Table 4):
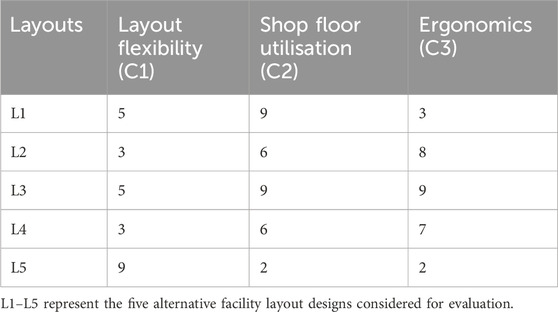
Table 4. Initial decision matrix (raw scores).
This matrix is then normalised, and each value is multiplied by the corresponding final criterion weight to generate the weighted normalised matrix, which will be used in the TOPSIS method.
4.6 TOPSIS implementation
Using the normalised and weighted data, the following steps are completed:
• Positive Ideal Solution (PIS): Best values in each criterion
• Negative Ideal Solution (NIS): Worst values in each criterion
• Euclidean Distances (D+ and D-): Distance from PIS and NIS
• Relative Closeness (Ci): Calculated for each layout
4.7 Interpretation of results
The TOPSIS analysis revealed that Layout 5 was the optimal design, as it achieved the highest score in Layout Flexibility, which was the most significant factor in the decision-making model. It did not do as well in terms of Shop Floor Utilisation and Ergonomics, but its adaptability made it the best option overall.
Layout 3 came in second, doing well on all criteria, especially Ergonomics. Layout 4 came in last, which means it might not be able to meet the plant’s current needs.
5 Results and discussion
The findings of this study provide a structured and data-backed method to choose the best layout for a small-scale manufacturing facility. The proposed method combines FAHP, Entropy, and TOPSIS to deal with both subjective expert judgments and objective data variability. This makes the decision-making process more balanced and reliable.
The Layout Flexibility received the most weight (0.635) of the three chosen qualitative factors, which clearly highlights its importance in the organisation. This indicates that the company should be able to adjust its production schedules, cater to the needs of individual clients, and relocate machinery without requiring a complete reconfiguration of its operations. Shop Floor Utilisation was the second most important factor (0.260), which shows how important it is to make good use of space for moving, storing, and possible growth. From the point of view of worker safety and comfort, ergonomics was the least important factor (0.105), which may have been because the company was focused on manufacturing the finished product as quickly as possible. Table 5 represents final TOPSIS ranking. Using (9, 9, 9) for the terminal TFN produced negligible changes in FAHP weights and did not affect the rank order reported in Tables 6–8.
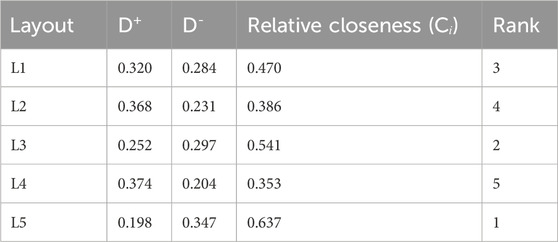
Table 5. Final TOPSIS ranking results.
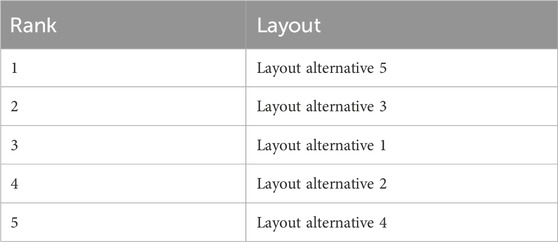
Table 6. Final results.
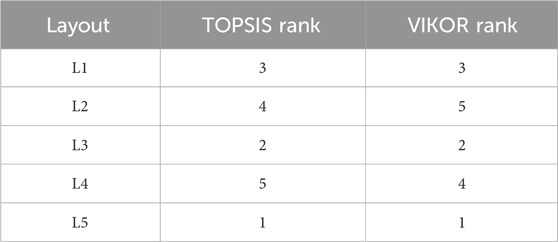
Table 7. Comparison of layout rankings using TOPSIS and VIKOR.
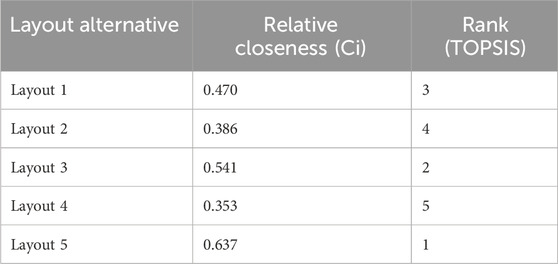
Table 8. Summary of layout scores and rankings.
5.1 Layout ranking and performance
The TOPSIS method indicated that Layout 5 was the best choice, as it had the highest relative closeness score (0.637). This layout did not perform well in terms of Shop Floor Utilisation or ergonomics, but it excelled in Layout Flexibility, which was the most important factor. This result aligns with the company’s goal of minimising production delays and enhancing flexibility in routing and machine arrangements.
Layout 3 came in second place, achieving a balanced score on all three criteria, and excelled in Ergonomics. If the organisation decides to focus on worker-centred improvements or overall balance in the future, this layout would be a good choice.
On the other hand, Layout 4 consistently scored low on all criteria, which gave it the lowest overall rank. This illustrates the importance of having a layout plan that does not make excessive sacrifices in any one parameter. The term Ci represents the relative closeness coefficient in the TOPSIS method, calculated as the ratio of the distance of each alternative from the negative ideal solution to the sum of its distances from both the positive and negative ideal solutions.
Figure 7 shows the closeness rating of the different layouts. It can be observed from the figure that Alternative 5 has the highest value, and Alternative 4 has the lowest value.
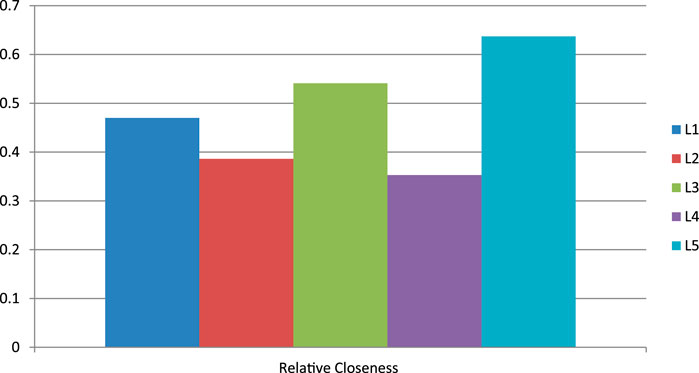
Figure 7. Closeness rating of various alternatives.
Table 6 shows the final ranking, which was developed from the Relative Closeness value. Each layout has been developed through the SLP method, and from this table, it can be analysed that alternative 5 is in the first position. The company’s existing layout ranks third.
The results obtained from the current study have been validated by implementing another MCDM approach. For this purpose, the VIKOR technique has been used. To enhance the strength of the results and authenticate those obtained through the TOPSIS method, the same dataset was processed using VIKOR. This technique is designed to discover a compromise solution by balancing between the maximum group utility and the minimum regret of the judgment maker. The final layout ranking obtained using VIKOR is revealed in the table below (Table 7).
The results were validated using the VIKOR method, which produced a consistent ranking where Layout 5 also emerged as the best alternative. This cross-method validation enhances the reliability of the outcome.
The results of the VIKOR implementation verify the ascendancy of Layout 5, which again came at the rank one among the available layouts. Layout 3 also comes in second position, as indicated by the TOPSIS results, which demonstrate its reliable performance compared to both methods. On the other hand, it was observed that for layouts 2 and 4, VIKOR ranked layout two as the least enviable instead of layout 4.
Table 8 represents a summary of relative closeness scores and the corresponding rankings to clarify the results.
It was found that there were some shifts in the lower-ranked layouts (rank 4 and rank 5), while the top-ranked alternatives remained unchanged (rank 1, rank 2, rank 3), which supports the reliability of the decision-making model. This validation of the results demonstrates that the final decision is not dependent on a single method/technique and that the hybrid approach implemented in this study is sound and repeatable. Figure 8 shows a comparison of the results. It also provides the organisation with an extra level of confidence that the recommended layout alternative 5 is robust under multiple evaluation frameworks. The following diagram shows the comparison of the ranks obtained from both the MCDM techniques.
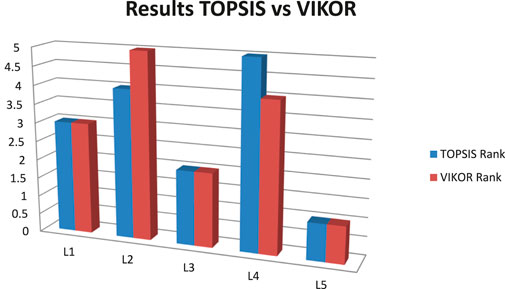
Figure 8. Comparison of the results (TOPSIS vs. VIKOR) (Lower the best).
5.2 Practical implications
Making smart, efficient layout decisions is very important for small-scale manufacturing businesses, especially those with limited space and money. The suggested FAHP–Entropy–TOPSIS framework lets decision-makers:
1. Take into account both human expertise and data variability,
2. Change the model as the priorities change (for example, moving the focus from productivity to ergonomics), and
3. Compare options in an open manner by using structured logic.
The method can be used for more than just choosing a layout. It can also be used for other complicated problems with many factors, like deciding which equipment to prioritise, when to schedule maintenance, or how to evaluate vendors. The results were verified by comparing expert judgments through FAHP with the data-driven Entropy values. The close agreement in criterion rankings between both methods enhances confidence in the final results. Moreover, the use of TOPSIS, which considers both ideal and worst-case solutions, helps identify not only the best alternative but also understand how far each alternative is from optimal conditions.
The achieved hybrid FAHP Entropy TOPSIS model has a much more systematic and repeatable structure in terms of decision-making when compared to the design techniques currently leveraged in traditional layout planning, which frequently are based on judgment or a test-and-experimentation approach. It is a mix of people’s experiences and objective evaluation. It minimises bias and can be reapplied to assess plans forfuture layout or any other management decision that involves the same type of multi-criteria complexity. Although the case application in this study is from the automobile parts industry, the proposed FAHP–Entropy–TOPSIS framework can be applied to other small- and medium-scale industries such as electronics, textiles, or furniture manufacturing, where multiple criteria influence facility layout decisions.
6 Conclusion and future scope
The paper introduces a hybrid model of decision-making consisting of FAHP, Entropy, and TOPSIS with the aim of finding a better layout selection in a small-scale manufacturing plant. The strategy addressed three qualitative variables considered important for the shop floor’s performance: flexibility of layouts, space, and ergonomics. A car parts manufacturing unit that was experiencing problems with space utilisation, adaptability, and operational inefficiencies examined five different layout options.
The results showed that Layout 5 was the best choice because it was the most flexible, as determined by expert evaluation and entropy-based analysis. Even though Layout 5 did not perform as well on other tests, it was a good choice for a production environment that required frequent changes and dynamic workflows.
The proposed model successfully balanced human intuition and quantitative rigour by using fuzzy logic, objective weighting, and proximity-based ranking. It provided a structured method that can be used to solve various decision-making problems in manufacturing and other fields where multiple qualitative and quantitative criteria are present.
6.1 Limitations
Although the presented model offers a ready-made and systematic approach to facility layout, its limits should be critically analysed. On the one hand, the study only examined the qualitative dimensions of the indicators of space organisation (flexibility, use and utilisation, and ergonomics), rather than the quantitative parameters of the production flow, distance, or price. Secondly, it is a single case study that used the model in the automotive parts industry. This can be a limitation regarding the findings, as it may be difficult to synchronise with other industrial sectors. Moreover, despite the use of fuzzy logic, there can still be certain subjectivity in the expert inputs, which are valuable but not entirely objective. Even though fuzzy logic is designed to manage uncertainty through graded truth values, the construction of those rules and membership functions still relies heavily on expert judgments. The above limitations represent areas in which future studies can be conducted to expand the model’s applicability.
6.2 Future scope
The work presented in this study has a significant potential for further development and refinement through subsequent research:
• Adding Quantitative Factors: Future studies could use measurable data like throughput time, material flow cost, and distance travelled to make a more complete assessment that includes both qualitative and quantitative factors.
• Sensitivity Analysis: Performing a sensitivity analysis on the weights of the criteria could helpdetermine how changes in importance affect the final rankings of layout options.
• Comparison with Other MCDM Methods: To validatethe strength and consistency of the results, one could use and compare other models like VIKOR, COPRAS, or Grey Relational Analysis.
• Real-time Implementation: The chosen layout can be put into action on the shop floor, and then performance metrics can be tracked to make sure that the decision made by the proposed framework was the right one.
Data availability statement
The raw data supporting the conclusions of this article will be made available by the authors, without undue reservation.
Author contributions
PS: Conceptualization, Formal Analysis, Methodology, Software, Writing – original draft. KG: Conceptualization, Data curation, Investigation, Software, Writing – original draft. LC: Conceptualization, Methodology, Validation, Writing – review and editing. NR: Methodology, Software, Visualization, Writing – review and editing. AK: Conceptualization, Formal Analysis, Investigation, Supervision, Writing – original draft, Writing – review and editing. SY: Data curation, Software, Visualization, Writing – review and editing. VS: Formal Analysis, Methodology, Software, Supervision, Writing – review and editing. RP: Investigation, Methodology, Supervision, Validation, Writing – review and editing.
Funding
The author(s) declare that financial support was received for the research and/or publication of this article. The authors extend their acknowledgment to the financial support of the European Union under the REFRESH-Research Excellence For REgion Sustainability and High-tech Industries project number CZ.10.03.01/00/22_003/0000048 via the Operational Programme Just Transition and has been done in connection with project Students Grant Competition SP2025/062 „Specific research on progressive and sustainable production technologies” and SP2025/063 „Specific research on innovative and progressive manufacturing technologies” financed by the Ministry of Education, Youth and Sports and Faculty of Mechanical Engineering VŠB-TUO.
Conflict of interest
The authors declare that the research was conducted in the absence of any commercial or financial relationships that could be construed as a potential conflict of interest.
Generative AI statement
The author(s) declare that no Generative AI was used in the creation of this manuscript.
Any alternative text (alt text) provided alongside figures in this article has been generated by Frontiers with the support of artificial intelligence and reasonable efforts have been made to ensure accuracy, including review by the authors wherever possible. If you identify any issues, please contact us.
Publisher’s note
All claims expressed in this article are solely those of the authors and do not necessarily represent those of their affiliated organizations, or those of the publisher, the editors and the reviewers. Any product that may be evaluated in this article, or claim that may be made by its manufacturer, is not guaranteed or endorsed by the publisher.
References
Agarwal, D., and Singholi, A. K. (2018). Performance analysis of a FLP problem using AHP-TOPSIS and FAHP-FTOPSIS. Int. J. Industrial Syst. Eng. 30 (4), 401–424. doi:10.1504/ijise.2018.096159
Ahmad, A. R., Basir, O. A., Hassanein, K., and Imam, M. H. (2004). “Decision preferences, constraints, and evaluation objectives in layout design: a review of modeling techniques,” in Proc. of the 5th int’l conf. on op. and quan. Manag (ICOQM-V).
Ali, S. I., Lalji, S. M., Haider, S. A., Haneef, J., Syed, A. U. H., Husain, N., et al. (2024). Risk prioritization in a core preparation experiment using fuzzy VIKOR integrated with shannon entropy method. Ain Shams Eng. J. 15 (2), 102421. doi:10.1016/j.asej.2023.102421
Alshamrani, A., Majumder, P., Das, A., Hezam, I. M., and &Božanić, D. (2023). An integrated BWM-TOPSIS-I approach to determine the ranking of alternatives and application of sustainability analysis of renewable energy. Axioms 12 (2), 159. doi:10.3390/axioms12020159
Amar, S. H., and Abouabdellah, A. (2016). “Facility layout planning problem: effectiveness and reliability evaluation system layout designs,” in 2016 international conference on system reliability and science (ICSRS) (IEEE), 110–114.
Balcerzak, A. P. (2020). Quality of institutions in the European union countries. Application of TOPSIS based on entropy measure for objective weighting. ActaPolytechnicaHungarica 17 (1), 101–122. doi:10.12700/aph.17.1.2020.1.6
Basu, R., Das, M. C., Kumar, A., and Sarkar, B. (2024). Identifying and prioritizing quality 4.0 practices in sustainable manufacturing using rough number-based AHP-MABAC. CRC Press eBooks. Boca Raron: Taylor Francis, 135–165. doi:10.1201/9781003405870-8
Bhatia, V., Kumar, A., Sidharth, S., Khare, S. K., Ghorpade, S. C., Kumar, P., et al. (2024). “Industry 4.0 in aircraft Manufacturing: innovative use cases and patent landscape,” in Springer series in advanced manufacturing, 103–137. doi:10.1007/978-3-031-68271-1_5
Ding, J. F. (2011). An integrated fuzzy TOPSIS method for ranking alternatives and its application. J. Mar. Sci. Technol. 19 (4), 2. doi:10.51400/2709-6998.2174
Dresanala, M., Dewi, S. K., and &Utama, D. M. (2023). Sustainable layout design based on integrated systematic layout planning and TOPSIS: a case study. JurnalTeknikIndustri 24 (1), 51–64. doi:10.22219/jtiumm.vol24.no1.51-64
Firouz, M., Oroojlooy-Jadid, A., and Asef-Vaziri, A. (2025). Dynamic unequal area facility layout design under stochastic material flow, re-arrangement cost, and change period. Comput. & Industrial Eng. 203, 110971. doi:10.1016/j.cie.2025.110971
Gao, G., Feng, Y., Zhang, Z., Wang, S., and Yang, Z. (2023). Integrating SLP with simulation to design and evaluate facility layout for industrial head lettuce production. Ann. operations Res. 321 (1), 209–240. doi:10.1007/s10479-022-04893-z
İnce, M. N., and Taşdemir, Ç. (2024). Facility location selection and layout planning through AHP, PROMETHEE, and CORELAP methods in the furniture industry. BioResources 19 (3), 6478–6509. doi:10.15376/biores.19.3.6478-6509
Jasrotia, M. S., and Sengottaiyan, K. (2024). SLP (systematic layout planning) for enhanced plant layout efficiency. Int. J. Sci. Res. (IJSR) 13 (6), 820–827. doi:10.21275/sr24610212609
Kumar, S., Kumar, R., Phanden, R. K., Kumar, A., Bala, J., Kumar, S. B., et al. (2024). A study on critical failure factors for implementation of sustainable Lean six sigma from Indian manufacturing industries perspective using BWM technique. Front. Mech. Eng. 10, 1451568. doi:10.3389/fmech.2024.1451568
Li, X., Peng, Y., Guo, Y., Wang, W., and Song, X. (2023). An integrated simulation and AHP-entropy-based NR-TOPSIS method for automated container terminal layout planning. Expert Syst. Appl. 225, 120197. doi:10.1016/j.eswa.2023.120197
Libório, M. P., Karagiannis, R., Diniz, A. M. A., Ekel, P. I., Vieira, D. A. G., and Ribeiro, L. C. (2024). The use of information entropy and expert opinion in maximizing the discriminating power of composite indicators. Entropy 26 (2), 143. doi:10.3390/e26020143
Lin, Q., and Wang, D. (2019). Facility layout planning with SHELL and fuzzy AHP method based on human reliability for operating theatre. J. Healthc. Eng. 2019 (1), 1–12. doi:10.1155/2019/8563528
Liu, Y., and Zhao, Q. (2015). “Research on logistics center layout based on SLP,” in Proceedings of China modern logistics engineering: inheritance, wisdom, innovation and cooperation (Springer Berlin Heidelberg), 17–28.
Liu, Q., Zhang, P., Chen, L., and Ma, G. (2024). A comprehensive evaluation model with TOPSIS method for construction site layout of building projects and its applications. J. Urban Plan. Dev. 150 (3), 04024027. doi:10.1061/jupddm.upeng-4640
Mishra, V. (2024). Planning and selection of facility layout in healthcare services. Hosp. Top. 102 (1), 35–43. doi:10.1080/00185868.2022.2088433
Monga, R., and Khurana, V. (2015). Facility layout planning: a review. Int. J. Innov. Res. Sci. Eng. Technol. 4 (03), 976–980. doi:10.15680/IJIRSET.2015.0403027
Odeyinka, O. F., and Omoegun, O. G. (2023). “Warehouse operations: an examination of traditional and automated approaches in supply chain management,” in Operations management-recent advances and new perspectives (IntechOpen).
Ojha, V. K., Goyal, S., Chand, M., and Kumar, A. (2024). A framework for data-driven decision making in advanced manufacturing systems: development and implementation. Concurr. Eng. 32 (1–4), 58–77. doi:10.1177/1063293x241297528
Pérez-Gosende, P., Mula, J., and &Díaz-Madroñero, M. (2020). Overview of dynamic facility layout planning as a sustainability strategy. Sustainability 12 (19), 8277. doi:10.3390/su12198277
Pérez-Gosende, P., Mula, J., and &Díaz-Madroñero, M. (2021). Facility layout planning. An extended literature review. Int. J. Prod. Res. 59 (12), 3777–3816. doi:10.1080/00207543.2021.1897176
Peron, M., Fragapane, G., Sgarbossa, F., and Kay, M. (2020). Digital facility layout planning. Sustainability 12 (8), 3349. doi:10.3390/su12083349
Rani, S., Tripathi, K., and Kumar, A. (2023). Machine learning aided malware detection for secure and smart manufacturing: a comprehensive analysis of the state of the art. Int. J. Interact. Des. Manuf. (IJIDeM). doi:10.1007/s12008-023-01578-0
Rodriguez, A. R. S. C., and Oliveira, P. V. D. (2022). An extension of systematic layout planning by using fuzzy AHP and fuzzy VIKOR methods: a case study. Eur. J. Industrial Eng. 16 (1), 1–30. doi:10.1504/ejie.2022.119368
Rubbo, J., and Cecconello, I. (2025). Proposal to change the layout in a job shop environment in a beverage filling machinery industry. Sci. cum Ind. 14 (1), e251402. e251402-e251402. doi:10.18226/23185279.e251402
Shahin, A., and Poormostafa, M. (2011). Facility layout simulation and optimization: an integration of advanced quality and decision making tools and techniques. Mod. Appl. Sci. 5 (4), 95. doi:10.5539/mas.v5n4p95
Sharma, P., and Singhal, S. (2016). Design and evaluation of layout alternatives to enhance the performance of industry. Opsearch 53, 741–760. doi:10.1007/s12597-016-0257-6
Sharma, P., and Singhal, S. (2017). Implementation of fuzzy TOPSIS methodology in selection of procedural approach for facility layout planning. Int. J. Adv. Manuf. Technol. 88, 1485–1493. doi:10.1007/s00170-016-8878-8
Sharma, P., Ghatorha, K. S., Kang, A. S., Cepova, L., Kumar, A., and &Phanden, R. K. (2024). Strategic insights in manufacturing site selection: a multi-method approach using factor rating, analytic hierarchy process, and best worst method. Front. Mech. Eng. 10, 1392543. doi:10.3389/fmech.2024.1392543
Shemshadi, A., Shirazi, H., Toreihi, M., and &Tarokh, M. J. (2011). A fuzzy VIKOR method for supplier selection based on entropy measure for objective weighting. Expert Syst. Appl. 38 (10), 12160–12167. doi:10.1016/j.eswa.2011.03.027
Singla, V. (2025). An integrated systematic layout planning, analytical hierarchy process and nonlinear programming approach to facility layout design. Int. J. Operational Res. 52 (1), 128–145. doi:10.1504/ijor.2025.143960
Sirbiladze, G., Matsaberidze, B., Ghvaberidze, B., Midodashvili, B., and &Mikadze, D. (2021). Fuzzy TOPSIS based selection index in the planning of emergency service facilities locations and goods transportation. J. Intelligent & Fuzzy Syst. 41 (1), 1949–1962. doi:10.3233/jifs-210636
Stephens, M. P., and Meyers, F. E. (2013). Manufacturing facilities design and material handling. Purdue University Press, West Lafayette, IN: Pearson Education, Inc.
Suman, M. N. H., Md Sarfaraj, N., Chyon, F. A., and &Fahim, M. R. I. (2021). Facility location selection for the furniture industry of Bangladesh: comparative AHP and FAHP analysis. Int. J. Eng. Bus. Manag. 13, 18479790211030851. doi:10.1177/18479790211030851
Taherdoost, H., and Madanchian, M. (2023). Multi-criteria decision making (MCDM) methods and concepts. Encyclopedia 3 (1), 77–87. doi:10.3390/encyclopedia3010006
Torfi, F., Farahani, R. Z., and Rezapour, S. (2010). Fuzzy AHP to determine the relative weights of evaluation criteria and fuzzy TOPSIS to rank the alternatives. Appl. soft Comput. 10 (2), 520–528. doi:10.1016/j.asoc.2009.08.021
Van Dua, T., Van Duc, D., Bao, N. C., and &Trung, D. D. (2024). Integration of objective weighting methods for criteria and MCDM methods: application in material selection. EUREKA Phys. Eng. (2), 131–148. doi:10.21303/2461-4262.2024.003171
Wang, C. N., Le, T. Q., Chang, K. H., and Dang, T. T. (2022). Measuring road transport sustainability using MCDM-based entropy objective weighting method. Symmetry 14 (5), 1033. doi:10.3390/sym14051033
Keywords: manufacturing optimisation, multi-criteria decision-making, facility layout planning, TOPSIS, FAHP entropy weighting, layout flexibility, ergonomics
Citation: Sharma P, Ghatorha KS, Cepova L, Ray NM, Kumar A, Yadav SL, Schindlerova V and Phanden RK (2025) A hybrid FAHP–entropy–TOPSIS model for selecting the facility layout in small-scale manufacturing. Front. Mech. Eng. 11:1666571. doi: 10.3389/fmech.2025.1666571
Received: 15 July 2025; Accepted: 12 September 2025;
Published: 29 September 2025.
Edited by:
Debabrata Datta, Bhabha Atomic Research Centre (BARC), IndiaReviewed by:
Valerio Salomon, São Paulo State University, BrazilArbia Hlali, Taibah University, Saudi Arabia
Rishikant Mishra, Dr. B. R. Ambedkar National Institute of Technology Jalandhar, India
Anish Kumar, SAEL Industries Limited, India
Copyright © 2025 Sharma, Ghatorha, Cepova, Ray, Kumar, Yadav, Schindlerova and Phanden. This is an open-access article distributed under the terms of the Creative Commons Attribution License (CC BY). The use, distribution or reproduction in other forums is permitted, provided the original author(s) and the copyright owner(s) are credited and that the original publication in this journal is cited, in accordance with accepted academic practice. No use, distribution or reproduction is permitted which does not comply with these terms.
*Correspondence: Ajay Kumar, YWpheS5rdW1hcjMwODg2QGdtYWlsLmNvbQ==, YWpheS5rdW1hcjFAamFpcHVyLm1hbmlwYWwuZWR1
†ORCID: Ajay Kumar, orcid.org/0000-0001-7306-1902