 Dhonluck Manop1
 Panya Khaenamkaew
- 1Department of Basic Science and Physical Education, Faculty of Science at Si Racha, Kasetsart University, Si Racha Campus, Si Racha, Chonburi, Thailand
- 2Department of Nautical Science and Maritime Logistics, Faculty of International Maritime Studies, Kasetsart University, Si Racha Campus, Si Racha, Chonburi, Thailand
- 3Department of Resources and Environment, Faculty of Science at Si Racha, Kasetsart University, Si Racha Campus, Si Racha, Chonburi, Thailand
- 4Policy and Strategy Department, National Institute of Metrology, Ministry of Higher Education, Science, Research and Innovation, Phatumthani, Thailand
Introduction: The calibration of infrared thermometers (IRTs) in the frozen food industry is hindered by condensation on temperature reference sources in subzero environments, resulting in significant measurement errors and uncertainty.
Methods: This study investigated a novel closed-cylinder pneumatic calibration system designed to eliminate condensation using a controlled argon gas purge. The effects of gas pressure, flow rate, and measurement distance (operationalized as tube lengths of 30 cm, 50 cm, and 100 cm) on calibration accuracy were systematically evaluated.
Results: At a chamber temperature of –15 °C, the introduction of argon at 2 kg/cm2 and 25 L/min effectively prevented ice formation on the calibration target. The system yielded expanded uncertainties ranging from 0.62 °C to 0.74 °C across all temperature set points. The shortest tube length (30 cm) provided the highest precision with minimal correction required, while 50 cm offered a reliable alternative with slightly increased uncertainty. The 100 cm tube introduced greater variability due to an increased spot size and spatial non-uniformity.
Discussion: The results demonstrate that the sealed calibration system enables accurate and reproducible IRT calibration under subzero conditions, particularly at shorter distances. This solution is especially relevant for applications in frozen food logistics, where precision temperature monitoring is essential for product safety and quality assurance.
1 Introduction
Thailand is a major global supplier of frozen seafood, poultry, and processed goods. Accurate temperature monitoring during storage and transport is essential for ensuring product quality and food safety (Santiboon et al., 2024). Infrared thermometers (IRTs), widely used for non-contact temperature measurement, are crucial tools in maintaining cold-chain integrity (Brosnan and Sun, 2004). However, their accuracy depends on proper calibration. Even small deviations in temperature readings can lead to product degradation, rejection, or spoilage (Cui et al., 2020). Globally, poor cold-chain management contributes to an estimated 30% loss of perishable goods each year, amounting to USD 35 billion in economic impact (Canton, 2021). In the Thailand–United Arab Emirates (UAE) frozen food trade alone—valued at USD 500 million annually—temperature deviations of just 2 °C–3 °C above the −18 °C threshold can result in product downgrades or rejection, causing losses of USD 25–50 million annually (Santiboon et al., 2024; Bhujel, 2024; Randeree, 2019). These risks are compounded by microbial safety concerns and stricter import regulations (Quested et al., 2010).
Infrared thermometry relies on detecting thermal radiation emitted by an object, typically within the 8–14 μm spectrum, and converting it into a temperature reading (Cui and Xing, 2022). The fundamental principles of blackbody radiation (Barry et al., 2011), emissivity (Ko et al., 2009), infrared measurement equations (Cui and Xing, 2022), signal processing, and calibration techniques for temperature measurement have been well established in the literature (Cui et al., 2020). Because IRTs are non-contact instruments, they are particularly useful in environments where contamination or extreme conditions make contact thermometry impractical (ISO, 2017; Minkina and Dudzik, 2009).
However, accuracy depends on correctly accounting for emissivity—a material’s efficiency in emitting thermal radiation—which can be affected by surface moisture or frost (Cui and Xing, 2022; Struß, 2003; Kimball and Mitchell, 1984). At lower temperatures, infrared signal intensity decreases, making readings more sensitive to condensation, alignment error, and background radiation (ASTM, 2021; Liebmann, 2008a). One key challenge in ensuring reliable IRT performance is low-temperature calibration, which is often compromised by condensation or ice formation on blackbody reference sources (Cui and Xing, 2022; Ko et al., 2009). Moisture alters surface emissivity and introduces measurement error, particularly in humid or subzero environments. Traditional open-system calibrations using dry air or desiccants often fail to maintain stable, moisture-free conditions (Barry et al., 2011; Struß, 2003).
According to ASTM E2847, using a dry purge gas—such as nitrogen or dried air—can prevent vapor buildup around the calibration target in subzero conditions (ASTM, 2021). However, the standard does not prescribe a specific system design, leaving calibration environments open to variability (Cui and Xing, 2022). Most systems remain open to ambient air, limiting moisture control and repeatability. Therefore, accurate low-temperature calibration requires not only high-resolution detectors and stable blackbody sources but also controlled atmospheric conditions.
Liebmann greatly advanced infrared thermometer calibration, optimizing blackbody sources by demonstrating the critical role of cavity geometry, coating emissivity, aperture size, thermal uniformity, and optical alignment for radiance control and traceability, primarily at high temperatures (Liebmann, 2008a; Liebmann, 2008b; Liebmann, 2011; Skifton et al., 2018). While his design principles apply broadly, his work did not address condensation issues in subzero environments. Cui et al. investigated room-temperature calibration (20 °C–40 °C), identifying ambient radiation and surface reflections as major error sources, especially for low-emissivity targets. They proposed correction models and multi-point calibration to mitigate these errors (Cui et al., 2020; Cui and Xing, 2022); however, their focus remained on open systems near ambient temperature. Kimball and Mitchell used dry ice for subzero calibration but lacked environmental control, making their method susceptible to emissivity variation, ambient radiation, and condensation (Kimball and Mitchell, 1984). Collectively, these studies highlight the need for enclosed, humidity-controlled calibration systems for precise subzero applications such as cold-chain monitoring. As shown in Figure 1, even under laboratory conditions, frost readily forms on the calibration plate below freezing, substantially altering surface emissivity and causing measurement errors—underscoring the need for sealed, humidity-controlled calibration systems.
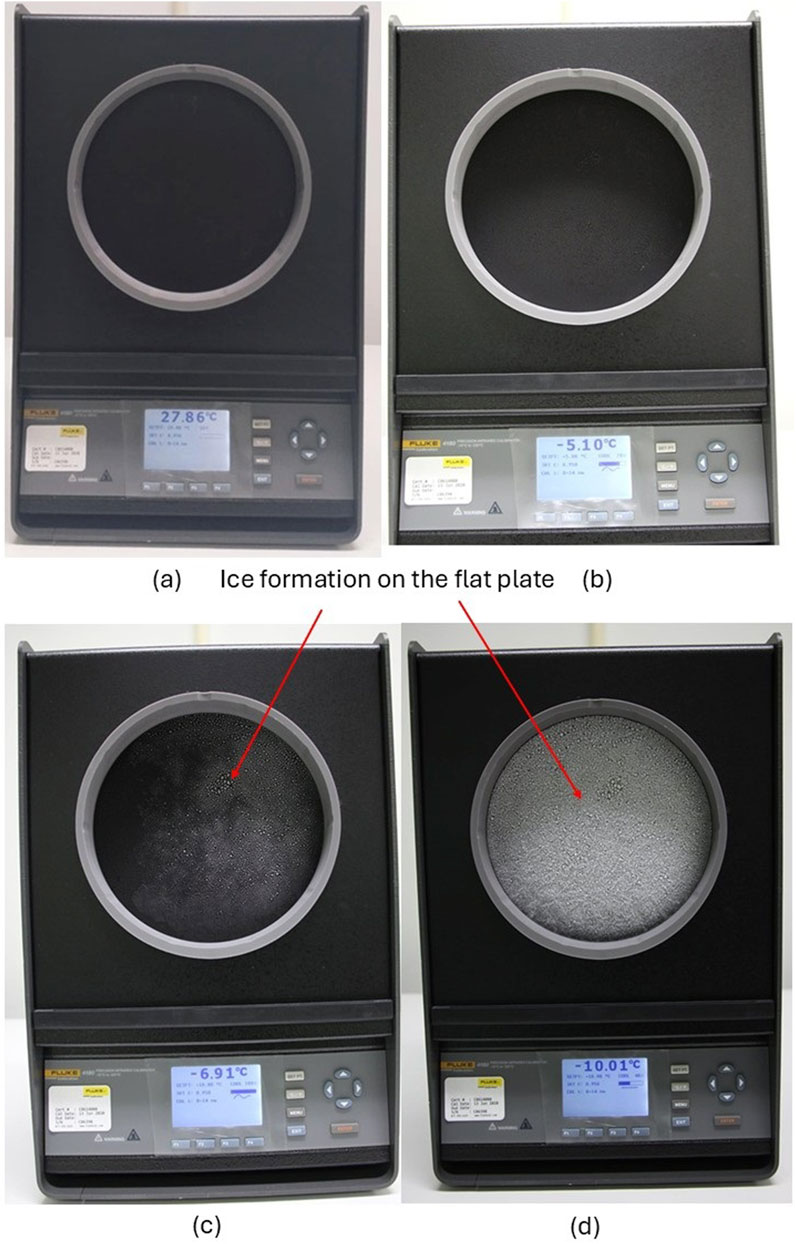
Figure 1. Ice formation on the surface of the Fluke 4180 calibrator under open-environment conditions at different temperatures: (a) 27.86 °C, no ice observed; (b) −5.10 °C, surface cooling; (c) −6.91 °C, onset of ice nucleation; and (d) −10.01 °C, complete ice coverage across the flat plate surface.
Despite efforts to mitigate this, existing methods remain insufficient under real-world conditions. The use remains underexplored of sealed systems and inert gas purging (such as with argon) (Kimball and Mitchell, 1984; Kolat and Liebmann, 2012). Additionally, the influence on calibration uncertainty has not been well documented of key parameters—such as gas flow rate, pressure, and measurement distance— (Cui et al., 2020; Cui and Xing, 2022; Grinzato, 2010). These gaps highlight the need for an improved calibration approach tailored to low-temperature applications.
This study investigated a sealed, closed-cylinder calibration system that uses argon gas to eliminate condensation-related calibration errors. By maintaining a humidity-free environment, the system is designed to improve the accuracy and repeatability of IRT measurements in subzero settings. Through systematic investigation of gas pressure, flow rate, and measurement distance, the current study aimed to define the optimal calibration conditions for IRTs used in cold-chain logistics. Such an outcome would fill a critical research gap at the intersection of gas dynamics, spatial configuration, and thermal uncertainty in infrared thermometry. While the focus was on frozen food exports—particularly the high-value Thailand-UAE cold-chain trade—the findings have broader relevance for any sector that relies on precise low-temperature monitoring, including pharmaceutical cold storage, cryogenic systems, and biomedical research (Radebaugh, 2016).
2 Equipment and methods
2.1 Standard thermal and radiation source
A large flat-plate source was used as the standard temperature and thermal radiation reference. The Fluke 4180 Precision Infrared Calibrator, operating from −15 °C to 120 °C, served as the primary calibration source—well suited for low-temperature applications such as those in the frozen food industry. Its uniform temperature distribution supports accurate calibration over the entire target area at a fixed distance. The device offers ±0.35 °C accuracy without emissivity correction and achieves a test uncertainty ratio of up to 4:1. At 23 °C ambient temperature and emissivity of 0.95, key specifications are:
• Display accuracy: ±0.40 °C at −15 °C and 0 °C
• Nominal emissivity: 0.95
• Target diameter: 152.4 mm
• Stability: ±0.10 °C at −15 °C; ±0.05 °C at 0 °C
• Wavelength range: 8–14 µm
The calibrator (Serial No. C06398) was certified by NVLAP (Certificate No. C0614008), ensuring traceability to international standards. Based on the literature (Joint Committee for Guides in Metrology, 2023; Müller et al., 2021), the emissivity of the flat-plate calibrator surface plays a critical role in ensuring measurement accuracy. Surface degradation—caused by contamination, thermal shock, or extended exposure to high temperatures—can greatly increase calibration uncertainty. Contact with oils, moisture, or forced air may alter the surface emissivity, particularly during heating or cooling cycles. To mitigate these effects, strict handling protocols and controlled environmental conditions were maintained throughout the calibration process to preserve the stability of the emissive surface.
2.2 Infrared thermometer under calibration
The Fluke 568 infrared thermometer was used as the thermometer under calibration (TUC). It operates over a wide temperature range and detects infrared radiation in the 0.7–20 µm wavelength band. With a 50:1 distance-to-spot (D:S) ratio and high optical resolution, it enables accurate non-contact measurements of small targets at varying distances. Designed for industrial use, it is suitable for heating ventilation and air conditioning (HVAC), mechanical, and electrical environments. For calibration, the emissivity setting was fixed at 0.95 to match the thermal radiation reference source.
2.3 Design for improvement
A closed-cylinder pneumatic calibration system was developed to prevent moisture condensation using argon gas flow. The system consists of an acrylic cylindrical tube with lengths of 30 cm, 50 cm, and 100 cm and a diameter of 15.24 cm. The left end of the tube is sealed to the Fluke 4180 IR Calibrator, while the right end is sealed to the Fluke 568 TUC, creating a sealed calibration environment.
As shown in Figure 2, this setup maintains a direct optical path between the TUC and the reference target within an inert, moisture-free atmosphere. The system comprises three main components:
1. Standard temperature source: the Fluke 4180 IR Calibrator, set at −15 °C, serves as the radiation reference source.
2. Cylindrical calibration chamber: the acrylic tube creates a sealed, inert gas environment to prevent condensation. Three different lengths (30 cm, 50 cm, and 100 cm) allow evaluation of calibration accuracy at varying D:S ratios and distances.
3. Thermometer under calibration (TUC): the Fluke 568 is precisely aligned at the opposite end, maintaining a stable measurement path to the calibration target. A continuous flow of inert gas (argon or nitrogen) is introduced to sustain a humidity-free internal environment.
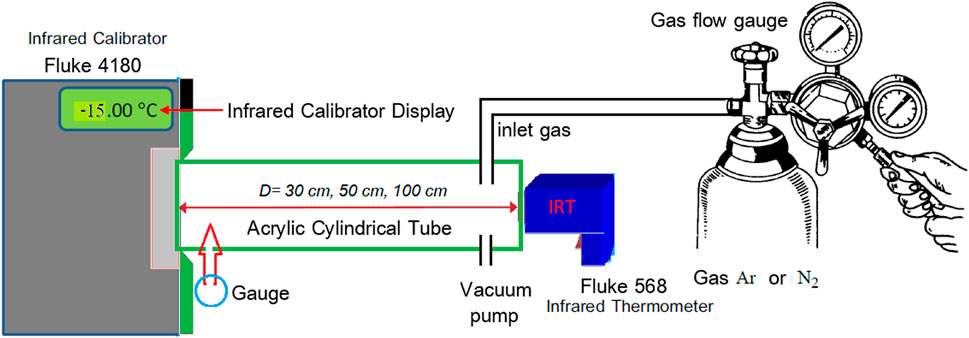
Figure 2. Schematic diagram of experimental setup for infrared thermometer calibration.
This sealed design enhances calibration accuracy by eliminating the impact of ambient humidity and reducing emissivity distortion due to ice or moisture formation.
2.4 Optimization of gas pressure and flow rate
The effects of gas pressure and flow rate were systematically evaluated to identify the optimal conditions for condensation-free calibration. Argon and nitrogen gases were introduced to purge the calibration chamber, with ranges in the pressures of 1.0–3.0 kg/cm2 and in flow rates of 15–30 L/min.
In particular, argon gas performance was studied in depth using the 50 cm tube, with flow rates incrementally adjusted while maintaining a constant temperature of −15 °C. A humidity sensor was used to monitor internal moisture levels and to determine the minimum flow rate required to fully eliminate condensation on the blackbody surface.
While both gases were tested, only argon consistently maintained condensation-free conditions across all scenarios. Consequently, the results discussed here focus on argon-based calibration.
2.5 Effect of cylindrical tube lengths (D:S ratio)
The effect of measurement distance on calibration performance was assessed by varying the tube length (30 cm, 50 cm, and 100 cm). Tube length influences both the D:S ratio and the uniformity of infrared radiation received by the TUC, making it a critical parameter in system design.
As illustrated in Figure 2, each configuration ensured a direct line of sight between the calibrator and the TUC, with optical alignment maintained to prevent angular errors and emissivity shifts. Uniformity of radiation and spatial temperature stability were measured for each length.
2.6 Procedure for radiometric temperature calibration below 0 °C
All calibrations were conducted at a target temperature of −15 °C using the Fluke 4180 calibrator. Measurements were performed at a 30 cm distance, repeated across five cycles per condition for reliability. The procedure applied involved 9 steps:
1. Define calibration points: Set four target temperatures: −15 °C, −10 °C, −5 °C, and 0 °C.
2. Setup assembly: Connect the Fluke 4180 to the sealed acrylic calibration tube as shown in Figure 3.
3. Pre-heat standard thermometer: Allow 30 min of warm-up to stabilize internal circuitry.
4. Evacuate air: Use a dry pump for 30 min to remove ambient air from the chamber, then deactivate it.
5. Emissivity adjustment: Adjust the TUC emissivity setting to match the blackbody source (0.95).
6. Set temperature: Begin calibration with the lowest point (−15 °C), proceeding incrementally to 0 °C.
7. Gas purging: Release argon gas at 25 L/min and 2 kg/cm2 pressure to maintain a condensation-free chamber.
8. Stabilize temperature: Wait until the calibrator signals thermal stability.
9. Record temperatures: Align the TUC precisely to the calibrator and take measurements.
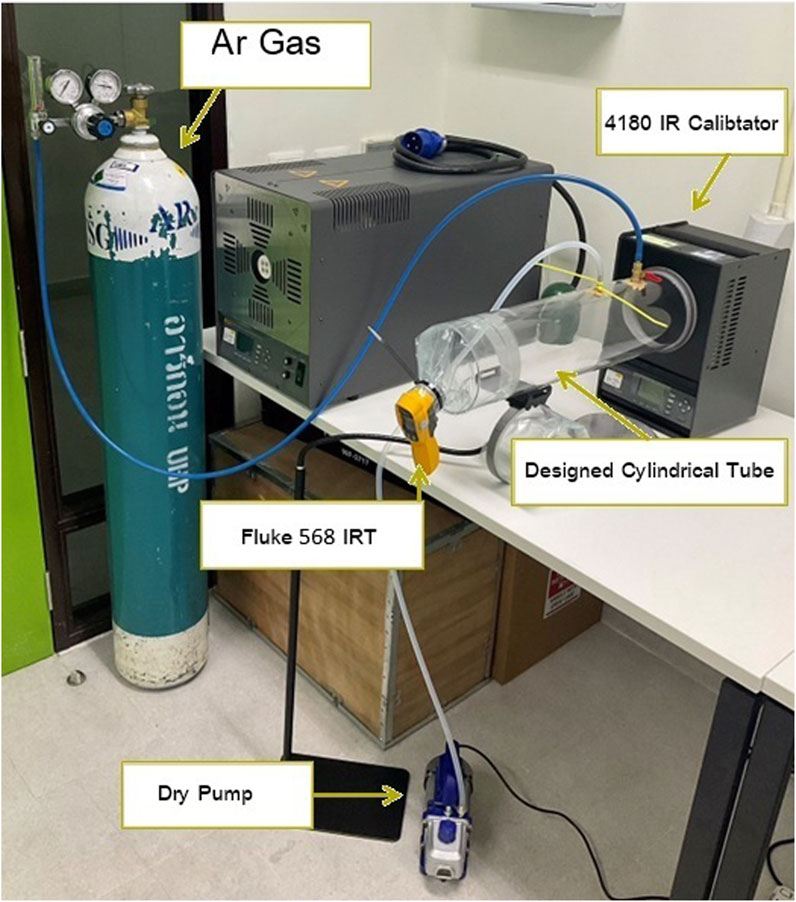
Figure 3. Experimental setup for infrared thermometer calibration system.
Data were recorded in five consecutive cycles using the sequence: STD → TUC → TUC → STD (STD: Standard Infrared Calibrator; TUC: Thermometer Under Calibration).
This sequencing ensured consistency and minimized drift bias. The measurement process was conducted under controlled environmental conditions, with temperature maintained at 25.0 °C ± 2.0 °C and relative humidity (RH) at 55% ± 15%.
2.7 Uncertainty estimation
Calibration followed ASTM E2847 guidelines (ASTM, 2021), with measurement uncertainties evaluated per the Guide to the Expression of Uncertainty in Measurement (GUM) and JCGM 100:2008 (ISO, 2017; Joint Committee for Guides in Metrology, 2023). Both Type A (statistical) and Type B (systematic) uncertainties were assessed, and expanded uncertainty was calculated at the 95% confidence level.
Type A uncertainty was calculated using the standard deviation (s.d.) from five repeated measurements.
where m is the number of observations.
Type B uncertainty considered environmental and instrument-related factors:
where
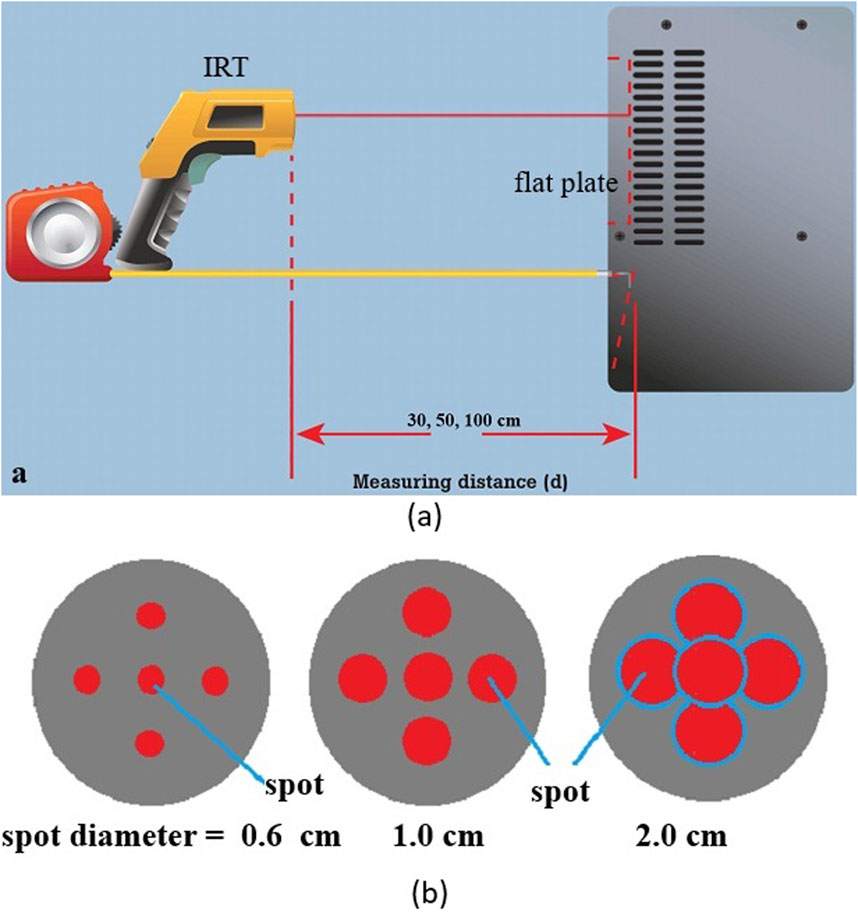
Figure 4. (a) Infrared thermometer (IRT) calibration setup at measurement distances of 30 cm, 50 cm, and 100 cm. (b) Corresponding infrared spot sizes on flat plate target, with increasing diameters at greater distances.
These components of uncertainty were combined using the root sum square (RSS) method to obtain total combined uncertainty (
The coverage factor,
The expanded uncertainty (
Uncertainties related to the emissivity coefficient, ambient temperature, and detector wavelength mismatch were controlled and maintained constant. This ensured that tube length, gas flow, and calibration chamber design were the dominant contributors to measurement variability.
3 Results and discussion
3.1 Optimization of gas pressure and flow rate
The calibration system’s effectiveness in preventing condensation on the infrared radiation source was evaluated under varying gas pressures and flow rates. Three trials were conducted to identify optimal purge conditions for maintaining a stable, moisture-free environment during subzero calibration.
Trial 1 began with an argon gas pressure of 8 kg/cm2 at a flow rate of 25 L/min. While this reduced frost formation, minor condensation was still observed on the IR calibrator surface at −12.00 °C. As both the pressure and flow rate were gradually decreased, condensation was fully eliminated at 2 kg/cm2 and 2 L/min, maintaining a stable temperature of −15.00 °C.
In Trial 2, the initial gas pressure was increased to 10 kg/cm2, maintaining a flow rate of 25 L/min. This further minimized condensation but did not eliminate it entirely, with moisture still forming at −10.56 °C. Final adjustments again converged on 2 kg/cm2 and 2 L/min, successfully sustaining −15.00 °C without additional condensation. However, the high gas consumption in this method prompted the need for improved efficiency.
Trial 3 incorporated a 30 min pre-evacuation step using a dry pump to remove residual moisture before gas purging. Then, argon was introduced at 2 kg/cm2 and 25 L/min, and gradually reduced to 2 L/min as the system reached equilibrium. This approach achieved −15.09 °C without condensation, optimizing both thermal stability and gas usage.
Preliminary testing was also conducted using nitrogen gas under similar conditions. Based on these results there was no significant difference in performance compared to argon (data not shown).
A combination of initial air evacuation and controlled argon purging—at 2 kg/cm2 pressure and a gradually reduced flow rate—proved effective for condensation-free calibration. However, notably, the optimal gas parameters depend on the chamber geometry and pre-conditioning time. As such, these findings should not be universally applied without any necessary adjustment for system-specific characteristics.
3.2 Effect of measurement distance
Prior to calibration, the system was purged with argon gas following 30 min of air pump evacuation. Then gas was released at 2 kg/cm2 and 25 L/min to establish a moisture-free environment. Calibration was conducted using cylindrical tubes of three lengths (30 cm, 50 cm, and 100 cm) to evaluate the effect of measurement distance.
Table 1 presents the correction values for low-temperature calibration using a 30 cm tube. Minimal corrections were required across all temperature set points, indicating high accuracy at this distance. Table 2 compares the repeatability uncertainty for both the standard thermometer (based on Equation 1) and the thermometer under calibration substitute (TUC) to be (based on Equation 2) across all three distances and temperatures. Based on these results, the lowest uncertainties were consistently achieved at 30 cm and 50 cm, while performance at 100 cm was less stable.
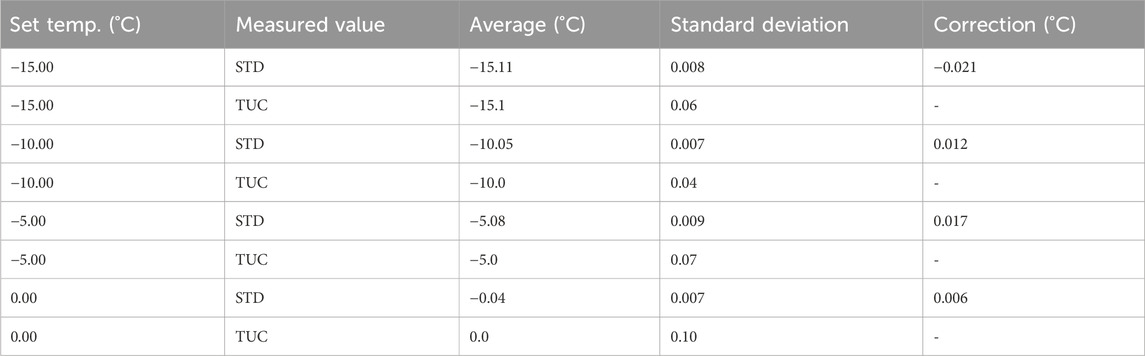
Table 1. Infrared temperature calibration below 0 °C (tube length: 30 cm).
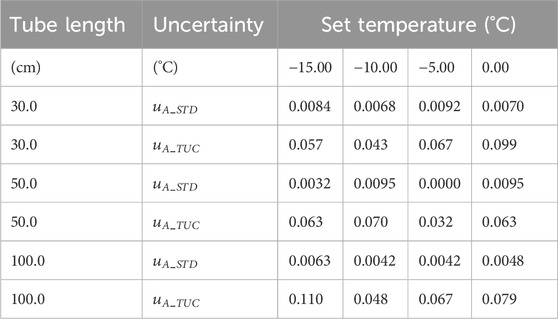
Table 2. Repeatability Uncertainty for Different Tube Lengths (30 cm, 50 cm, and 100 cm).
These trends reflected the influence of measurement distance on uncertainty, primarily driven by changes in the infrared spot size. With a D:S ratio of 50:1 for the Fluke 568 IRT, the spot diameter increased from approximately 0.6 cm at 30 cm–2.0 cm at 100 cm. Larger spot sizes at greater distances introduced additional variability due to surface heterogeneity and emissivity variations. Figures 4a,b visually confirm this relationship, showing increased spot size and surface coverage at longer distances.
In summary, measurement distances between 30 cm and 50 cm provided the best balance between precision and practical usability. At 100 cm, increased spatial coverage led to reduced measurement reliability, making it less suitable for high-accuracy applications.
3.3 Effect of uniformity of the standard radiation temperature source
As established in Section 3.2, an increased measurement distance enlarges the IR spot size. This directly amplifies sensitivity to spatial temperature variations across the calibration source, manifesting as elevated uniformity uncertainty. Table 3 presents the uncertainty components related to temperature uniformity and distance error for each tube length based on Equations 7, 10, respectively. These data reveal a strong correlation between measurement distance and spatial temperature variation across the flat plate source. At 30 cm, the calibration system maintained low uniformity uncertainty (0.0192 °C–0.0770 °C), indicating stable thermal distribution within the spot size. Distance-related uncertainty (
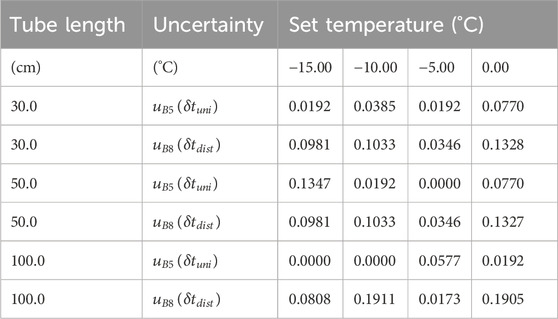
Table 3. Uniformity Uncertainty for Different Tube Lengths (30 cm, 50 cm, and 100 cm).
Overall, the findings indicated that shorter distances improved both thermal uniformity and optical precision during calibration. While the 100 cm configuration may offer occasional uniformity benefits, the elevated distance-related uncertainty compromises repeatability, particularly in environments requiring tight measurement tolerances. For optimal calibration accuracy, measurement distances between 30 cm and 50 cm are recommended, as they ensure a controlled spot size and minimal exposure to surface heterogeneity (Cui et al., 2020). Thus, shorter distances (30–50 cm) minimize spot size, reducing susceptibility to source non-uniformity and ensuring repeatable calibrations. In contrast, distances approaching 100 cm introduce higher uncertainty due to increased sensitivity to surface irregularities, emissivity variation, and environmental influences, thereby compromising measurement reliability (Barry et al., 2011; Müller et al., 2021).
As shown in Figure 4a, IRT was positioned at three distances (30 cm, 50 cm, and 100 cm) from the flat plate calibration source. Figure 4b illustrates how increasing the distance expanded the infrared spot size from approximately 0.6 cm at 30 cm, to 1.0 cm at 50 cm, and 2.0 cm at 100 cm. This increase in spot diameter led to greater exposure to surface non-uniformities and emissivity variation, directly influencing calibration accuracy.
3.4 Practical implications for real-world infrared thermometer use
In industrial and cold-chain environments, the practical use of IRTs depends on application context, measurement conditions, and operator technique (Kolat and Liebmann, 2012; Diril et al., 2003). This study confirms that no single calibration distance suits all scenarios. Instead, users must consider factors such as target size, surface emissivity, distance-to-spot ratio, and ambient humidity (Minkina and Dudzik, 2009; Manoi and Saunders, 2017). In frozen food processing, where operators perform quick spot checks on packaging or product surfaces, shorter distances (such as 30 cm) are recommended. At this range, the IRT captures a small, well-defined area, reducing uncertainty from irregular surfaces and misalignment (Zhao and Bergmann, 2023; Zakharenko et al., 2019). In cold storage facilities, where access to high or obstructed surfaces is limited, 50 cm offers a reasonable balance between accuracy and accessibility. However, users must ensure proper alignment and aim to target uniform surface regions (Zakharenko et al., 2019; Wanjura and Upchurch, 1991). At 100 cm, spot size increases to approximately 2.0 cm, making measurements more susceptible to emissivity variation and thermal gradients. This distance should be reserved for larger, uniform surfaces where closer access is impractical (Dell’Isola, et al. 2021; Kitinoja, 2013). Based on these findings, operators should be trained to adjust measurement distances to fit the measurement task, with 30–50 cm preferred for high-precision use in sectors such as frozen food export and pharmaceutical storage (Canton, 2021; Liebmann, 2008; Fluke, 2010). Ultimately, field use of IRTs should be guided by standardized calibration protocols (such as argon-purged, sealed systems) and informed by real-world constraints. Embedding these recommendations into standard operating procedures (SOPs) can improve both accuracy and reliability in non-contact temperature monitoring.
3.5 Uncertainty budget (−15 °C at distance of 30 cm)
Table 4 presents the detailed uncertainty budget for infrared thermometer calibration calculated from Equations 1–10, which performed at a set temperature of –15 °C and a measurement distance of 30 cm. The combined standard uncertainty, was calculated by Equation 11 is 0.313 C, along with the expanded uncertainty at an approximately 95% confidence level (refer to Equations 12, 13), U95%
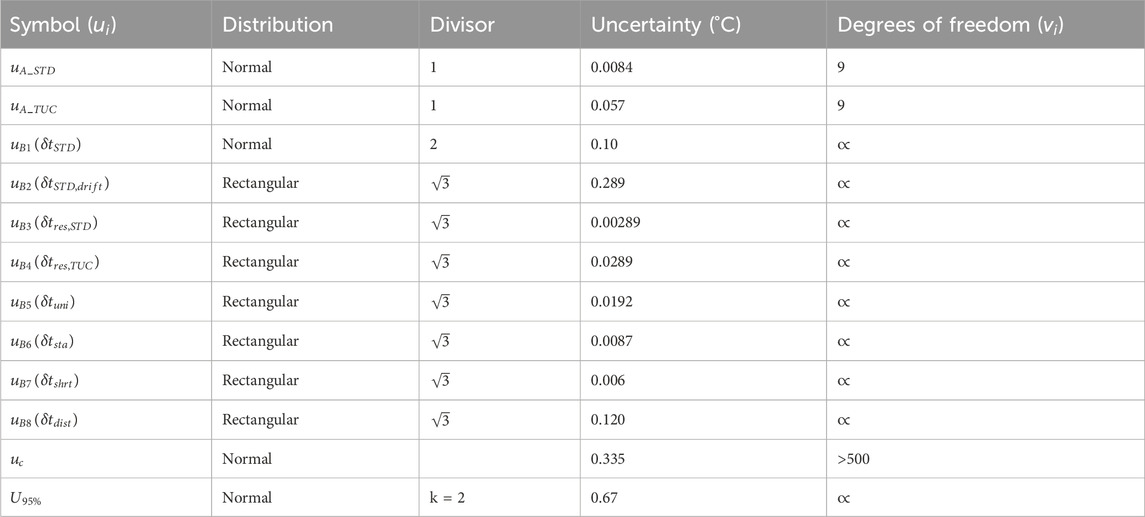
Table 4. Uncertainty budget for infrared thermometer calibration at −15 °C and 30 cm measurement distance.
Overall, the uncertainty budget at 30 cm demonstrated that the system was not only technically sound but also practically suitable for high-precision infrared thermometer calibration in subzero industrial settings, including the frozen food, pharmaceutical, and cryogenic sectors.
3.6 Expanded uncertainty across measurement distances
Table 5 presents the reported values from infrared thermometer calibration conducted at three measurement distances (30 cm, 50 cm, and 100 cm) across four calibration temperatures (−15 °C, −10 °C, −5 °C, and 0 °C). The data include the standard reference readings, TUC readings, correction values, and expanded uncertainties at an approximately 95% confidence level
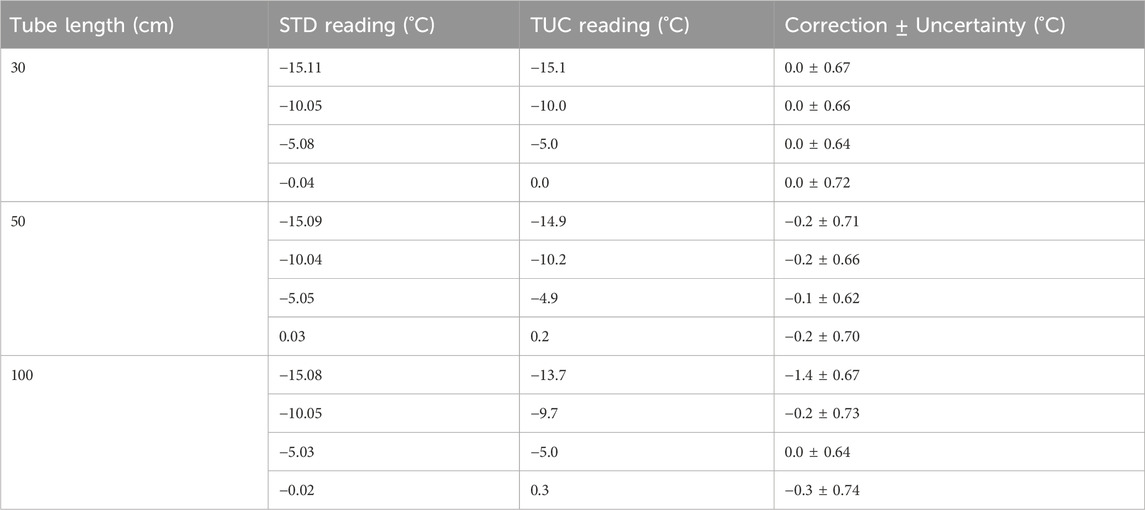
Table 5. Reported uncertainties in infrared thermometer calibration at varying distances and set temperatures.
At 30 cm, the TUC readings closely matched the standard reference values, with zero correction required at all temperatures. The expanded uncertainties ranged from 0.64 °C to 0.72 °C, indicating high calibration reliability. This short distance yielded the most consistent results, demonstrating the benefit of a focused measurement spot and minimal influence from spatial temperature variation or optical distortion. At 50 cm, slight deviations between the TUC and standard readings emerged. Correction values of −0.2 °C to −0.1 °C were necessary at all calibration points except −5 °C, where the TUC slightly underestimated the reference temperature. The expanded uncertainty values remained similar to the 30 cm configuration, ranging from 0.62 °C to 0.71 °C. These findings suggested that while measurement accuracy remained acceptable at 50 cm, small corrections may be required to maintain traceability.
3.7 Comparison of manufacturer specifications and NIMT calibration capability
The expanded uncertainties achieved in this study—ranging from 0.62 °C to 0.74 °C—fall well within the Fluke 568 infrared thermometer’s specified accuracy of ±1.1 °C (Fluke Corporation, 2010). This confirms that the proposed closed-cylinder calibration system, utilizing argon gas purge and controlled measurement distances, meets device performance expectations and is suitable for routine calibration in industrial and cold-chain environments (Brosnan and Sun, 2004; Cui et al., 2020; Shajkofci, 2021).
Compared to the calibration and measurement capability (CMC) of Thailand’s National Institute of Metrology (NIMT), which defines a reference uncertainty of ±0.3 °C for IRT calibration (ASTM, 2021; NIMT, 2024), the system’s performance is slightly above the national metrological limit. However, the results are consistent and traceable, positioning the system as a viable secondary calibration platform, especially for organizations without access to primary metrology facilities (Barry et al., 2011; Ko et al., 2009; Soto and Borquez, 2001).
In practical terms, the system offers a cost-effective and traceable solution for internal quality control and ISO/IEC 17025-aligned compliance. This is particularly relevant in sectors, such as frozen food logistics, pharmaceuticals, and cryogenic storage, where precise temperature monitoring is critical for safety and regulatory standards (ISO/IEC 17025, 2017).
Beyond meeting specifications, the system addresses a major calibration gap by delivering low-repeatability and uniformity uncertainty in subzero conditions. It overcomes common challenges associated with condensation and environmental instability, offering broader applicability in fields requiring reliable non-contact thermal measurement (Stigter et al., 1982; Sun, 2009).
Future improvements may include testing with multiple IRT models, optimizing gas flow for efficiency, and extending the system for ultra-low temperature applications below −20 °C to further enhance performance and scalability.
4 Conclusion
This study developed and validated a closed-cylinder IRT calibration system for low-temperature environments, effectively addressing the issue of condensation and frost formation that often compromises measurement accuracy in subzero conditions. Targeting the needs of the frozen food export industry, the system was optimized for gas flow, pressure, and measurement distance to reduce uncertainty and improve calibration reliability.
Using argon gas at 2 kg/cm2 and 25 L/min, the system successfully prevented condensation on the blackbody reference source. Among the tested configurations, the 30 cm tube length produced the lowest uncertainty, confirming that shorter distances enhance calibration precision. The expanded uncertainties achieved (0.62 °C–0.74 °C) fall within the Fluke 568’s manufacturer tolerance (±1.1 °C) and approach the NIMT reference threshold, supporting the system’s suitability as a secondary calibration solution.
These findings underscore the importance of distance control, environmental stability, and uncertainty modeling in low-temperature IRT calibration. Compared to conventional open-air or desiccant-based approaches, the sealed argon-purged system offers a practical and cost-effective alternative for applications where measurement accuracy is critical, such as in cold-chain logistics, pharmaceuticals, and cryogenics.
Although tested under laboratory conditions, the system has considerable potential for industrial use. Future work should explore field deployment, improve gas efficiency, integrate IoT-based monitoring, and align the design with international calibration standards (ISO, IEC) to support wider adoption and quality assurance in export-oriented sectors.
In summary, this research has laid a solid foundation for more accurate, repeatable IRT calibration at subzero temperatures—enhancing safety, compliance, and competitiveness in industries where thermal precision matters.
Data availability statement
The original contributions presented in the study are included in the article/Supplementary Material, further inquiries can be directed to the corresponding author.
Author contributions
DM: Writing – original draft, Data curation, Conceptualization, Formal Analysis. SW: Methodology, Data curation, Writing – original draft, Investigation. WN: Data curation, Writing – original draft, Methodology, Investigation, Formal Analysis. NN: Validation, Conceptualization, Writing – original draft, Visualization. PK: Conceptualization, Project administration, Supervision, Funding acquisition, Writing – original draft, Writing – review and editing.
Funding
The author(s) declare that financial support was received for the research and/or publication of this article. Funding support was provided by Kasetsart University, Si Racha campus, Thailand for the academic year 2023 (Grant No. 23/2566).
Acknowledgments
The Faculty of Science at Si Racha and the Faculty of International Maritime Studies, Kasetsart University, Si Racha Campus, Thailand provided their support throughout this research. The National Institute of Metrology, Thailand offered technical guidance and collaboration.
Conflict of interest
The authors declare that the research was conducted in the absence of any commercial or financial relationships that could be construed as a potential conflict of interest.
Generative AI statement
The author(s) declare that no Generative AI was used in the creation of this manuscript.
Any alternative text (alt text) provided alongside figures in this article has been generated by Frontiers with the support of artificial intelligence and reasonable efforts have been made to ensure accuracy, including review by the authors wherever possible. If you identify any issues, please contact us.
Publisher’s note
All claims expressed in this article are solely those of the authors and do not necessarily represent those of their affiliated organizations, or those of the publisher, the editors and the reviewers. Any product that may be evaluated in this article, or claim that may be made by its manufacturer, is not guaranteed or endorsed by the publisher.
Supplementary material
The Supplementary Material for this article can be found online at: https://www.frontiersin.org/articles/10.3389/fmech.2025.1668949/full#supplementary-material
References
ASTM-E2847 (2021). Standard test method for calibration and accuracy verification of wideband infrared thermometer. West Conshohocken, PA, USA: ASTM International.
Barry, T., Fuller, G., Hayatleh, K., and Lidgey, J. (2011). Self-calibrating infrared thermometer for low-temperature measurement. IEEE Trans. Instrum. Meas. 60 (6), 2047–2052. doi:10.1109/tim.2011.2113123
Bhujel, R. C. (2024). The role of markets in global aquatic food security, in Aquatic Food Security. Oxfordshire, United Kingdom: CABI GB, 127–142.
Brosnan, T., and Sun, D.-W. (2004). Improving quality inspection of food products by computer vision––a review. J. food Eng. 61 (1), 3–16. doi:10.1016/s0260-8774(03)00183-3
Canton, H. (2021). “Food and agriculture organization of the United Nations—F,” in Oxfordshire, United Kingdom: Routledge. The Europa directory of international organizations 2021 (Routledge), 297–305.
Cui, S., and Xing, J. (2022). Research on calibration method of infrared temperature measurement system near room temperature field. Front. Phys. 9, 786443. doi:10.3389/fphy.2021.786443
Cui, S., Sun, B., and Sun, X. (2020). A method for improving temperature measurement accuracy on an infrared thermometer for the ambient temperature field. Rev. Sci. Instrum. 91 (5), 054903. doi:10.1063/1.5121214
Dell’Isola, G. B., Cosentini, E., Canale, L., Ficco, G., and Dell’Isola, M. (2021). Noncontact body temperature measurement: uncertainty evaluation and screening decision rule to prevent the spread of COVID-19. Sensors 21 (2), 346. doi:10.3390/s21020346
Diril, A., Nasibov, H., and Uğur, S. (2003). “UME radiation thermometer calibration facilities below the freezing point of silver (961.78 °C),” in AIP conference proceedings (American Institute of Physics).
Grinzato, E. (2010). Humidity and air temperature measurement by quantitative infrared thermography. Quantitative InfraRed Thermogr. J. 7 (1), 55–72. doi:10.3166/qirt.7.55-72
ISO/IEC 17025 (2017). General requirements for the competence of testing and calibration laboratories. Third edition. Geneva, Switzerland: International Organization for Standardization.
Joint Committee for Guides in Metrology (2023). Guide to the expression of uncertainty in measurement. DIANE Publishing. Darby, PA: DIANE Publishing.
Kimball, B., and Mitchell, S. (1984). Low-temperature calibration of infrared thermometers. J. Atmos. Ocean. Technol. 1 (4), 379–382. doi:10.1175/1520-0426(1984)001<0379:ltcoit>2.0.co;2
Kitinoja, L. (2013). Use of cold chains for reducing food losses in developing countries. Population 6 (1.23), 5–60.
Ko, H.-Y., Wen, B.-J., Tsa, S.-F., and Li, G.-W. (2009). A high-emissivity blackbody with large aperture for radiometric calibration at low-temperature. Int. J. Thermophys. 30 (1), 98–104. doi:10.1007/s10765-008-0518-6
Kolat, T., and Liebmann, F. (2012). “Standards for radiation thermometry,” in NCSL international workshop and symposium.
Liebmann, F. (2008a). “Infrared calibration development at Fluke corporation hart scientific division,” in Thermosense XXX (SPIE) Bellingham, WC: SPIE.
Liebmann, F. (2008b). Optimization of thermal radiation source for high temperature infrared thermometer calibration.
Liebmann, F. (2011). Infrared thermometer calibration. Cal. Lab. Int. J. Metrol. 20–22. doi:10.1126/science.189.4201.483
Manoi, A., and Saunders, P. (2017). Size-of-source effect in infrared thermometers with direct reading of temperature. Int. J. Thermophys. 38 (7), 101–111. doi:10.1007/s10765-017-2237-3
Minkina, W., and Dudzik, S. (2009). Infrared thermography: errors and uncertainties. John Wiley & Sons.
Müller, I., Adibekyan, A., Anhalt, K., Baltruschat, C., Gutschwager, B., König, S., et al. (2021). Non-contact temperature measurement at the physikalisch-technische bundesanstalt (PTB). Quantitative InfraRed Thermogr. J. 18 (3), 187–212. doi:10.1080/17686733.2020.1734392
Quested, T., Cook, P., Gorris, L., and Cole, M. (2010). Trends in technology, trade and consumption likely to impact on microbial food safety. Int. J. Food Microbiol. 139, S29–S42. doi:10.1016/j.ijfoodmicro.2010.01.043
Radebaugh, R. (2016). Cryogenic measurements. Handb. Meas. Sci. Eng. 3, 2181–2224. doi:10.1002/9781119244752.ch61
Randeree, K. (2019). Challenges in halal food ecosystems: the case of the United Arab Emirates. Br. Food J. 121 (5), 1154–1167. doi:10.1108/bfj-08-2018-0515
Santiboon, T. T., Tulachom, P., Wongsrikaew, C., and Kruthakul, K. (2024). Food-rich environments: is food security and the sustainability of mass human life possible or impossible? Pakistan. J. Life Soc. Sci. 22 (2), 4671–4994. doi:10.57239/pjlss-2024-22.2.00345
Shajkofci, A. (2021). Correction of human forehead temperature variations measured by non-contact infrared thermometer. IEEE Sensors Journal, 22 (17), 16750–16755.
Skifton, R., Palmer, J., and Calderoni, P. (2018). Optimization of heat treatment and calibration procedures for high temperature irradiation resistant thermocouples. Instrum. Sci. and Technol. 46 (4), 349–363. doi:10.1080/10739149.2017.1389754
Soto, V., and Borquez, R. (2001). Impingement jet freezing of biomaterials. Food Control 12 (8), 515–522. doi:10.1016/s0956-7135(01)00059-7
Stigter, C., Jiwaji, N., and Makonda, M. (1982). A calibration plate to determine the performance of infrared thermometers in field use. Agric. Meteorol. 26 (4), 279–283. doi:10.1016/0002-1571(82)90045-0
Struß, O. (2003). “Transfer radiation thermometer covering the temperature range from− 50 C to 1000 C,” in AIP conference proceedings (American Institute of Physics).
Wanjura, D., and Upchurch, D. (1991). Infrared thermometer calibration and viewing method effects on canopy temperature measurement. Agric. For. Meteorology 55 (3-4), 309–321. doi:10.1016/0168-1923(91)90068-2
Zakharenko, V., Veprikova, Y. R., and Ponomarev, D. (2019). Reduction of uncertainty with non-contact measurement of temperature. J. Phys. Conf. Ser. 1210, 012162. doi:10.1088/1742-6596/1210/1/012162
Keywords: infrared thermometer calibration, frozen food industry, pneumatic calibration system, argon gas flow, subzero temperature calibration, measurement uncertainty
Citation: Manop D, Wangtong S, Na Ayuthaya WP, Noulkhow N and Khaenamkaew P (2025) Innovative low-temperature calibration system for infrared thermometers in frozen food industry: effects of measurement distance and temperature uniformity. Front. Mech. Eng. 11:1668949. doi: 10.3389/fmech.2025.1668949
Received: 22 July 2025; Accepted: 09 September 2025;
Published: 08 October 2025.
Edited by:
Suvash C. Saha, University of Technology Sydney, AustraliaReviewed by:
Antonello Barresi, Polytechnic University of Turin, ItalyMd. Mamun Molla, North South University, Bangladesh
Copyright © 2025 Manop, Wangtong, Na Ayuthaya, Noulkhow and Khaenamkaew. This is an open-access article distributed under the terms of the Creative Commons Attribution License (CC BY). The use, distribution or reproduction in other forums is permitted, provided the original author(s) and the copyright owner(s) are credited and that the original publication in this journal is cited, in accordance with accepted academic practice. No use, distribution or reproduction is permitted which does not comply with these terms.
*Correspondence: Panya Khaenamkaew, cGtoZWFudW1raGF3QHlhaG9vLmNvbQ==, cGFueWEua2hhQGt1LnRo