 Yang Liu
 Zhijun Guo2
- 1School of Automotive Engineering, Huanghe Jiaotong University, Jiaozuo, China
- 2College of Vehicle and Traffic Engineering, Henan University of Science and Technology, Luoyang, China
Introduction: Traditional methods for allocating power parameters in electric vehicles are prone to becoming trapped in local optima, which hinders their ability to meet rising performance demands. To enhance the accuracy of this allocation, this study proposes a novel power parameter allocation method for new energy vehicles.
Methods: The proposed method integrates an optimized Artificial Fish Swarm Algorithm (AFSA) with system parameter classification. First, a parameter classification model is constructed based on sensitivity analysis. Subsequently, the improved AFSA is employed to perform the parameter optimization.
Results: The parameter allocation based on sensitivity analysis demonstrated strong performance. Specifically, with a main reduction ratio of 11:1, the high-speed re-acceleration time was 5.7 s. When the coolant flow rate was set to 7 L/min, the peak power duration reached 30.1 s. Compared to other methods, the comprehensive energy consumption achieved by the improved AFSA was the lowest, recording 13.8 kWh/100 km with a battery capacity of 80 kWh.
Discussion: The developed method effectively overcomes the tendency of traditional approaches to fall into local optima. It significantly improves both the dynamic performance and energy efficiency of electric vehicles, offering a more effective solution for power parameter allocation.
1 Background
Cars can help people reach their destinations faster and more conveniently, greatly expanding their range of activities and playing a huge driving role in economic development. With the acceleration of urbanization and the increase in car ownership, urban traffic congestion and air pollution are becoming increasingly serious. With the increasing urgency of global energy structure adjustment and environmental protection needs, electric vehicles have become an important direction for the automotive industry (He and Wang, 2023). It should be pointed out that the environmental benefits of electric vehicles largely depend on their power sources. If the battery’s power comes from renewable energy sources such as wind, solar or geothermal energy, electric vehicles can significantly reduce greenhouse gas emissions and air pollution (Ahuchogu et al., 2024). On the contrary, if electricity mainly comes from fossil fuels such as coal or oil, the environmental benefits will be very limited. Therefore, while promoting the development of electric vehicles, optimizing their power parameters to enhance energy efficiency can further amplify the advantages of renewable energy and facilitate the green transformation of the overall energy structure (S et al., 2024). The automotive power system refers to the engine and its accompanying transmission system, which is the core and foundation of the vehicle’s operation. Its parameter configuration directly determines the overall performance, energy consumption level, and driving experience of the vehicle. However, the power system is a multidisciplinary coupled complex system, including multiple subsystems such as motors, batteries, and transmission systems, with strong nonlinear relationships between parameters (Feng et al., 2024; Qiu et al., 2024). The traditional method for allocating power parameters of electric vehicles has problems such as slow convergence speed, insufficient consideration for parameter sensitivity differences, susceptibility to local optima, low optimization efficiency, and high computational costs. Moreover, there are significant differences in the impact of different parameters on system performance. Adopting a unified optimization strategy can lead to wastage of computing resources and poor optimization results (Shahbazi et al., 2023). Therefore, traditional parameter design methods are difficult to meet the increasing performance requirements. The Artificial Fish Swarm Algorithm (AFSA) mimics the behavior of fish. It achieves the search for the global optimal solution by simulating the foraging, clustering, and rear end behaviors of fish (Nie and Jiao, 2023; Nandhini and Kannimuthu, 2024). AFSA has the characteristics of simplicity, ease of implementation, and strong adaptability, which is widely used in fields such as function optimization, machine learning, and data mining (Kang, 2025). To improve the efficiency of power parameter allocation for electric vehicles and reduce computational costs, a new energy vehicle power parameter allocation method that integrates optimized AFSA and system parameter classification is proposed. The research innovatively proposes a system parameter classification method based on sensitivity analysis, dividing dynamic parameters into three categories: core parameters, sensitive parameters, and ordinary parameters, which provides new ideas for parameter optimization problems in complex engineering systems.
2 Related works
AFSA has shown great potential in solving complex optimization problems by simulating the foraging, clustering, and collision avoidance behaviors of fish schools in nature. It is applied in resource balancing, image processing, job scheduling, and other areas (Pourpanah et al., 2023; Guo et al., 2024). Zhao et al. built an optimization method using improved AFSA to optimize the efficiency of path planning for autonomous ships. The study enhanced the convergence performance and obstacle avoidance ability in complex marine environments by introducing dynamic field of view mechanism and adaptive step size strategy. Compared to the traditional A* algorithm, the proposed method for planning paths reduced the navigation distance by 12.4% and the computation time by 27.8%. Especially when dealing with dynamic obstacles, the re-planning efficiency increased by 3.2 times (Zhao et al., 2023). Aerodynamic optimization plays a key role in reducing energy consumption through external design. Skrucany et al. systematically reviewed new technologies for improving the aerodynamic performance of freight vehicles, including the installation of side skirts, chassis guards, and rear drag reduction devices, etc. Research indicates that these technologies can reduce the comprehensive energy consumption of heavy vehicles by up to 10%–15% by minimizing turbulence and pressure difference resistance (Skrucany et al., 2019). This proves from the perspective of engineering practice that reducing wind resistance is an effective energy-saving path that runs parallel to the optimization of the power system. Quan et al. further focused aerodynamic optimization on models with high drag coefficients and proposed a design method driven by computational fluid dynamics for sport utility vehicles (SUVs). By optimizing the arc of the A-pillar, the roof curve and the rear styling, the drag coefficient of the benchmark model was reduced by 18.4% while ensuring the interior space. This study highlights the huge potential of shape optimization for improving energy consumption of specific vehicle models (Quan, 2024). From a macro perspective, Jha et al. analyzed through modeling the projection effects of Nepal’s large-scale adoption of electric vehicles on energy demand and greenhouse gas emissions. The prediction results show that by 2050, the popularization of electric vehicles can help the transportation sector cumulatively reduce greenhouse gas emissions by more than 40%, but its effect strongly depends on the decarbonization process of the power grid (Jha et al., 2025). Kumar et al. built an optimization control method using inverse propagation AFSA to optimize the accuracy of wavefront aberration compensation in free space optical communication. The study integrated strategies for generating opposing populations and adaptive mutation mechanisms. Compared to traditional genetic algorithms, the proposed method improved the Strehl accuracy of the system by 58.7% under strong turbulence conditions, while maintaining real-time response performance below 15 m (Kumar and Khandelwal, 2023). Sun et al. designed an individualized adaptive regulation strategy inspired by AFSA to address the insufficient precision in tumor targeted therapy. A drug delivery optimization algorithm with environmental adaptability was designed. Compared to traditional targeting strategies, the drug enrichment efficiency of the proposed method increased by 52.8%, while reducing drug exposure in normal tissues by 39.4% (Sun et al., 2024). Wang et al. built an identification method using improved AFSA to improve the inversion accuracy of thermal conductivity in transient heat transfer systems. The dynamic perception mechanism and group collaboration strategy were adopted. Compared to traditional genetic algorithms, the proposed method reduced the identification error of thermal conductivity by 62.3%, the root mean square error was less than 0.028 W/(m·K), and the computational efficiency was improved by 41.7% (Wang et al., 2023). Xiao and Wang (2023) designed a multi-layer perceptron hybrid model based on AFSA to address the low accuracy in predicting customer churn in IoT cloud environments. A prediction system with adaptive feature selection mechanism was constructed by integrating the swarm intelligence search capability of AFSA and the nonlinear fitting characteristics of multi-layer perceptron. The proposed model achieved a prediction accuracy of 93.7% on the telecommunications industry dataset, with an F1 score improvement of 19.2% (Xiao and Wang, 2023).
Accurately allocating vehicle power parameters can reduce the energy consumption throughout the vehicle’s lifecycle, and optimize the vehicle’s economy, power, and reliability (Zuo et al., 2023). Lyu et al. proposed a dynamic programming based power parameter allocation algorithm to optimize the economic benefits of electric vehicle aggregator participation in real-time frequency regulation. Compared to traditional sequential optimization methods, the proposed collaborative strategy increased the aggregator’s revenue by 28.6%, improved frequency response accuracy by 39.2%, and reduced battery loss rate by 17.3%. It effectively solved the dynamic matching problem between the state of charge interval (20%–80%) and the regulation capability (Lyu et al., 2023). Bai et al. (2023) proposed a power parameter allocation strategy based on deep reinforcement learning for in vehicle communication devices to enhance the collaborative optimization level of information timeliness and energy efficiency in intelligent transportation systems. A partially observable Markov decision process model was constructed. Compared to traditional threshold strategies, the proposed method improved information timeliness by 41.3% in typical urban traffic scenarios, reduced communication energy consumption by 28.6%, and extended device endurance time by 2.3 times (Bai et al., 2023). Huang et al. built a multidimensional parallelepiped model to solve the low accuracy in parameter uncertainty analysis of power train suspension systems. A mixed uncertainty quantification framework for independent and correlated parameters was established, and the impact of 12 key design parameters on the system’s isolation performance was systematically analyzed. Compared to traditional Monte Carlo simulations, the proposed method improved computational efficiency by 7.8 times while maintaining a confidence level of 93.2% (Huang et al., 2024). Bueno et al. designed a novel control method using Markov jump linear system to address parameter uncertainty in automotive power control, and constructed a robust controller with probability transition matrix. The proposed method improved the smoothness index of gear shifting by 43.2%, fuel economy by 7.8%, and particularly shortened the transient response time by 62 m when dealing with engine motor mode switching (Bueno et al., 2023). Wasserburger et al. proposed an efficient power parameter optimization method to address operational uncertainty in actual driving emission calibration, and built a calibration framework using multi-objective Bayesian optimization. The method shortened the calibration cycle by 68%, while reducing NOx emissions by 23.4% ± 3.2% and fuel consumption by 5.7% ± 1.1%. The adaptive update speed of the power parameter set was increased by 3.2 times (Wasserburger et al., 2023).
In summary, there are two key and latest advancements in the field of electric vehicles in the direction of power parameter optimization and correlation: The first is the research on driver fingerprint characteristics in risk scenarios. Relevant natural driving experiments collected hundreds of sets of real road condition data, extracted unique operational features such as the driver’s accelerator pedal opening and braking response time, and found that the distribution of power parameters needs to dynamically match different driver behavior patterns. However, this type of research did not incorporate driver behavior differences into the parameter classification system. This leads to the parameter adaptability being limited only to the safety dimension and failing to form a coordinated optimization with power performance and energy consumption. The second is the reinforcement learning energy management strategy for fuel cell hybrid vehicles. This type of technology optimizes the hydrogen-electric energy ratio through algorithms such as deep deterministic policy gradients, using real-time road condition feedback as a reward signal, which can improve the system’s operational efficiency. However, it only focuses on energy flow regulation and ignores the coupling effects among high-dimensional power parameters such as motor base speed and battery internal resistance. This leads to insufficient overall coordination of parameters. Therefore, the study proposes a new energy vehicle power parameter allocation method that integrates improved AFSA and system parameter classification, aiming to enhance the global search capability and multi-condition robustness, and provide new solutions for optimizing new energy vehicle power systems in complex operating scenarios.
3 Power parameter allocation of electric vehicles
To address the specific limitations identified in existing studies: Firstly, the low search efficiency in high-dimensional coupled parameter spaces caused by ignoring differences in parameter sensitivity, second, the insufficient model adaptability under operating condition drift due to fixed optimization strategies, and secondly, the waste of computing resources from unified parameter processing, this study designs a two-stage solution. Thirdly, a system parameter classification method based on sensitivity analysis is constructed to divide dynamic parameters into core, sensitive, and ordinary categories—this targets the inefficiency of unified optimization and reduces redundant computational costs by prioritizing key parameters. Second, the traditional AFSA is improved by introducing adjustable field of view, fitness-weighted step size, and hybrid elite archive management—these modifications enhance the algorithm’s global search capability in high-dimensional spaces and robustness under variable operating conditions. The combination of parameter classification and improved AFSA forms a synergistic framework that directly responds to the gaps in existing power parameter allocation methods, laying the foundation for the subsequent detailed methodology design.
3.1 System parameter classification method based on sensitivity analysis
By scientifically matching and optimizing the parameters of the power system, the overall performance and economy can be effectively improved. The power system of electric vehicles includes multiple subsystems such as motors, batteries, transmission systems, and control systems, involving numerous parameters and complex interrelationships (Xue et al., 2024). To achieve efficient allocation and optimization of power parameters, this study first needs to identify the key parameters that have the greatest impact on system performance. However, traditional allocation methods adopt a unified processing strategy for all parameters, which has drawbacks such as wasting computational resources and difficulty in obtaining global optimal solutions (Long et al., 2023). Sensitivity analysis analyzes the sensitivity of changes in the state or output of a system or model to changes in system parameters or surrounding conditions. In multi-objective optimization scenarios, sensitivity analysis can significantly optimize the scientificity and economy of decision-making, avoiding performance defects or cost waste caused by parameter misjudgment. Therefore, a system parameter classification method based on sensitivity analysis is built, which quantifies the contribution of each parameter to various performance indicators and divides system parameters into three categories: core parameters, sensitive parameters, and ordinary parameters. To avoid errors caused by local linearization, the study adopts the global sensitivity method. The steps for classifying system parameters based on sensitivity analysis are shown in Figure 1.

Figure 1. Classification steps of system parameters based on sensitivity analysis.
In Figure 1, the system parameter classification steps using sensitivity analysis are as follows. Firstly, Latin hypercube sampling is used to generate a parameter sample space, and performance indicator data is obtained through a multidisciplinary coupled simulation model. Secondly, based on Sobol variance decomposition, the total sensitivity index of each parameter is calculated to quantitatively characterize the influence of parameters on system performance. Finally, the K-means clustering dynamically divides the parameters into three levels: core, sensitive, and ordinary parameters. To make the sensitivity between different parameters comparable and eliminate the influence of numerical units and dimensions, for a system containing n parameters and m performance indicators, the normalized sensitivity coefficient of parameter
In Equation 1,
In Equation 2,
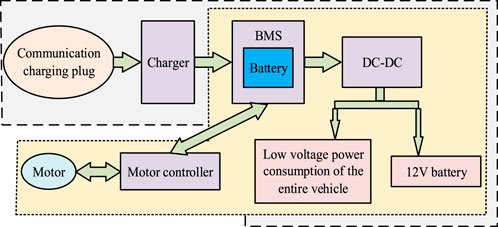
Figure 2. New energy vehicle motor system.
In Figure 2, the motor system of a new energy vehicle mainly consists of an AC charging plug, a charger, a battery pack, a Battery Management System (BMS), a DC-DC converter, a motor, and a low-voltage power system for the entire vehicle. The characteristic curve of the motor has obvious impacts on the overall performance. A segmented linearization model is used to describe the external characteristics of the motor, as described in Equation 3 (Joshua et al., 2024).
In Equation 3,
In Equation 4,
In Equation 5,
In Equation 6,
In Equation 7,
3.2 Optimization algorithm for power parameter allocation based on improved AFSA
After constructing a parameter classification model based on sensitivity analysis, the improved AFSA is used for parameter optimization. Unclassified optimization processes can lead to significant waste of computing resources on non-critical parameters and inability to handle strong coupling effects between parameters. Therefore, after constructing a parameter classification model, parameter optimization should be carried out. When optimizing high-dimensional dynamic parameters, traditional global optimization algorithms ignore the differences in the impact of different parameters on system performance, making it difficult to balance the contradiction between optimization efficiency and accuracy (Liu et al., 2023a). The AFSA simulates the foraging behavior of fish schools and has strong global search ability, which can find better solutions in the search space. It has fewer constraints on the problem and search space, and has good robustness, suitable for various types of optimization problems (Alhndawi et al., 2024; Liu et al., 2023b). Therefore, the research takes AFSA for parameter optimization. Compared with the problems of traditional hybrid optimization techniques (such as PSO-GA) uniformly handling high-dimensional parameters, resulting in coupling redundancy due to ignoring sensitivity differences, and single adaptive algorithms (such as adaptive GA) lacking hierarchical strategies and insufficient robustness under operating condition variations, the method proposed in this paper makes breakthroughs through dual-dimensional innovation: First, the sensitivity classification breaks down high-dimensional parameters into three categories: core, sensitive, and common. For core parameters, elite tailing is used to focus on key coupling relationships, while for sensitive parameters, gradient clustering is employed to resolve secondary coupling, addressing high-dimensional coupling from the perspective of dimensional simplification. Second, improve the adjustable field of view and elite archiving of AFSA, dynamically adjust the search range when the working conditions fluctuate, avoid the search defocusing of traditional adaptive algorithms, effectively enhance the optimization robustness under the variability of working conditions, and achieve the collaborative solution of high-dimensional coupling and working condition variation. Figure 3 presents the working principle of AFSA.
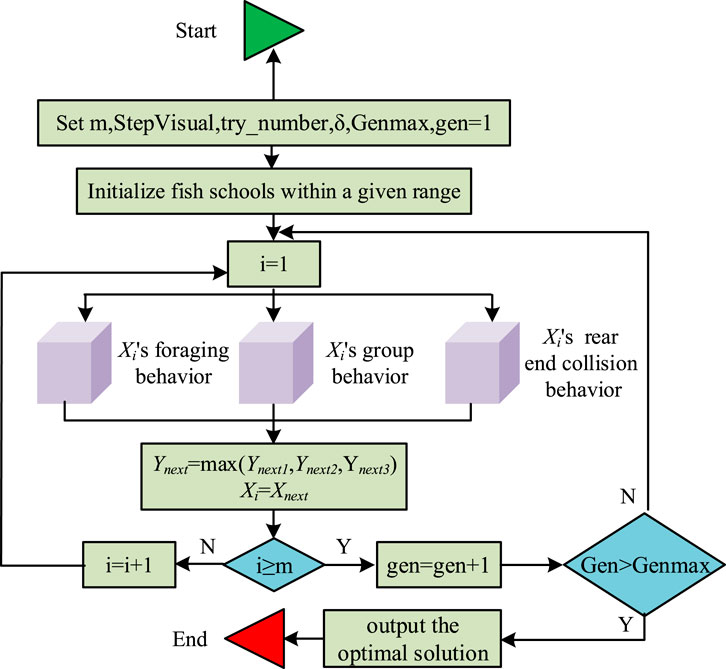
Figure 3. Working principle of AFSA.
In Figure 3, first, the population size, initial position, visual field, step size, crowding factor, and number of repetitions are set initialized. The fitness value of each fish is calculated and the position and speed of the fish swarm are updated based on the fitness value. Secondly, each individual is evaluated and the behaviors they need to perform are selected. The behavior of artificial fish is performed again and a new school of fish is updated. Finally all individuals are evaluated. When the optimal solution reaches the upper limit of iteration times, the algorithm ends. Otherwise, each individual is evaluated again. From the above working principle, the AFSA adopts a fixed field of view range and step size during operation. This setting results in slow convergence speed and local optima when solving high-dimensional optimization problems. The research needs to improve the traditional AFSA. To address the above issues, the adjustable field of view and step size are introduced, as displayed in Equation 8.
In Equation 8,
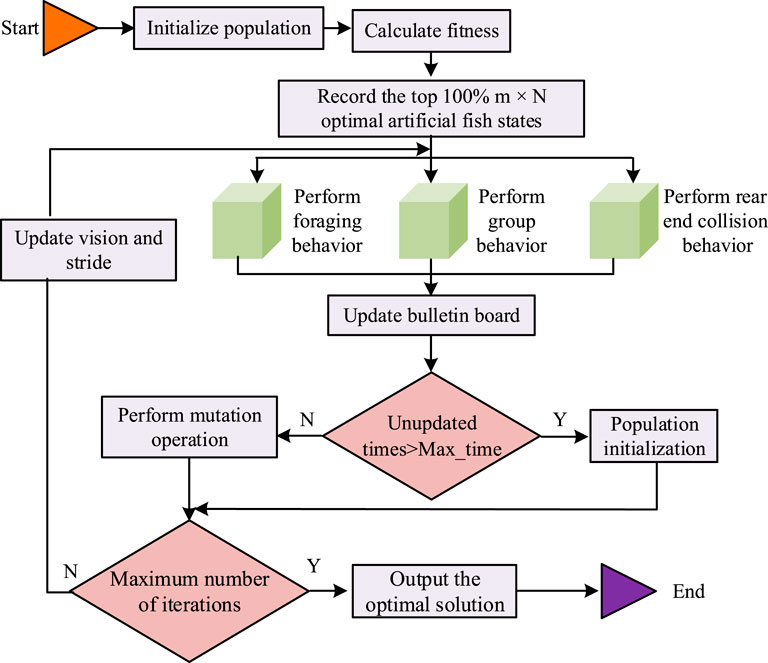
Figure 4. The working steps of AFSA after introducing adjustable field of view and step size.
In Figure 4, the workflow of the AFSA with adjustable field of view and step size is as follows. First, the system interrupt parameters are initialized and the fitness return value of the current working point is calculated. Next, the global optimal solution is updated. If the convergence condition is satisfied, the final solution is output. The process terminates. Otherwise, the step size and field of view range are adjusted through adaptive mechanisms to restart the optimization loop. Until the upper limit of iteration times is reached, the optimization result is finally output. When optimizing parameter allocation based on the improved AFSA, the core parameter performs elite rear end collision, as calculated in Equation 9.
In Equation 9,
In Equation 10,
In Equation 11,
In Equation 12,
In Equation 13,
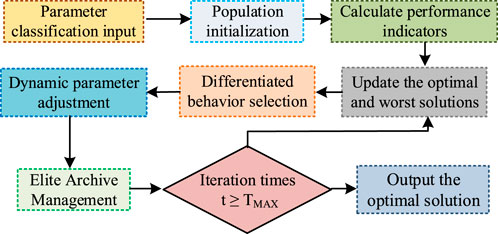
Figure 5. Steps for parameter allocation optimization based on improved AFSA.
In Figure 5, when optimizing parameter allocation based on the improved AFSA, a differentiated search strategy is first adopted based on the parameter sensitivity classification results. Secondly, a dynamic adjustment mechanism is constructed to achieve progressive optimization through an exponentially decaying field of view and fitness weighted step size strategy. Adaptive congestion threshold and hybrid elite archive management are taken to balance global exploration and local development. Finally, when the maximum iteration is reached, the process terminates. The global optimal solution is output.
4 Quality analysis of power parameter allocation for electric vehicles
4.1 Experimental environment and parameter settings
To verify the effectiveness of the proposed method, a hardware-in-the-loop experimental platform was built, and industry-standard simulation software was adopted for system modeling and algorithm implementation. The main software and hardware tools, models and their key configuration information used in the experiment are detailed in Table 1.

Table 1. Software and Hardware Configuration of the experimental Platform and Model Data.
4.2 Analysis of the effectiveness of system parameter classification
To verify the effectiveness of dynamic parameter classification based on sensitivity analysis system, the limit lateral acceleration and sudden acceleration voltage drop index of the curve are evaluated, as illustrated in Figure 6. In Figure 6a, the maximum lateral acceleration of the curve based on sensitivity analysis system dynamic parameter classification was the highest, while the maximum lateral acceleration of the curve without system dynamic parameter classification was the lowest. When the tire radius was 345 mm, the maximum lateral acceleration at the curve was 0.92 g and 0.87 g, respectively. From Figure 6b, the performance based on sensitivity analysis system power parameter classification was optimal. When the internal resistance was 0.04Ω, the sudden acceleration voltage drop value was 17.5 V.
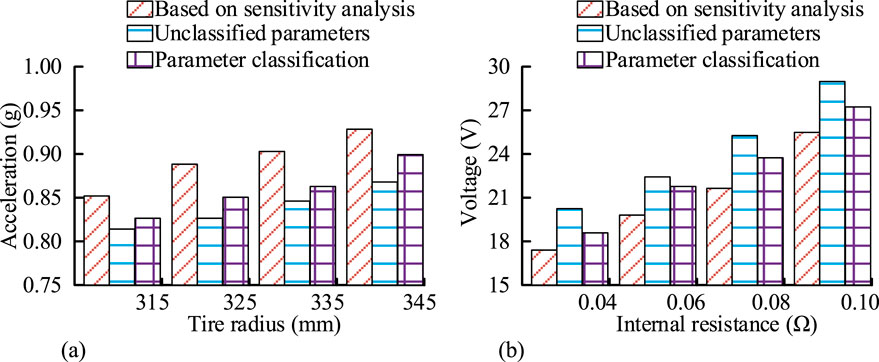
Figure 6. Limit lateral acceleration and sudden acceleration voltage drop values before and after system power parameter classification. (a) Comparison of limit lateral acceleration in curves under different tire radii. (b) Comparison of rapid acceleration voltage drop under different battery internal resistances.
The parameter classification, parameter classification based on sensitivity analysis, and unclassified torque response delays under different battery capacities are shown in Table 2. As the battery capacity increased differently, the torque response delay decreased for both classified and unclassified system parameters. The torque response delay was significantly reduced based on sensitivity analysis for parameter classification. When the battery capacity was 80 kWh, the torque response delay was 24.3 m.
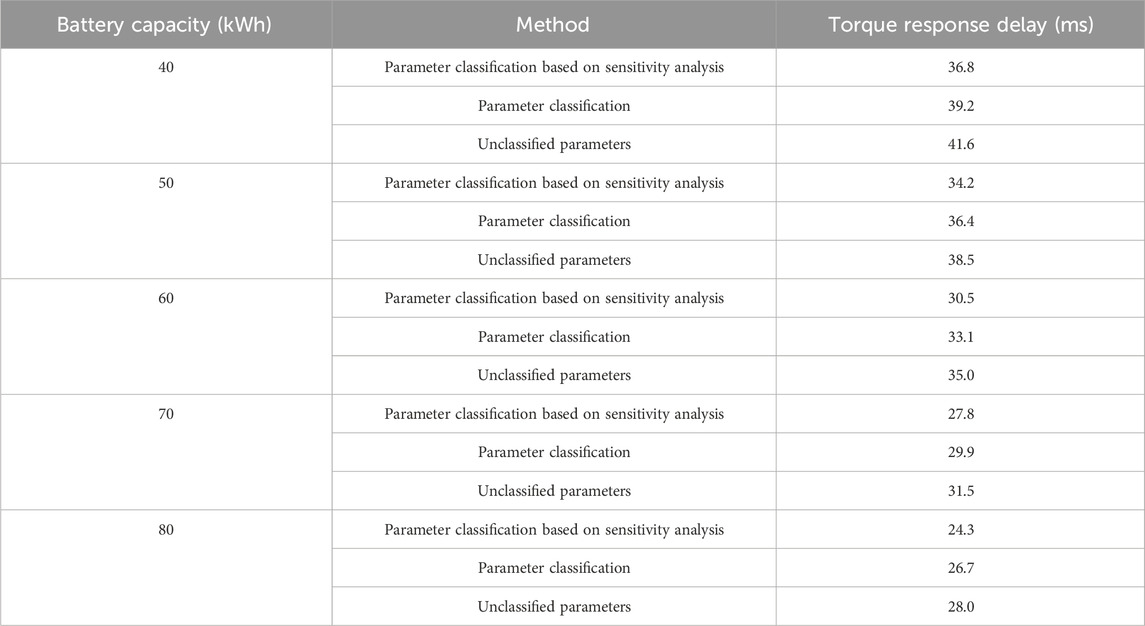
Table 2. Comparison of torque response delay between unclassified and classified system parameters.
The comparison results of high-speed re-acceleration time and peak power duration based on sensitivity analysis, parameter classification, and unclassified parameter are shown in Figure 7. From Figure 7a, the electric vehicles classified based on the sensitivity analysis exhibited good performance. Electric vehicles that have not undergone system parameter classification have poor performance. When the main drive ratio was 11:1, the high-speed re-acceleration time was 5.7 s and 7.9 s respectively. From Figure 7b, the peak power duration based on sensitivity analysis was the longest. When the coolant flow rate was 7 L/min, the peak power duration was 30.1 s.

Figure 7. High-speed re-acceleration time and peak power duration before and after system parameter classification. (a) High-speed re-acceleration time under different transmission ratios. (b) Peak power duration at different coolant flow rates.
4.3 The effect of power parameter allocation optimization
The maximum climbing slope after power parameter matching optimization using different methods under different peak torque of the motor is shown in Table 3. As the peak torque of the motor increases, the maximum climbing slope after power parameter matching optimization using different methods increases. The maximum climbing slope after power parameter matching optimization based on improved AFSA was the highest. When the peak torque of the motor was 350%N·m, the maximum climbing slope was 40.5%. The method can effectively improve the power output performance of vehicles under extreme working conditions.

Table 3. Maximum climbing gradient after dynamic parameter matching optimization using different methods.
To verify the effectiveness of power parameter allocation based on improved AFSA, the study evaluates the 0–100 km/h acceleration time and comprehensive energy consumption index, as illustrated in Figure 8. From Figure 8a, as the peak torque of the motor increases, the 0–100 km/h acceleration time of all methods is shortened. The traditional Genetic Algorithm (GA) had the longest acceleration time, while the improved AFSA had the shortest acceleration time. When the peak torque of the motor was 350 N·m, the acceleration time was 7.2 s and 6.5 s respectively. From Figure 8b, the comprehensive energy consumption based on the improved AFSA for power parameter allocation was the lowest. When the battery capacity was 80 kWh, the comprehensive energy consumption was 13.8 kWh/100 km. The improved AFSA effectively balances the dynamic and economic indicators.
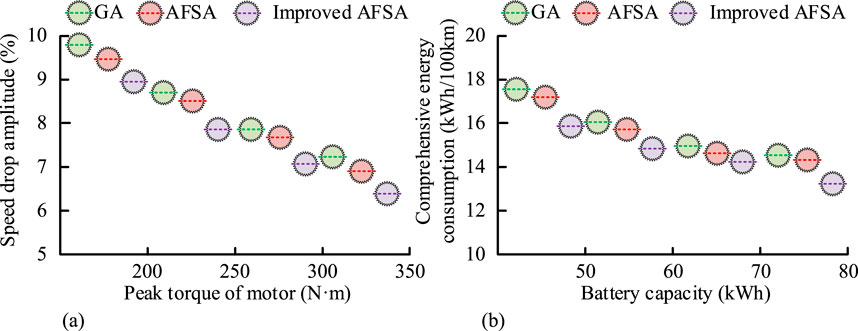
Figure 8. Acceleration time and comprehensive energy consumption after matching power parameters using different methods. (a) Acceleration time after matching power parameters. (b) Comprehensive energy consumption after matching power parameter.
To verify the advantages and statistical reliability of the improved AFSA, the experiment included the key performance indicators and statistical significance test results of multiple algorithms. Two mainstream and cutting-edge optimization algorithms, Particle Swarm Optimization (PSO) and Grey Wolf Optimization (GWO), were supplemented as comparison baselines. The comparison results are shown in Table 4. It can be known from Table 4 that the improved AFSA is comprehensively superior to the comparison algorithm in core performance indicators: Compared with the cutting-edge GWO, its comprehensive energy consumption is reduced by 0.1 kWh/100 km, the overtaking time from 80 to 120 km/h is shortened by 2.1 s, and the maximum climbing gradient is increased by 0.8 percentage points. Even compared with the better-performing PSO, the acceleration time is still shortened by 0.2 s. Statistical significance tests show that the differences between the improved AFSA and GA and standard AFSA are extremely significant (p < 0.01), and the differences with PSO and GWO are also significant (p < 0.05), proving that its performance advantages are not random fluctuations but the inevitable result of the combination of algorithm optimization (adjustable field of view, elite archiving) and parameter classification. The validity and reliability of the method were further verified.
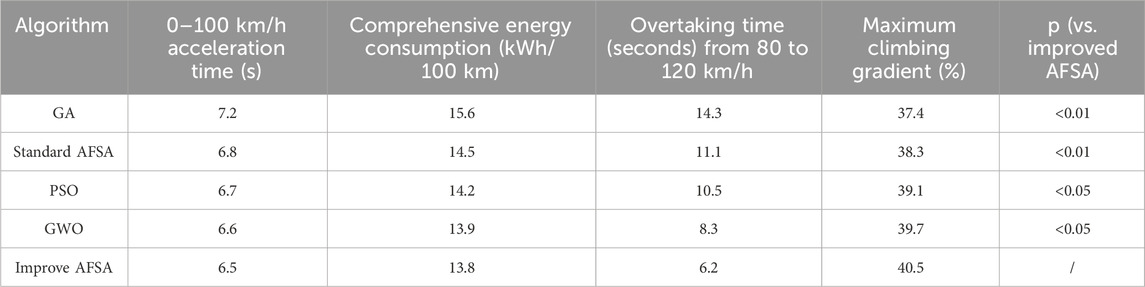
Table 4. Key performance indicators and statistical significance test results of different algorithms.
The experiment simultaneously tested the overhead of each algorithm under the conditions of 80 kWh battery capacity and 350 N·m motor peak torque. The specific results are shown in Table 5. It can be known from Table 5 that the single optimization time of the improved AFSA is 183.7 s. Although it is 16.0% higher than that of the standard AFSA (158.3 s), it is significantly lower than that of GA (251.6 s) and PSO (212.8 s), and only 7.7% higher than that of GWO (170.5 s). In terms of complexity, the improved AFSA maintains the same O (n2) time complexity as the standard AFSA, without increasing the level due to parameter classification and adjustable field of view mechanism. The space complexity for both is O (n). This indicates that the computational cost increment of the improved AFSA is controllable, and the number of iterations of non-critical parameters is reduced through parameter classification. It still has practicality in engineering applications, making up for the deficiency of the original text that only mentioned the cost without quantitative comparison, and more comprehensively reflecting the advantages and disadvantages of the method.
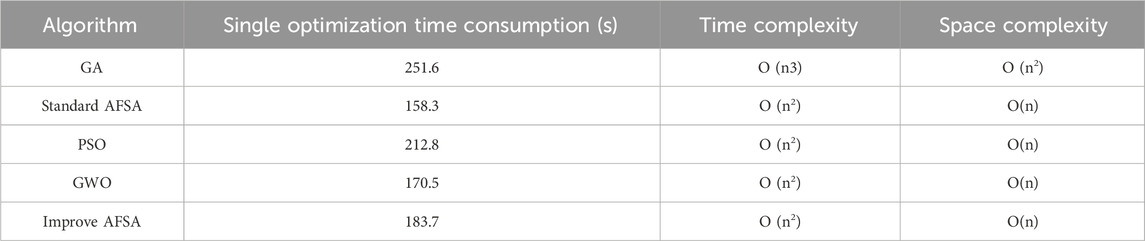
Table 5. Comparison of Computational Costs of Each algorithm.
The results of 80–120 km/h overtaking time and peak motor efficiency after power parameter matching optimization using different methods are shown in Figure 9. From Figure 9a, the overtaking time at 80–120 km/h was the longest after optimizing the action force parameter matching based on GA, and the overtaking time at 80–120 km/h was the shortest after optimizing the action force parameter matching based on improved AFSA. When the motor base speed was 2,800 rpm, the overtaking time between 80 and 120 km/h was 6.2 s and 14.3 s, respectively. From Figure 9b, the peak motor efficiency was highest after optimizing the power parameter matching based on the improved AFSA. When the cooling flow rate was 7 L/min, the motor efficiency peak was 93.4%. The effectiveness of the proposed method in solving the synergistic optimization problem of power performance and electric drive efficiency is verified.
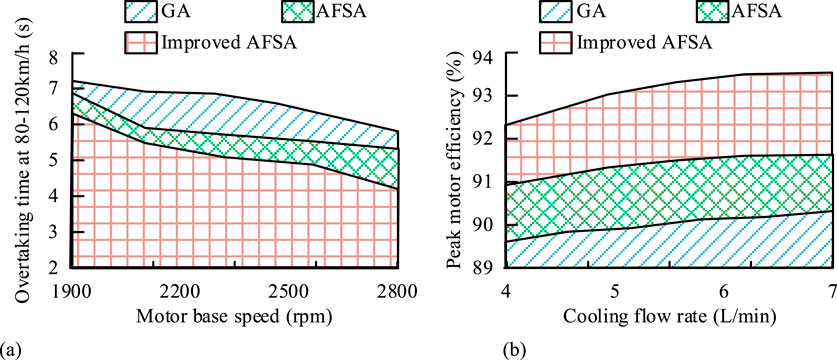
Figure 9. 80–120 km/h overtaking time and peak motor efficiency after power parameter matching optimization using different methods. (a) Overtaking time of 80–120 km/h after matching power parameter. (b) Peak motor efficiency after matching power parameters.
The core advantage of the integrated optimization framework proposed by the research institute lies in the combination of sensitive-driven parameter classification and the improved AFSA with a dynamic adaptive mechanism, effectively solving the problems of low optimization efficiency and easy falling into local optimum in high-dimensional parameter Spaces due to strong coupling and large sensitivity differences. This methodology is not limited to the power parameter allocation of electric vehicles, but also demonstrates great potential in addressing similar challenges in other complex engineering systems. To specifically illustrate this point, the study conducts a comparative analysis of the proposed method by Panic et al. (2023) in the performance analysis of hybrid free-space optical communication/radio frequency systems. Panic et al. (2023) research aims to enhance the robustness of the system by constructing a composite channel model that integrates Chi-square/Gamma turbulence and Rician fading, and adopting the received diversity technique. From the perspective of system optimization, this is essentially about countering strong random disturbances from the external environment by introducing structural redundancy. In contrast, the research is confronted with the “internal uncertainty” of strong nonlinear coupling and dynamic operating point drift among the internal parameters of the power system of electric vehicles. The approach adopted in the research is not to increase hardware redundancy, but to precisely identify and collaboratively optimize the parameters of the system itself through intelligent algorithms, thereby tapping the inherent potential of the system from the control level and enhancing its inherent robustness. Based on the above comparison and analysis, the research method can be transferred to any complex system optimization problem involving high-dimensional, coupled and variously sensitive parameters. For instance, in the field of renewable energy, it can be used to optimize the capacity configuration and dispatching strategies of each unit in a hybrid microgrid of wind, solar and storage. Among them, the sensitivity of parameters such as the inclination Angle of photovoltaic panels and the charge and discharge curves of energy storage systems varies significantly.
5 Summary
Reasonably allocating the power parameters of electric vehicles can optimize energy utilization efficiency and improve the response speed. To extend the battery life of electric vehicles and reduce energy consumption, a new energy vehicle power parameter allocation method that integrated optimized AFSA and system parameter classification was proposed. The maximum lateral acceleration of the curve based on sensitivity analysis system dynamic parameter classification was the highest, while the maximum lateral acceleration of the curve without system dynamic parameter classification was the lowest. When the tire radius was 345 mm, the maximum lateral acceleration at the curve was 0.92 g and 0.87 g, respectively. Compared to other methods, the improved AFSA-based action force parameter matching optimization resulted in the shortest overtaking time and the highest peak motor efficiency at 80–120 km/h. When the motor base speed was 2,800 rpm, the overtaking time between 80 and 120 km/h was 6.2 s. When the cooling flow rate was 7 L/min, the peak efficiency of the motor was 93.4%. The integrated framework proposed in the research not only overcomes the defect that traditional algorithms are prone to fall into local optima, but also achieves efficient coordination between power performance and energy efficiency, rather than simple compromise, providing a reliable technical path for the refined design of new energy vehicle power systems. The proposed method effectively improves the efficiency of power parameter allocation for electric vehicles and reduces costs. However, AFSA has high computational overhead when dealing with large-scale problems, and the algorithm requires more storage space and computing resources. Subsequent research will adopt other algorithms for improvement to reduce computational complexity.
Data availability statement
The original contributions presented in the study are included in the article/supplementary material, further inquiries can be directed to the corresponding author.
Author contributions
YL: Conceptualization, Writing – original draft. ZG: Investigation, Methodology, Writing – review and editing. HY: Methodology, Validation, Writing – review and editing.
Funding
The authors declare that financial support was received for the research and/or publication of this article. The research is supported by: Henan Province Key Research and Promotion Special Project (Science and Technology Tackle), Research on Thermal Characteristics and Thermal Management System of Electric Vehicle Power Battery, (No. 242102240015).
Conflict of interest
The authors declare that the research was conducted in the absence of any commercial or financial relationships that could be construed as a potential conflict of interest.
Generative AI statement
The authors declare that no Generative AI was used in the creation of this manuscript.
Any alternative text (alt text) provided alongside figures in this article has been generated by Frontiers with the support of artificial intelligence and reasonable efforts have been made to ensure accuracy, including review by the authors wherever possible. If you identify any issues, please contact us.
Publisher’s note
All claims expressed in this article are solely those of the authors and do not necessarily represent those of their affiliated organizations, or those of the publisher, the editors and the reviewers. Any product that may be evaluated in this article, or claim that may be made by its manufacturer, is not guaranteed or endorsed by the publisher.
References
Ahuchogu, M. C., Sanyaolu, T. O., and Adeleke, A. G. (2024). Exploring sustainable and efficient supply chains innovative models for electric vehicle parts distribution. Glob. J. Res. Sci. Technol. 2 (1), 78–85. doi:10.58175/gjrst.2024.2.1.0050
Alhndawi, A. H. Y., Alshorman, H., and Alkhadrawi, S. (2024). A hybrid approach to water potability prediction: leveraging artificial fish swarm algorithm and convolutional neural networks. Asian J. Civ. Eng. 25 (3), 2715–2727. doi:10.1007/s42107-023-00940-7
Bai, G., Qu, L., Liu, J., and Sun, D. (2023). AoI-aware joint scheduling and power allocation in intelligent transportation system: a deep reinforcement learning approach. IEEE Trans. Veh. Technol. 73 (4), 5781–5795. doi:10.1109/tvt.2023.3333825
Bilgiç, E., Bilgiç, H., and Kantaroglu, E. (2024). Wireless power transfer systems and wireless charging design between electric vehicles. J. Comput. and Electr. Electron. Eng. Sci. 29 (2), 56–61. doi:10.51271/JCEEES-0019
Bueno, J. N. A. D., Marcos, L. B., Rocha, K. D. T., and Terra, M. H. (2023). Regulation of uncertain markov jump linear systems with application on automotive powertrain control. IEEE Trans. Syst. Man, Cybern. Syst. 53 (8), 5019–5031. doi:10.1109/tsmc.2023.3260781
Feng, Z., Luo, N., Shalpegin, T., and Cui, H. (2024). The influence of carbon emission reduction instruments on blockchain technology adoption in recycling batteries of the new energy vehicles. Int. J. Prod. Res. 62 (3), 891–908. doi:10.1080/00207543.2023.2175173
Guo, Y., Zhan, Y., Zhang, Y., Wang, Y., Xu, Z., and Li, J. (2024). Population fusion optimization algorithm for GNSS integer ambiguity resolution based on PSO and AFSA. Chin. J. Eng. 46 (12), 2246–2256. doi:10.13374/j.issn2095-9389.2024.02.23.004
He, S., and Wang, Y. (2023). Evaluating new energy vehicles by picture fuzzy sets based on sentiment analysis from online reviews. Artif. Intell. Rev. 56 (3), 2171–2192. doi:10.1007/s10462-022-10217-1
Herin, M., Il Idrissi, M., Chabridon, V., and Iooss, B. (2024). Proportional marginal effects for global sensitivity analysis. SIAM/ASA J. Uncertain. Quantification 12 (2), 667–692. doi:10.1137/22M153032X
Huang, X., Li, Z., Lü, H., and Shangguan, W. B. (2024). Uncertainty analysis of powertrain mounting systems with independent and correlated parameters based on multidimensional parallelepiped model. Proc. Institution Mech. Eng. 238 (14), 4596–4609. doi:10.1177/09544070231212720
Jha, A. K., Darlami, H. B., Bhattarai, N., Karn, S., and Neupane, G. (2025). Projecting energy demand and GHG reduction with electric vehicle adoption in Nepal. Appl. Eng. Lett. 10 (3), 160–170. doi:10.46793/aeletters.2025.10.3.4
Joshua, K. P., Manjula, A., Jegathesan, V., and Prabagaran, S. (2024). Optimizing fuel cell power: an online energy management strategy for extended range in fuel cell hybrid electric vehicles. Environ. Dev. Sustain. 28 (1), 1–23. doi:10.1007/s10668-024-05279-w
Kang, D. (2025). Development of online sports guiding assurance system based on artificial fish swarm algorithm and intelligent speech semantic extraction. Int. J. Syst. Assur. Eng. Manag. 16 (3), 939–948. doi:10.1007/s13198-025-02718-3
Kumar, N., and Khandelwal, V. (2023). Compensation of wavefront aberration using oppositional-breeding artificial fish swarm algorithm in free space optical communication. J. Opt. 52 (3), 1370–1380. doi:10.1007/s12596-022-00947-4
Liu, J., Li, Y., Huang, M., Zeng, L., and Lu, Y. (2023a). Generation of unidirectional fiber random distribution structures based on an artificial fish swarm algorithm with random deletion after fiber filling. J. Compos. Mater. 57 (15), 2353–2365. doi:10.1177/00219983231172067
Liu, J., Zhang, J., and Yin, S. (2023b). Hybrid chaotic system-oriented artificial fish swarm neural network for image encryption. Evol. Intell. 16 (1), 77–87. doi:10.1007/s12065-021-00643-5
Long, X. M., Chen, Y. J., and Zhou, J. (2023). Development of AR experiment on electric-thermal effect by open framework with simulation-based asset and user-defined input. Artif. Intell. Appl. 1 (1), 52–57. doi:10.47852/bonviewAIA2202359
Lyu, R., Guo, H., Zheng, K., Sun, M., and Chen, Q. (2023). Co-optimizing bidding and power allocation of an EV aggregator providing real-time frequency regulation service. IEEE Trans. Smart Grid 14 (6), 4594–4606. doi:10.1109/TSG.2023.3252664
Nandhini, S. S., and Kannimuthu, S. (2024). Mining high average utility itemsets using artificial fish swarm algorithm with computed multiple minimum average utility thresholds. J. Intelligent and Fuzzy Syst. 46 (1), 1597–1613. doi:10.3233/JIFS-231852
Nie, X., and Jiao, Y. (2023). Research on transmission control of airborne communication data link system based on artificial fish swarm algorithm. Automatic Control Comput. Sci. 57 (4), 327–336. doi:10.3103/s0146411623040077
Panic, S., Petrovic, V., Draskovic, S., Kontrec, N., and Milojevic, S. (2023). Performance analysis of hybrid fso/rf communication system with receive diversity in the presence of chi-square/gamma turbulence and rician fading. Bull. D. Serikbayev EKTU, 304–312. doi:10.51885/1561-4212_2023_4_304
Pourpanah, F., Wang, R., Lim, C. P., Wang, X. Z., and Yazdani, D. (2023). A review of artificial fish swarm algorithms: recent advances and applications. Artif. Intell. Rev. 56 (3), 1867–1903. doi:10.1007/s10462-022-10214-4
Qiu, B., Wang, Y., Xiao, H., and Zhang, Z. (2024). Deep reinforcement learning-based adaptive computation offloading and power allocation in vehicular edge computing networks. IEEE Trans. Intelligent Transp. Syst. 25 (10), 13339–13349. doi:10.1109/TITS.2024.3391831
Quan, V. H. (2024). Research and optimization of sport utility vehicle aerodynamic design. Appl. Eng. Lett. 9 (2), 105–115. doi:10.46793/aeletters.2024.9.2.5
Senapati, M. K., Al Zaabi, O., Al Hosani, K., Al Jaafari, K., Pradhan, C., and Muduli, U. R. (2024). Advancing electric vehicle charging ecosystems with intelligent control of DC microgrid stability. IEEE Trans. Industry Appl. 60 (5), 7264–7278. doi:10.1109/TIA.2024.3413052
Shahbazi, A., Moradi CheshmehBeigi, H., and Abdi, H. (2023). Probabilistic optimal allocation of electric vehicle charging stations considering the uncertain loads by using the monte carlo simulation method. J. Operation Automation Power Eng. 11 (4), 277–284. doi:10.22098/joape.2023.10427.1738
Skrucany, T., Semanova, S., Milojević, S., and Ašonja, A. (2019). New technologies improving aerodynamic properties of freight vehicles. Appl. Eng. Lett. 4 (2), 48–54. doi:10.18485/aeletters.2019.4.2.2
Sun, Y., Wen, S., Shi, S., and Chen, Y. (2024). Individual adaptive regulation strategy inspired by artificial fish swarm algorithm for tumor targeting. IEEE Trans. Mol. Biol. Multi-Scale Commun. 10 (1), 132–143. doi:10.1109/tmbmc.2024.3361251
Wang, S., Li, Y., Zhou, Y., Peng, G., and Xu, W. (2023). Identification of thermal conductivity of transient heat transfer systems based on an improved artificial fish swarm algorithm. J. Therm. Analysis Calorim. 148 (14), 6969–6987. doi:10.1007/s10973-023-12182-5
Wasserburger, A., Didcock, N., and Hametner, C. (2023). Efficient real driving emissions calibration of automotive powertrains under operating uncertainties. Eng. Optim. 55 (1), 140–157. doi:10.1080/0305215X.2021.1989589
Xiao, Z., and Wang, X. (2023). Evolutionary niche artificial fish swarm algorithm for dynamic subgroup size adjustment in robot swarms. IEEE Trans. Cognitive Dev. Syst. 16 (4), 1274–1290. doi:10.1109/tcds.2023.3345931
Xue, J., Yu, K., Zhang, T., Zhou, H., Zhao, L., and Shen, X. (2024). Cooperative deep reinforcement learning enabled power allocation for packet duplication URLLC in multi-connectivity vehicular networks. IEEE Trans. Mob. Comput. 23 (8), 8143–8157. doi:10.1109/TMC.2023.3347580
Zhao, L., Wang, F., and Bai, Y. (2023). Route planning for autonomous vessels based on improved artificial fish swarm algorithm. Ships Offshore Struct. 18 (6), 897–906. doi:10.1080/17445302.2022.2081423
Keywords: AFSA, parameter allocation, electric vehicles, power parameters, sensitivity analysis
Citation: Liu Y, Guo Z and Yao H (2025) Power parameter allocation of electric vehicles by integrating optimized AFSA and system parameter classification. Front. Mech. Eng. 11:1702693. doi: 10.3389/fmech.2025.1702693
Received: 10 September 2025; Accepted: 27 November 2025;
Published: 12 December 2025.
Edited by:
Evangelos G. Giakoumis, National Technical University of Athens, GreeceReviewed by:
Lei Zhang, Beijing Institute of Technology, ChinaAleksandar Ašonja, Business Academy University (Novi Sad), Serbia
Copyright © 2025 Liu, Guo and Yao. This is an open-access article distributed under the terms of the Creative Commons Attribution License (CC BY). The use, distribution or reproduction in other forums is permitted, provided the original author(s) and the copyright owner(s) are credited and that the original publication in this journal is cited, in accordance with accepted academic practice. No use, distribution or reproduction is permitted which does not comply with these terms.
*Correspondence: Yang Liu, MTU5ODE4MzIzMDlAMTYzLmNvbQ==