 Xianjun Zeng1,2
 Jianwei Ma
- 1Department of Automotive Engineering, Hebei Vocational University of Technology and Engineering, Xingtai, Hebei, China
- 2Hebei Special Vehicle Modification Technology Innovation Center, Xingtai, Hebei, China
To address the issues of large cogging torque and poor sinusoidal waveform of induced electromotive force in traditional pure rare earth permanent magnet generators for extended-range electric vehicles, a novel permanent magnet-assisted reluctance generator with hybrid magnetic poles formed by rare-earth and non-rare-earth permanent magnets for series excitation is proposed. The topological structure and operating principle of the generator are introduced. Based on this, an equivalent magnetic circuit model is established, and the analytical expressions of the cogging torque and induced electromotive force of the permanent magnet generator are derived to analyze their main influencing factors. A finite element model of a three-phase 8-pole 36-slot interior dual radial combined magnetic pole permanent magnet generator is established. Sensitivity hierarchical optimization is carried out on the relevant parameters such as the size and position angle of the combined magnetic poles and their corresponding magnetic barriers, so as to obtain the structural parameters affecting the generator’s cogging torque, the amplitude of the induced electromotive force, and the total harmonic distortion (THD) of the induced electromotive force waveform. Then, the data is normalized and a weighted evaluation index is used to obtain the optimal solution combination. Finally, the feasibility of this method is verified through finite element simulation analysis. The results indicate that the amplitude of the no-load induced electromotive force of the generator increased by 6.97%, the THD decreased by 16.2%, and the cogging torque was weakened by 43.8%, effectively improving the output performance of the generator.
1 Introduction
With the rapid development of the automotive industry, the two global issues of environmental pollution and energy shortage have become increasingly severe. Under such a grim situation, governments and automotive enterprises around the world have regarded energy conservation and emission reduction as the main plans for future automotive development. Therefore, new energy vehicles that can reduce pollution and save resources have become a hot topic for global experts and scholars to conduct research on. As a typical representative of new energy vehicles, electric vehicles feature low pollution, high efficiency, and diversified energy sources. However, before significant breakthroughs are made in power battery energy storage technology, the cruising range of pure electric vehicles has become a bottleneck problem restricting their development (Jia et al., 2024; Jing et al., 2024).
Extended-range electric vehicles are plug-in hybrid vehicles with a series configuration. They add an auxiliary power generation system to the platform of pure electric vehicles, which can provide additional electric energy for the whole vehicle when the power of the power battery is insufficient, thereby extending the driving range. Meanwhile, as people’s requirements for the comfort and entertainment of transportation are getting higher and higher, more and more electrical equipment is integrated in electric vehicles. The corresponding increase in power consumption poses challenges to the power generation and voltage stabilization system of electric vehicles. The range extender, as the core component of extended-range electric vehicles, is mainly composed of an engine and a generator. The engine drives the generator, and the generator generates electric energy for the electric vehicle. Currently, most generators used in range extenders are permanent magnet generators, which have the advantages of high efficiency, small size, and high reliability (Zhang et al., 2017; Li et al., 2024). However, since rare-earth permanent magnet materials are non-renewable resources and expensive, the cost of the generator is too high. Therefore, how to reduce the production cost of the generator and the dependence on rare-earth materials by using inexpensive ferrite to replace rare-earth permanent magnet materials has become one of the urgent problems to be solved. Considering the gap in magnetic properties between ferrite and NdFeB (Pošković et al., 2022; Xie et al., 2022), relying solely on ferrite as the excitation source may not meet the power supply requirements of electric vehicles. Therefore, rare-earth-reduced permanent magnet generators have become a hot research topic at present (Wang et al., 2025; Chen et al., 2025).
In the domestic and international research on rare-earth-reduced permanent magnet generators, the method of hybrid excitation (Zhang et al., 2024; Xu et al., 2025; Yu et al., 2019) is relatively common. By jointly exciting the electric excitation magnetic field and the permanent magnet magnetic field, the output power is increased, thereby reducing the usage of permanent magnets. However, due to the introduction of the electric excitation winding in the hybrid excitation generator, the losses and temperature rise of this type of generator are relatively large, which in turn reduces the power density and power generation efficiency of the generator. In recent years, permanent magnet-assisted reluctance generators have become a new research hotspot (Mohammadi and Mirimani, 2022; Gao et al., 2025; Liu et al., 2022). Reference analyzed and compared the effective magnetic fluxes of rare-earth-reduced permanent magnet motors and rare-earth permanent magnet motors. The results show that on the premise of ensuring the electromagnetic torque of the motor remains unchanged, the rare-earth-reduced permanent magnet motor can reduce the rare-earth usage by 14.3%. Reference (Xiao et al., 2021) used an asymmetric rotor structure to optimize the torque ripple and high-order harmonic content of the motor. By changing the angle of the middle-layer magnetic barrier, the N-pole and S-pole of the middle-layer magnetic barrier of the rotor are made asymmetric, while the other two layers of magnetic barriers remain unchanged. On the premise of keeping the output torque unchanged, the torque ripple can be effectively reduced.Reference (Li et al., 2019) proposed a new generator topology based on the different placement positions of permanent magnets. Compared with the traditional IPM motor, this generator can further increase the induced electromotive force and the amplitude of the air-gap magnetic density under the premise of using the same amount of permanent magnets, thereby improving the power density. Reference (Xu et al., 2020) proposed a method of combining magnetic barriers with three different angles, using an asymmetric rotor and changing the end position of the magnetic barriers to reduce the 12th harmonic, so as to reduce the cogging torque and the waveform distortion rate of the no-load induced electromotive force. Reference (Nobahari et al., 2022) proposed an improved segmented permanent-magnet assisted synchronous reluctance motor, which combines the interior permanent-magnet generator with the synchronous reluctance generator to improve the utilization rate of permanent magnets and enhance the performance of the generator. The amplitude of the no-load induced electromotive force of this generator is increased by 15%, and the amount of permanent magnets used is reduced by 29%. However, the cogging torque is significantly increased.Reference (Zhou et al., 2024) proposed a new asymmetric alternate-pole permanent magnet-assisted synchronous reluctance motor, which can effectively improve the power generation performance. However, due to the design of asymmetric magnetic barriers, the machining difficulty of this motor is relatively large. Reference (Kumar et al., 2024) proposed a permanent magnet placement scheme based on the Halbach array, with its permanent magnet distribution. The rotor permanent magnets using the “Halbach array” have a better magnetic focusing effect, which improves both the electromagnetic torque and efficiency of the PMA-SynRG. Nevertheless, the permanent magnets of this structure are divided into too many blocks and have irregular shapes, resulting in great difficulties in the actual production and installation of the permanent magnets.
In summary, research on permanent magnet-assisted reluctance generators has mainly focused on the placement of permanent magnets and the setting of the number and shape of magnetic barriers in recent years (Zhu et al., 2025; Xu et al., 2024). Although it can improve the utilization rate of permanent magnet materials and weaken the cogging torque, the cogging torque can only be weakened under certain specific combinations of magnetic barrier angles. Moreover, the multi-layer magnetic barrier structure has a relatively complex magnetic circuit, and the optimization design workload is large. At present, there are few studies on a systematic and accurate optimization design method for rare earth reduced combined pole permanent magnet generators, which can achieve the simultaneous reduction of cogging torque and high order harmonic content in the air gap while improving the no-load induced electromotive force. This paper considers introducing two types of hybrid excitation materials into the permanent magnet-assisted reluctance generator, adopting a design method of forming combined poles with rare-earth and non-rare-earth materials. It conducts in-depth research on the influencing factors of the direct and quadrature axis magnetic circuits, increases the difference between the direct and quadrature axis inductances. By analyzing the size parameters and positions of the magnetic poles, the optimal matching parameters are determined to improve the output characteristics of the generator while reducing the usage of rare-earth permanent magnets.
2 Analysis of generator structure and electromagnetic characteristics
2.1 Topological structure of the generator
The permanent magnet-assisted synchronous reluctance generator with less-rare-earth combined magnetic poles (LRE-PMA-SynRG) proposed in this paper adopts a pole-slot combination of eight poles and 36 slots, and the stator winding is in the form of short-pitched winding. The permanent magnet rotor has a double-layer radial magnetic circuit structure, which can increase the strength of the permanent magnet magnetic field and improve the utilization rate of the rotor core. To better improve the utilization rate of permanent magnet materials, V shaped magnetic barriers are respectively set at both ends of each layer of magnetic poles. Each layer of rotor magnetic steel uses two permanent magnet materials, rare-earth neodymium iron boron and non-rare-earth ferrite, as the excitation sources for common excitation. Among them, the ferrite permanent magnet steel is located in the middle of the combined magnetic pole, and the neodymium iron boron permanent magnet steel is located at both ends of the combined magnetic pole. Moreover, the neodymium iron boron permanent magnets and magnetic barriers on both sides are symmetrical about the axis, and the sizes of the permanent magnets at both ends and the included angles of the magnetic barriers are equal. The structural diagram of the generator is shown in Figure 1, and the structural dimension parameters of the rotor magnetic poles are shown in Figure 2.

Figure 1. Structural diagram of LRE-PMA-SynRG.

Figure 2. Schematic diagram of rotor pole parameters.
According to the performance requirements of the generator for range-extended electric vehicles, the structural parameters of the rare-earth-reduced combined pole permanent magnet generator are determined using empirical formulas, as shown in Table 1.

Table 1. Main parameters of PM generator.
2.2 Analysis of electromagnetic properties
The rotor structure of LRE-PMA-SynRG maintains circular symmetry. The distribution of the rotor’s d-q axis is shown in Figure 3, and the permanent magnets are placed on the q axis.

Figure 3. d-q axis distribution of LRE-PMA-SynRG.
To simplify the analysis model, this paper makes some assumptions, ignoring spatial harmonics and time harmonics, and neglecting iron losses. Through coordinate transformation of LRE-PMA-SynRG, the equations of flux linkage, voltage, electromagnetic torque, and electromagnetic power in the d-q axis coordinate system can be expressed as follows.
The flux linkage equation is expressed as Equation 1.
Where, ѱd is the flux linkage of d axis, ѱq is the flux linkage of q axis. Ld is d axis inductance component. Lq is q axis inductance component. id is d axis current component.iq is q axis current component. ѱpm is permanent magnet flux linkage.
The voltage equation is shown in Equation 2.
Where, ud is d axis voltage component. uq is q axis voltage component. Rs is the stator resistance, and ω is the angular velocity of the generator.
The electromagnetic torque equation is shown in Equation 3.
Where,Te represents the electromagnetic torque, and p is the number of pole pairs of the generator. Therefore, the electromagnetic power equation of the generator can be obtained.as shown in Equation 4.
According to Equations 3, 4 it can be seen that the output voltage of the generator is directly related to the d axis and q axis inductances. The electromagnetic torque is composed of the permanent magnet torque and reluctance torque. The reluctance torque is generated due to the asymmetry between the d axis and q axis magnetic circuits, while the permanent magnet torque is produced by the excitation effect of the permanent magnets. Therefore, by increasing the difference between the d axis and q axis inductances and the permanent magnet flux linkage of the generator, the power density of the generator can be effectively improved, and the power generation performance can be enhanced.
2.3 Comparison of Generator’s structures based on electromagnetic characteristics
To investigate the electromagnetic characteristics of LRE-PMA-SynRG, it is compared with two permanent magnet-assisted reluctance generators excited by a single magnetic pole material. The structural diagrams of the other two permanent magnet-assisted synchronous reluctance generators are shown in the figure. Figure 4a shows the structural diagram of the permanent magnet generator with embedded ferrite, and Figure 4b shows the structural diagram of the permanent magnet generator with embedded rare-earth NdFeB.
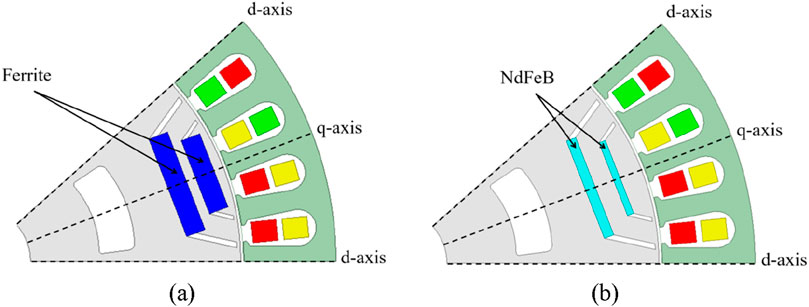
Figure 4. Permanent magnet-assisted reluctance generator excited by two single-pole magnetic materials. (a) Interior ferrite permanent magnet generator. (b) Interior NdFeB permanent magnet generator.
For ease of analysis, the influence of temperature rise during the generator’s operation is ignored, and its operating temperature is assumed to be 23 °C. The ferrite material selected in Figure 4a is Y30BH, with a residual magnetic induction of 0.37T, a coercive force of 240 kA/m, and a maximum magnetic energy product of 28 kJ/m3. In Figure 4b, the rare-earth neodymium-iron-boron material selected is NdFeB35, with a residual magnetic induction of 1.22T, a coercive force of 890 kA/m, and a maximum magnetic energy product of 287 kJ/m3. The magnetic flux, magnetomotive force, pole-arc coefficient, and magnetic barrier angle of the three-structure generators are controlled to be consistent to ensure that the permanent magnet flux linkages of the three-structure generators are equal.
Finite element simulation is carried out on the above model. The waveform diagram of the no load induced electromotive force obtained is shown in Figure 5, The harmonic amplitude diagram after its Fourier decomposition is shown in Figure 6, and cogging torque is shown in Figure 7.
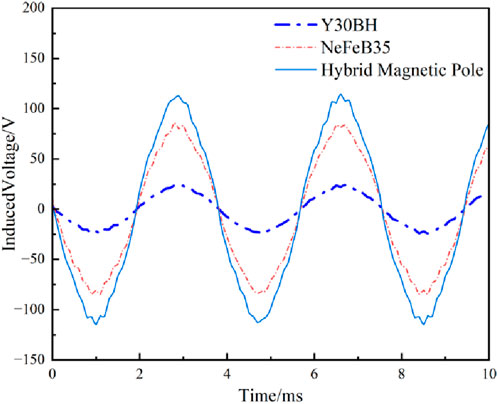
Figure 5. Waveform diagram of no-load induced electromotive force.
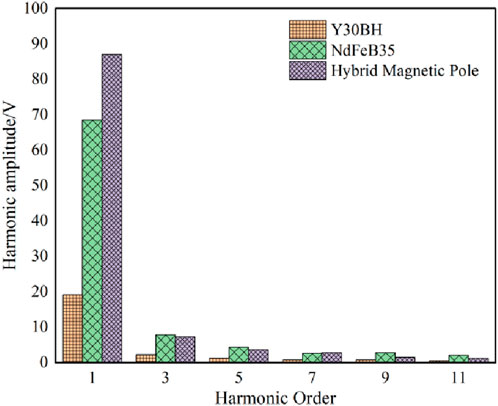
Figure 6. Harmonic amplitude diagram of no-load induced electromotive force.
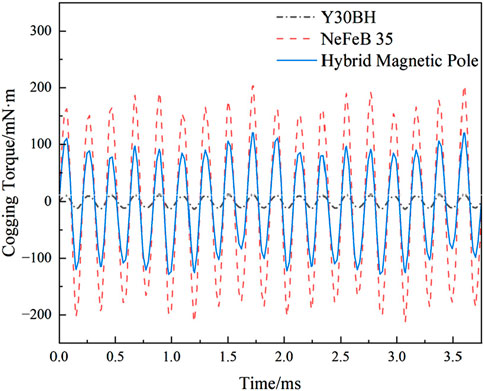
Figure 7. Waveform diagram of cogging torque.
As can be seen from Figure 5, the maximum amplitude of the no-load induced electromotive force of the LRE-PMA-SynRG is 114.7 V, followed by the interior NdFeB permanent magnet generator with 86 V. Although the ferrite is used in the largest quantity, its amplitude is still the lowest, at 24 V. It can be seen that the design of the combined poles can effectively enhance the back electromotive force. From Figure 6, it can be seen that the fundamental wave amplitude of the no-load induced electromotive force of LRE-PMA-SynRG is the highest, at 87 V. The fundamental wave amplitude of the no-load induced electromotive force of the interior NdFeB permanent magnet generator is slightly lower than that of LRE-PMA-SynRG, while the fundamental wave amplitude of the interior ferrite permanent magnet generator is the lowest, at 19 V. Therefore, the total harmonic distortion (THD) of the no-load induced electromotive force waveform can be calculated from the harmonics in Figure 7. The less the high-order harmonic content, the smaller the distortion rate. Therefore, the first 11 harmonics are taken for the calculation of THD, and the THD formula is (Ma et al., 2024):
Where, En is the amplitude of the n harmonic, and E1 represents the amplitude of the fundamental wave.Calculated according to Equation 5, the total harmonic distortion (THD) of the no-load induced electromotive force of LRE-PMA-SynRG, the interior NdFeB permanent magnet generator, and the interior ferrite permanent magnet generator are 10.08%, 14.56%, and 14.5% respectively. Due to the setting of LRE-PMA-SynRG has the lowest waveform distortion rate, and the THD of the other two generators excited by single PM materials have little difference. As can be seen from Figure 7, the amplitude of the cogging torque of LRE-PMA-SynRG is 121 mN m, which is between those of the other two permanent magnet generators. The amplitude of the cogging torque of the interior NdFeB permanent magnet generator is 201 mN m, and that of the interior ferrite permanent magnet generator is 13 mN m. In summary, compared with the generators excited by single permanent-magnet materials, LRE-PMA-SynRG has a higher no-load induced electromotive force and fundamental-wave amplitude, as well as a lower waveform distortion rate. This is because the d axis inductances of the three generator structures are the same, while the q axis inductance changes due to the different thicknesses of the permanent magnets. The thicker the permanent magnet, the greater the q axis reluctance, the smaller the inductance, and the smaller the reluctance torque generated. Therefore, the amplitude of the no-load induced electromotive force of the interior NdFeB permanent magnet generator is lower than that of LRE-PMA-SynRG. On the other hand, although the interior ferrite permanent magnet generator has the same d and q axis inductances as LRE-PMA-SynRG, the ferrite has weak magnetism, resulting in a lower permanent magnet torque. In the operating state, it has a lower amplitude of the no-load induced electromotive force and a lower power density.
3 Establishment of the equivalent magnetic circuit model for LRE-PMA-SynRG
Through the comparative analysis in the previous section, LRE-PMA-SynRG proposed in this paper exhibits good output performance. However, the induced electromotive force still has a relatively large distortion rate, and there is still room for reducing the cogging torque. In this paper, an equivalent magnetic circuit model of LRE-PMA-SynRG is established to analyze the magnetic circuit trend, so as to optimize its output characteristics in a targeted manner. The schematic diagram of the magnetic circuit is shown in Figure 8. It can be seen that there are two main flux paths. One is the main magnetic circuit one composed of four adjacent ferrite magnets No. 1 and permanent magnets No. 2 connected in series, and the other is the main magnetic circuit two composed of four adjacent NdFeB permanent magnets No. One and NdFeB permanent magnets No. 2 connected in series, as shown in Figure 8.

Figure 8. Schematic diagram of the generator magnetic circuit.
The equivalent magnetic circuit model of the generator can be obtained based on the generator’s magnetic circuit, as shown in Figure 9. In this model, the magnetic resistance of the stator core and the rotor core is much smaller than that of the air gap and the permanent magnet. Therefore, the magnetic resistance of the stator and rotor yokes are not considered.
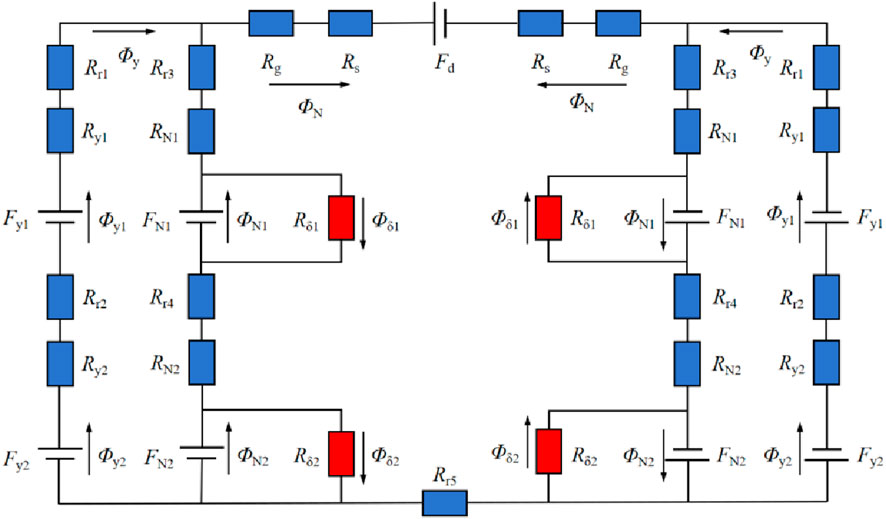
Figure 9. Equivalent magnetic circuit model diagram of LRE-PMA-SynRG.
In the figure, Fy1 represents the magnetomotive force of the No. 1 ferrite, Fy2 represents the magnetomotive force of the No. 2 ferrite, FN1 represents the magnetomotive force of the No. 1 NdFeB permanent magnet, FN2 represents the magnetomotive force of the No. 2 NdFeB permanent magnet, Fd represents the armature reaction magnetomotive force, ϕy represents the total magnetic flux of the ferrite permanent magnet per pole passing through the air gap, ϕy1 represents the magnetic flux of the No. One ferrite permanent magnet, ϕy2 represents the magnetic flux of the No. 2 ferrite permanent magnet, ϕN represents the total magnetic flux of the NdFeB permanent magnet per pole passing through the air gap, ϕN1 represents the magnetic flux of the No. 1 NdFeB permanent magnet, ϕN2 represents the magnetic flux of the No. 2 NdFeB permanent magnet, ϕδ1 represents the leakage flux of the No. 1 NdFeB permanent magnet, ϕδ2 represents the leakage flux of the No. 2 NdFeB permanent magnet, Rr1 represents the reluctance of the rotor core between the No. 1 ferrite and the air gap, Rr2 represents the reluctance of the rotor core between the No. 2 ferrite and the No. 1 ferrite, Rr3 represents the reluctance of the rotor core between the No. 1 NdFeB permanent magnet and the air gap, Rr4 represents the reluctance of the rotor core between the No. 1 NdFeB permanent magnet and the No. 2 NdFeB permanent magnet, Rr5 represents the reluctance of the rotor core between two adjacent NdFeB and ferrite, Rg represents the air gap reluctance of the main magnetic circuits one and 2, and Rs represents the total reluctance of the stator teeth and the stator yoke.
According to Kirchhoff’s laws of magnetic circuits, Formula 6 can be obtained.
From Formula 6, the air gap magnetic fluxes corresponding to the two main magnetic circuits can be obtained, as shown in Formula 7.
In the formula, the reluctance of the No. 1 ferrite permanent magnet is Ry1, the reluctance of the No. 2 ferrite permanent magnet is Ry2, the reluctance of the No. 1 NdFeB permanent magnet is RN1, and the reluctance of the No. 2 NdFeB permanent magnet is RN2, which can be respectively expressed as shown in Formula 8.
Where, μN is the relative magnetic permeability of NdFeB35, and μ0 is the vacuum magnetic permeability.
According to the definition of magnetic flux, the air gap magnetic flux densities corresponding to the two main magnetic circuits can be obtained ,as shown in Formula 9.
In the formula, Ay and AN are the air gap areas penetrated by the main magnetic circuits one and 2, respectively. Combining the pole arc angle parameters and positional relationships in Figure 2, Ay and AN can be expressed as:
In the formula, rg is the radius of the main air gap; αy and αN are the central angles corresponding to the main magnetic circuits one and two respectively. For the permanent magnet generator proposed in this paper, this angle is mainly determined by the opening angle of the magnetic barrier, and the included angles at both ends of the permanent magnets in the same layer are the same. Therefore, αy = 2α1-180°, αN = 2α2-180°.
Cogging torque is the torque generated by the interaction between the permanent magnets and the armature slots when the windings of the permanent magnet motor are not energized. Neglecting the magnetic field energy of the permanent magnets and the iron core, the cogging torque can be expressed as (Fang et al., 2025):
Where, W is magnetic field energy when the generator is deenergized. θ is relative position angle between the stator and the rotor; R1 is outer radius of the rotor; R2 is inner radius of the stator; G(θ) is the function of the relative air gap permeance with respect to the relative position angle between the stator and the rotor. B (θ, α) is function of the air gap magnetic flux density with respect to the relative position angle between the stator and the rotor and the pole arc angle. The Fourier expansion of B2 (θ) in Formula 12 is as follows respectively:
Where, hm (θ) is the thickness of the permanent magnet. Br2 (θ) is the distribution of the air gap magnetic density generated by the permanent magnet along the circumferential direction. For LRE-PMA-SynRG, Br2 (θ) = By2(θ)+BN2(θ). Substituting the aforementioned formula into Formula 11, we obtain Formula 13.
The no-load induced electromotive force of the generator can be expressed as:
Substituting Equations 7, 8, 10 into Equation 14 yields Equation 15.
As can be seen from Formula 15, the influencing factors of the cogging torque and no-load induced electromotive force of the permanent magnet generator: the axial length L, outer radius of the rotor R1, inner radius of stator R2. After the generator is designed, axial length L, outer radius of rotor R1 and inner radius of stator R2 of the stator are generally assumed to be fixed.
4 Multi-objective optimization design of permanent magnet generators
4.1 Screening of key parameters based on parameter sensitivity
To further optimize the cogging torque of the permanent magnet generator, increase the amplitude of the induced electromotive force, and improve the total harmonic distortion (THD) of the waveform, with these three as the optimization objectives, a co-simulation is carried out using Ansys Workbench and Maxwell. A sensitivity hierarchical analysis was conducted on the generator structural parameters analyzed in the previous text. Each structural parameter has different degrees of influence on the optimization objectives, and the parameter sensitivity formula can be expressed as (Geng et al., 2021):
In the formula, xi is the parameter variable, V (G (y/xi)) is the variance of G (y/xi), G (y/xi) is the mean with respect to the dependent variable xi, V(y) is the variance of y.
According to Equation 16, the parameter sensitivities of 12 parameter variables to three optimization objectives can be obtained. The analysis results are shown in Figure 10.
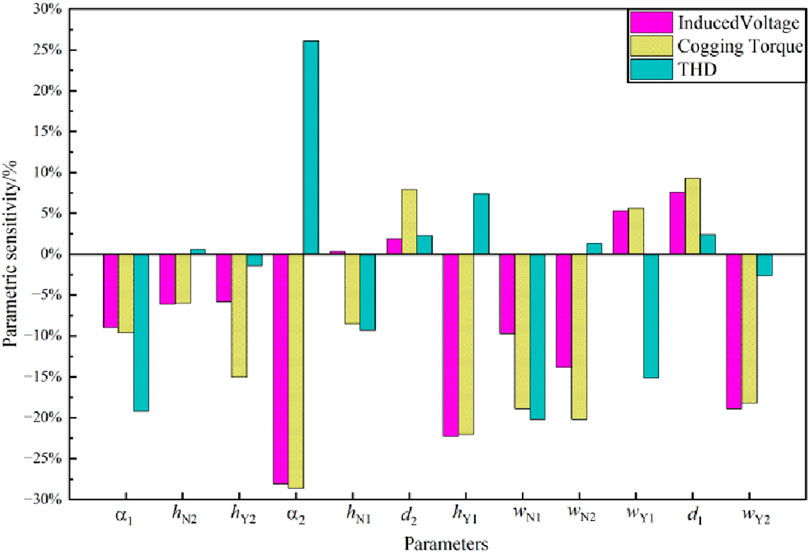
Figure 10. Parameter sensitivity analysis diagram.
Among them, the larger the absolute value of the parameter sensitivity, the greater the influence of the parameter variable on the target. According to the sensitivity values, the sensitivity of the slot structure variable parameters can be stratified. The parameter variables that have a greater influence on each optimization target are regarded as the main optimization parameters, and the parameter variables with a smaller influence can be optimized by single parameter scanning. Analyzing the figure, it can be known that: has the greatest influence on all three optimization targets. hY1、d1 has a relatively large influence on the amplitude of the no load induced electromotive force. hY1、wN1、wN2、wY2 have a relatively large influence on the cogging torque. wN1、α1 and d1 have a relatively large influence on the THD. Meanwhile, d2、hN2、hN1、hY2 have a relatively small influence on the target value. The optimization stratification results of the parameter sensitivity are shown in Table 2.
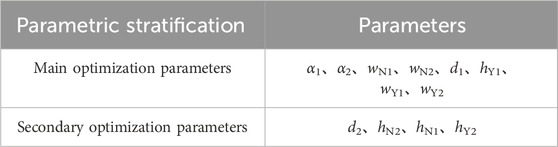
Table 2. Hierarchical results of parameter sensitivity optimization.
To ensure that the manufacturing process meets the strength requirements of the generator during operation and to guarantee the initial design results of the motor, the variation ranges of the parameters of the generator’s magnetic poles and magnetic barriers are determined, as shown in Table 3.

Table 3. Structural parameters and variation ranges of the combined magnetic poles.
4.2 Design of main optimization parameters based on genetic algorithm
After analyzing the sensitivity, the parameters α1、α2、wN1、wN2、d1、hY1、wY1、wY2 are selected as the main parameters to be optimized. The adaptive genetic algorithm can dynamically adjust the crossover and mutation probabilities based on the fitness of individuals quickly, effectively avoiding being trapped in local optimal solutions. Therefore, Workbench is used to conduct multi-objective optimization joint simulation. With the amplitude of the no-load back electromotive force, THD, and cogging torque of generator as the optimization objectives, the optimization model of the generator is established as Equation 17.
Since it is necessary to sample and simulate eight variable parameters simultaneously, even if each design variable only takes five values under the constraint conditions, there are still 390,625 sampling points. Therefore, to simplify the sampling process and reduce the number of samples, the optimal prediction metamodel adaptive sampling algorithm is employed to collect samples of the design variables. The number of sample points is set to 600, and some of the sample points are shown in Table 4.
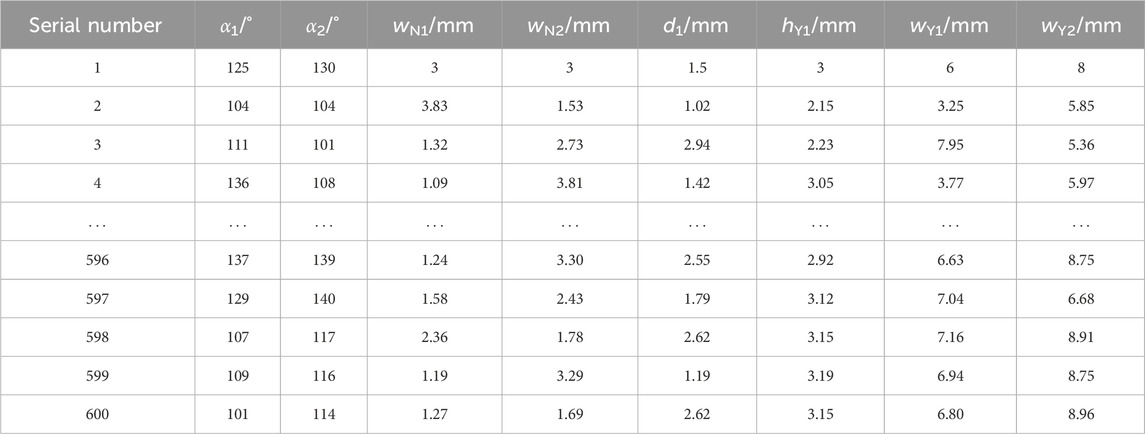
Table 4. List of sampling points for design variables.
Through the design of mutation and crossover operators using the adaptive genetic algorithm, the crossover probability and mutation probability are adaptively adjusted. In multi-objective optimization, a set of optimal solutions is obtained, which is called the Pareto solution set. The scatter plot is shown in Figure 11. In the figure, the x, y, and z-axes represent the THD, cogging torque, and no-load induced electromotive force amplitude, respectively. The red points represent the input variables that meet the constraint conditions, which are the Pareto front design points, the optimal solution set. The cyan points represent the input variables that do not meet the constraint conditions.
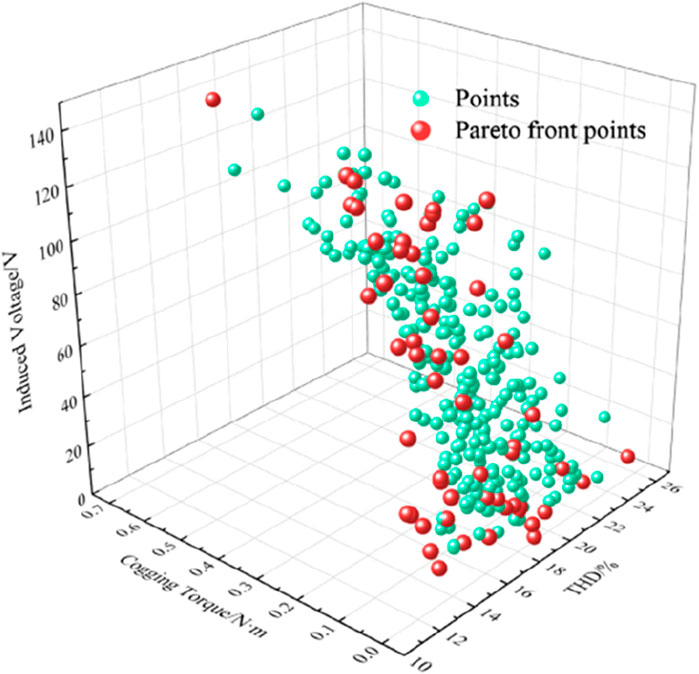
Figure 11. Pareto solution set diagram.
To determine the relatively optimal solution, this paper defines the parameter matching coefficient Q. The larger the value of Q, the better the performance of the corresponding generator. Weighted values are assigned to the three optimization objectives, and its expression is shown in Equation 18.
In the formula, m1, m2, and m3 represent the weighting coefficients, where m1 is set to 0.4, m2 is set to 0.3, and m3 is set to 0.4. E0 is the amplitude of the no load induced electromotive force without using ferrite for excitation, and E0 = 86 V; Tcog0 is the cogging torque without using ferrite for excitation, and Tcog0 = 201 mN m; THD0 is the waveform distortion rate of the no load induced electromotive force without using ferrite for excitation, and THD0 = 14.56%.
According to the calculation formula of the parameter matching coefficient, the variation process of the Q value is shown in Figure 12.

Figure 12. Statistical chart of the parameter matching coefficient Q.
According to the statistical chart of the parameter matching coefficient, the sampling point No. 546 is the relative optimal solution of the optimization model. At this time, the amplitude of the no load induced electromotive force of the generator is 115 V, the THD is 5.26%, and the peak value of the cogging torque is 0.136 N m. Considering the influence of the actual processing technology on the magnetic pole parameters, the parameter optimization results are shown in Table 5.
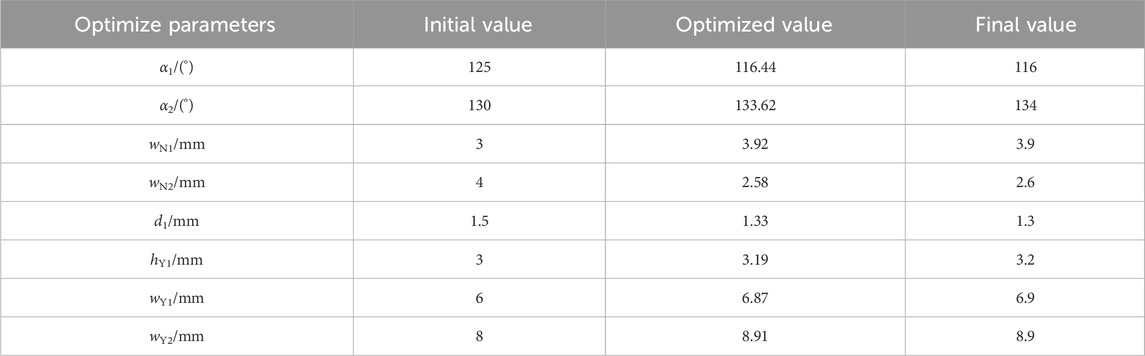
Table 5. Selection of main optimization parameters.
4.3 Secondary optimization parameter design based on finite element analysis
With the optimal values of the above structural parameters determined, considering the mechanical strength of the rotor, d2 is set to 1–3 mm, hN2 to 1–3 mm, hN1 to 0.5–2 mm, and hY2 to 2–4 mm. The simulation step size is 0.05. The curves of the amplitude of the no load induced electromotive force EA, THD, and cogging torque Tcog varying with each parameter are shown in Figure 13.
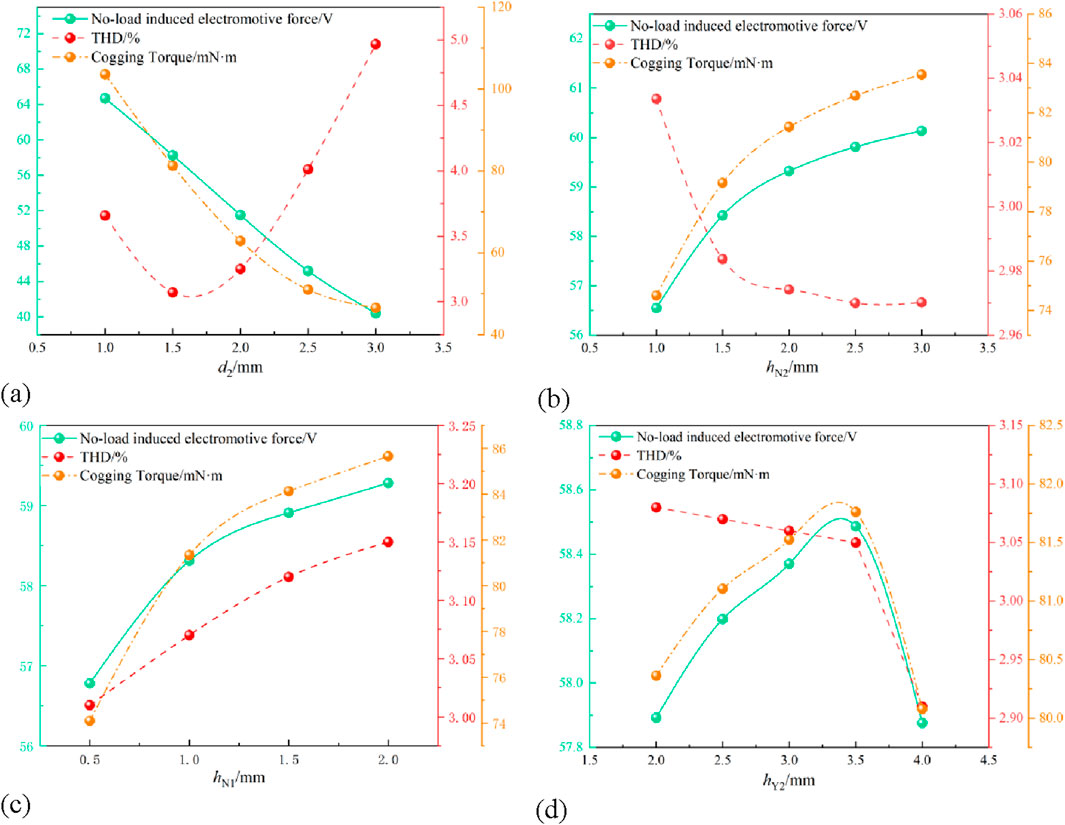
Figure 13. Curves of EA,THD and Tcog varying with four structural parameters. (a) Curves of EA, THD and Tcog varying with d2. (b) Curves of EA, THD and Tcog varying with hN2. (c) Curves of EA, THD and Tcog varying with hN1. (d) Curves of EA, THD and Tcog varying with hY2.
As shown in Figure 13a, the no load induced electromotive force and cogging torque show a continuous and significant decreasing trend with the increase of d2. Meanwhile, the THD first decreases and then increases with the increase of d2, reaching its minimum value when d2 is 1.5 mm. Considering all factors, d2 is set to 1.5 mm. As shown in Figure 13b, the cogging torque and the amplitude of the no-load induced electromotive force increase with the increase of hN2. However, the increase of the no-load induced electromotive force is more significant. When hN2 ranges from one to 1.5 mm, both the no-load induced electromotive force and the cogging torque rise sharply with the increase of hN2.When hN2 ranges from 1.5 to 3 mm, they show a gentle increasing trend with the increase of hN2. Regarding the THD, when hN2 ranges from one to 1.5 mm, the THD drops sharply, and when hN2 ranges from 1.5 to 3.0 mm, the THD decreases slowly. Therefore, it is obvious that hN2 is equal to 1.5 mm is an important inflection point for all three optimization objectives. Thus, the value of hN2 can be determined as 1.5 mm.As can be seen from Figure 13c, with the increase of hN1, the amplitude of the no load induced electromotive force, THD and the cogging torque all show an upward trend. When hN1 ranges from 0.5 to 1 mm, the growth trends of the amplitude of the no load induced electromotive force and cogging torque are relatively obvious. When hN1 ranges from 1 to 3 mm, the growth shows a gentle trend. In summary, hN1 is set to 1 mm. As can be seen from Figure 13d, with the increase of hY2, the amplitude of the no-load induced electromotive force and cogging torque first increase and then decrease, reaching the maximum when hY2 is 3.5 mm. However, THD keeps decreasing with the increase of hY2. When hY2 ranges from 2.0 mm to 3.5 mm, the decreasing trend is relatively gentle, and when hY2 ranges from 3.5 mm to 4.0 mm, the THD drops sharply. Therefore, it is considered to set hY2 as 3.5 mm.
5 Analysis and verification of optimization results
Based on the generator structure determined by the optimal parameter solution combination, the comparison results of the no-load induced electromotive force amplitude, THD and cogging torque of the LRE-PMA-SynRG before and after optimization are obtained through simulation, as shown in Figure 14.
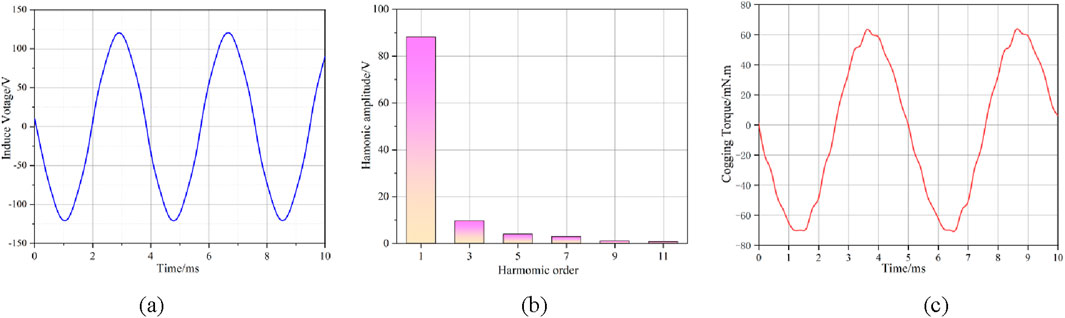
Figure 14. Output performance of generator after optimization. (a) Amplitude of no load induced electromotive force. (b) THD. (c) Cogging Torque.
As shown in Figure 14, the amplitude of the no-load induced electromotive force of the optimized generator is 122.7 V. After Fourier decomposition, the amplitude of its fundamental wave is 88.2 V, and its total harmonic distortion (THD) is calculated to be 12.2%. The maximum value of the cogging torque is 68 mN m. Comparing with the results before optimization (Figures 5–7), it can be seen that the amplitude of the no-load induced electromotive force of the optimized generator is increased by 6.97%, the THD is reduced by 16.2%, and the cogging torque is weakened by 43.8%. Through simulation verification, it is found that this method can significantly improve the no-load induced electromotive force and improve the output characteristics of the generator while reducing the cogging torque and THD.
6 Conclusion
In this paper, by establishing the mathematical model of the generator and combining with the equivalent magnetic circuit method, the analytical expressions affecting the no-load induced electromotive force, cogging torque, and THD are derived. A method of using combined magnetic poles is proposed to improve the output characteristics of the generator. The sensitivity hierarchical optimization is carried out for parameters such as the combined magnetic poles and the corresponding magnetic barrier angles. The influence of the combined magnetic pole parameters on the no-load induced electromotive force, cogging torque, and THD of the generator is analyzed, and the feasibility of this method is verified by the finite element simulation method. (1) When permanent magnets made of two different excitation materials are used for joint excitation, eight parameters such as the magnetic barrier angle and permanent magnet size with high structural parameter sensitivity have a significant impact on the generator performance. Reasonable design of the dimensions can effectively increase the amplitude of the no-load induced electromotive force and weaken the cogging torque and THD. (2) Based on the parameter sensitivity stratification, an optimization method combining the adaptive genetic algorithm with finite element parametric scanning was used to obtain the final parameter combination scheme. As a result, the amplitude of the no-load induced electromotive force of the generator increased by 6.97%, the THD decreased by 16.2%, and the cogging torque is weakened by 43.8%, effectively improving the output performance of the generator.
Data availability statement
The original contributions presented in the study are included in the article/supplementary material, further inquiries can be directed to the corresponding author.
Author contributions
XZ: Writing – review and editing, Formal Analysis, Writing – original draft. BT: Writing – review and editing, Software, Formal Analysis. XS: Data curation, Writing – review and editing, Investigation, Software. JM: Methodology, Writing – review and editing, Funding acquisition.
Funding
The authors declare that financial support was received for the research and/or publication of this article. Funding support was provided by Science and Technology Research Project of Colleges and Universities of Hebei Province (grant number QN2019205).
Conflict of interest
The authors declare that the research was conducted in the absence of any commercial or financial relationships that could be construed as a potential conflict of interest.
Generative AI statement
The authors declare that no Generative AI was used in the creation of this manuscript.
Any alternative text (alt text) provided alongside figures in this article has been generated by Frontiers with the support of artificial intelligence and reasonable efforts have been made to ensure accuracy, including review by the authors wherever possible. If you identify any issues, please contact us.
Publisher’s note
All claims expressed in this article are solely those of the authors and do not necessarily represent those of their affiliated organizations, or those of the publisher, the editors and the reviewers. Any product that may be evaluated in this article, or claim that may be made by its manufacturer, is not guaranteed or endorsed by the publisher.
References
Chen, K., Ma, S., Li, C., Wu, Y., and Ma, J. (2025). Optimization and design of Built-In U-Shaped permanent magnet and salient-pole electromagnetic hybrid excitation generator for vehicles. Symmetry 17 (Jun), 897. doi:10.3390/sym17060897
Fang, L., Zhang, Y., Li, D., and Qu, R. (2025). High-torque density and low-torque ripple-oriented design method for multi-harmonics surface-mounted PM vernier machine. IEEE Trans. Industry Appl. 61 (3), 3687–3700. doi:10.1109/tia.2025.3540726
Gao, Y., Jiang, D., Zhu, H., Mao, B., and Liu, Y. (2025). Design optimization of asymmetric permanent magnet assisted bearingless synchronous reluctance motor. IEEE Trans. Energy Convers. 40, 1644–1654. doi:10.1109/tec.2024.3505844
Geng, H., Zhang, X., Tong, L., Ma, Q., Xu, M., Zhang, Y., et al. (2021). Performance optimization analysis of hybrid excitation generator. With the electromagnetic rotor and embedded permanent magnet rotor for vehicle. IEEE Access 9, 163640–163653. doi:10.1109/access.2021.3133960
Jia, G. L., Ju, X. W., and Zhao, Z. (2024). Summary of centralized drive motor technology development for electric vehicles. J. Shenyang Univ. Technol. 46 (05), 526–540. doi:10.7688/j.issn.1000-1646.2024.05
Jing, W., Geng, W. W., and Liu, D. G. (2024). Design and comparative analysis of a new modular permanent magnet motor with concentrated magnetic rotor for electric vehicles. J. China Electr. Eng. 44 (03), 1184–1195. doi:10.13334/j.0258-8013.pcsee.222707
Kumar, P., Wilson, R., and EL-Refaie, A. (2024). “Enhancing demagnetization resistance in non-rare-earth PM-Assisted synchronous reluctance machine using asymmetric halbach array,” in 2024 IEEE energy conversion congress and exposition (ECCE). Phoenix, AZ, USA, 2024. doi:10.1109/ECCE55643.2024.10861848
Li, Y., Yang, H., Lin, H., Fang, S., and Wang, W. (2019). A novel magnet-axis-shifted hybrid permanent magnet machine for electric vehicle applications. Energies, 12(4):641, doi:10.3390/en12040641
Li, S., Zhou, L., Wang, X., and Dai, Z. (2024). Parameter optimization design of double-layermagnets permanent magnet synchronous motor for vehicles based on multi-round evolutionary algorithm. Sci. Technol. Eng. 24 (28), 9891–9898. doi:10.12404/j.issn.1671-1815.2306748
Liu, K. W., Shi, L. W., and Wang, W. Q. (2022). Optimization and analysis of asymmetrical hybrid permanent magnet motor for electric vehicle. J. Hebei Univ. Sci. Technol. 43(4):355–364. doi:10.27276/d.cnki.gsdgc.2023.000712
Ma, S., Chen, K., and Zhang, Q. (2024). Analysis of multi-objective optimization design of interior double radial and tangential combined magnetic pole permanent magnet drive motor for electric vehicles. World Electr. Veh. J. 15 (4), 142. doi:10.3390/wevj15040142
Mohammadi, A., and Mirimani, S. M. (2022). Design of a novel PM-Assisted synchronous reluctance motor topology using V-Shape permanent magnets for improvement ofTorque characteristic. IEEE Trans. Energy Convers. 37, 424–432. doi:10.1109/tec.2021.3109079
Nobahari, A., Vahedi, A., and Nasiri-Zarandi, R. (2022). A modified permanent magnet-assisted synchronous reluctance motor design for torque characteristics improvement. IEEE Trans. Energy Convers. 37 (2), 989–998. doi:10.1109/tec.2021.3127081
Pošković, E., Ferraris, L., and Bianchi, N. (2022). Different approaches in the use of ferritesin assisted reluctance machines. IEEE Trans. Industry Appl. 6136-6144. doi:10.1109/TIA.2022.3185581
Wang, Z., Wang, X., and Bao, X. (2025). “A PM dimensions design method for hybrid less rare-earth permanent magnet motors based on analytical approach,” in IEEE transactions on transportation electrification, 6512–6524. doi:10.1109/TTE.2024.3510615
Xiao, Y., Zhu, Z. Q., Jewell, G. W., Chen, J., Wu, D., and Gong, L. (2021). A novel asymmetric rotor interior permanent MagnetMachine with hybrid-layer permanent magnets. IEEE Trans. Industry Appl. 57, 5993–6006. doi:10.1109/tia.2021.3117228
Xie, Y., Shao, J., He, S., Ye, B., Yang, F., and Wang, L. (2022). “Novel PM-Assisted synchronous reluctance machines using asymmetrical rotor configuration,” in IEEE access, 79564–79573. doi:10.1109/ACCESS.2022.3195047
Xu, M., Liu, G., and Chen, Q. (2020). Design and optimization of a fault tolerant modular PMaSynRM with torque ripple minimization. IEEE Trans. IndustrialElectronics 68 (9), 8519–8530. doi:10.1109/TIE.2020.3016263
Xu, G., Jia, Z., Chen, Q., Xia, J., Cai, Y., and Zhang, Z. (2024). A fast and effective optimization procedure for the ferrite PMaSynRM to reduce material cost. IEEE Trans. Transp. Electrification 10, 635–647. doi:10.1109/tte.2023.3291489
Xu, M., Hu, W., Wang, M., Zhang, X., Geng, H., Yan, S., et al. (2025). Analysis of electromagnetic performance of a new dual-rotor hybrid excitation generator.IEEJ Trans. Electr. Electron. Eng. 20(11):1813–1825. doi:10.1002/TEE.70143
Yu, J., Cao, Y., Zhu, S., and Liu, C. (2019). Analysis of operation characteristics for dual-direction hybrid excitation brushless DC generator. Transactions of China Electrotechnical Society. 34 (22), 4634–4641. doi:10.19595/j.cnki.1000-6753.tces.181289
Zhang, X. Y., Du, Q. J., Ma, S. L., Hu, W., and Geng, H. (2017). Magnetic flux analysis and performance test of permanent magnet and claw-pole electromagnetic hybrid excitation generator for electric vehicle range extender. Int. J. Electr. Hybrid Veh. 9 (3), 187. doi:10.1504/ijehv.2017.087578
Zhang, X., Zhang, X., Ren, J., Yan, S., Wang, L., Pang, X., et al. (2024). Study of electromagnetic characteristics of brushless reverse claw pole electromagnetic and permanent magnet hybrid excitation generator for automobiles. IEEE Trans. Energy Convers. 39, 1288–1300. doi:10.1109/tec.2023.3338779
Zhou, H., Long, S., Jiang, G., Wang, C., and Liu, Z. (2024). Design and analysis of asymmetric consequent-pole permanent magnet-assisted synchronous reluctance motor based on Flux linkage phase shift principle. Transactions of China Electrotechnical Society. 39 (2), 455–464. doi:10.19595/j.cnki.1000-6753.tces.221805
Keywords: range-extended electric vehicle, permanent magnet generator, combinedmagnetic pole, low rare-earth, parameter sensitivity
Citation: Zeng X, Tao B, Sun X and Ma J (2025) Optimization and analysis of permanent magnet assisted reluctance generator with interior rare - Earth - Less combined magnetic poles for extended range electric vehicles. Front. Mech. Eng. 11:1723780. doi: 10.3389/fmech.2025.1723780
Received: 13 October 2025; Accepted: 18 November 2025;
Published: 02 December 2025.
Edited by:
Liguo Zang, Nanjing Institute of Technology (NJIT), ChinaReviewed by:
Guifu Du, Soochow University, ChinaLeilei Zhao, Shandong University of Technology, China
Shilun Ma, Tianjin University of Technology and Education, China
Copyright © 2025 Zeng, Tao, Sun and Ma. This is an open-access article distributed under the terms of the Creative Commons Attribution License (CC BY). The use, distribution or reproduction in other forums is permitted, provided the original author(s) and the copyright owner(s) are credited and that the original publication in this journal is cited, in accordance with accepted academic practice. No use, distribution or reproduction is permitted which does not comply with these terms.
*Correspondence: Jianwei Ma, bWFqaWFud2VpQGhldnV0ZS5lZHUuY24=