 Tangyun Zhang1,2
 Bao Zhang
- 1School of Mechanical and Power Engineering, Nanjing Tech University, Nanjing, China
- 2Naveco Automobile Co., Ltd, Nanjing, China
For linear system, vibration response can be obtained by working load and vibration transfer function. However, for nonlinear systems, the vibration transfer function is variable, so the error of the existing methods is obvious. In order to improve the fitting precision of nonlinear system vibration response, a hybrid fitting method is proposed. That is, the vibration response is fitted by the vibration transfer function and the working load test. The influence of nonlinear parameters on the vibration transfer function is analyzed. A hybrid fitting method is used to identify the body acceleration on Class A, Class B and Class C pavement, and the analysis results are compared with the test results. The agreement between fitting results and test results is more than 90%. The results show that the hybrid fitting method proposed in this paper can significantly improve the fitting accuracy of nonlinear system vibration response.
1 Introduction
Vibration response is a key index to evaluate mechanical System dynamics, which can be obtained by simulation and test. In order to improve the damping performance of mechanical system, the analysis of vibration transmission path is very important (Lu et al., 2023; Oktav et al., 2017a). For the linear system, the vibration response is calculated mainly according to the transfer function and working load. However, for nonlinear systems, the transfer function is variable, which makes the vibration response analysis difficult (Sakhaei and Durali, 2014; Clarance Mary et al., 2021). In order to improve the fitting accuracy of nonlinear system vibration response, researchers have conducted relevant studies, such as piecewise transfer function method, machine learning method, etc. (Zhai et al., 2017; Yang, 2013). The double wishbone suspension is the object of study, through numerical analysis, the non-linear influence factors of transfer function are revealed. The Double wishbone suspension system is mainly composed of springs, shock absorbers and swing arms. The stiffness of the suspension varies with the deformation of the suspension due to different road excitation. The damping coefficient of the shock absorber varies with the relative velocity of the suspension (Suranjan et al., 2021; Sun et al., 2012). Because of the above characteristics, the transfer function of the Double wishbone suspension is different under different working conditions, which is not conducive to the sensitivity analysis and vibration optimization.
For the dynamic analysis of suspension, the numerical analysis and test method are mainly used at present. For example Zhang and Li (2021) established a double wishbone suspension theoretical model to analyze the nonlinear variation of stiffness, and the sensitivity of the parameters was analyzed. The literature shows that the stiffness of double-swing arm suspension changes with the suspension deformation, so the stiffness parameters have nonlinear characteristics. In Ref. (Wang and Zhang, 2024), the IF function is used to establish the nonlinear simulation model of damping characteristics of vehicle shock absorbers, and the method of piecewise optimization of damping parameters is proposed. The literature shows that the damping of vehicle shock absorbers varies with their relative speed, so the damping parameters have nonlinear characteristics. The transfer path analysis (TPA) method is used to analyze the vibration transfer characteristics of mechanical systems, and the system dynamic response is analyzed by simulation and test methods (Oktav et al., 2017b; Zhang and Huang, 2010). TPA method is mainly used for linear systems or weakly nonlinear systems, but it is not suitable for strongly nonlinear systems.
It is difficult to analyze the vibration transfer characteristics and identify the key influencing parameters of the suspension because of the nonlinear characteristics of the suspension under different excitation. At present, the dynamic simulation and test methods are often used to analyze the vibration response of double wishbone suspension, but the existing methods are not suitable for the identification of key parameters and dynamic response fitting of suspension under multi-working conditions. Therefore, a hybrid fitting method for the dynamic response of nonlinear mechanical systems is proposed in this paper. In paper, the vibration transfer function analysis of nonlinear systems is linearized, and then the influence of nonlinear factors is analyzed. And the vibration response is fitted by the vibration transfer function and the working load test. Compared with the existing methods, the innovation points of the proposed method include: 1. A mathematical model for the vibration transfer characteristics of double wishbone suspension is established, and the influence of nonlinear factors on the vibration transfer function is analyzed. 2. In different road conditions, the test analysis of the tire load and the relative speed of the shock absorber is carried out, and the suspension transfer function is calculated. 3. According to the tire working load test results and the suspension transfer function numerical results, the vibration response of suspension under multiple working conditions is calculated.
2 Characteristics of vibration transfer
2.1 Transfer path analysis model
The double wishbone suspension is composed of control arms and elastic elements, and the road excitation is transmitted to the body through the wheel and suspension, as shown in Figure 1a. Path a1b1 consists of tire and is determined by tire radial stiffness and tire damping. Path cd consists of path c1d1, path c2d2, path c3d3 and path c4d4, and is affected by spring stiffness, shock absorber damping, upper control arm bushing stiffness and lower control arm bushing stiffness (Sharma, 2023). The vibration transfer path analysis and optimization can effectively attenuate the vibration transfer, which is of great significance to the vibration reduction performance of mechanical systems.
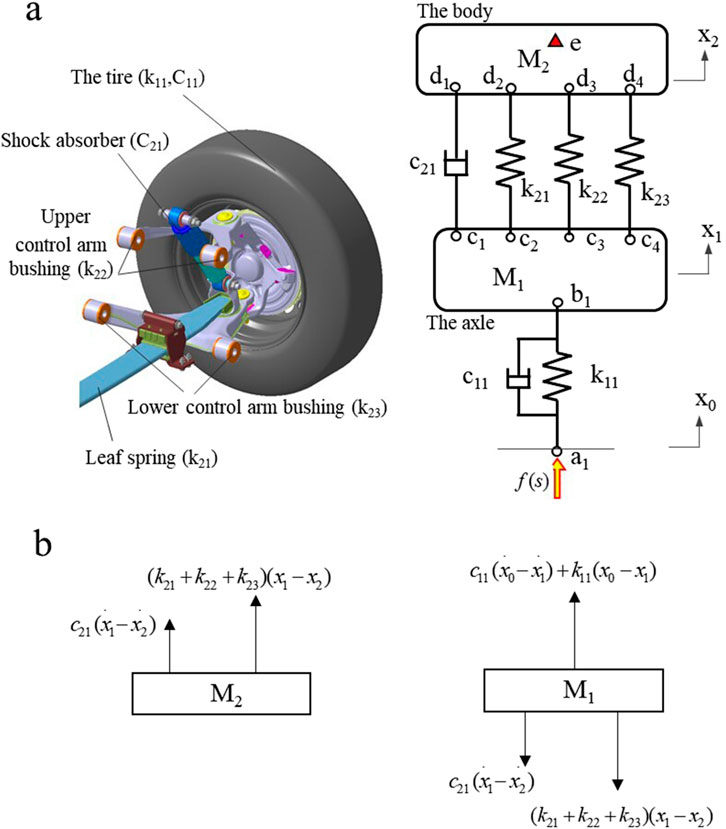
Figure 1. Vibration transfer model of suspension. (a) The transfer path, (b) The equivalent force model.
According to the equivalent force model of the suspension system (Figure 1b), taking (x0, x1, x2) as generalized coordinates, the vibration equation of the suspension system is established as,
Where C11 stands for tire damping, k11 is tire radial stiffness, C21 is suspension damping, k21 is spring stiffness, k22 is upper control arm bushing equivalent stiffness at the wheel center, k23 stands for lower control arm bushing equivalent stiffness at the wheel center, M1 stands for the axle mass, M2 stands for the body mass.
The object of analysis in this paper is a double-swinging arm suspension system. In the impact process, the suspension stiffness and damping show nonlinear characteristics (as shown in Figure 2), so the double-swinging arm suspension system is a typical nonlinear system. The vibration transfer function analysis of nonlinear systems is usually linearized, and then the influence of nonlinear factors is analyzed.
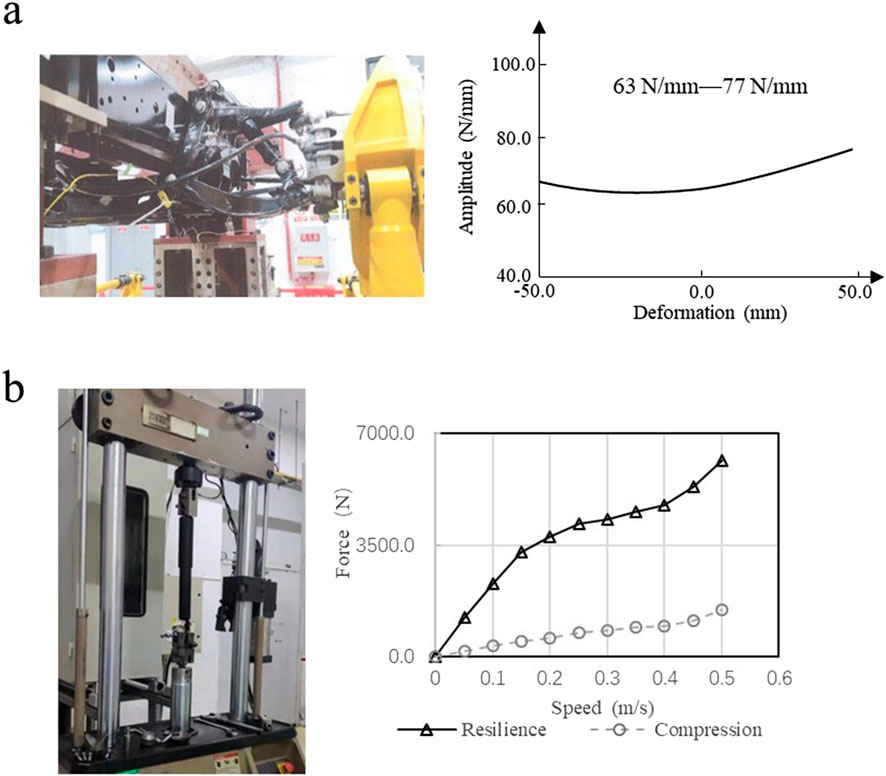
Figure 2. Stiffness and damping test of suspension. (a) The stiffness test, (b) The damping test.
The Laplace transform of Equation 1 is,
The transfer function of path a1b1, path cd and path a1b1cd is,
Equation 5 shows that the suspension system transfer function is affected by spring loaded mass, n1on-spring loaded mass, shock absorber damping, spring stiffness, control arm bushing stiffness, tire radial stiffness and damping.
The transfer function of path cd is affected by the four paths, and the relation is
There is coupling between the four paths in Equation 6, which makes it difficult to identify the main path. For the transfer function analysis of vehicle chassis system, classic TPA and working condition TPA are mostly used (Zhu et al., 2018; Sit et al., 2010). The classic TPA is used to obtain the transfer function by hammer method under static conditions, which is more suitable for linear systems. working condition TPA is mainly used in dynamic conditions and is more suitable for nonlinear systems, but there are path coupling problems. Under static and dynamic conditions, the elastic parameters of the suspension system are different. For example, under static conditions, the shock absorber does not work and c11 in Equation 2 is zero. In dynamic conditions, the equivalent stiffness of the suspension at the wheel center appears nonlinear due to the movement of the control arm, and the suspension transfer function also changes. Therefore, working condition TPA is more suitable for analyzing suspension transfer function. The parameters of the system are shown in Table 1.
Table 1. Parameters of the system.
In order to identify the main path in Equation 6, the sensitivity analysis method is used to analyze the influence of the parameters of the elastic element in each path on the transfer function Hcd (S).
2.2 Sensitivity analysis
By applying unit force to point a1 in Figure 1a according to Equations 3, 4, the transfer functions Ha1b1, Hcd and Ha1e can be obtained, as shown in Figure 3. The three curves have two peaks within the range of 0–100 Hz. The first peak frequency is 1.59 Hz, and the second peak frequency is 11.6 Hz, where 1.59 Hz is the natural frequency of suspension and 11.6 Hz is the natural frequency of tire. The second peak value of path Ha1b1 transfer function is larger than the first peak value, which is mainly affected by tire parameters. The first peak value of path Hcd transfer function is larger than the second peak value, which is mainly affected by suspension parameters. The trend of the Ha1e transfer function is consistent with that of the Hcd transfer function, and the coincidence of the two curves is 91.3%.
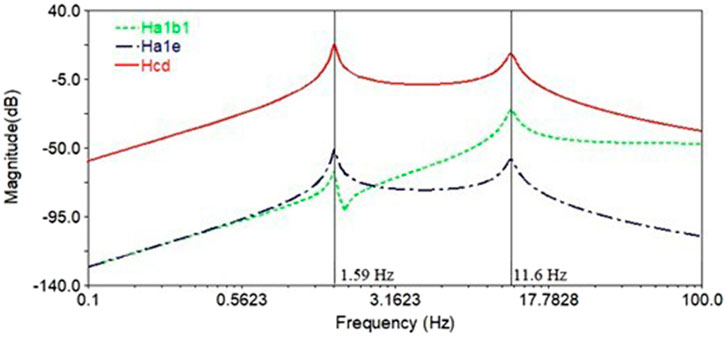
Figure 3. The transfer function results.
The transfer function Ha1e is the product of Ha1b1 and Hcd, and is affected by subsystem a1b1 and subsystem cd. Subsystem a1b1 has only one transfer path and only includes tire elastic components, and its transfer function is mainly affected by tire stiffness and damping. The subsystem cd has four transfer paths and contains multiple elastic elements. Therefore, the main transfer path of the whole system is mainly to analyze the main path of the main system cd.
In this paper, sensitivity analysis method (Strasser and Jiang, 2024) is used to analyze the influence of each elastic element in subsystem cd on its transfer function, so as to determine the main path. The characteristic equation of mechanical system can be expressed as,
Where ξ stands for the characteristic value,xi (i = 1,2,. , n) is the design variable.
The differential of Equation 7 is,
According to Equation 8, when the change of system design variable is δxk (i = 1,2,. n), then the change of the characteristic value is δξ and the change of the eigenequation is δ△.
Assuming that δxj ≠0, δxk = 0 (j≠k), and an eigenvalue of the system is ξt, Equation 8 can be expressed as
Let δ△ t = 0 in Equation 9, then the system sensitivity is
Parameters K21, C21, K22 and K23 in Figure 1 are taken as design variables, and according to Equation 10 the sensitivity analysis results to the transfer function are shown in Figure 4. At 1.59 Hz, the sensitivity of K21 is 18.43%, that of C21 is 11.96%, that of K22 is 1.85%, and that of K23 is 2.21%. Therefore, the impact of spring stiffness and shock absorber damping is obvious. At 11.6Hz, the sensitivity of K21 is 3.44%, the sensitivity of C21 is 1.75%, the sensitivity of K22 is 0.52%, and the sensitivity of K23 is 0.74%. Therefore, the above four design variables have little influence on the 11.6 Hz peak value.
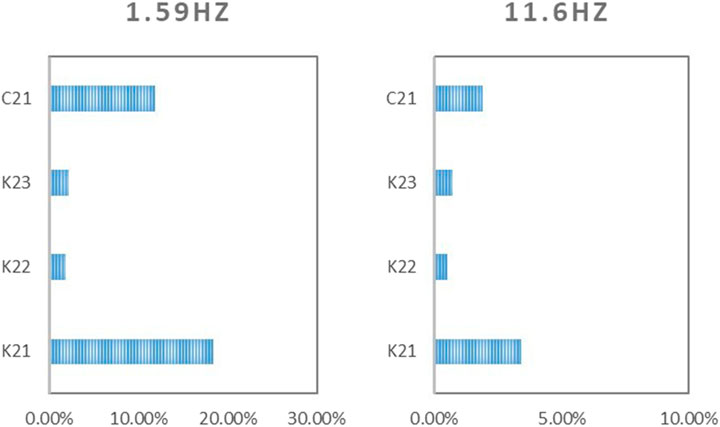
Figure 4. The sensitivity analysis result.
Because tire parameters are not easy to change, the effective control of vibration transfer path is mainly achieved by optimizing suspension parameters. The sensitivity analysis shows that spring stiffness and shock absorber damping have significant influence on the transfer function in suspension system. For double control arm suspension, the suspension stiffness changes with the control arm position, and the shock absorber damping changes with the excitation amplitude, that is, the suspension stiffness and shock absorber damping show nonlinear characteristics. Therefore, it is necessary to fully consider the nonlinear effects of stiffness and damping when analyzing the vibration transfer path of the suspension system.
The variation range of K21 is 63 N/mm – 77 N/mm, and the variation range of C21 is 0.15–0.55 when the vehicle travels at different speed on different roughness. Figure 5 shows the suspension transfer function of different K21. K21 affects the first peak, but has little effect on the second peak. Near the first peak, the peak frequency moves to higher frequency with the increase of K21, and the peak value changes logarithmically with K21. Therefore, the K21 nonlinear characteristic mainly affects the result of the transfer function near the natural frequency of the suspension system.
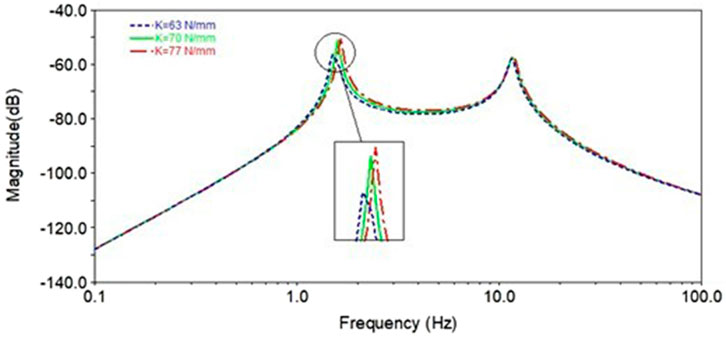
Figure 5. Influence analysis of parameter K21.
Figure 6 is the suspension transfer function of different C21. The damping of shock absorber affects the amplitude, but does not affect the peak frequency. The effects of C21 on both peaks are significant. Compared with the low frequency region, C21 has a greater influence on the high frequency region of the transfer function. The peak values of S1 and S2 shows a logarithmic trend with the increase of C21, and the effect of C21 on S1 is greater than that on S2. Compared with K21, C21 has more obvious influence on suspension transfer function, which is mainly because C21 nonlinear characteristic is obviously larger than K21 nonlinear characteristic.
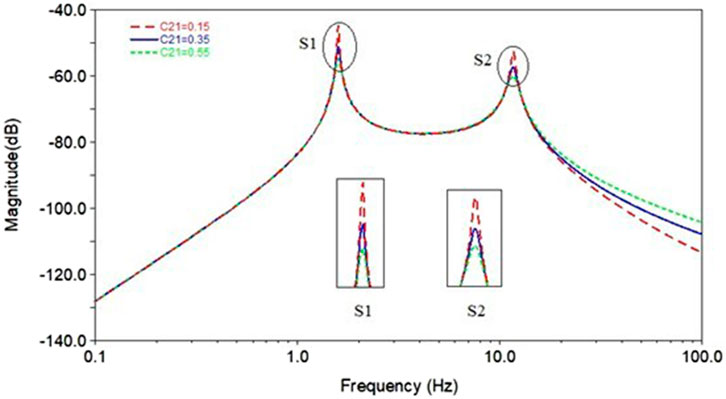
Figure 6. Influence analysis of parameter C21.
3 Vibration response analysis
3.1 Description of the experiment
The front wheels of the vehicle are fixed on the vibration test bench, as shown in Figure 7a. Class A pavement, Class B pavement and Class C pavement unevenness excitation are calculated, and the displacement excitation is applied to the test bench to drive the suspension work. The Z-direction load of the tire is collected by the six-direction force testing equipment, as shown in Figure 7b, and the fluctuation of tire load is calculated. The six-direction force sensor is mounted on the tire through a special wheel hub, its brand is ME with accuracy 0.2%, resolution 0.2% and response time 1.0 m. The accelerometers are mounted on the upper and lower ends of the shock absorber as shown in Figure 7c. The acceleration sensor is glued to the structure by strong adhesive, the brand is PCB, and the sensitivity is 2.385mv/m/s2. The acquisition device is LMS SCADAS with resolution 0.001 Hz and frequency range 0–100 Hz. The relative velocity of the shock absorber is calculated from the acceleration data. The vibration acceleration of the body is collected by LMS equipment, and the sensor is installed on the body floor, as shown in Figure 7d.

Figure 7. Vibration test. (a) Bench test. (b) Tire load test. (c) Shock absorber relative speed test. (d) The body vibration acceleration test.
In the small deformation condition, the main path of the suspension system is c2d2 and c1d1 respectively. Under large deformation conditions, C21 has a great influence on the system dynamics. In order to further analyze the vibration transfer characteristics of suspension system under different excitation amplitudes, it is necessary to consider the C21 nonlinear factor. Under the action of forced excitation f(s), Equation 1 can be expressed as
The spectral density of road displacement excitation f (s) in Equation 11 is (Chiu et al., 2024; Ma et al., 2022)
Where n is the spatial frequency, N0 is the reference frequency, Gd (n) is the roughness coefficient and w is the frequency index.
In the range of (n1, n2), the variance of road roughness is
According to the sine wave superposition principle, Equations 12, 13 the random excitation of the displacement of uneven pavement is
Where n is the spatial frequency, nmi is the central frequency of △ ni interval, ζ is the random number, and X is the vehicle displacement.
The displacement excitation of road roughness can be calculated by Equation 14 and applied to the test-bed to carry out the vibration test of suspension system.
3.2 Data analysis
The relative velocity data of the shock absorber is shown in Figure 8. The displacement excitation at 0.0–1.0 s is Class A road surface excitation, the relative velocity range of the shock absorber is −0.2 m/s - 0.2 m/s, and the damping coefficient of the shock absorber is 0.15; The displacement excitation at 1.0 s −2.0 s is Class B road surface excitation, the relative velocity range of the shock absorber is −0.4 m/s - 0.4 m/s, and the damping coefficient of the shock absorber is 0.35; The displacement excitation at 2.0 s −3.0 s is Class C road surface excitation, the relative velocity range of the shock absorber is −0.6 m/s - 0.6 m/s, and the damping coefficient of the shock absorber is 0.55. Tire load fluctuation is shown in Figure 9, the rougher the road surface, the greater the tire load fluctuation.
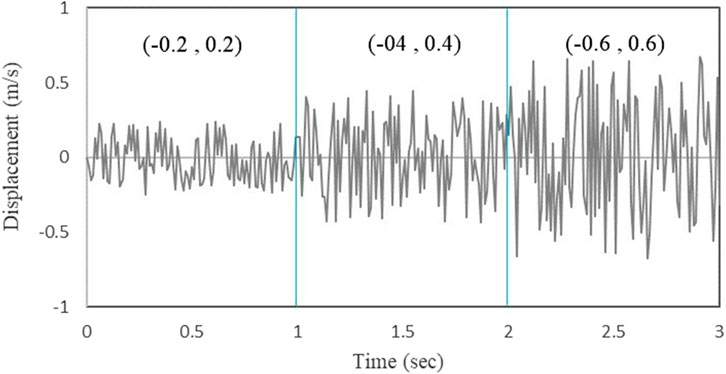
Figure 8. Relative speed of the shock absorber.
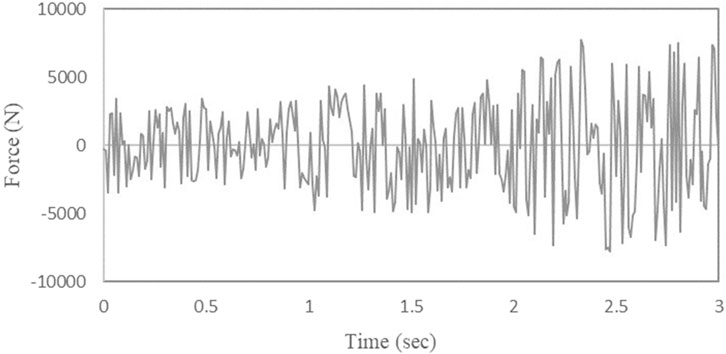
Figure 9. Tire load fluctuation data.
The body response can be calculated from the tire load FZ and Transfer Function, and the expression is
Because the damping coefficient of shock absorber varies with the amplitude of road excitation, the nonlinear characteristics of shock absorber should be considered in order to accurately fit the acceleration response of vehicle body. For Class A pavement, the damping coefficient of the shock absorber is 0.15, the corresponding transfer function is the C21 = 0.15 curve in Figure 5, and the working load is the load in the range of 0.0–1.0 s in Figure 8. According to Equation 15, the body M2 response results is shown in Figure 10, and the fitting result agree with the test result by 90.3%.
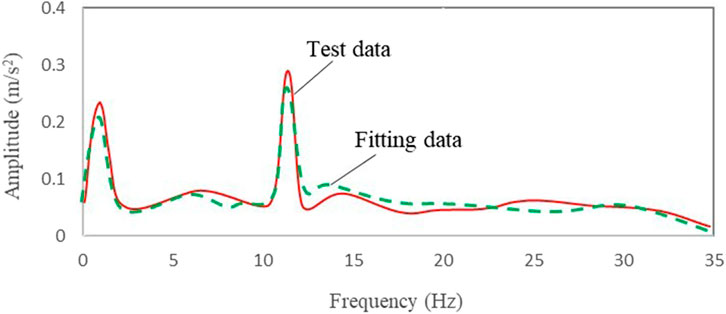
Figure 10. Results of M2 response analysis for Class A pavement.
For Class B pavement, the damping coefficient of the shock absorber is 0.35, the corresponding transfer function is the C21 = 0.35 curve in Figure 5, and the working load is the load in the range of 1.0 s–2.0 s in Figure 8. The M2 response results is shown in Figure 11, and the fitting result agree with the test result by 93.5%.
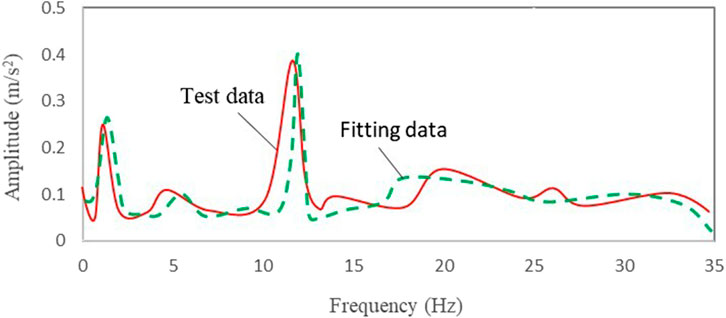
Figure 11. Results of M2 response analysis for Class B pavement.
For Class C pavement, the damping coefficient of the shock absorber is 0.55, the corresponding transfer function is the C21 = 0.55 curve in Figure 5, and the working load is the load in the range of 2.0 s–3.0 s in Figure 8. The M2 response results is shown in Figure 12, and the fitting result agree with the test result by 92.6%.
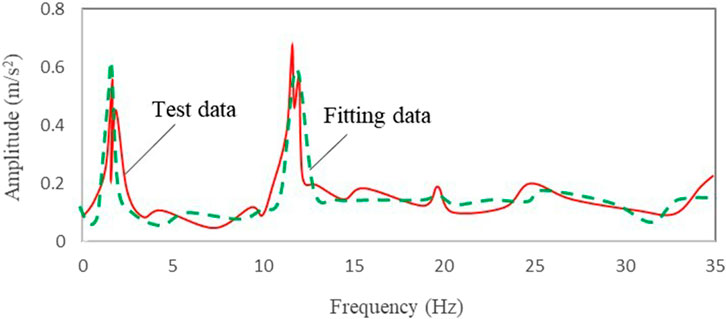
Figure 12. Results of M2 response analysis for Class C pavement.
The agreement between the fitting results and the test results of Class A pavement, Class B pavement and Class C pavement is more than 90%, which indicates the correctness of the analysis method in this paper. In other words, the nonlinear effect of damper damping should be considered in the analysis of double wishbone suspension dynamic response.
4 Conclusion
The mathematical model of the vibration transfer characteristics of the double-beam suspension system is established, and the influencing factors of the vibration transfer function are revealed theoretically. The sensitivity analysis shows that suspension spring stiffness and shock absorber damping are the key parameters.
The influence of nonlinear damping parameters on the vibration transfer function is analyzed. The damping coefficient affects the amplitude but not the frequency, and the peak value changes logarithmically with the increase of the damping coefficient. Compared with the spring stiffness, the damping of the shock absorber has more obvious influence on the transfer function.
Considering the nonlinear characteristics of damping, a vibration response fitting method for vehicle body is proposed. For Class A, Class B and Class C pavement, the fitting results are more than 90% consistent with the test results. The results show that considering the damping nonlinear factors, the accuracy of vehicle body acceleration analysis can be significantly improved.
Data availability statement
The original contributions presented in the study are included in the article/supplementary material, further inquiries can be directed to the corresponding authors.
Author contributions
TZ: Data curation, Writing – review and editing. BZ: Methodology, Writing – review and editing. XS: Conceptualization, Validation, Writing – review and editing. LZ: Writing – review and editing.
Funding
The authors declare that no financial support was received for the research and/or publication of this article.
Acknowledgements
The authors would like to acknowledge the support of Naveco Automobile Co., Ltd for providing the materials and apparatus.
Conflict of interest
Authors TZ, BZ, and LZ were employed by Naveco Automobile Co., Ltd.
The remaining authors declare that the research was conducted in the absence of any commercial or financial relationships that could be construed as a potential conflict of interest.
The handling editor LZ declared a past co-authorship [-Identification and sensitivity analysis of vehicle body compound vibration, 10.21203/RS.3.RS-2990825/V1 (2023)-Numerical model and coupled vibration analysis of transmission shaft with spatial angle misalignment, 10.1007/S11071-024-10357-9 (2024)-Identification and sensitivity analysis of vehicle body compound vibration, 10.1007/S40430-024-04765-6 (2024)] with the author XS.
Generative AI statement
The authors declare that no Generative AI was used in the creation of this manuscript.
Any alternative text (alt text) provided alongside figures in this article has been generated by Frontiers with the support of artificial intelligence and reasonable efforts have been made to ensure accuracy, including review by the authors wherever possible. If you identify any issues, please contact us.
Publisher’s note
All claims expressed in this article are solely those of the authors and do not necessarily represent those of their affiliated organizations, or those of the publisher, the editors and the reviewers. Any product that may be evaluated in this article, or claim that may be made by its manufacturer, is not guaranteed or endorsed by the publisher.
References
Chiu, M.-C., Karkoub, M., and Her, M. G. (2024). Two-dimensional car suspension energy harvesting system with road harmonic base excitation. Energy 304, 132108. doi:10.1016/j.energy.2024.132108
Clarance Mary, L., Rani, R. U., Meena, A., and Rajendran, L. (2021). Nonlinear mass transfer at the electrodes with reversible homogeneous; reactions:taylor'sseries and hyperbolic function method. Int. J. Electrochem. Sci. 16, 151037. doi:10.20964/2021.01.73
Lu, H., Rui, X., and Zhang, X. (2023). Transfer matrix method for linear vibration analysis of flexible multibody systems. J. Sound. Vib. 549, 117565. doi:10.1016/j.jsv.2023.117565
Ma, X., Quan, W., Dong, Z., Dong, Y., and Si, C. (2022). Dynamic response analysis of vehicle and asphalt pavement coupled system with the excitation of road surface unevenness. Appl. Math. Model. 104, 421–438. doi:10.1016/j.apm.2021.12.005
Oktav, A., Çetin, Y., and Günay, A. (2017a). Transfer path analysis: current practice, trade-offs and consideration of damping. Mech. Syst. Signal Process. 85, 760–772. doi:10.1016/j.ymssp.2016.9.013
Oktav, A., Çetin, Y., and Günay, A. (2017b). Transfer path analysis: current practice, trade-offs and consideration of damping. Mech. Syst. Signal Process. 85, 760–772. doi:10.1016/j.ymssp.2016.09.013
Sakhaei, B., and Durali, M. (2014). Vibration transfer path analysis and path ranking for NVH optimization of a vehicle interior. Shock Vib. 2014, 1–5. doi:10.1155/2014/697450
Sharma, R. (2023). Design and optimisation of double wishbone suspension for high performance vehicles. Int. J. Veh. Syst. Model. Test. 17, 185–195. doi:10.1504/ijvsmt.2023.132934
Sitter, G. D., Devriendt, C., Guillaume, P., and Pruyt, E. (2010). Operational transfer path analysis. Mech. Syst. Signal Process. 24, 416–431. doi:10.1016/j.ymssp.2009.07.011
Strasser, W., and Jiang, L. (2024). Sensitivity analysis of a multi-scale biofuel primary atomization simulation tool. Int. Commun. Heat Mass Transf. 159, 108097. doi:10.1016/j.icheatmasstransfer.2024.108097
Sun, X., Chu, Y., Fan, J., and Yang, Q. (2012). Research of simulation on the effect of suspension damping on vehicle ride. Energy Procedia 17, 145–151. doi:10.1016/j.egypro.2012.02.075
Suranjan, S., Pon Selvan, C., Nair, P. S., Hasan, T., and Krishnaprasad, (2021). Numerical modeling and optimization of turns in double wish bone suspension of an automotive. Mater. Today Proc. 45, 7213–7215. doi:10.1016/j.matpr.2021.02.419
Wang, H. N., and Zhang, B. (2024). Identification, reproduction, and control of vehicle roll vibration. Proc. Institution Mech. Eng. Part D J. Automob. Eng. 238, 1711–1726. doi:10.1177/09544070231161904
Yang, C.-C. (2013). Improving the overshooting of a sharpened image by employing nonlinear transfer functions in the mask-filtering approach. Optik - Int. J. Light Electron Opt. 124, 2784–2786. doi:10.1016/j.ijleo.2012.08.042
Zhai, C., Sun, W., and Palazoglu, A. (2017). Analysis of periodically forced bioreactors using nonlinear transfer functions. J. Process Control 58, 90–105. doi:10.1016/j.jprocont.2017.08.016
Zhang, Y., and Huang, X. (2010). Sensitivity with respect to the path parameters and nonlinear stiffness of Vi-bration transfer path systems. Math. Problems Eng. 2010, 650247. doi:10.1155/2010/650247
Zhang, B., and Li, Z. (2021). Mathematical modeling and nonlinear analysis of stiffness of double wishbone independent suspension. J. Mech. Sci. Technol. 35, 5351–5357. doi:10.1007/s12206-021-1107-x
Keywords: nonlinear, transfer function, vibration response, fitting method, identify acceleration
Citation: Zhang T, Zhang B, Su X and Zou L (2025) Hybrid fitting method for dynamic responses of mechanical systems. Front. Mech. Eng. 11:1729417. doi: 10.3389/fmech.2025.1729417
Received: 21 October 2025; Accepted: 03 November 2025;
Published: 14 November 2025.
Edited by:
Liguo Zang, Nanjing Institute of Technology (NJIT), ChinaCopyright © 2025 Zhang, Zhang, Su and Zou. This is an open-access article distributed under the terms of the Creative Commons Attribution License (CC BY). The use, distribution or reproduction in other forums is permitted, provided the original author(s) and the copyright owner(s) are credited and that the original publication in this journal is cited, in accordance with accepted academic practice. No use, distribution or reproduction is permitted which does not comply with these terms.
*Correspondence: Bao Zhang, emhhbmdiYW8xMzUwQDEyNi5jb20=; Xiaoping Su, c3V4aWFvcGluZ0BuanRlY2guZWR1LmNu