
- Department of Bioscience, Center for Geomicrobiology, Aarhus University, Aarhus, Denmark
Under anoxic conditions in sediments, acetogens are often thought to be outcompeted by microorganisms performing energetically more favorable metabolic pathways, such as sulfate reduction or methanogenesis. Recent evidence from deep subseafloor sediments suggesting acetogenesis in the presence of sulfate reduction and methanogenesis has called this notion into question, however. Here I argue that acetogens can successfully coexist with sulfate reducers and methanogens for multiple reasons. These include (1) substantial energy yields from most acetogenesis reactions across the wide range of conditions encountered in the subseafloor, (2) wide substrate spectra that enable niche differentiation by use of different substrates and/or pooling of energy from a broad range of energy substrates, (3) reduced energetic cost of biosynthesis among acetogens due to use of the reductive acetyl CoA pathway for both energy production and biosynthesis coupled with the ability to use many organic precursors to produce the key intermediate acetyl CoA. This leads to the general conclusion that, beside Gibbs free energy yields, variables such as metabolic strategy and energetic cost of biosynthesis need to be taken into account to understand microbial survival in the energy-depleted deep biosphere.
Introduction
Past studies on anoxic sediments have demonstrated a redox zonation among terminal organic matter remineralizing microbes in relation to electron acceptor availability (e.g., Froelich et al., 1979; Canfield et al., 1993). Organisms using the electron acceptor with the highest Gibbs free energy yields dominate over groups using energetically less favorable electron acceptors (e.g., Cappenberg, 1974; Lovley and Goodwin, 1988; Hoehler et al., 1998). Higher energy yields support faster growth rates and result in competitive exclusion of groups using less favorable electron acceptors (Cord-Ruwisch et al., 1988). Energy substrates with high turnover rates, e.g., hydrogen (H2) and acetate, can even be drawn down to thermodynamic threshold concentrations, at which only the most energetically favorable electron acceptor present provides sufficient energy for proton translocation across the cell membrane, ATP formation, and growth (Hoehler et al., 2001; Hoehler, 2004). Evidence supporting the notion of biological redox zonation comes from freshwater and coastal marine sediments, as well as laboratory-based chemostat and coculture experiments.
Consistent with the notion of redox zonation, the processes of denitrification, manganese and iron reduction, and sulfate reduction should exclude energetically less favorable reactions involving CO2 reduction or disproportionation, wherever the available nitrate, manganese (IV), iron (III), and sulfate pools are not rate-limiting (e.g., Froelich et al., 1979; Canfield et al., 1993). In freshwater and coastal marine sediments depletion of the most favorable oxidants often occurs shallowly owing to an excess of electron donors produced by fermentation and hydrolysis reactions (Capone and Kiene, 1988). This creates a niche for methane-producing Archaea (methanogens) and acetate-synthesizing microbes (acetogens), groups that are able to harvest energy from CO2 reduction in underlying layers (e.g., Phelps and Zeikus, 1984; Avery et al., 2002; Ferry and Lessner, 2008; Liu and Conrad, 2011). Contrastingly, in more oligotrophic offshore marine sediments, which cover most of the Earth’s surface, organic matter and hence electron donor availability are typically limiting. Depletion of nitrate, oxidized metals, sulfate, and/or even dioxygen (O2) does not occur until tens of meters below the seafloor – if at all (e.g., D’Hondt et al., 2004; D’Hondt et al., 2009). Accordingly methanogens and acetogens should be absent or at best lead fringe existences – dormant, or surviving in small numbers on non-competitive energy substrates not used by the other groups, such as methylated C1 compounds or methoxylated aromatic compounds (Franklin et al., 1988; Lever et al., 2010). Hence, recent evidence from deeply buried marine sediments indicating significant accumulation of biogenic methane in the presence of sulfate and metal reducing populations seems surprising (Wang et al., 2008). Moreover, even though sulfate reducers and methanogens gain more energy than acetogens from shared energy substrates, there is increasing evidence that acetogens play a quantitatively important role in organic carbon cycling in the marine and terrestrial deep biosphere (Heuer et al., 2006, 2009; Griebler and Lueders, 2008; Pedersen et al., 2008; Lever et al., 2010).
In the following sections I will examine possible reasons for the coexistence of acetogenesis with other pathways that are considered to be energetically more favorable in the deep subsurface. In my analyses, I will (1) conservatively calculate the energy yields of widespread acetogenesis reactions in the subsurface, (2) examine the potential for substrate generalism as a successful strategy under extreme energy limitation, and (3) examine the cost of biosynthesis and potential ways by which acetogens may reduce energy expended on biosynthesis.
Materials and Methods
Potential energy yields were calculated for a total of 14 acetogenic substrates and 20 acetogenesis reactions (Table 1). Criteria for the choice of these substrates were (1) widespread use by acetogens, (2) previously shown quantitative importance of these or related substrates as metabolic intermediates in anaerobic sediments, (3) representation of a wide range of substrate types used by acetogens, and (4) previously published thermodynamic properties (Table 2). The reactions included inorganic substrates (H2–CO2, CO), monocarboxylic acids (formate, lactate), dicarboxylic acids (glycolate, oxalate), alcohols (methanol, ethanol), ketones (pyruvate), carbohydrates (glucose, cellobiose), methyl halides (methyl chloride, CH3Cl; also known as chloromethane), and methoxylated aromatic compounds (syringate, vanillate).
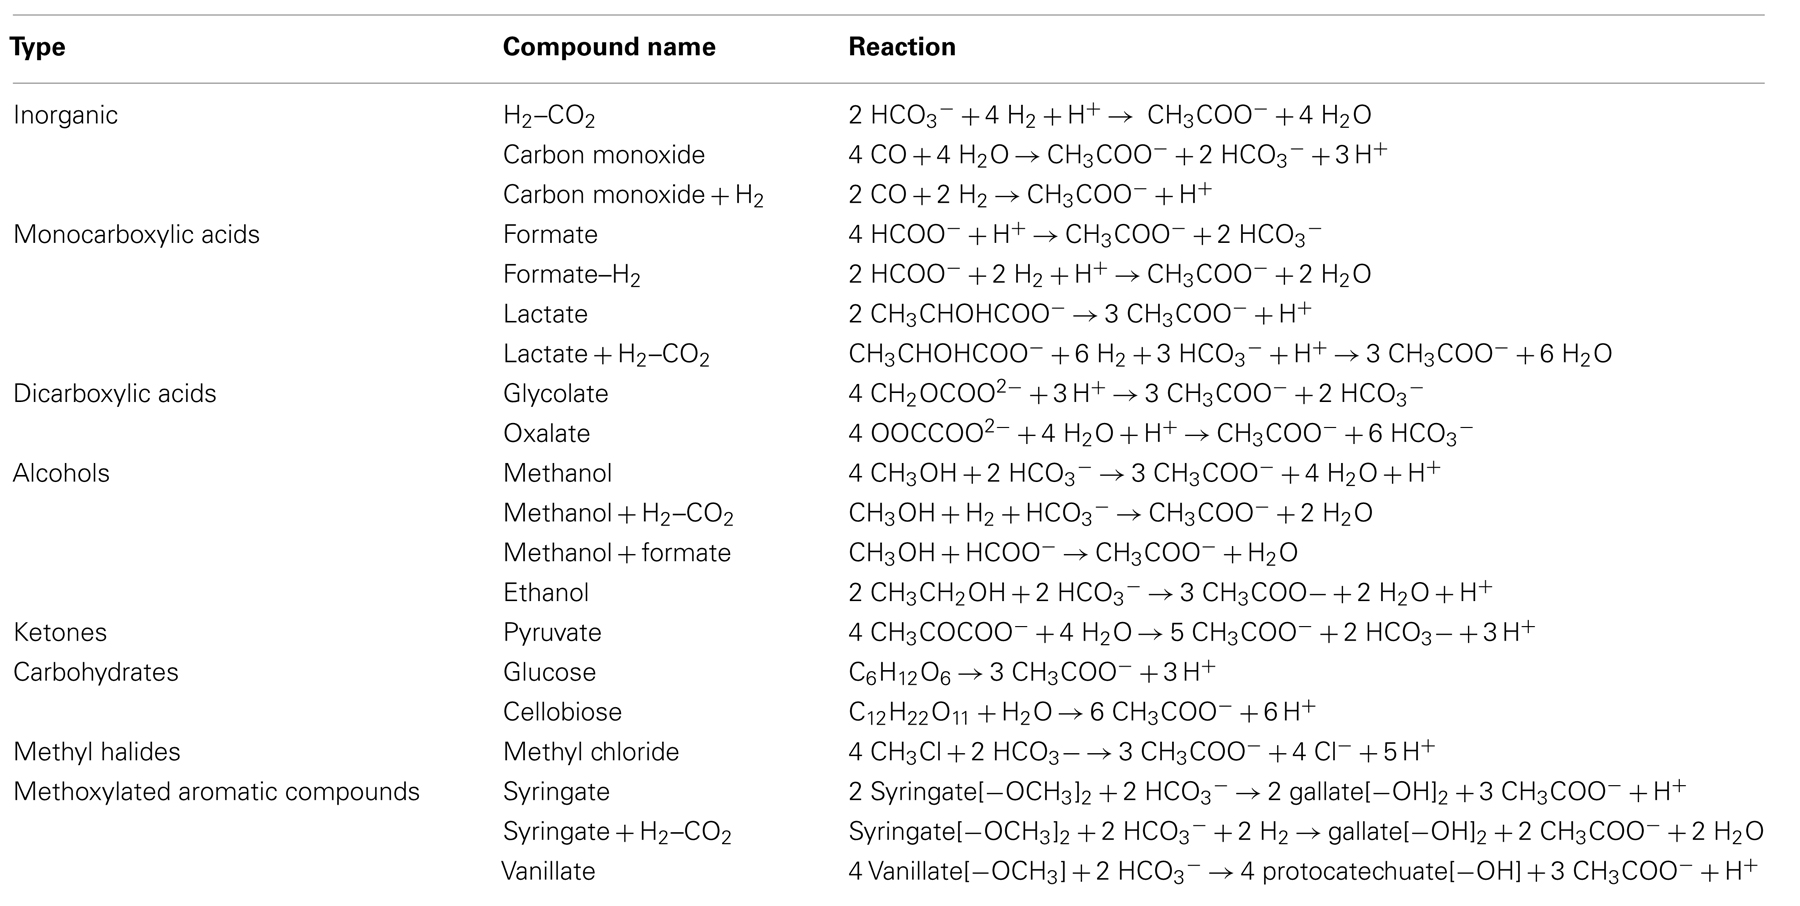
Table 1. Overview of acetogenesis reactions examined in this study (from Drake et al., 2006).
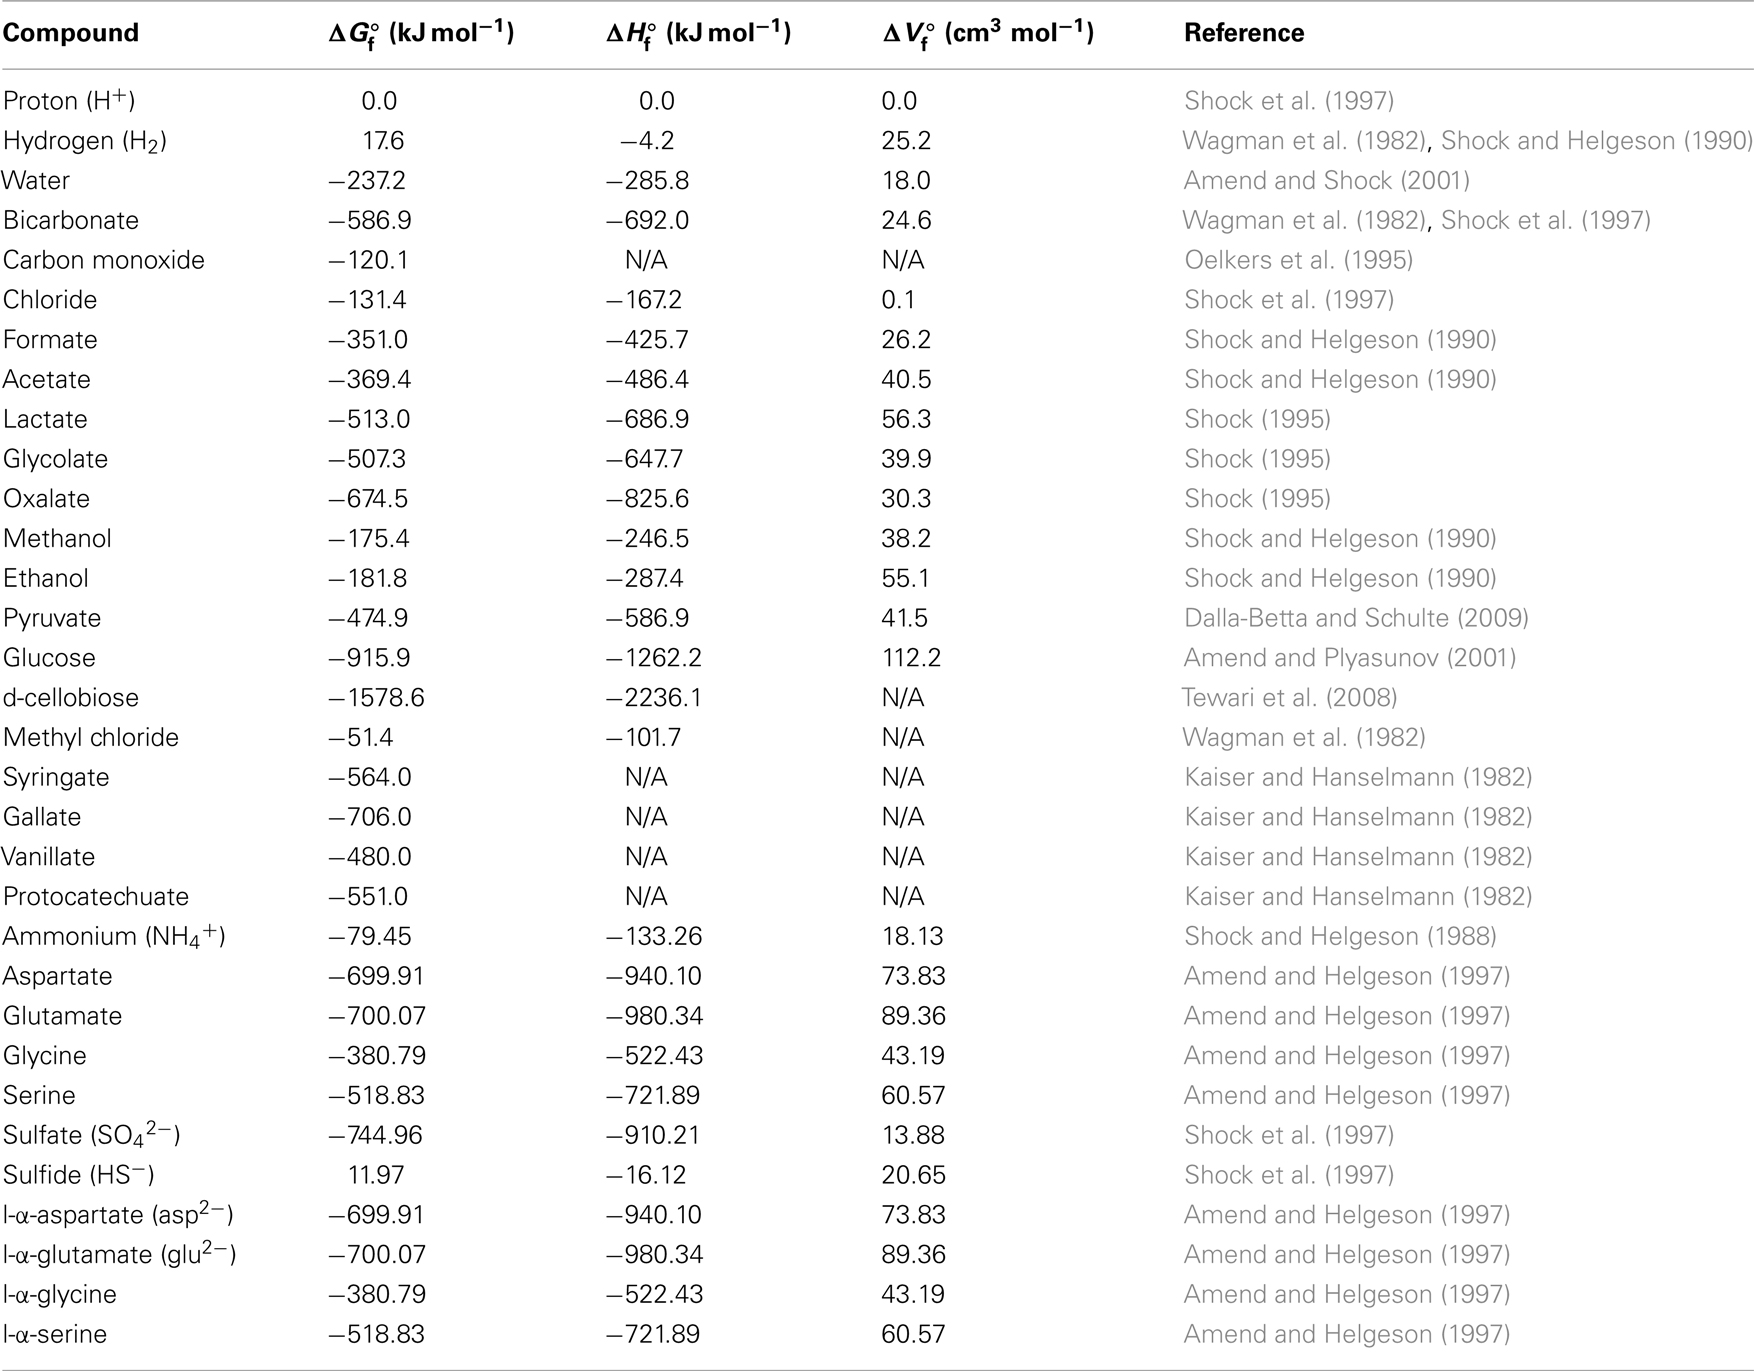
Table 2. Thermodynamic data of aqueous educts and products under standard conditions (N/A = no available published values).
Given the scarcity/absence of concentration data for most of these compounds from the deep subseafloor, I used conservative concentration estimates. This means that educt concentrations used in calculations were in the lower end of the spectrum previously determined for these or similar substrates in the sedimentary or marine setting, whereas product concentrations were near the upper end of the previously measured concentration spectrum (Meyer-Reil, 1978; Ansbaek and Blackburn, 1979; Sørensen et al., 1981; Kaiser and Hanselmann, 1982; King et al., 1982, 1983; Smith and Oremland, 1983; Smith et al., 1985; Edenborn and Litchfield, 1987; King, 1988, 2007; Lovley and Goodwin, 1988; Martens, 1990; Liu and Suflita, 1993; Hoehler et al., 1998; Chidhaisong et al., 1999; Ballschmiter, 2003; Dhillon et al., 2005; Finke et al., 2006; Chapelle and Bradley, 2007; Heuer et al., 2009; Lever et al., 2010). Accordingly, a concentration of 0.1 nM was used for dissolved gaseous energy substrates (CO, CH3Cl; H2 see next sentence), while 100 nM were assumed for all other energy substrates. To compensate for the high uncertainty regarding the accuracy of existing H2 concentration data from below the seafloor, due to the importance of hydrogen as a (co-)substrate in several acetogenesis reactions (Table 1), and due to previously published evidence suggesting acetogenesis via CO2 reduction with H2 in the deep subsurface (Heuer et al., 2009), two hydrogen concentrations were used, 0.1 nM and 1 μM. These concentrations include the range measured across a wide range of organic-rich to ultra-oligotrophic subsurface sites during ocean drilling program (ODP) Legs 201 and 204, IODP Expedition 329, and Meteor Expedition M76 to the Benguela Upwelling Regime (Shipboard Scientific Party, 2003; Lorenson et al., 2006; Expedition 329 Scientists, 2011; Lin et al., 2011). For acetogenesis reactions involving H2 as a co-substrate, 1 μM H2 should be non-limiting. For metabolic products, I assumed a 1-mM concentration of acetate, 100 nM gallate and protocatechuate, and typical seawater concentrations of protons (10−8 M) and chloride (0.56 M; Pilson, 1998). Bicarbonate concentrations of 2 mM (typical seawater concentration) were used when bicarbonate was an educt, and 200 mM when bicarbonate was a product. For sulfate reduction reactions, I used sulfate concentrations of 10 mM, and sulfide concentrations of 1 mM. For methanogenesis reactions, I assumed methane concentrations of 1 mM. The pH used in all calculations was 8.0.
For calculations of the in situ energy yields of acetogenesis reactions from H2–CO2, formate–H2, and formate, I used published data generated during ODP Leg 201 to the Equatorial Pacific and Peru Margin (Shipboard Scientific Party, 2003). Measured H2, dissolved inorganic carbon (DIC), formate, and acetate concentrations were used, in addition to pH. In situ temperature was calculated from the measured thermal gradient at each site. In situ pressure was calculated from the water and sediment depth, assuming an average water density of 1.029 g cm−3 and using average sediment bulk density values for site-specific sedimentary subunits (Shipboard Scientific Party, 2003). Measured amino acid concentrations (glutamate, aspartate, serine, glycine) in ODP Leg 201 sediment cores were obtained from Mitterer (2006).
Gibbs free energies per reaction were calculated for standard conditions (25°C, 1 atm), as well as temperature and pressure extremes inclusive of most subsurface sediments on Earth (Stumm and Morgan, 1981). −1.9°C, the freezing temperature of most seawater, represents the lower temperature boundary likely to be encountered in the deep biosphere, while 122°C marks the upper temperature boundary tolerated by known life (Takai et al., 2008). The pressure range of 1–1000 atm applies from shallow coastal sediments to the vast majority of subsurface sediments in the open ocean. Activities were approximated from concentrations by using the measured activity coefficient, γ, of bicarbonate (0.532) for anionic acetogenesis substrates/products (formate, acetate, lactate, oxalate, glycolate, syringate, vanillate), as well as the measured activity coefficient of methane (1.24) for gases (H2, CO) and alcohols (methanol, ethanol; both from Millero and Schreiber, 1982). The activity coefficients of water, carbohydrates (glucose, cellobiose), and amino acids (aspartate, glutamate, glycine, serine) were set to 1.0. Published activity coefficients were used for sulfate (0.104) and sulfide (0.410; Millero and Schreiber, 1982).
Gibbs energies per substrate were calculated from Gibbs energies per reaction by dividing the latter by the number of substrates per reaction. Thermodynamic threshold concentrations of each substrate were calculated by setting  to a an estimated biological energy quantum (BEQ) of −10 kJ mol−1 and solving the equation for the substrate concentration, all other educt, and product, concentrations remaining the same and as outlined above.
Results and Discussion
The Thermodynamic Argument
To assess the energetic feasibility of microbial metabolic reactions (Table 1) in deep subseafloor sediments, it is helpful to conservatively calculate their energy yields under conditions that resemble those found in situ. In this section, I examine the energetic potential of various acetogenesis reactions to occur in deep subseafloor sediments by examining (1) Gibbs free energy yields per reaction  (2) Gibbs free energy yields per substrate
  (3) thermodynamic threshold concentrations of substrates for acetogenesis reactions to be thermodynamically favorable, (4) in situ energy yields of the reactions for which educt and product concentrations have been quantified in subseafloor sediments, and (5) energy yields per hydrogen molecule (H2) of the various litho- and organotrophic acetogenesis reactions involving H2 compared to competing hydrogenotrophic sulfate reduction and methanogenesis reactions.
Which acetogenesis reactions are thermodynamically favorable?
Calculated Gibbs free energies indicate that most acetogenesis reactions are thermodynamically favorable in deep subseafloor sediments – with energy yields exceeding the BEQ  under a wide range of temperatures, pressures, and hydrogen concentrations (Table 3). The highest energy values with
  are in carbohydrates, pyruvate, methyl chloride, methoxylated aromatic compounds, and lactate. Other substrates, such as glycolate, oxalate, methanol, and ethanol also produce energy yields exceeding the BEQ. By contrast, the classic autotrophic (“homoacetogenic”) reaction from H2–CO2 and reactions from formate are endergonic at 0.1 nM H2 concentrations (Table 3), and only yield energy at 1 μM H2 concentrations and low to intermediate temperatures (Table 3). For energy-yielding substrates that can be used with or without H2, i.e., carbon monoxide, lactate, methanol, and syringate, reactions not involving H2 yield more energy at [H2] = 0.1 nM than reactions involving H2; in the case of carbon monoxide and lactate, this difference is crucial, since reactions without hydrogen produce high-energy yields, whereas reactions with H2 are endergonic (Table 3). At [H2] = 1 μM this changes, i.e., energy yields of some of the reactions with hydrogen are exergonic, yielding more energy than the BEQ (Table 3); in one case (lactate, −1.9°C) free energy yields even exceed those of acetogenesis from lactate alone at low to intermediate temperatures (also see Results and Discussion on Table 4 in next section).
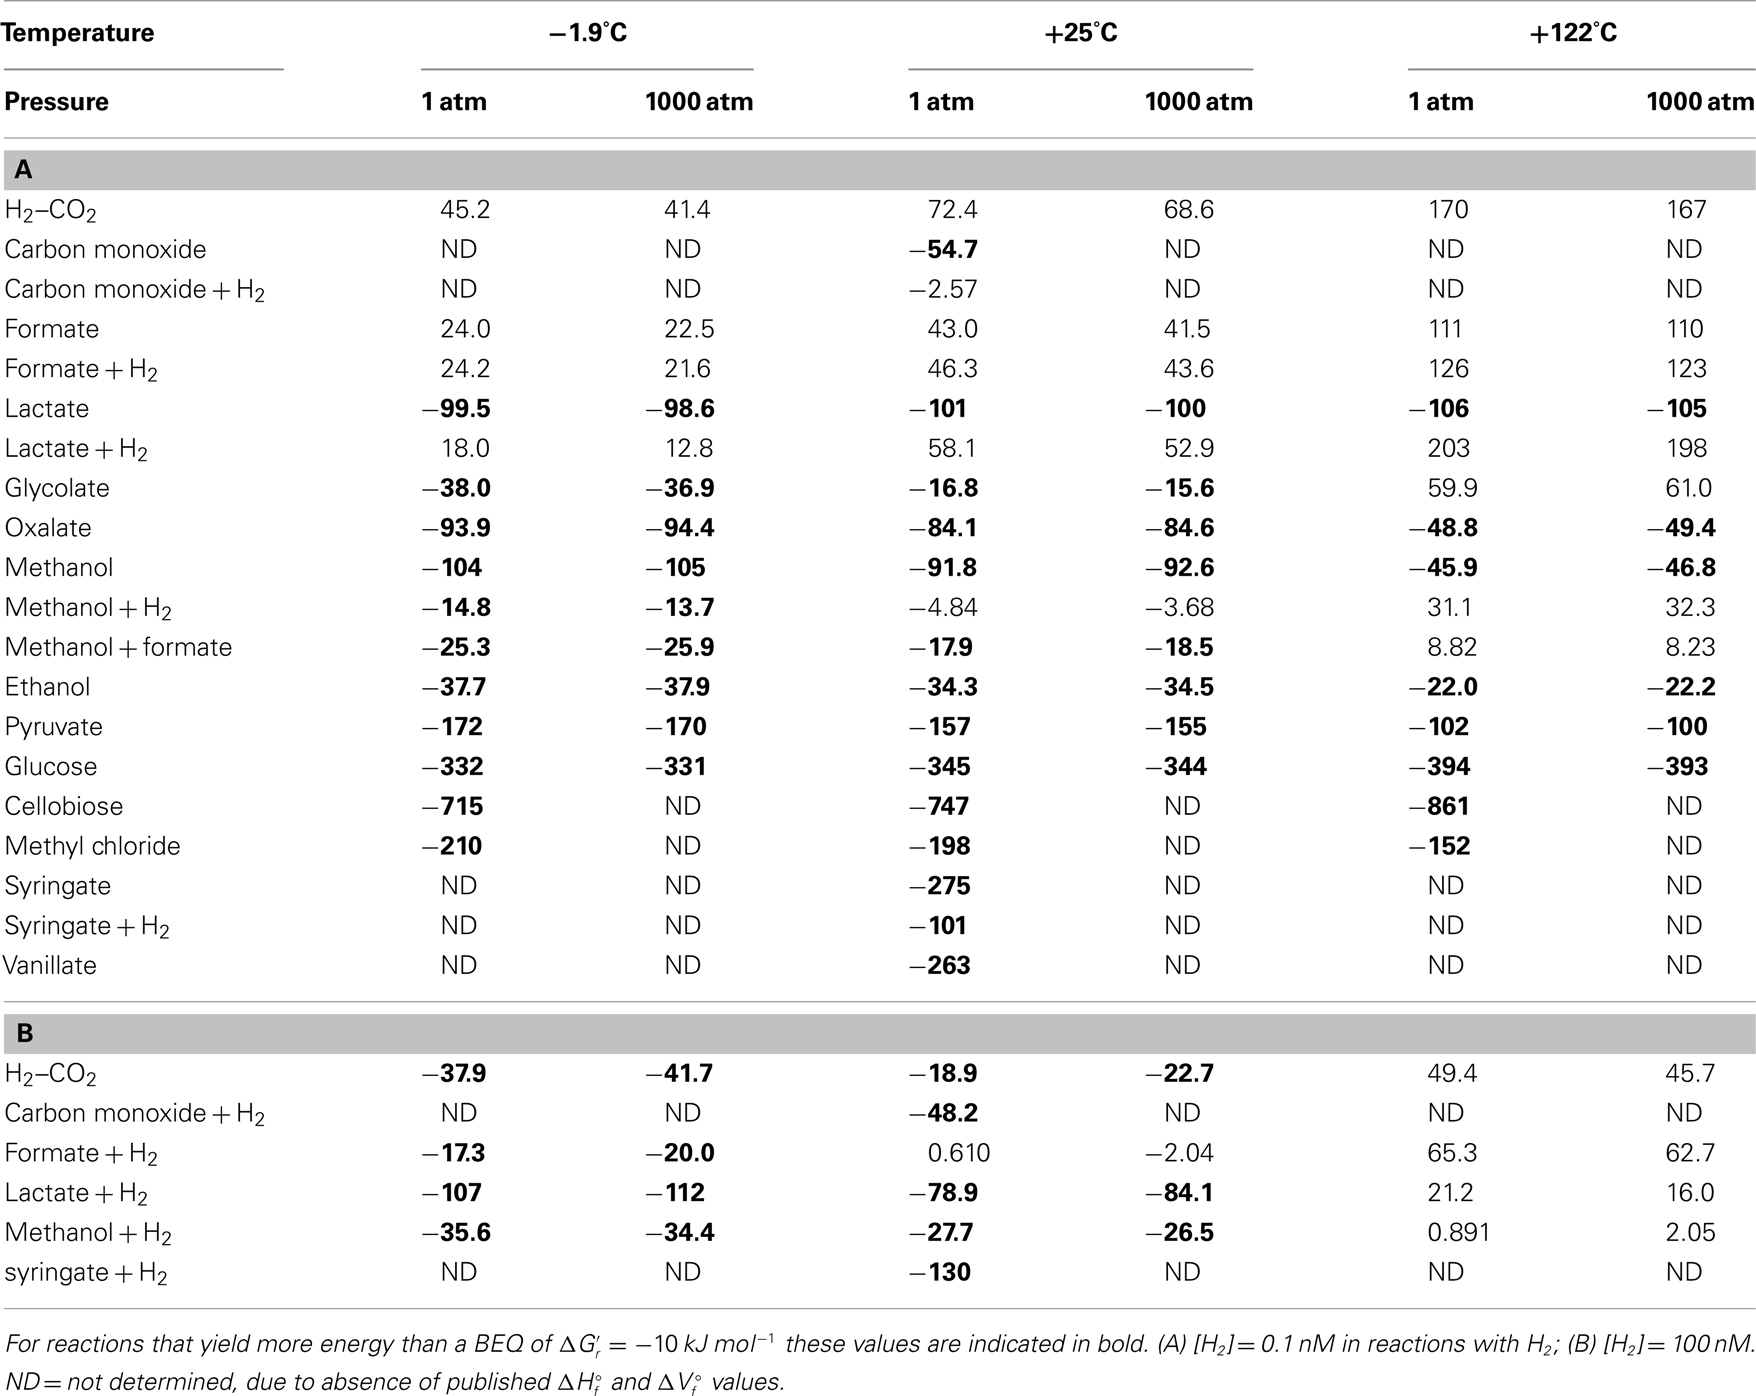
Table 3. Gibbs free energy yields of the various acetogenesis reactions at a wide range of temperatures, pressures, and H2 concentrations.
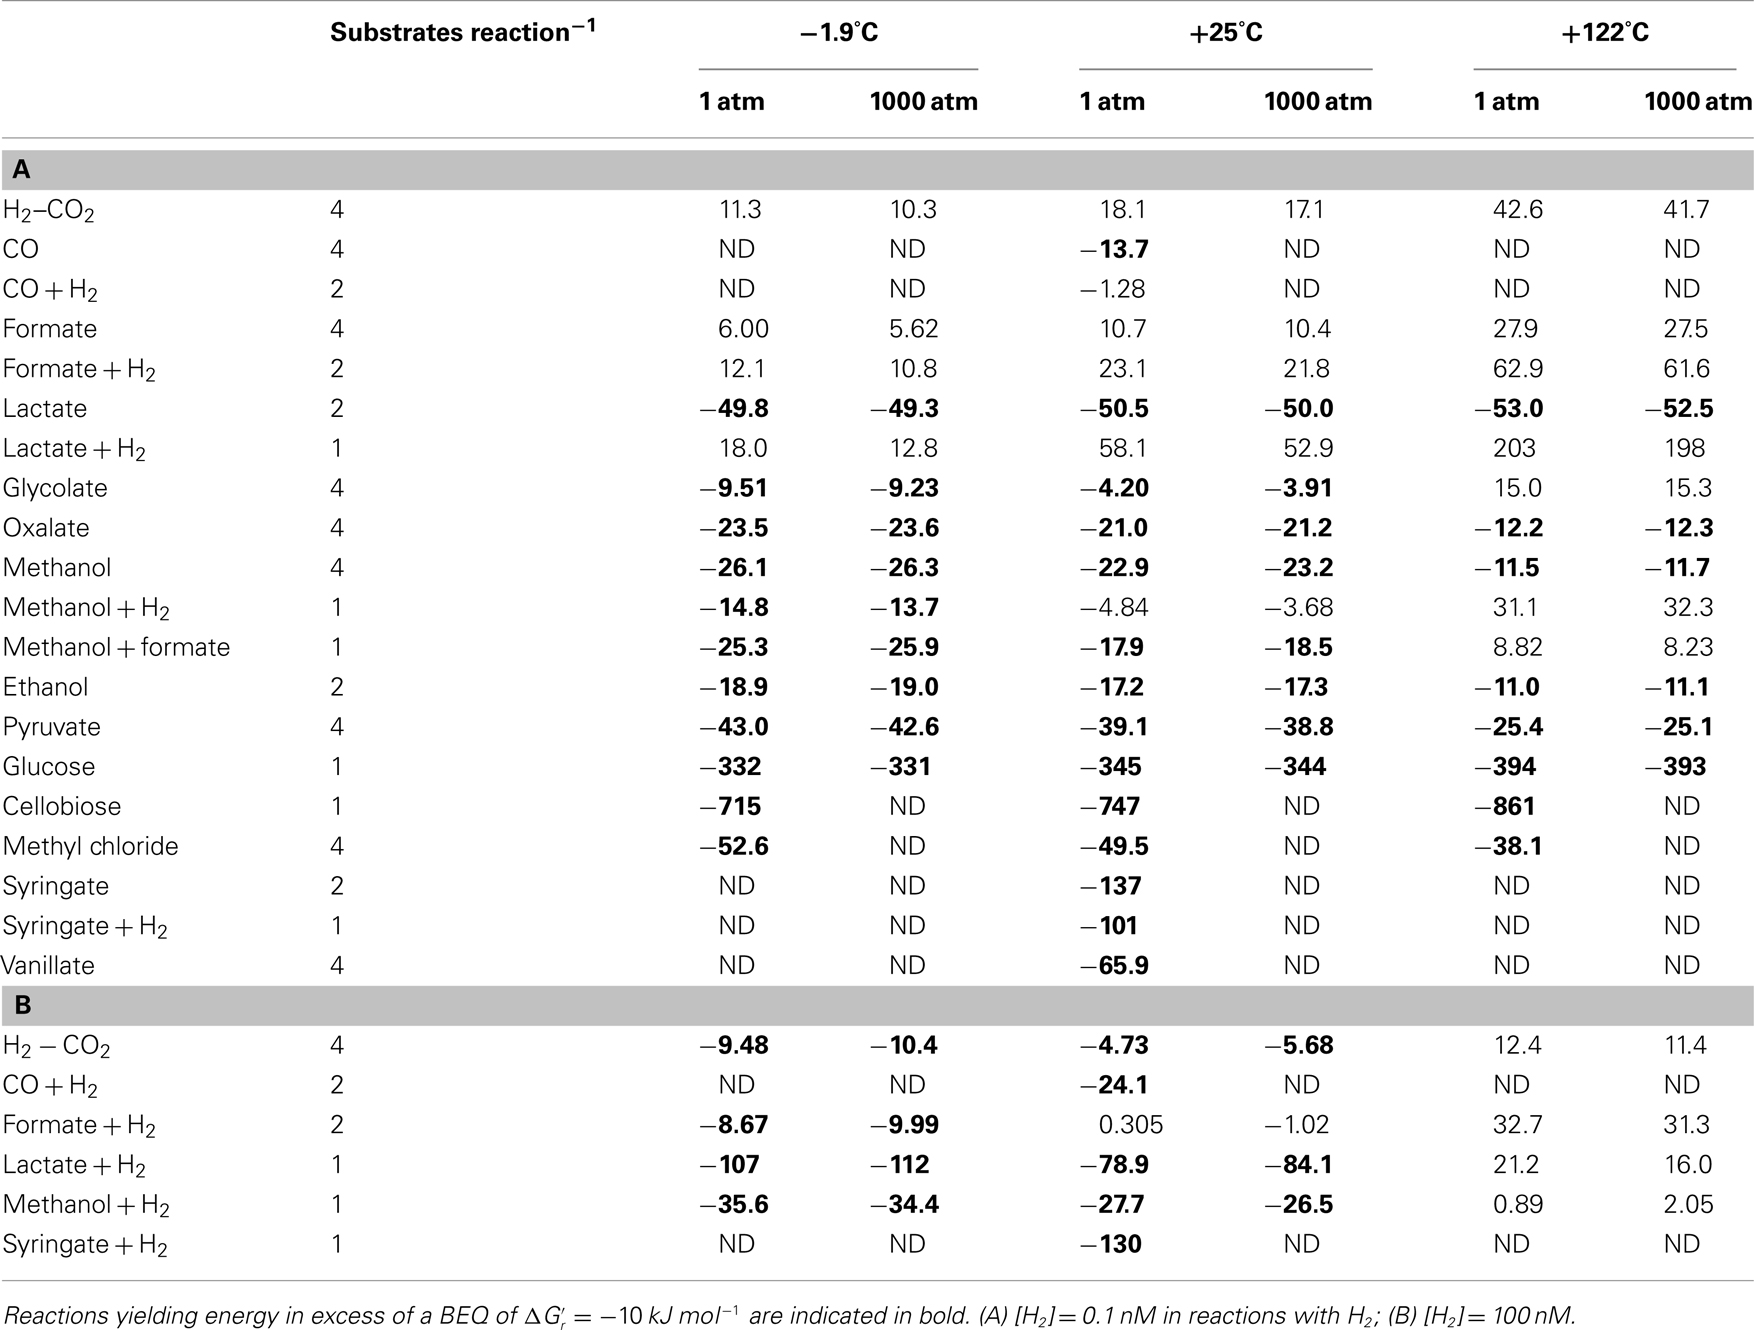
Table 4. Gibbs free energy yields per substrate for the various acetogenesis reactions at a wide range of temperatures (°C), pressures (atm), and H2 concentrations.
Within the calculated ranges, temperature has a much greater impact on free energy yields of acetogenesis reactions than pressure. For pressure changes from 1 to 1000 atm, the largest effect is in reactions that include H2, with lactate + H2 having the greatest change (5.2 kJ mol−1); for all reactions without H2, the difference in  between 1 and 1000 atm pressure is ≤2 kJ mol−1. By comparison, the difference in
  due to a temperature change from −1.9 to +122°C is always greater than the difference in
  caused by a pressure change from 1 to 1000 atm. For reactions from H2–CO2, formate–H2, lactate–H2, and cellobiose, the change in
  values going from −1.9 to +122°C even exceeds 100 kJ mol−1 of the reaction.
The magnitude of temperature effects seems to follow trends. First of all, of the six reactions involving H2 or formate for which temperature effects could be calculated, none are thermodynamically favorable at 122°C. This, and the vast overall decrease in free energy yields for acetogenesis reactions involving H2 or formate in response to temperature, suggests a strong selection against these reactions at temperatures approaching the known upper limit of life – unless H2 or formate concentrations at high temperatures are much higher than assumed here. Secondly, there appears to be a systematic difference in how temperature affects energy yields. For all C1–C3 substrates except reactions from lactate alone, free energy yields decrease with temperature; for reactions from lactate alone, there is a slight increase with temperature. By contrast, the free energy yields of acetogenesis reactions from the carbohydrates glucose (C6) and cellobiose (C12) show strong increases in response to temperature. Based on the small number of substrates included in these calculations and that the only two large substrates included are carbohydrates, it is premature to argue that larger carbon substrates should be consumed preferably at high temperatures. Yet, the fact that certain substrates or acetogenesis reactions increase, while others decrease in energy yield in response to temperature, suggests that temperature exerts an important control over which substrates are consumed and energy-yielding reactions performed by acetogens in the deep biosphere.
Which acetogenesis reactions are most likely under the conditions examined?
The Gibbs free energy yield of a metabolic reaction indicates whether this reaction can be used as a source of energy in a given environment. Under substrate-limiting conditions, as are likely in the deep biosphere, one might, however, expect microbial consumer choices – assuming they follow optimum foraging behavior – to be driven by energy yields per mole of substrate – as long as the overall reaction produces more energy than the BEQ. For substrates that can be metabolized via multiple reactions that each yield more energy than the BEQ, e.g., methanol at −1.9°C (Table 3), one might expect consumers to show a preference toward the reactions with the highest energy yield per substrate. Additionally, it is possible that organisms, despite being energy-starved, show a preference toward certain substrates over others based on energy content per substrate molecule. To examine possible consequences of an optimum foraging behavior that is driven by energy yields per substrate, the latter were calculated (Table 4).
Comparing different substrates on a per-substrate-level, Gibbs free energy yields remain high  for cellobiose, glucose (all T and P), lactate + H2 (only at [H2] = 1 μM, −1.9 and 25°C; all unchanged compared to Table 3), as well as syringate (Table 4). Provided their availability in the deep biosphere, and that acetogens make choices based on energy per substrate molecule, these substrates should be consumed preferentially over the others examined. Other good substrates may include – in order of descenting energy yields – vanillate, methyl chloride, lactate, pyruvate, methanol, and oxalate. The classic lithoautotrophic reaction from H2–CO2, and reactions from formate and glycolate, are the least energy-yielding on a per-substrate-level, and therefore the least likely to be consumed, should energy content on a substrate-level determine acetogenic substrate choice.
When comparing energy yields of acetogenesis substrates for which multiple reaction pathways are known, i.e., CO, formate, lactate, methanol, and syringate, the same overall trends seen on a per-reaction-level still hold for formate and syringate – independent of H2 concentrations (Tables 3 and 4). For carbon monoxide, lactate, and methanol, the same trends occur at [H2] = 1 nM, but not at [H2] = 1 μM. In spite of the overall reaction from carbon monoxide yielding more energy than the reaction from carbon monoxide + H2 at high [H2] (Table 4), acetogenesis from carbon monoxide + H2 yields more energy on a per-substrate-level (Table 4). For lactate, reactions from lactate + H2 at high H2 yield more energy per lactate than reactions from lactate alone – not only, as previously, at −1.9°C (Table 3), but also at +25°C (Table 4). And for methanol – unlike before (Table 3) – reactions with H2 yield more energy per methanol at high H2 and low temperature (−1.9 to 25°C) than reactions with methanol alone (Table 4). These results confirm the importance of calculating energy yields on a per-substrate-level. Moreover, they underscore the likely importance of temperature in regulating which acetogenesis reactions are occurring in situ – even when these reactions involve the same carbon substrate.
The extent to which microbes can detect and respond to (minor) differences in energy yields of different reactions involving the same substrates, thereby optimizing their foraging behavior with respect to energy yields per substrate, is poorly understood. The potential advantages for survival in energy-starved environments are apparent. Yet, it is not known whether microbes express any form of substrate selectivity in the energy-starved deep biosphere, or rather indiscriminately consume any metabolizable substrate that enters their reach. The strategy employed by an individual cell may not solely depend on the energy yield per substrate. Other factors, such as substrate turnover rate, energetic cost of substrate/metabolite transport across the cell membrane, and energy return on investment for each enzyme that needs to be synthesized to catabolize an additional energy substrate will most likely also affect which substrates are consumed.
Which acetogenesis reactions are likely to occur in situ?
The calculated free energy yields presented so far are based on limited published information on concentrations of acetogenic substrates. Only H2, formate, and acetate concentration data have been published for the deep subseafloor biosphere (Shipboard Scientific Party, 2003; Lorenson et al., 2006; Heuer et al., 2009; Lever et al., 2010; Expedition 329 Scientists, 2011); concentrations of the other substrates had to be approximated using data from surficial marine sediments (Meyer-Reil, 1978; Sørensen et al., 1981; King et al., 1983; Smith and Oremland, 1983; Parkes et al., 1989; Martens, 1990; Hoehler et al., 2001; Dhillon et al., 2005; Finke et al., 2006; King, 2007), freshwater sediments (King et al., 1982; Lovley and Goodwin, 1988; Chidhaisong et al., 1999; Keppler et al., 2000), marine water columns (Edenborn and Litchfield, 1987; Ballschmiter, 2003), and the terrestrial deep biosphere (Chapelle and Bradley, 2007). Since concentrations of H2, formate, and acetate in the deep biosphere overlap with the concentrations of these species in other sedimentary environments, it seems realistic to conservatively approximate subseafloor concentrations of other substrates, such as glucose or oxalate, with the lowest values measured in other sedimentary environments. This cannot hide the fact that actual concentrations have not been measured, however. An alternative to calculating energy yields at assumed substrate concentrations is therefore to calculate the threshold concentrations required for acetogens to meet the BEQ from a substrate. This can be done conservatively, since the concentrations of most other reaction educts and products, i.e., H+, H2O, HCO3−, acetate, H2, Cl−, are well-constrained for the deep biosphere and/or set to conservative values (see Materials and Methods). Thermodynamic threshold concentrations were, as previously, calculated for [H2] = 0.1 nM and 1 μM (Table 5).
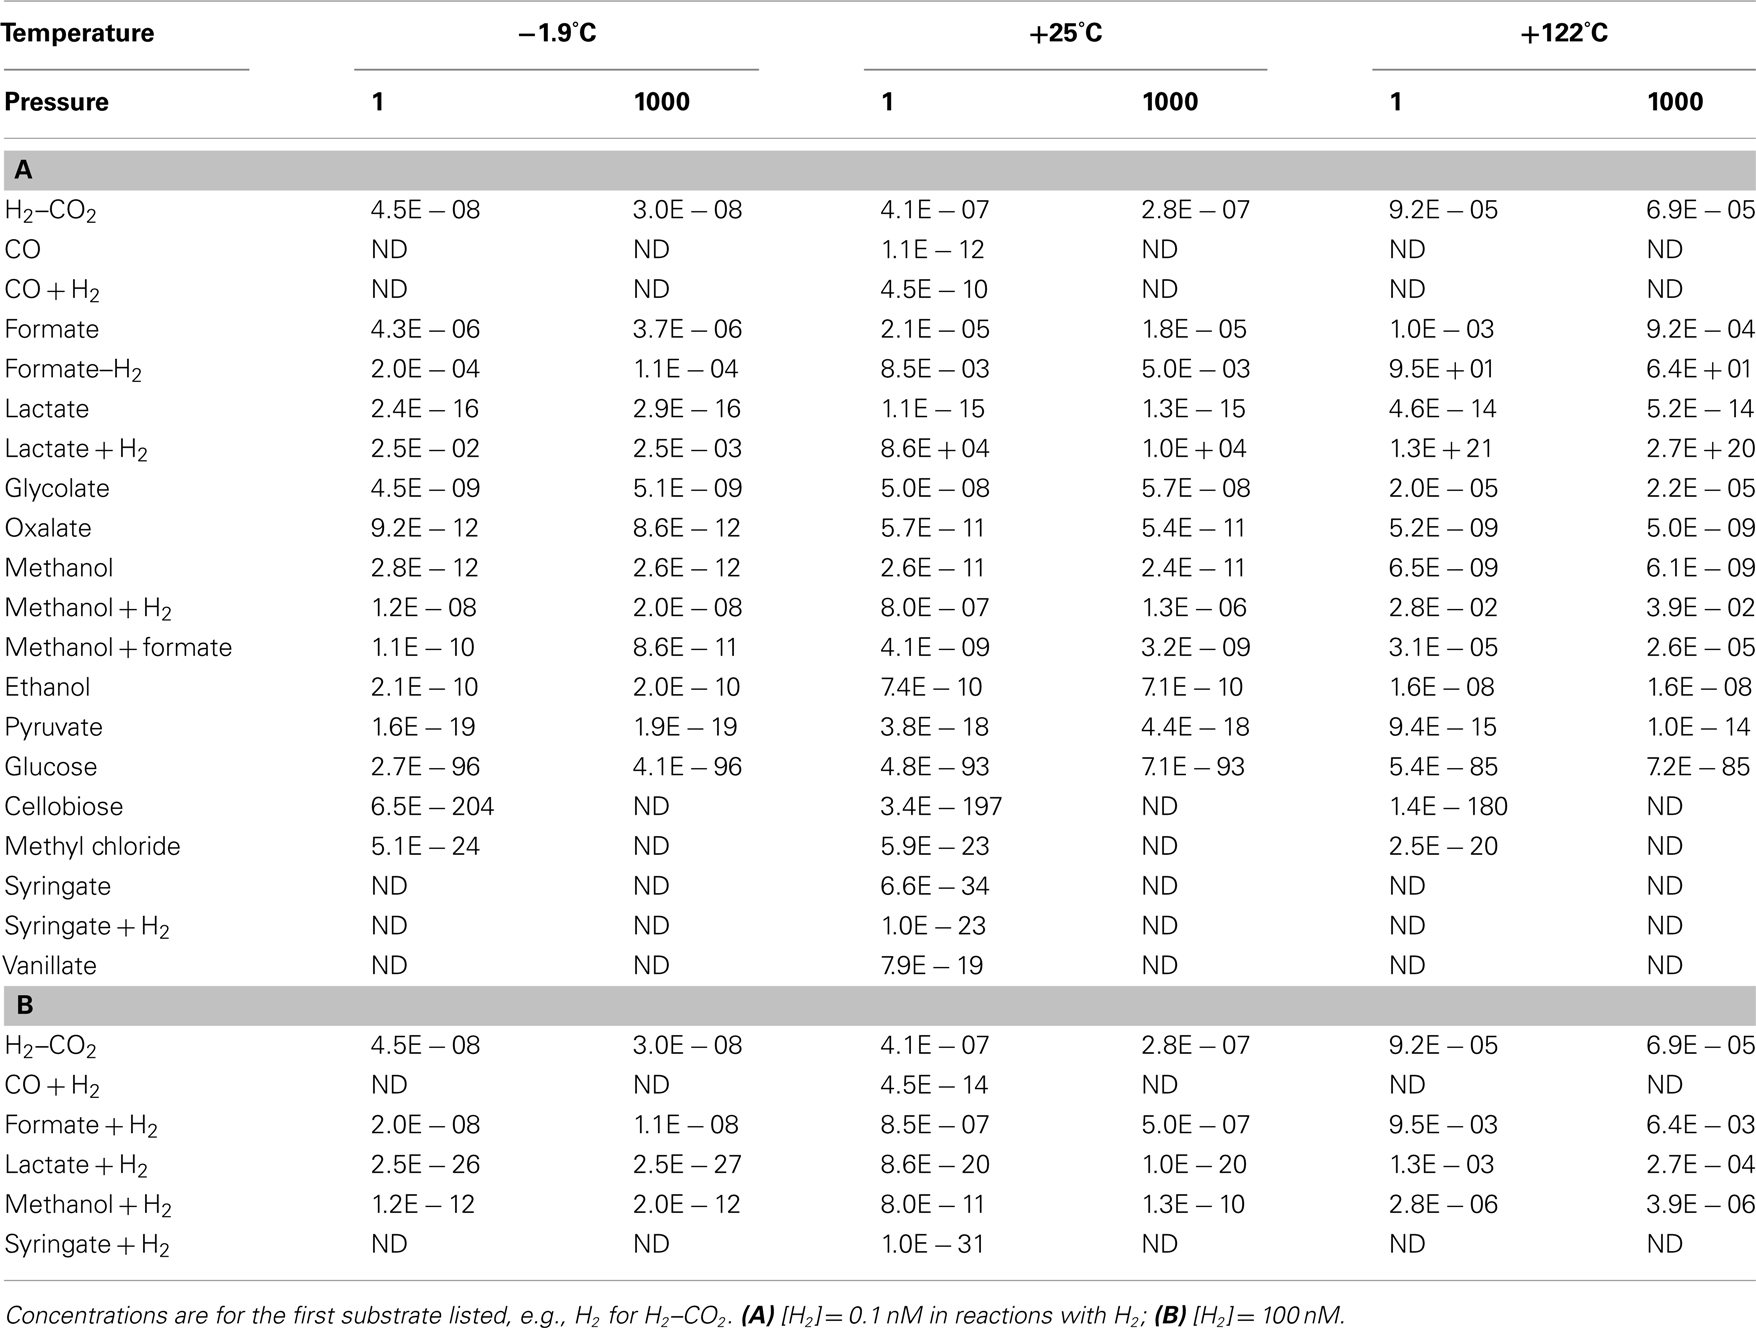
Table 5. Thermodynamic threshold concentrations of widespread acetogenesis reactions at a wide range of temperatures and pressures, assuming a biological energy quantum of

At first glance it is clear that the concept of threshold concentrations is only relevant for a subset of acetogenic substrates. For glucose, cellobiose, syringate, as well as syringate + H2 at 1 μM [H2], threshold concentrations are lower than a single molecule of the substrate per liter. In fact, thermodynamic threshold concentrations for glucose and cellobiose are even orders of magnitude lower than one molecule per Earth’s entire ocean volume (Table 5)! For carbon monoxide, lactate, pyruvate, methyl chloride, syringate + H2 at low [H2], or lactate + H2 at high [H2] it also seems unlikely that meeting the BEQ is a realistic obstacle. For these reactions, threshold concentrations are at most in the low picomolar range – and with that ~2–3 orders of magnitude lower than microbes are known to draw limiting metabolite concentrations down to (e.g., Fuhrman and Ferguson, 1986; Hoehler et al., 2001; Stolper et al., 2010). If previously measured concentrations of organic substrates in deep subsurface sediments, which have for the most part been (0.1 μM (e.g., Shipboard Scientific Party, 2003; Mitterer, 2006; Heuer et al., 2009; Lever et al., 2010), are a good reference, then we are left with the same conclusions as before (Table 4), i.e., that most acetogenesis reactions produce energy yields in excess of the BEQ, even at substrate concentrations that are low for the deep biosphere.
More interestingly, perhaps, examining those substrates that were previously considered less likely to be used by acetogens (based on Tables 3 and 4), suggests that even formate and H2–CO2 are potential acetogen substrates in some subsurface environments. Formate concentrations from low micromolar to tens of micromolar (Table 5) have been documented for sites ranging from organic-rich (ODP Site 1230) to highly oligotrophic (ODP Site 1231; Shipboard Scientific Party, 2003). Thermodynamic calculations based on measured formate concentrations suggest that formate could be a substrate of acetogenesis at certain depths in subsurface sediments on the Juan de Fuca Ridge Flank (Lever et al., 2010). Accurate quantifications of hydrogen concentrations in the deep biosphere are fraught with uncertainty, with two different methods yielding results differing by up to two orders of magnitude (Lin et al., 2011). Yet, independent of the method used, measured concentrations exceeding 10 nM are not uncommon (Shipboard Scientific Party, 2003; Lorenson et al., 2006; Expedition 329 Scientists, 2011; Lin et al., 2011), and suggest that even acetogenesis from H2–CO2 is possible in some places, if not widespread.
In situ energy yields of acetogenesis reactions based on measured concentrations
To the best of my knowledge, the only subseafloor sediment samples for which all educt and product concentrations of acetogenesis reactions have been quantified are from ODP Leg 201 (Shipboard Scientific Party, 2003). The seven sites sampled during this expedition vary from organic-rich to oligotrophic and cover a range of energy conditions that is likely to include most anoxic subseafloor sediments on Earth. For these samples, the concentrations of formate and hydrogen (and no other acetogenic substrates) were measured in parallel with concentrations of acetate, DIC (proxy for bicarbonate), and pH, allowing for the calculation of in situ energy yields of acetogenesis reactions from H2–CO2, formate, and formate + H2 (Figure 1).
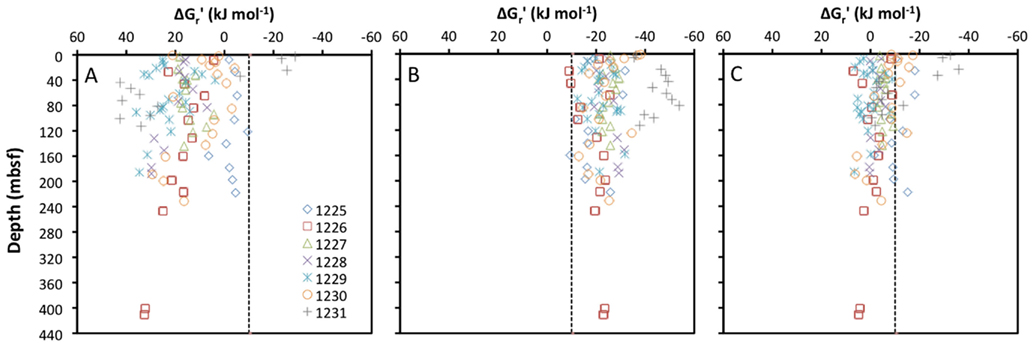
Figure 1. Depth profiles of energy yields associated with acetogenesis reactions from (A) H2–CO2, (B) formate, and (C) formate–H2 for ODP sites 1225-31. All calculations are based on measurements from sediment cores collected during ODP Leg 201 (Shipboard Scientific Party, 2003).
Calculated free energy yields for the three reactions show clear trends: reactions from H2–CO2 are mostly endergonic, and only yield energy in excess of the BEQ value at a few shallow depths at ODP Site 1231 (Figure 1A). Reactions from formate are exergonic with energy yields around or exceeding the BEQ across all sites and depths sampled (Figure 1B). Reactions from formate + H2, are for the most part slightly exergonic, but only exceed the BEQ at a few depths at ODP Sites 1225, 1230, and 1231 (Figure 1C).
Based on these results, one might suppose that acetogenesis from formate is possible across a wide range of subseafloor habitats, whereas acetogenesis reactions involving H2–CO2 or formate + H2 are unlikely. Yet, the high uncertainty associated with the quantification of porewater H2 concentrations needs to be taken into account. H2 concentrations measured during ODP Leg 201 were obtained via an incubation method, which assumes headspace hydrogen to be in equilibrium with dissolved hydrogen in pore fluids after an incubation period (Lovley and Goodwin, 1988; Hoehler et al., 1998). When compared to a new, extraction-based method on the same samples, the incubation method yields concentration measurements that are consistently lower by one to two orders of magnitude (Lin et al., 2011). If in situ concentrations of H2 in sediments sampled during Leg 201 are one order of magnitude higher than measured previously, this would lower the Gt′ for acetogenesis from H2–CO2 by ~22 kJ mol−1. In this case, close to half of the samples would have energy values exceeding the BEQ (Figure 1A). If in situ concentrations are two orders of magnitude higher, this will lower the Δ Gt′ for acetogenesis from H2–CO2 by an additional ~22 kJ mol−1 – by a total of ~44 kJ mol−1 of the reaction compared to the measured H2 data. In this case, energy yields of acetogenesis from H2–CO2 would exceed the BEQ in the overwhelming majority of samples collected during Leg 201.
Energy yields of acetogenesis reactions involving H2 compared to competing sulfate reduction and methanogenesis reactions
The main empirical support for the concept of redox zonation comes from isotopic tracer studies and measurements of hydrogen concentrations in sulfate-reducing and methanogenic freshwater and coastal surface sediments (e.g., Cappenberg, 1974; Capone and Kiene, 1988; Lovley and Goodwin, 1988; Hoehler et al., 1998; Heimann et al., 2010). Acetogenesis has received less attention in sediments due to the difficulty of detecting the process; after all the end product acetate is also a key substrate to sulfate reducers and methanogens, and rapid turnover results in acetate typically not accumulating to high concentrations – unlike the end products of sulfate reduction and methanogenesis, sulfide, and methane. Moreover, acetogenesis is often equated with the “homoacetogenic” reaction from H2–CO2, which is thermodynamically unfavorable under thermodynamic control of H2 concentrations in sulfate-reducing or methanogenic sediments. Only rarely have energy yields of organotrophic acetogenesis reactions that include H2 been taken into account (Liu and Suflita, 1993; Lever et al., 2010). Here I compare the energy yields of various acetogenesis reactions involving H2 to those of the widespread hydrogenotrophic sulfate reduction and methanogenesis reactions at a wide range of H2 concentrations (Figure 2).
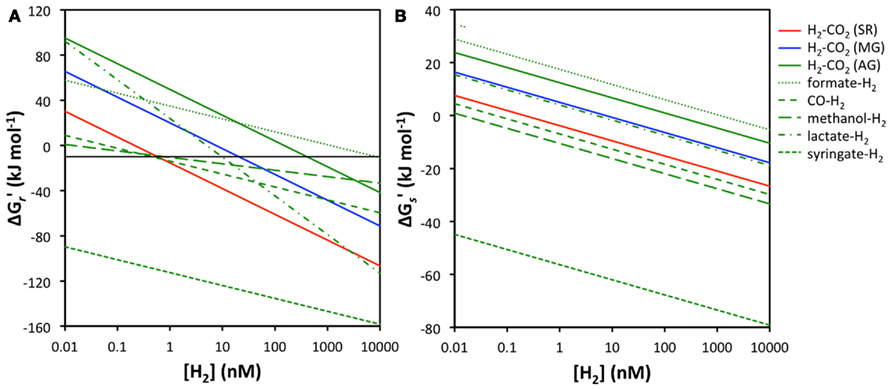
Figure 2. Relationship between H2 concentrations and energy yields for sulfate reduction, methanogenesis, and acetogenesis from H2–CO2, as well as acetogenesis from formate–H2, CO–H2, methanol–H2, lactate–H2, and syringate–H2. (A) energy yields per reaction  the black line indicates the BEQ, (B) energy yields per substrate
  All calculations were done assuming standard temperature and pressure, and using educt and product concentrations as outlined in the Materials and Methods, except for [H2].
At first glance it is apparent that acetogenesis from H2–CO2 is thermodynamically less favorable than sulfate or methanogenesis reactions from H2–CO2, independent of H2 concentrations (Figure 2A). Under the conditions used in calculations, sulfate reducers can meet the BEQ down to H2 concentrations of ~0.6 nM, methanogens down to 11 nM, whereas acetogens require 410 nM H2 concentrations. Acetogenesis from formate + H2 is also unlikely, as its energy yields are below the BEQ unless H2 concentrations are in the micromolar range. More energetically favorable than sulfate reduction or methanogenesis is, however, the acetogenic reaction from syringate + H2, which even at H2 concentrations as low as 0.01 nM produces high-energy yields (~−90 kJ mol−1) – concentrations at which both sulfate reduction and methanogenesis are endergonic. Moreover, while sulfate reduction from H2–CO2 is the overall second most energy-yielding reaction, acetogenesis reactions from CO, methanol, and lactate produce more energy than hydrogenotrophic methanogenesis at H2 concentrations within the typical range measured in deep subseafloor sediments.
When energy yields are considered on a per hydrogen molecule level, the results are even more striking. Acetogenesis reactions from syringate + H2, methanol + H2, and CO + H2 all provide more energy per H2 molecule than sulfate reduction from H2–CO2 (Figure 2B). The reaction from lactate + H2 yields less energy than hydrogenotrophic sulfate reduction, but slightly more than hydrogenotrophic methanogenesis, while acetogenesis reactions from formate + H2 and H2–CO2 produce the least amount of energy per H2 molecule and are endergonic except at micromolar H2 concentrations (Figure 2B).
One might argue that carboxydo- and organotrophic acetogenesis reactions involving H2 are unlikely in marine sediments. After all, reactions involving the same carbon substrate without H2 yield more energy except when high H2 concentrations coincide with low temperature (Tables 3 and 4) – a condition that has traditionally only been observed during season-induced temporary disequilibria in shallow sediments (Hoehler et al., 1999) and is perhaps unlikely in seasonally stable subsurface sediments. Yet, the method-dependent discrepancies in measured H2 concentrations in deep subsurface sediments (Lin et al., 2011) leave room for high uncertainty; if the higher [H2] measurements obtained with a new extraction-based method (Lin et al., 2011) turn out to be accurate, then carboxydo- and organotrophic acetogenesis reactions with H2 may be competitive, if not energetically favorable, over carboxydo- and organotrophic reactions without H2 in the predominantly cold, deep biosphere. Evidence supporting the importance of organotrophic reactions with H2 comes from subsurface sediments of the Atlantic Coastal Plain (Liu and Suflita, 1993). An acetogenic isolate from these sediments only showed growth through O-demethoxylation of syringate under an H2–CO2 atmosphere, while no growth on syringate was observed under an N2–CO2 or N2 atmosphere. And by metabolizing syringate with H2, this organism was able to outcompete hydrogenotrophic methanogens for H2 in the initial sediment enrichment.
The ability to gain energy from the demethoxylation of syringate or other lignin monomers is widespread among acetogens, but not among sulfate reducers or methanogens, suggesting that methoxy-groups on aromatic rings might represent non-competitive substrates (Lever et al., 2010). The same is not true for the other substrates, lactate, CO, and methanol (Figure 2). Lactate serves as a growth substrate not only to many acetogens (Lever et al., 2010), but also to many sulfate reducers (Rabus et al., 2006), which can be expected to have higher energy yields from competing sulfate reduction reactions. Similarly, despite being less widely used as growth substrates than among acetogens (Lever et al., 2010), CO, and methanol can also serve as energy substrates to certain sulfate reducers (reviewed in Mörsdorf et al., 1992), as well as several methanogens (reviewed in Whitman et al., 2006, and in Ferry, 2010). Both sulfate reducers and methanogens can be expected to gain more energy from reactions involving CO or methanol than acetogens. Hence, evidence suggesting an important role for acetogenesis in the cycling of CO and methanol in marine and freshwater sediments might be surprising (King, 2007; Jiang et al., 2010). In the following section, I will argue that the ability of acetogens to use a wide range of substrates is a viable survival strategy under conditions of energy limitation – despite lower energy yields per substrate.
Metabolic Strategies of Acetogens
A striking feature of acetogens as a metabolic guild is the widespread ability to use a large number and wide diversity of carbon compounds as energy substrates. Over half of all cultured strains test positively for growth on H2/CO2, carbon monoxide, formate, methanol, ethanol, other aliphatic compounds such as lactate, and methoxylated aromatic compounds (Lever et al., 2010). Further widely used growth substrates include carbohydrates, other short-chain fatty acids and alcohols, methoxylated aliphatic compounds, betaines, amino acids, and aldehydes (Drake et al., 2006). Even complex organic polymers, such as cellulose or carboxymethylcellulose, are used by some strains (Wolin and Miller, 1994; Karita et al., 2003; Wolin et al., 2003). Due to the limited number of energy substrates on which growth is typically tested, substrate ranges of acetogens may significantly exceed the currently known spectrum. Any methyl or methoxyl groups of compounds found in the environment represent potential energy substrates, that, given thermodynamically favorable conditions, might be combined with CO2 to form acetate.
Considering the striking metabolic versatility of acetogens, it seems plausible that the resulting plasticity with respect to substrate use is part of the strategy that enables acetogens to coexist with sulfate reducers and methanogens. In the following sections, I will examine two hypotheses that seek to explain the benefits of a wide metabolic spectrum. The first hypothesis is that acetogens can coexist with sulfate reducers and methanogens due to niche differentiation with respect to substrate use. In other words, acetogens may avoid competition by consuming substrates not used by sulfate reducers or methanogens. The second hypothesis is that the ability to pool energy from a wide range of metabolic reactions enables coexistence despite lower energy from shared substrates. These two hypotheses are not incompatible, but should rather be regarded as two complementary advantages of a generalist metabolic strategy.
Niche differentiation based on substrate use
When viewed collectively, sulfate reducers, though not to the same extent as acetogens, can also exploit a large variety of substrates. When examined more closely, however, it appears that only the ability to use H2, short-chain fatty acids, and ethanol is truly widespread across the various genera (Rabus et al., 2006). Common acetogenic substrates such as methanol, glucose, fructose, carbon monoxide, and methoxylated lignin monomers are not substrates to the vast majority of sulfate reducers (Mörsdorf et al., 1992; Rabus et al., 2006). The thermodynamic advantage of higher energy yields of sulfate reduction compared to acetogenesis thus only plays out for a subset of acetogenic substrates that are also utilized by sulfate reducers. Tracer experiments indicating H2 and short-chain fatty acids as the main electron donors used by sulfate reducers in estuarine and marine sediments support this conclusion (Sørensen et al., 1981; Parkes et al., 1989). Similarly, experimental evidence indicating acetogens as key consumers of CO and methoxyl groups in sulfate-reducing marine sediments (Küsel et al., 1999; King, 2007) suggests that, despite overlaps in substrates, acetogens, and sulfate reducers practice a form of niche differentiation in which each group favors different energy substrates where they coexist.
Vastly less metabolically versatile than acetogens or sulfate reducers, the substrate range of methanogens is limited to (1) CO2 reduction (H2/CO2, formate, a few use carbon monoxide or alcohols), (2) acetate disproportionation, and (3) demethylation of C1 compounds (methanol, methyl sulfides, and methylamines). With the exception of one genus (Methanosarcina), most methanogens are substrate specialists and only capable of growth on one of these three substrate groups (Whitman et al., 2006). Hence, potential competition between acetogens and methanogens for substrates is limited to a small subset of acetogenic substrates.
Niche differentiation, resulting in use of different energy substrates where the groups coexist, may thus explain why sulfate reducers and methanogens do not competitively exclude acetogens in anoxic sediments. Why have sulfate reducers not adapted to use the full spectrum of substrates used by acetogens? And, given that both acetogens and methanogens utilize the reductive acetyl CoA pathway for energy production and/or C fixation and overlap in substrate use (Drake et al., 2006; Whitman et al., 2006), why might these two groups differ so drastically with respect to their metabolic versatility? The ultimate evolutionary explanations remain subject to speculation. On a more proximal level, differences in energy yields and turnover rates of energy substrates may have played a role in driving differences in metabolic strategies.
The most common substrates used by sulfate reducers and methanogens, i.e., H2 and acetate, so called central intermediates of organic carbon degradation (e.g., Valentine, 2001; Dolfing et al., 2008), are presumably the electron donors with the highest turnover rates in anoxic sediments. Other short-chain fatty acids, which represent important energy substrates to sulfate reducers are also known to have high turnover rates (Sørensen et al., 1981; Parkes et al., 1989); even methylated compounds used by methanogens, i.e., methanol, methylamines, and methyl sulfides, are known to have high turnover rates in certain environments (e.g., Zhilina and Zavarzin, 1990; Mitterer et al., 2001; Jiang et al., 2010; Lin et al., 2010). Substrates with high turnover rates are typically small, as they derive from a variety of individually less abundant, larger source molecules; they also often harbor less energy than larger organic molecules with lower turnover rates (Tables 3 and 4). Why might certain groups utilize substrates with high turnover rates but low-energy yields, while others use substrates with low turnover rates but high-energy yields? Part of the answer may lie in the universal requirement of cells to meet maintenance energy requirements.
Meeting maintenance energy requirements is especially challenging in deep subsurface sediments, as these have typically been cut off from fresh organic matter supplies for thousands to millions of years. Here the vast majority of cells is likely to be in a permanent state of starvation (D’Hondt et al., 2004; Jørgensen et al., 2006) and starvation may even represent the primary source of mortality. Based on chemostat experiments, the following relationship between maintenance energy and temperature has been established (Tijhuis et al., 1993; Harder, 1997):

where ME is the maintenance energy (kJ (g dry mass)−1 d−1), A a constant [4.99 × 10¹² kJ (g dry mass)−1 d−1], Ea the activation energy (69.4 kJ mol−1 K−1), R the universal gas constant (0.008314 kJ mol−1 K−1), and T the temperature (K). The value of the constant A was calculated from the energy supply rate at which microbial cell growth and replication stops in chemostat experiments (Tijhuis et al., 1993). It has since been estimated that the actual threshold energy required for cell maintenance is three orders of magnitude lower than the threshold for growth/replication (Price and Sowers, 2004; Biddle et al., 2006). Therefore, I will use a value of 4.99 × 10⁹ kJ (g dry mass)−1 d−1 for A in all calculations of ME. Based on this value of A, a maintenance energy of 1.26 kJ (g dry mass)−1 year−1 can be calculated at standard temperature. Tijhuis et al. (1993) propose that 26 g of cell dry mass on average contain 12 g cell carbon. Combined with the published estimate of 10 fg C per cell for sediment-inhabiting microbes (Whitman et al., 1998), one can then calculate a cell-specific maintenance energy, MEcell, of 2.74 × 10⁻¹⁴ kJ cell−1 year−1 at standard temperature.
The relationship between MEcell, the Gibbs free energy yield per substrate,  (kJ mol−1), and the cell-specific substrate turnover rate, kcell (mol cell−1 year−1) that is required for a cell to meet maintenance energy requirements, can be expressed as follows:

where A and B indicate substrates A and B, respectively. If cells are only consuming one substrate, this expression simplifies, so the equation can be solved for kcell, if MEcell and  are known:

The relationship between kcell and  is hyperbolic (Figure 3A). This has implications for metabolic strategies among microbes: for instance, microbes can meet maintenance energy requirements by consuming substrates with low-energy yields as long as turnover rates are high and the BEQ is met (MEA); alternatively, microbes can meet ME requirements at low turnover rates, as long as energy yields per substrate are high (MEB).
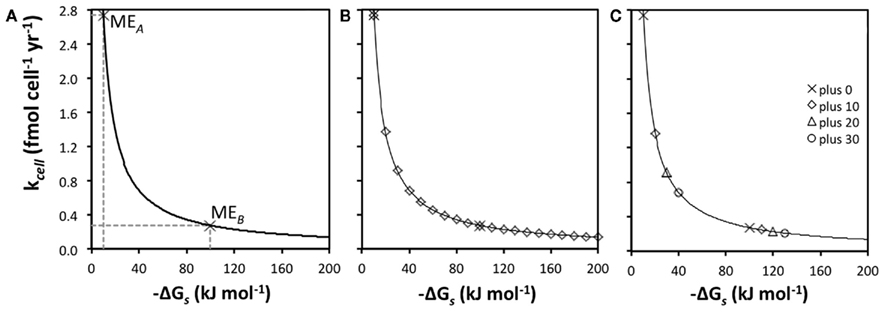
Figure 3. Relationships between energy yields per substrate  and turnover rate (kcell). (A) Hyperbolic relationship between
  and kcell assuming MEcell = 2.74 × 10− 14 kJ cell
−1 year
−1. MEA and MEB indicate two different strategies to meet MEcell, MEA for a substrate with low-energy yields
and kcell assuming MEcell = 2.74 × 10− 14 kJ cell
−1 year
−1. MEA and MEB indicate two different strategies to meet MEcell, MEA for a substrate with low-energy yields  and a high kcell, and MEB for a substrate with high-energy yields
  and a low kcell. (B) Illustration of the effect of 10 kJ mol
−1 increments in energy yields per substrate on the turnover rate required to meet MEcell. (C) Turnover rates for MEA and MEB (“plus 0”) compared to competing reactions “plus 10,” “plus 20,” and “plus 30” with 10, 20, and 30 kJ mol
−1 higher energy yields per substrate, respectively.
and a low kcell. (B) Illustration of the effect of 10 kJ mol
−1 increments in energy yields per substrate on the turnover rate required to meet MEcell. (C) Turnover rates for MEA and MEB (“plus 0”) compared to competing reactions “plus 10,” “plus 20,” and “plus 30” with 10, 20, and 30 kJ mol
−1 higher energy yields per substrate, respectively.
A further implication is that small changes in  greatly influence the turnover rate required to meet MEcell if energy yields per substrate are small (here <50 kJ mol−1), but not if they are high (here ≥100 kJ mol−1; Figure 3B). If
  changes from −10 to −20 kJ mol−1, the turnover rate required to meet maintenance energy requirements drops by 50%. By comparison, if
  changes from −100 to −110 kJ mol−1, the decrease in required turnover rate is only ~9%.
What does this mean regarding the substrates used by sulfate reducers and methanogens compared to the substrates used by acetogens? In Figure 3C, maintenance turnover rates are illustrated for the same metabolic reactions, A and B, as in Figure 3A (plus 0), as well as for three hypothetical pathways that produce higher energy yields per substrate (plus 10, plus 20, plus 30); “plus 0” exemplifies acetogenesis reactions from a high turnover, low-energy substrate (MEA), and a low turnover, high-energy substrate (MEB), respectively; the pathways behind “plus 10,” “plus 20,” and “plus 30” are energetically more favorable methanogenesis and sulfate-reducing reactions involving the same two substrates. The differences in  of −10, −20, and −30 kJ mol−1 relative to acetogenic reactions are based on typical differences in
  calculated for methanogenesis/sulfate reduction vs. acetogenesis reactions involving the substrates formate, methanol, and lactate across a wide range of temperatures (275–337 K) and sulfate concentrations (0–28 mM) in subsurface sediments (Lever et al., 2010). The comparison illustrates that acetogenesis reactions operating near the thermodynamic threshold (MEA, ΔGs′ = −10 kj mol−1 Figure 3C) have a tremendous disadvantage in meeting MEcell compared to competing methanogenic or sulfate-reducing reactions, which can operate at one-half, one-third, or one-fourth the substrate turnover (Table 6). The advantage of vastly lower turnover rates required to meet MEcell diminishes with increasing energy yields per substrate (MEB, Figure 3C). It follows that the minimum turnover rates of the three competing methanogenesis and sulfate reduction reactions are only lower by 9, 17, and 23%, when the energy yield per substrate is −100 kJ mol−1 for the acetogenesis reaction (Table 6).
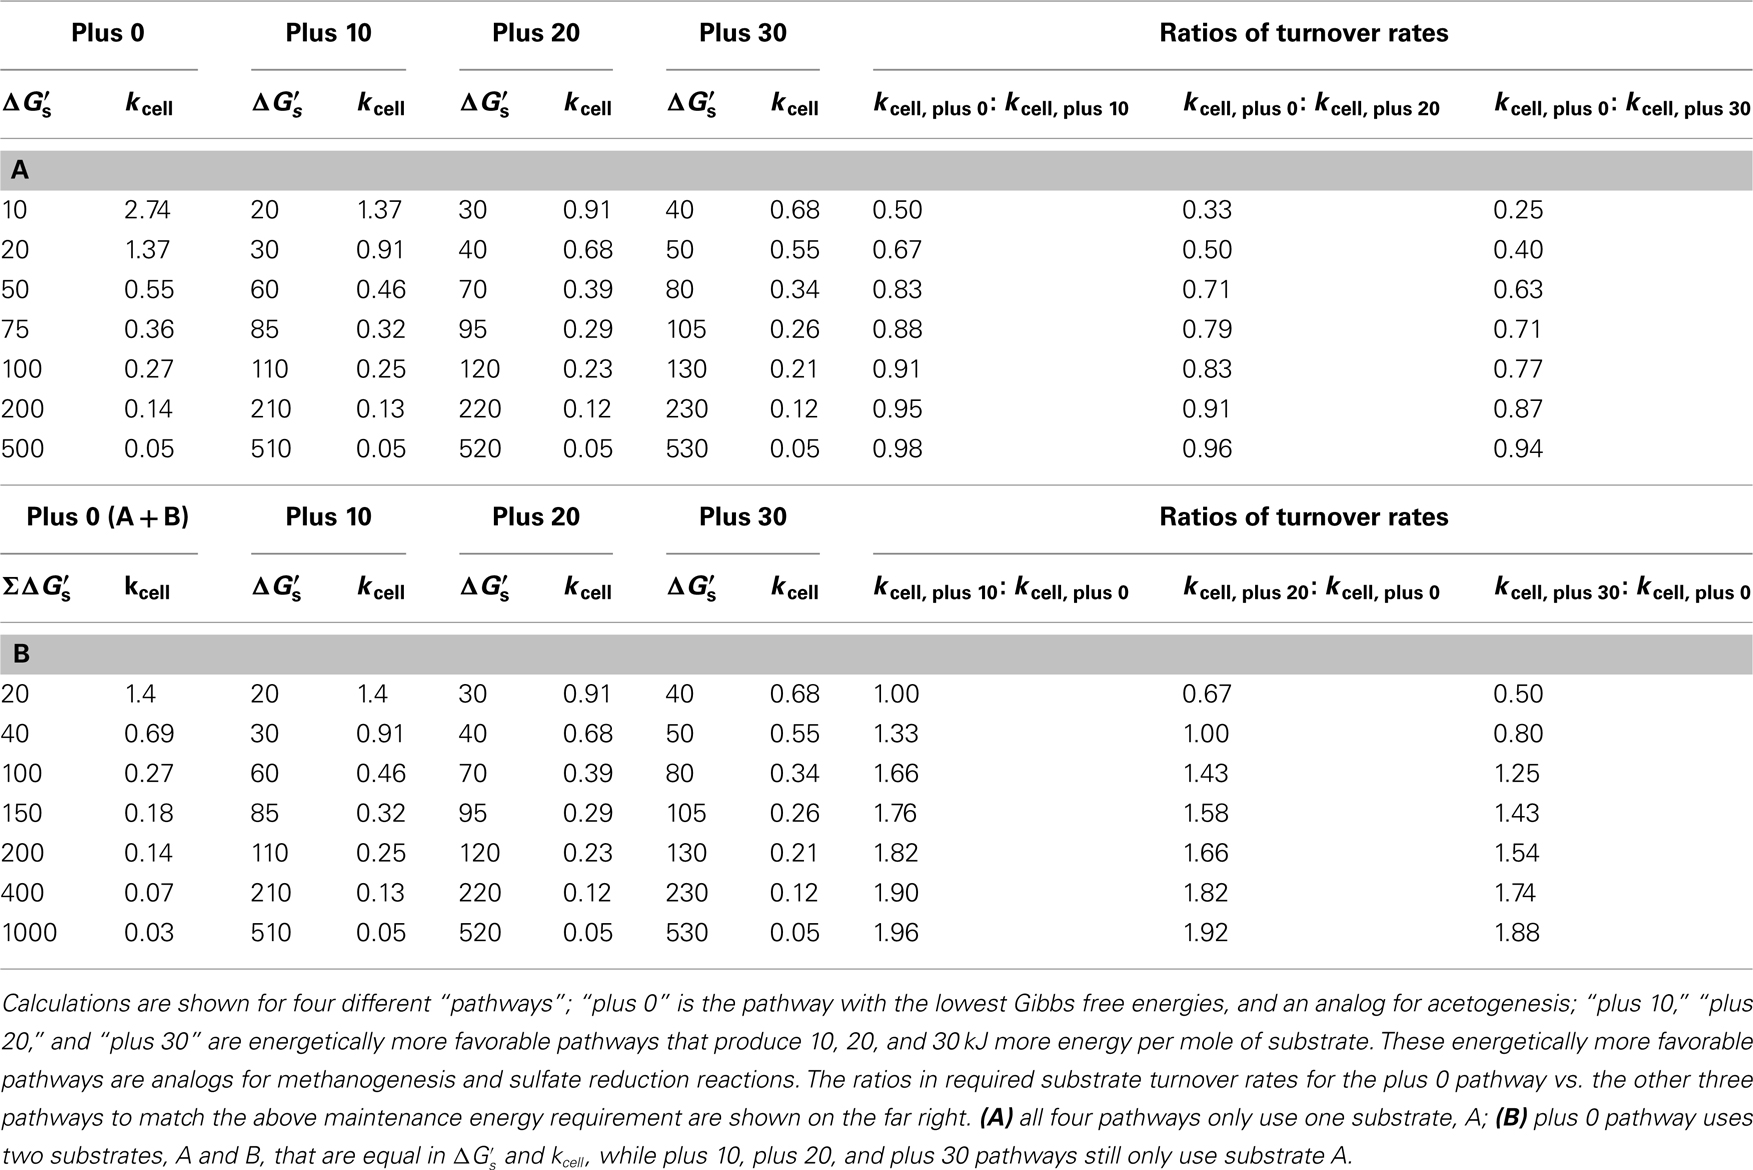
Table 6. Overview of cell-specific substrate turnover rates (kcell; fmol cell−1 year−1) required to meet the theoretical maintenance energy requirement of 2.74 × 10⁻¹
4 kJ cell−1 year−1 at different free energy yields per substrate ( kJ mol−1).
Returning to the question raised earlier in this section, i.e., whether methanogens/sulfate reducers and acetogens may practice a form of niche differentiation, in which each group uses different substrates where they co-occur, the model presented here provides clear answers. Feeding on high-energy, low turnover substrates is a viable survival strategy for microbes, as is feeding on low-energy, high turnover substrates. The two strategies may, at least in part, explain the coexistence of acetogenic with sulfate-reducing and/or methanogenic microbial populations. A reason why sulfate reducers/methanogens may mainly use low-energy, high turnover substrates is their vast energetic advantage over acetogens in metabolizing these substrates. At high  the energetic advantage of sulfate reducers/methanogens over acetogens decreases, and other guild-specific traits may increase in importance. One of these will be discussed in the following section.
Specialist vs. generalist arguments
The potential advantages of a specialist vs. a generalist life style have been the subject of discussions among ecologists for over five decades. A traditional view is that selectivity (specialization) pays off under non-limiting energy conditions, while less discrimination toward food sources (generalism) is the more effective survival strategy under energy limitation (e.g., Emlen, 1966; Dykhuizen and Davies, 1980; for reviews see Pianka, 1994; Egli, 1995). With respect to microbial ecology, this argumentation has been called into question by certain microbial growth experiments, in which long starvation periods appeared to favor specialists (e.g., Kuenen, 1983).
A fundamental difference between microbes and macrobiota under energy limitation is that microbes not only struggle to meet maintenance energy requirements, but also to acquire a minimum free energy (BEQ) from a metabolic reaction to even be able to produce ATP. Hence, substrate specialists are often equipped with high substrate affinities down to very low concentrations that enable them to outcompete not only other metabolic guilds, but also other members of their own metabolic guild. A classic example among methanogens is the obligately aceticlastic Methanosaeta genus which can grow on acetate concentrations below 10 μM (Jetten et al., 1992). By comparison, the (by methanogen standards) “generalistic” Methanosarcina genus, members of which can grow via CO2 reduction, acetate disproportionation, and demethylation of C1 compounds, requires acetate concentration of at least 200 μM for growth (Jetten et al., 1992). High substrate affinity appears to be a strategy among specialists by which they can more efficiently take up substrates and drive substrate concentrations below the threshold concentrations required by generalists. This form of energetic (i.e., thermodynamic) exclusion, which only occurs in microbes, provides a gateway for substrate specialists, provided they can meet maintenance energy requirements. The costs of substrate specialization are a smaller accessible energy pool due to utilization of fewer energy substrates and lower energy yields per substrate.
In energy-starved environments, such as deep subsurface sediments, a specialist metabolic strategy may work effectively for substrates with high turnover rates. High turnover rates and relatively high cell densities are necessary to maintain the low substrate concentrations that enable specialists to thermodynamically exclude less efficient consumers of the same substrate. As shown earlier (Tables 1– 3), thermodynamic exclusion of acetogens is only likely for the low-energy substrates H2 and formate, however. Other, less common, but more energy-rich substrates occur at concentrations exceeding the thermodynamic threshold, and provide little incentive for specialization due to the impossibility of thermodynamically excluding other groups, such as acetogens, from consuming them. Hence, a more generalist metabolic strategy may be more effective among consumers of these more rare, energy-rich substrates.
As discussed in a previous section, substrate generalism is a widespread trait among acetogens. With respect to meeting maintenance energy requirements, there are clear advantages to using more than one substrate (Figure 4); for instance, at high turnover rates and low ΔGs (−10 kJ mol−1 substrate) combining the energy yields of two substrates, A and B, with the same  and kcell may enable acetogens to lower their required substrate turnover by 50% and successfully compete with methanogens/sulfate reducers that gain 10 kJ more energy per mole of substrate A (MEA; Figure 4; Table 6). While this is an improvement of competitiveness, pooling the energy from two substrates is still insufficient to compete with methanogens/sulfate reducers gaining 20 or 30 kJ more per mole of substrate, which still can meet MEcell on turnover rates that are 33 and 50% lower, respectively (Table 6). To match energy yields of the latter, energy from three or four substrates with the properties of substrate A would need to be pooled – a considerable disadvantage in terms of energy efficiency as one might argue. This changes for substrates with high-energy yields (e.g., −100 kJ mol−1 substrate) and resultingly low required turnover rates (MEB; Figure 4). For these, pooling the energy from two substrates would enable an acetogen to grow at a significantly lower turnover rate than any of the competing methanogens/sulfate reducers utilizing only one substrate – a significant advantage (Figure 4; Table 6). It follows from this that pooling the energy from multiple substrates would increase acetogenic competitiveness with sulfate reducers and methanogens overall – and in particular for energy-rich substrates.
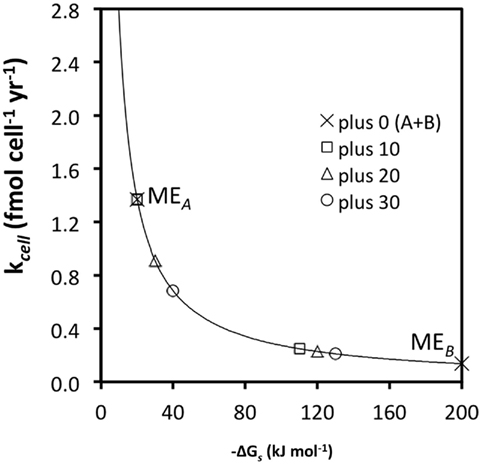
Figure 4. The same relationship as in Figure 3C, except that turnover rates required for MEA and MEB (“plus 0”) are now calculated for the sum of two substrates, A and B [“plus 0 (A + B)”]. All other values are the same as before.
The same principle as in comparing the benefits of using two vs. one substrates applies in comparing the benefits of using more, e.g., 3 vs. 2, 5 vs. 4, 10 vs. 5, etc., substrates. The main point is that acetogens typically have wider substrate spectra than sulfate reducers or methanogens, and that pooling energy from a larger number of substrates may enable acetogens to in some cases survive on lower substrate turnover rates than the other groups, despite lower energy yields per substrate. Experimental evidence that confirms pooling of energy sources as the explanation for the coexistence of acetogenic with sulfate-reducing and/or methanogenic populations in the deep biosphere is still missing. However, the same principle has been demonstrated in continuous-flow cultures involving other groups of microorganisms that were grown under carbon-limiting conditions: here several studies have shown substrate generalists to grow at lower substrate concentrations than substrate specialists when incubations included multiple substrates (Gottschal et al., 1979; Dykhuizen and Davies, 1980; reviewed in Egli et al., 1993; Egli, 1995).
Based on the calculations presented (Figure 4; Table 6), one might conclude that pooling energy is only an effective strategy for subseafloor acetogens to meet MEcell if it involves high-energy substrates. For low-energy substrates, more specialized organisms with higher energy yields per substrate, i.e., sulfate reducers and methanogens, should have a vast advantage (Figure 4), provided that energy yields of acetogenesis reactions even exceed the BEQ. Even the most efficient specialist will reach a limit when substrate turnover rates drop below the threshold required to meet MEcell, however; at this point the specialist is either forced to consume additional substrates, or to allow substrate concentrations above the thermodynamic threshold. Evidence potentially supporting the latter comes from oligotrophic sediments of the South Pacific Gyre and Equatorial Pacific, where H2 concentration peaks in the tens of nanomolar range have been reported for subsurface horizons with exceedingly low microbial activities (Shipboard Scientific Party, 2003; Expedition 329 Scientists, 2011). If substrate specialists are forced to allow substrate concentrations above the thermodynamic threshold, they become vulnerable to less efficient, more generalistic organisms competing for their preferred substrate. Ultimately, because of the larger accessible substrate and hence energy pool, one might therefore expect substrate generalists to dominate under the most energy-depleted conditions.
The results presented thus far suggest that it is very difficult to predict the outcome of the complex competition between acetogens and other groups for substrates in the deep biosphere. Beside physical variables, such as temperature and pressure, it may be necessary to measure concentrations of all educts and products of relevance – a very challenging task with acetogens, due to their wide substrate spectra – as well as measure substrate-specific turnover rates – a seemingly impossible undertaking given the very low turnover rates in the deep biosphere. Even with complete knowledge on concentrations and turnover rates, predicting competitive outcomes on a substrate-level would be compromised by our still limited knowledge on the metabolic capabilities of microbes inhabiting anoxic (subseafloor) sediments, as well as other important life history traits. One of the latter is the energetic cost of biosynthesis – a variable that is likely to vary widely across microbes and microbial metabolic guilds.
The Energetic Cost of Biosynthesis Among Acetogens
Of the currently known six pathways of autotrophic carbon fixation, the reductive acetyl CoA pathway is the simplest and energetically most favorable due to the absence of complex biochemical intermediates (Russell and Martin, 2004; Berg et al., 2010). This strictly anaerobic pathway only consists of a carbonyl branch, in which CO2 is reduced to an enzyme-bound carbonyl group, and a methyl branch, in which CO2 is reduced to a cofactor-bound methyl group. The bifunctional enzyme CO dehydrogenase/acetyl CoA synthase (CODH/ACS) carries out both the reduction of CO2 to CO, as well as the synthesis of the end product, acetyl CoA, by joining the carbonyl and methyl groups (e.g., Hügler and Sievert, 2011). The reductive acetyl CoA pathway is unique among C fixation pathways in that it is linear; given geochemically favorable conditions, e.g., in alkaline hydrothermal vent environments, each step is exergonic, meaning that CO2 fixation can occur spontaneously (Martin and Russell, 2007). It has therefore been suggested that this pathway started as a geochemical pathway (Russell and Martin, 2004). Moreover, due to it being the only known C fixation pathway that occurs in both Bacteria and Archaea, it has been conjectured that the reductive acetyl CoA pathway is the most ancient C fixation pathway (Fuchs and Stupperich, 1985), or even the very first biochemical pathway to have evolved on Earth (Peretó et al., 2004). The great simplicity and low energetic cost suggest that anaerobic organisms using this pathway have an energetic advantage over organisms using other C fixation pathways, such as the reverse tricarboxylic acid cycle.
The reductive acetyl CoA pathway is found in all known acetogens and methanogens, as well as several autotrophic sulfate reducers and anammox bacteria (Schauder et al., 1989; Drake et al., 2006; Strous et al., 2006; Whitman et al., 2006). Certain methanogens and autotrophic sulfate reducers use the pathway exclusively for biosynthesis, while others, including acetate-oxidizing sulfate reducers, aceticlastic methanogens, and syntrophic acetate oxidizers, can produce energy by reversing the pathway so it becomes oxidative (e.g., Spormann and Thauer, 1988; Hattori et al., 2005; Liu and Whitman, 2008). Acetogens, and among these I include facultative acetogens, such as certain sulfate reducers, methanogens, and anaerobic acetate oxidizers (e.g., Jansen et al., 1984; Rother and Metcalf, 2004; Hattori et al., 2005; Lessner et al., 2006; Henstra et al., 2007), are the only group known to perform this pathway both for biosynthesis and energy production. A possible advantage of using the same pathway for energy production and biomass assimilation is that smaller genomes and fewer enzymes need to be produced and maintained. Since starvation mode is likely to be the rule rather than the exception among microbes in energy-deprived subseafloor sediments (Jørgensen et al., 2006), reducing the energetic cost of genome maintenance and enzyme synthesis may confer a significant advantage to microbes that are able to carry out energy production and biosynthesis via the same pathway.
It has, in fact, been postulated that the synthesis and maintenance of enzymes to repair DNA from depurination reactions and proteins from racemization reactions are the main energy expenditures among microorganisms in survival mode (Price and Sowers, 2004). While too little is known about cell-specific enzyme concentrations and turnover rates in the deep subseafloor to calculate the energetic cost of synthesizing and maintaining these enzymes, concentrations of protein building blocks, i.e., certain amino acids (aspartate, glutamate, serine, glycine), have been measured in subsurface sediments of the Peru Margin and Equatorial Pacific (Mitterer, 2006). I use these here to calculate the energetic cost of their lithoautotrophic synthesis. Irrespective of the site, a high energetic cost can be expected for the synthesis of all four amino acids (Figure 5). Assuming that this is a general trend across amino acids, the lithoautotrophic synthesis of proteins, and hence enzymes, can be expected to be an energetically costly process in subseafloor sediments. A key intermediate during amino acid synthesis under anaerobic conditions is the energy-rich acetyl CoA molecule, which is also a crucial intermediate during acetogenesis. Assuming that acetogenesis from H2–CO2 is associated with an energetic cost (Figure 1A), then obligate lithoautotrophs, including many methanogens and sulfate reducers, which synthesize amino acids from H2 and CO2, will spend significant amounts of energy on the reductive synthesis of acetyl CoA alone. By contrast, the majority of organotrophic acetogenesis reactions are exergonic (Table 3). Most acetogens may therefore be able to cut back energy expenditures during enzyme synthesis, compared to obligately autotrophic organisms, by using organic substrates to synthesize the amino acid precursor acetyl CoA.
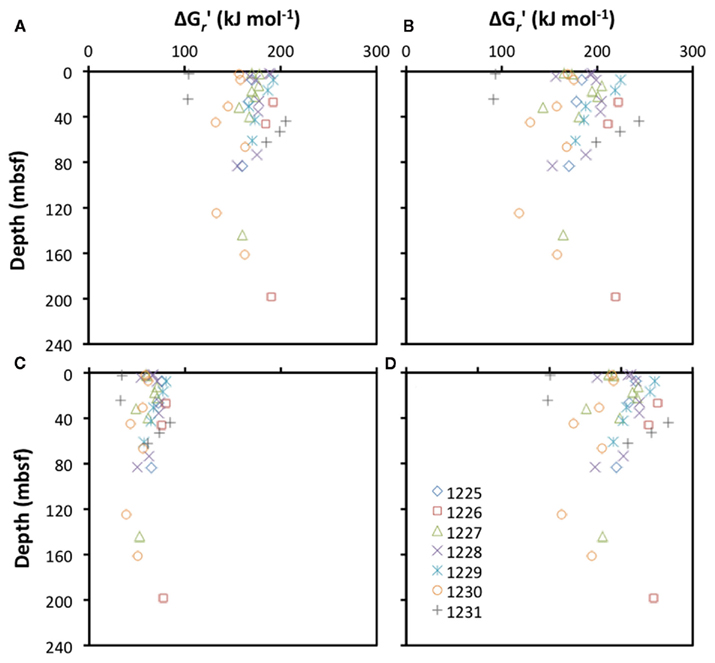
Figure 5. Depth profiles of energetic cost of the lithoautotrophic synthesis of the amino acids (A) aspartic acid [asp2−; 4 HCO3− + NH4+ + 6 H2 + H+ → −OOCCH(NH2)CH2COO− + 8 H2O], (B) glutamic acid [glu2−; 5 HCO3− + NH4+ + 9 H2 + 2 H+ → −OOC(CH2)2CH(NH2)COO− + 11 H2O], (C) serine [3 HCO3− + NH4+ + 5 H2 + 2 H+ → CH2OHCH(NH3+)COO− + 6 H2O], and (D) glycine (2 HCO3− + NH4+ + 3 H2 + H+ → NH3+CH2COO− + 4 H2O) at ODP sites 1225-31. All calculations are based on measurements obtained from sediment cores collected during ODP Leg 201 (Shipboard Scientific Party, 2003; Mitterer, 2006).
Conclusion
If energy yields per substrate are the only important variable controlling microbial metabolism in energy-starved subsurface sediments, then acetogenic microbes should be outcompeted by other anaerobic microbes that perform energetically more favorable pathways, such as sulfate reduction and methanogenesis. While this may be the case in some places, recent δ13C-isotopic analyses that indicate a significant acetogenic contribution to total acetate turnover have suggested otherwise (Heuer et al., 2009; Lever et al., 2010). In this study, I discuss several potentially advantageous traits of acetogenic microbes that may enable them to coexist with sulfate reducers and methanogens in spite of lower energy yields per substrate.
Using conservative calculations, I show that most acetogenic substrates are likely to occur at concentrations that vastly exceed the thermodynamic threshold concentration for acetogenesis and are thus potential energy substrates to acetogens in the deep biosphere. Due to their ability to metabolize certain substrates via multiple different reactions, e.g., methanol alone, methanol + H2, or methanol + formate, acetogens have a remarkable metabolic flexibility compared to sulfate reducers and methanogens, which in some cases may enable them to gain higher energy yields per substrate than these two groups. Acetogens also have a greater metabolic versatility with respect to the number and breadth of substrates utilized than sulfate reducers and methanogens. As a result, they may avoid competition via niche differentiation, i.e., by feeding on substrates not utilized by most sulfate reducers or methanogens. The greater substrate breadth furthermore means that acetogens are able to access energy from a greater overall number of substrates. Rather than evolving to become highly efficient and specialized consumers of abundant single substrates, acetogens are therefore likely to be substrate generalists with the capacity to draw on a large pool of less abundant (rare) substrates.
A further advantage of the acetogenic lifestyle may lie in the ability of acetogens to curb energy spent on biosynthesis. Acetogens use the reductive acetyl CoA pathway, the energetically least costly of all C fixation pathways. By using this pathway for both energy production and biosynthesis, they may cut back on energy that other groups spend on the maintenance of additional genes and enzymes. Use of organic compounds rather than H2/CO2 as starting blocks of biomass synthesis may moreover enable acetogens to circumvent energetically costly lithoautotrophic C fixation. Given the high energetic cost of amino acid synthesis in deep subsurface sediments, and the fact that synthesis and maintenance of enzymes for DNA and protein repair are likely to be the main energy expenditures of microbes in starvation mode, acetogens may be able to save crucial energy for survival by virtue of the simplicity and versatility of their biochemical pathway.
Given that the vast majority of cells in deep subsurface sediments are probably in starvation mode with generation times of hundreds to thousands of years (Biddle et al., 2006; Jørgensen et al., 2006), basic questions regarding the ecology of these organisms remain unanswered. Are the cells found highly recalcitrant survivors from surface environments, or have they adapted to the conditions of extreme energy limitation? Have microbes actively colonized sediments long after their accumulation, or have they been present since their initial deposition? Irregardless of the answers to these questions, it is likely that the ability of acetogens to use wide substrate ranges and perform biosynthesis at low energetic cost represent valuable survival traits in the deep biosphere – even if they did not originally evolve as adaptations to this environment.
Conflict of Interest Statement
The author declares that the research was conducted in the absence of any commercial or financial relationships that could be construed as a potential conflict of interest.
Acknowledgments
I would like to thank Bo Barker Jørgensen and other members of the Center for Geomicrobiology for constructive discussions on the potential importance of acetogenesis in the subseafloor, and Bente Aa. Lomstein for helpful feedback regarding the chemistry of amino acids. This study was supported by the Danish National Research Foundation and the Max Planck Society (grants to Bo Barker Jørgensen), as well as a Marie Curie Intra-European Fellowship awarded to the author (# 255135).
References
Amend, J. P., and Helgeson, H. C. (1997). Calculation of the standard molal thermodynamic properties of aqueous biomolecules at elevated temperatures and pressures. Part 1 L-α-amino acids. J. Chem. Soc. Faraday Trans. 93, 1927–1941.
Amend, J. P., and Plyasunov, A. V. (2001). Carbohydrates in thermophile metabolism: calculation of the standard molar thermodynamic properties of aqueous pentoses and hexoses at elevated temperatures and pressures. Geochim. Cosmochim. Acta 65, 3901–3917.
Amend, J. P., and Shock, E. L. (2001). Energetics of overall metabolic reactions of thermophilic and hyperthermophilic archaea and bacteria. FEMS Microbiol. Rev. 25, 175–243.
Ansbaek, J., and Blackburn, T. H. (1979). A method for the analysis of acetate turnover in a coastal marine sediment. Microb. Ecol. 5, 253–264.
Avery, G. B., Shannon, R. D., White, J. R., Martens, C. S., and Alperin, M. J. (2002). Controls on methane production in a tidal freshwater estuary and a peatland: methane production via acetate fermentation and CO2 reduction. Biogeochemistry 62, 19–37.
Ballschmiter, K. (2003). Pattern and sources of naturally produced organohalogens in the marine environment: biogenic formation of organohalogens. Chemosphere 52, 313–324.
Berg, I., Kockelkorn, D., Ramos-Vera, H. G., Say, R. F., Zarzycki, J., Hügler, M., Alber, B. E., and Fuchs, G. (2010). Autotrophic carbon fixation in archaea. Nat. Rev. Microbiol. 10, 1–14.
Biddle, J. F., Lipp, J. S., Lever, M. A., Lloyd, K. G., Sørensen, K. B., Anderson, R., Fredricks, H. F., Elvert, M., Kelly, T. J., Schrag, D. P., Sogin, M. L., Brenchley, J. E., Teske, A., House, C. H., and Hinrichs, K.-U. (2006). Heterotrophic archaea dominate sedimentary subsurface ecosystems off Peru. Proc. Natl. Acad. Sci. U.S.A. 103, 3846–3851.
Canfield, D. E., Jørgensen, B. B., Fossing, H., Glud, R., Gundersen, J., Ramsing, N. B., Thamdrup, B., Hansen, J. W., Nielsen, L. P., and Hall, P. O. J. (1993). Pathways of organic carbon oxidation in three continental margin sediments. Mar. Geol. 113, 27–40.
Capone, D. G., and Kiene, R. P. (1988). Comparison of microbial dynamics in marine and freshwater sediments: contrasts in anaerobic carbon catabolism. Limnol. Oceanogr. 33, 725–749.
Cappenberg, T. E. (1974). Interrelations between sulfate-reducing and methane-producing bacteria in bottom deposits of a freshwater lake. 2. Inhibition experiments. Antonie Van Leeuwenhoek 56, 1247–1258.
Chapelle, F. H., and Bradley, P. M. (2007). Hydrologic significance of carbon monoxide concentrations in ground water. Ground Water 45, 272–280.
Chidhaisong, A., Rosenstock, B., and Conrad, R. (1999). Measurement of monosaccharides and conversion of glucose to acetate in anoxic rice field soil. Appl. Environ. Microbiol. 65, 2350–2355.
Cord-Ruwisch, R., Seitz, H.-J., and Conrad, R. (1988). The capacity of hydrogenotrophic anaerobic bacteria to compete for traces of hydrogen depends on the redox potential of the terminal electron acceptor. Arch. Microbiol. 149, 350–357.
Dalla-Betta, P., and Schulte, M. (2009). Calculation of the aqueous thermodynamic properties of citric acid cycle intermediates and precursors and the estimation of high temperature and pressure equation of state parameters. Int. J. Mol. Sci. 10, 2809–2837.
Dhillon, A., Lever, M., Lloyd, K. G., Albert, D. B., Sogin, M. L., and Teske, A. (2005). Methanogen diversity evidenced by molecular characterization of methyl coenzyme M reductase (mcrA) genes in hydrothermal sediments of the Guaymas Basin. Appl. Environ. Microbiol. 71, 4592–4601.
D’Hondt, S., Jørgensen, B. B., Miller, D. J., Batzke, A., Blake, R., Cragg, B. A., Cypionka, H., Dickens, G. R., Ferdelman, T., Hinrichs, K.-U., Holm, N. G., Mitterer, R., Spivack, A., Wang, G., Bekins, B., Engelen, B., Ford, K., Gettemy, G., Rutherford, S. D., Sass, H., Skilbeck, C. G., Aiello, I. W., Guèrin, G., House, C. H., Inagaki, F., Meister, P., Naehr, T., Niitsuma, S., Parkes, R. J., Schippers, A., Smith, D. C., Teske, A., Wiegel, J., Padilla, C. N., and Acosta, J. L. S. (2004). Distributions of microbial activities in deep subseafloor sediments. Science 306, 2216–2221.
D’Hondt, S., Spivack, A. J., Pockalny, R., Ferdelman, T. G., Fischer, J. P., Kallmeyer, J., Abrams, L. J., Smith, D. C., Graham, D., Hasiuk, F., Schrum, H., and Stancin, A. M. (2009). Subseafloor sedimentary life in the South Pacific Gyre. Proc. Nat. Acad. Sci. U.S.A. 106, 11651–11656.
Dolfing, J., Larter, S. R., and Head, I. M. (2008). Thermodynamic constraints on methanogenic crude oil biodegradation. ISME J. 2, 442–452.
Drake, H. L., Küsel, K., and Matthies, C. (2006). “Acetogenic prokaryotes,” in The Prokaryotes: An Evolving Electronic Resource for the Microbiological Community, eds M. Dworkin, S. Falkow, E. Rosenberg, K.-H. Schleifer, and E. Stackebrandt (New York: Springer), 354–420.
Dykhuizen, D., and Davies, M. (1980). An experimental model: bacterial specialists and generalists competing in chemostats. Ecology 61, 1213–1227.
Edenborn, H. M., and Litchfield, C. D. (1987). Glycolate turnover in the water column of the New York Bight apex. Mar. Biol. 95, 459–467.
Egli, T. (1995). The ecological and physiological significance of the growth of heterotrophic microorganisms with mixtures of substrates. Adv. Microb. Ecol. 14, 305–386.
Egli, T., Lendenmann, U., and Snozzi, M. (1993). Kinetics of microbial growth with mixtures of carbon sources. Antonie Van Leeuwenhoek 63, 289–298.
Expedition 329 Scientists. (2011). “South Pacific Gyre subseafloor life,” in Proceedings of Integrated Ocean Drilling Program, (College Station, TX: IODP), 1–108.
Ferry, J. G., and Lessner, D. J. (2008). Methanogenesis in marine sediments. Ann. N. Y. Acad. Sci. 1125, 147–157.
Finke, N., Vandieken, V., and Jørgensen, B. B. (2006). Acetate, lactate, propionate, and isobutyrate as electron donors for iron and sulfate reduction in Arctic marine sediments, Svalbard. FEMS Microbiol. Ecol. 59, 10–22.
Franklin, M. J., Wiebe, W. J., and Whitman, W. B. (1988). Populations of methanogenic bacteria in a Georgia salt marsh. Appl. Environ. Microbiol. 54, 1151–1157.
Froelich, P. N., Klinkhammer, G. P., Bender, M. L., Luedtke, N. A., Heath, G. R., Cullen, D., Dauphin, P., Hammond, D., Hartman, B., and Maynard, V. (1979). Early oxidation of organic matter in pelagic sediments of the eastern equatorial Atlantic: suboxic diagenesis. Geochim. Cosmochim. Acta 43, 1075–1090.
Fuchs, G., and Stupperich, E. (1985). “Evolution of autotrophic CO2 fixation,” in Evolution of Prokaryotes, eds K. H. Schleifer, and E. Stackebrandt (London: Academic Press), 235–251. [FEMS Symposium No. 29].
Fuhrman, J. A., and Ferguson, R. L. (1986). Nanomolar concentrations and rapid turnover of dissolved free amino acids in seawater: agreement between chemical and microbiological measurements. Mar. Ecol. Prog. Ser. 33, 237–242.
Gottschal, J. S., de Vries, S., and Kuenen, J. G. (1979). Competition between the facultatively chemolithotrophic Thiobacillus A2, and obligately chemolithotrophic Thiobacillus and a heterotrophic Spirillum for inorganic and organic substrates. Arch. Microbiol. 121, 241–249.
Griebler, C., and Lueders, T. (2008). Microbial diversity in groundwater ecosystems. Freshw. Biol. 54, 649–677.
Harder, J. (1997). Species-independent maintenance energy and natural population sizes. FEMS Microbiol. Ecol. 23, 39–44.
Hattori, S., Galushko, A. S., Kamagata, Y., and Schink, B. (2005). Operation of the CO dehydrogenase/acetyl coenzyme A pathway in both acetate oxidation and acetate formation by the syntrophically acetate-oxidizing bacterium Thermoacetogenium phaeum. J. Bacteriol. 187, 3471–3476.
Heimann, A., Jakobsen, R., and Blodau, C. (2010). Energetic constraints on H2-dependent terminal electron accepting processes in anoxic environments: a review of observations and model approaches. Environ. Sci. Technol. 44, 24–33.
Henstra, A. M., Dijkema, C., and Stams, A. J. M. (2007). Archaeoglobus fulgidus couples CO oxidation to sulfate reduction and acetogenesis with transient formate accumulation. Environ. Microbiol. 9, 1836–1841.
Heuer, V., Elvert, M., Tille, S., Krummen, M., Prieto Mollar, X., Hmelo, L. R., and Hinrichs, K.-U. (2006). Online δ13C analysis of volatile fatty acids in sediment/porewater systems by liquid chromatography-isotope ratio-mass spectrometry. Limnol. Oceanogr. Methods 4, 346–357.
Heuer, V. B., Pohlman, J. W., Torres, M. E., Elvert, M., and Hinrichs, K.-U. (2009). The stable carbon isotope biogeochemistry of acetate and other dissolved carbon species in deep subseafloor sediments at the northern Cascadia margin. Geochim. Cosmochim. Acta 73, 3323–3336.
Hoehler, T. M. (2004). Biological energy requirements as quantitative boundary conditions for life in the subsurface. Geobiology 2, 205–215.
Hoehler, T. M., Albert, D. B., Alperin, M. J., and Martens, C. S. (1999). Acetogenesis from CO2 in an anoxic marine sediment. Limnol. Oceanogr. 44, 662–667.
Hoehler, T. M., Alperin, M. J., Albert, D. B., and Martens, C. S. (1998). Thermodynamic control on hydrogen concentrations in anoxic sediments. Geochim. Cosmochim. Acta 62, 1745–1756.
Hoehler, T. M., Alperin, M. J., Albert, D. B., and Martens, C. S. (2001). Apparent minimum free energy requirements for methanogenic archaea and sulfate-reducing bacteria in an anoxic marine sediment. FEMS Microbiol. Ecol. 38, 33–41.
Hügler, M., and Sievert, S. M. (2011). Beyond the Calvin Cycle: autotrophic carbon fixation in the ocean. Ann. Rev. Mar. Sci. 3, 261–289.
Jansen, K., Thauer, R. K., Widdel, F., and Fuchs, G. (1984). Carbon assimilation pathways in sulfate reducing bacteria. Formate, carbon dioxide, carbon monoxide, and acetate assimilation by Desulfovibrio baarsii. Arch. Microbiol. 138, 257–262.
Jetten, M. S. M., Stams, A. J. M., and Zehnder, A. J. B. (1992). Methanogenesis from acetate: a comparison of the acetate metabolism in Methanothrix soehngenii and Methanosarcina spp. FEMS Microbiol. Rev. 88, 181–198.
Jiang, N., Wang, Y., and Dong, X. (2010). Methanol as the primary methanogenic and acetogenic precursor in the cold Zoige wetland at Tibetan plateau. Microb. Ecol. 60, 206–213.
Jørgensen, B. B., D’Hondt, S. L., and Miller, D. J. (2006). “Leg 201 synthesis: controls on microbial communities in deeply buried sediments,” in Proceedings Ocean Drilling Program Science Results, eds B. B. Jørgensen, S. L. D’Hondt, and D. J. Miller (College Station, TX: ODP), 201, 1–45.
Kaiser, J.-P., and Hanselmann, K. W. (1982). Fermentative metabolism of substituted monoaromatic compounds by a bacterial community from anaerobic sediments. Arch. Microbiol. 133, 185–194.
Karita, S., Nakayama, K., Goto, M., Sakka, K., Kim, W.-J., and Ogawa, S. (2003). A novel cellulolytic, anaerobic, and thermophilic bacterium, Moorella sp. strain F21. Biosci. Biotechnol. Biochem. 67, 183–185.
Keppler, F., Eiden, R., Niedan, V., Pracht, J., and Schöler, H. F. (2000). Halocarbons produced by natural oxidation processes during degradation of organic matter. Nature 203, 298–301.
King, G. M. (1988). Dehalogenation in marine sediments containing natural sources of halophenols. Appl. Environ. Microbiol. 54, 3079–3085.
King, G. M. (2007). Carbon monoxide consumption in salt marsh sediments. FEMS Microbiol. Ecol. 59, 2–9.
King, G. M., Klug, M. J., and Lovley, D. R. (1982). Glucose metabolism in sediments of a eutrophic lake: tracer analysis of uptake and product formation. Appl. Environ. Microbiol. 44, 1308–1317.
King, G. M., Klug, M. J., and Lovley, D. R. (1983). Metabolism of acetate, methanol, and methylated amines in intertidal sediments of Lowes Cove, Maine. Appl. Environ. Microbiol. 45, 1848–1853.
Kuenen, J. G. (1983). “The role of specialists and generalists in microbial population interactions,” chapter 10 in Foundations of Biochemical Engineering, eds H. W. Blanch, E. T. Papoutsakis, and G. Stephanopoulos (Washington, DC: ACS Publications), 229–251.
Küsel, K., Pinkart, H. C., Drake, H., and Devereux, R. (1999). Acetogenic and sulfate-reducing bacteria inhabiting the rhizoplane and deep cortex cells of the sea grass Halodule wrightii. Appl. Environ. Microbiol. 65, 5117–5123.
Lessner, D. J., Li, L., Li, Q., Rejtar, T., Andreev, V. P., Reichlen, M., Hill, K., Moran, J. J., Karger, B. L., and Ferry, J. G. (2006). An unconventional pathway for reduction of CO2 to methane in CO-grown Methanosarcina acetivorans revealed by proteomics. Proc. Natl. Acad. Sci. U.S.A. 103, 17921–17926.
Lever, M. A., Heuer, V. B., Morono, Y., Masui, N., Schmidt, F., Alperin, M. J., Inagaki, F., Hinrichs, K.-U., and Teske, A. (2010). Acetogenesis in deep subseafloor sediments of the Juan de Fuca Ridge Flank: a synthesis of geochemical, thermodynamic, and gene-based evidence. Geomicrobiol. J. 27, 183–211.
Lin, Y. S., Heuer, V. B., Ferdelman, T. G., and Hinrichs, K.-U. (2010). Microbial conversion of inorganic carbon to dimethylsulfide in anoxic lake sediment (Plußsee, Germany). Biogeosciences 7, 2433–2444.
Lin, Y. S., Heuer, V. B., Goldhammer, T., Kellermann, M. Y., Zabel, M., and Hinrichs, K.-U. (2011). Towards constraining H2 concentration in subseafloor sediment: a proposal for combined analysis by two distinct approaches. Geochim. Cosmochim. Acta 77, 186–201.
Liu, F., and Conrad, R. (2011). Chemolithotrophic acetogenic H2/CO2 utilization in Italian rice field soil. ISME J. 5, 1526–1539.
Liu, S., and Suflita, J. M. (1993). H2-CO2-dependent anaerobic O-demethylation activity in subsurface sediments and by an isolated bacterium. Appl. Environ. Microbiol. 59, 1325–1331.
Liu, Y., and Whitman, W. B. (2008). Metabolic, phylogenetic, and ecological diversity of the methanogenic archaea. Ann. N. Y. Acad. Sci. 1125, 171–189.
Lorenson, T. D., Colwell, F. S., Delwiche, M., and Dougherty, J. A. (2006). “17. Data report: acetate and hydrogen concentrations in pore fluids associated with a large gas hydrate reservoir, southern hydrate ridge, offshore Oregon, USA,” in Proceedings of Ocean Drilling Program Scientific Results 204, eds A. M. Tréhu, G. Bohrmann, M. E. Torres, and F. S. Colwell (College Station, TX: IODP), 1–20.
Lovley, D. R., and Goodwin, S. (1988). Hydrogen concentrations as an indicator of the terminal electron-accepting reactions in aquatic sediments. Geochim. Cosmochim. Acta 52, 2993–3003.
Martens, C. S. (1990). Generation of short chain organic acid anions in hydrothermally altered sediments of the Guaymas Basin, Gulf of California. Appl. Geochem. 5, 71–76.
Martin, W., and Russell, M. J. (2007). On the origin of biochemistry at an alkaline hydrothermal vent. Philos. Trans. R. Soc. Lond. B Biol. Sci. 362, 1887–1925.
Millero, F. J., and Schreiber, D. R. (1982). Use of the ion pairing model to estimate activity coefficients of the ionic components of natural waters. Am. J. Sci. 282, 1508–1540.
Mitterer, R. M. (2006). “12. Data report: D/L ratios and concentrations of selected amino acids in interstitial waters, Equatorial Pacific and Peru Margin, ODP Leg 201,” in Controls on Microbial Communities in Deeply Buried Sediments, Eastern Equatorial Pacific and Peru Margin Sites, eds B. B. Jørgensen, S. L. D’Hondt, and D. J. Miller (College Station, TX: ODP), 1–7.
Mitterer, R. M., Malone, M. J., Goodfriend, G. A., Swart, P. K., Wortmann, U. G., Logan, G. A., Feary, D. A., and Hine, A. C. (2001). Co-generation of hydrogen sulfide and methane in marine carbonate sediments. Geophys. Res. Lett. 28, 3931–3934.
Mörsdorf, G., Frunzke, K., Gadkari, D., and Meyer, O. (1992). Microbial growth on carbon monoxide. Biodegradation 3, 61–82.
Oelkers, E. H., Helgeson, H. C., Shock, E. L., Sverjensky, D. A., Johnson, J. W., and Pokrovskii, V. A. (1995). Summary of the apparent standard molal Gibbs free energies of formation of aqeous species, minerals, and gases at pressures 1 to 5000 bars and temperatures 5 to 1000°C. J. Phys. Chem. Ref. Data 24, 1401–1560.
Parkes, R. J., Gibson, G. R., Mueller-Harvey, I., Buckingham, W. J., and Herbert, R. A. (1989). Determination of the substrates for sulphate-reducing bacteria within marine and estuarine sediments with different rates of sulphate reduction. J. Gen. Microbiol. 135, 175–187.
Pedersen, K., Arlinger, J., Eriksson, S., Hallbeck, A., Hallbeck, L., and Johansson, J. (2008). Numbers, biomass and cultivable diversity of microbial populations related to depth and borehole-specific conditions in groundwater from depths of 4-450 m in Olkiluoto, Finland. ISME J. 2, 760–775.
Peretó, J., Lopez-Garcia, P., and Moreira, D. (2004). Ancestral lipid biosynthesis and early membrane evolution. Trends Biochem. Sci. 29, 469–477.
Phelps, T. J., and Zeikus, J. G. (1984). Influence of pH on terminal carbon metabolism in anoxic sediments from a mildly acidic lake. Appl. Environ. Microbiol. 48, 1088–1095.
Pianka, E. R. (1994). Evolutionary Ecology, 5th Edn. New York: HarperCollins College Publishers, 486.
Pilson, M. E. Q. (1998). An introduction to the Chemistry of the Sea. Upper Saddle River, NJ: Prentice-Hall, Inc.
Price, P. B., and Sowers, T. (2004). Temperature dependence of metabolic rates for microbial growth, maintenance, and survival. Proc. Natl. Acad. Sci. U.S.A. 101, 4631–4636.
Rabus, R., Hansen, T. A., and Widdel, F. (2006). “Dissimilatory sulfate- and sulfur- reducing prokaryotes”, in The Prokaryotes: An Evolving Electronic Resource for the Microbiological Community, eds M. Dworkin, S. Falkow, E. Rosenberg, K.-H. Schleifer, and E. Stackebrandt (New York: Springer), 659–768.
Rother, M., and Metcalf, W. W. (2004). Anaerobic growth of Methanosarcina acetivorans C2A on carbon monoxide: an unusual way of life for a methanogenic archaeon. Proc. Natl. Acad. Sci. U.S.A. 101, 16929–16934.
Russell, M. J., and Martin, W. (2004). The rocky roots of the acetyl-CoA pathway. Trends Biochem. Sci. 29, 358–363.
Schauder, R., Preuß, A., Jetten, M., and Fuchs, G. (1989). Oxidative and reductive acetyl CoA/ carbon monoxide dehydrogenase pathway in Desulfobacterium autotrophicum. Arch. Microbiol. 151, 84–89.
Shipboard Scientific Party. (2003). “Controls on microbial communities in deeply buried sediments, Eastern Equatorial Pacific and Peru Margin sites 1225–1231,” in Proceedings Of Ocean Drilling Program Initial Reports. 201, eds S. L. D’Hondt, B. B. Jørgensen, D. J. Miller, . (College Station, TX: ODP). Available at: http://www-odp.tamu.edu/publications/201_IR/201ir.htm
Shock, E. L. (1995). Organic acids in hydrothermal solutions: standard molal thermodynamic properties of carboxylic acids, and estimates of dissociation constants at high temperatures and pressures. Am. J. Sci. 295, 496–580.
Shock, E. L., and Helgeson, H. C. (1988). Calculation of the thermodynamic and transport-properties of aqueous species at high-pressures and temperatures–correlation algorithms for ionic species and equation of state predictions to 5-kb and 1000°C. Geochim. Cosmochim. Acta 52, 2009–2036.
Shock, E. L., and Helgeson, H. C. (1990). Calculation of the thermodynamic and transport properties of aqueous species at high pressures and temperatures: standard partial molal properties of organic species. Geochim. Cosmochim. Acta 54, 915–945.
Shock, E. L., Sassani, D. C., Willis, M., and Sverjensky, D. A. (1997). Inorganic species in geologic fluids: correlations among standard molal thermodynamic properties of aqueous ions and hydroxide complexes. Geochim. Cosmochim. Acta 61, 907–950.
Smith, R. L., and Oremland, R. S. (1983). Anaerobic oxalate degradation: widespread natural occurrence in aquatic sediments. Appl. Environ. Microbiol. 46, 106–113.
Smith, R. L., Strohmaier, F. E., and Oremland, R. S. (1985). Isolation of anaerobic oxalate-degrading bacteria from freshwater lake sediments. Arch. Microbiol. 141, 8–13.
Sørensen, J., Christensen, D., and Jørgensen, B. B. (1981). Volatile fatty acids and hydro-gen as substrates for sulfate-reducing bacteria in anaerobic marine sediment. Appl. Environ. Microbiol. 42, 5–90.
Spormann, A. M., and Thauer, R. K. (1988). Anaerobic acetate oxidation to CO2 by Desulfotomaculum acetoxidans. Arch. Microbiol. 150, 374–380.
Stolper, D. A., Revsbech, N. P., and Canfield, D. E. (2010). Aerobic growth at nanomolar oxygen concentrations. Proc. Nat. Acad. Sci. U.S.A. 107, 18755–18760.
Strous, M., Pelletier, E., Mangenot, S., Rattei, T., Lehner, A., Taylor, M. W., Horn, M., Daims, H., Bartol-Mavel, D., Wincker, P., Barbe, V., Fonknechten, N., Vallenet, D., Segurens, B., Schenowitz-Truong, C., Médigue, C., Collingro, A., Snel, B., Dutilh, B. E., Op den Camp, H. J. M., van der Drift, C., Cirpus, I., van de Pas- Schoonen, K. T., Harhangi, H. R., van Niftrik, L., Schmid, M., Keltjens, J., van de Vossenberg, J., Kartal, B., Meier, H., Frishman, D., Huynen, M. A., Mewes, H.-W., Weissenbach, J., Jetten, M. S. M., Wagner, M., and Le Paslier, D. (2006). Deciphering the evolution and metabolism of an anammox bacterium from a community genome. Nature 440, 790–794.
Stumm, W., and Morgan, J. J. (1981). Aquatic Chemistry. An Introduction Emphasizing Chemical Equilibria in Natural Waters, 3rd Edn. New York: John Wiley & Sons, 1022.
Takai, K., Nakamura, K., Toki, T., Tsunogai, U., Miyazaki, M., Miyazaki, J., Hirayama, H., Nakagawa, S., Nunoura, T., and Horikoshi, K. (2008). Cell proliferation at 122°C and isotopically heavy CH4 production by a hyperthermophilic methanogen under high-pressure cultivation. Proc. Natl. Acad. Sci. U.S.A. 105, 10949–10954.
Tewari, Y. B., Lang, B. E., Decker, S. R., and Goldberg, R. N. (2008). Thermodynamics of the hydrolysis reactions of 1,4-β-D-xylobiose, 1,4-β-D-xylotriose, D-cellobiose, and D-maltose. J. Chem. Thermodyn. 40, 1517–1526.
Tijhuis, L., van Loosdrecht, M. C. M., and Heijnen, J. J. (1993). A thermodynamically based correlation for maintenance Gibbs energy requirements in aerobic and anaerobic microbial growth. Biotechnol. Bioeng. 42, 509–519.
Valentine, D. L. (2001). “Thermodynamic ecology of hydrogen-based syntrophy,” in Cellular Origin, Life in Extreme Habitats and Astrobiology, Chap. 192. NewYork: Springer.
Wagman, D. D., Evans, W. H., Parker, V. B., Schumm, R. H., Halow, I., Bailey, S. M., Churney, K. L., and Nuttall, R. L. (1982). The NBS tables of chemical thermodynamic properties: selected values for inorganic and C1 and C2 organic substances in SI units. J. Phys. Chem. Ref. Data 11, 392.
Wang, G. Z., Spivack, A. J., Rutherford, S., Manor, U., and D’Hondt, S. (2008). Quantification of co-occurring reaction rates in deep subseafloor sediments. Geochim. Cosmochim. Acta 72, 3479–3488.
Whitman, W. B., Bowen, T. L., and Boone, D. R. (2006). “The methanogenic bacteria,” in The Prokaryotes: An Evolving Electronic Resource for the Microbiological Community, eds M. Dworkin, S. Falkow, E. Rosenberg, K. H. Schleifer, and E. Stackebrandt (New York: Springer), 165–207.
Whitman, W. B., Coleman, D. C., and Wiebe, W. J. (1998). Prokaryotes: the unseen majority. Proc. Nat. Acad. Sci. U.S.A. 95, 6578–6583.
Wolin, M. J., and Miller, T. L. (1994). “Acetogenesis from CO2 in the human colonic ecosystem,” in Acetogenesis, ed. H. L. Drake (New York: Chapman and Hall), 365–385.
Wolin, M. J., Miller, T. L., Collins, M. D., and Lawson, P. A. (2003). Formate-dependent growth and homoacetogenic fermentation by a bacterium from human feces: description of Bryantella formatexigens gen. nov., sp. nov. Appl. Environ. Microbiol. 69, 6321–6326.
Keywords: acetogenesis, deep biosphere, subsurface, marine, energy, sediment, carbon cycling, starvation survival
Citation: Lever MA (2012) Acetogenesis in the energy-starved deep biosphere – a paradox? Front. Microbio. 2:284. doi: 10.3389/fmicb.2011.00284
Received: 15 November 2011; Paper pending published: 19 December 2011;
Accepted: 31 December 2011; Published online: 13 January 2012.
Edited by:
Andreas Teske, University of North Carolina at Chapel Hill, USAReviewed by:
Matthew Schrenk, East Carolina University, USAAharon Oren, The Hebrew University of Jerusalem, Israel
Copyright: © 2012 Lever. This is an open-access article distributed under the terms of the Creative Commons Attribution Non Commercial License, which permits non-commercial use, distribution, and reproduction in other forums, provided the original authors and source are credited.
*Correspondence: Mark Alexander Lever, Department of Bioscience, Center for Geomicrobiology, Aarhus University, Ny Munkegade 114, bng 1535-1540, DK-8000 Århus C, Denmark. e-mail:bWFyay5sZXZlckBiaW9sb2d5LmF1LmRr