


- 1 Department of Earth Sciences, University of Salamanca, Salamanca, Spain
- 2 Department of Earth Sciences, Center for Urban Health, Indiana University–Purdue University Indianapolis, Indianapolis, IN, USA
- 3 Department of Earth and Environmental Systems, Indiana State University, Terre Haute, IN, USA
Paleoproductivity is a critical component in past ocean biogeochemistry, but accurate reconstructions of productivity are often hindered by limited integration of proxies. Here, we integrate geochemical (phosphorus) and micropaleontological proxies at millennial timescales, revealing that the coccolithophore record in the Subantarctic zone of the South Atlantic Ocean is driven largely by variations in marine phosphorus availability. A quantitative micropaleontological and geochemical analysis carried out in sediments retrieved from Ocean Drilling Program Site 1089 (Subantarctic Zone) reveals that most of the export productivity in this region over the last 0.5 my was due to coccolithophores. Glacial periods were generally intervals of high productivity, with productivity reaching a peak at terminations. Particularly high productivity was observed at Termination V and Termination IV, events that are characterized by high abundance of coccolithophores and maxima in the phosphorus/titanium and strontium/titanium records. We link the increase in productivity both to regional oceanographic phenomena, i.e., the northward displacement of the upwelling cell of the Antarctic divergence when the ice-sheet expanded, and to the increase in the inventory of phosphorus in the ocean due to enhanced transfer of this nutrient from continental margins during glacial lowstands in sea level. The Mid-Brunhes interval stands out from the rest of the record, being dominated by the small and highly calcified species Gephyrocapsa caribbeanica that provides most of the carbonate in these sediments. This likely represents higher availability of phosphorus in the surface ocean, especially in mesotrophic and oligotrophic zones. Under these condition, some coccolithophore species developed an r-strategy (opportunistic species; growth rate maximized) resulting in the bloom of G. caribbeanica. These seasonal blooms of may have induced “white tides” similar to those observed today in Emiliania huxleyi.
Introduction and Objectives
Reconstructing the players and the drivers of past oceanic productivity is critical for understanding the role that nutrients and nutrient cycling, ecological structure, and temperature play in past, and perhaps future, oceans. The fidelity of the reconstruction, however, is only as strong as the record and the proxies used for this reconstruction. Some key components are not well-reflected or well-understand (e.g., Filippelli et al., 2007), including the role of the past global phosphorus cycle on biological productivity and the history and distribution of coccolithophores, a ubiquitous group in modern and past oceans but one whose relevance to paleoceanographic reconstructions has been under-appreciated (e.g., Flores et al., 2003). This contribution hopes to address both of these issues by comparing proxies for the marine phosphorus cycle with coccolithophore assemblage data through time in the critical Southern Ocean (SO), a region critical on glacial/interglacial timescales as a key biological pump of carbon.
Coccolithophores are a fundamental component of oceanic primary production. Variability in the assemblages and abundances are linked to changes in environmental parameters such as temperature, salinity, luminosity, and nutrient content (Young, 1994). Given this, sedimentary records of these organisms have been used to reconstruct temperature or salinity (e.g., Winter et al., 1994). Intriguingly, although modern blooms of some coccolithophore taxa have been documented on the ground and by satellite (Figure 1), coccolithophores are not frequently used to reconstruct paleoproductivity and related upwelling environments. For low latitude settings, transfer functions based on the Florisphaera profunda record versus other species are used to monitor the nutricline/thermocline variability (Molfino and McIntyre, 1990; Ahagon et al., 1993; Flores et al., 1999) or to provide productivity values to model environmental evolution (Beaufort et al., 1997, 2001). However, in high latitudes, the absence of species like F. profunda preclude the use of some of these techniques, and the most common micropaleontological proxy used to reconstruct paleoproductivity are siliceous organisms (mainly diatoms). In mesotrophic and oligotrophic environments, the presence of diatoms is restricted, and coccolithophores are the dominant mineralized organisms. Some of the nutrients used for these organisms are incorporated into the skeleton, and/or are incorporated into related organic matter and thus into the sediments (e.g., phosphorus, barium, and strontium). The geochemical record of these nutrient and nutrient-related elements in sediments has been used as a paleoproductivity indicator (Latimer and Filippelli, 2001; Filippelli et al., 2007). In particular, the relationship between the nutrient element P and coccolithophore production, and the coccolithophore productivity-associated co-mineralizing element Sr and coccolithophore production, is important and has not been addressed in the past. A comparison between these compounds and the coccolithophore assemblage can help to understand the relationship between these primary producers and surface ocean dynamics, as well as to hypothesize about provenance and sedimentation dynamics.
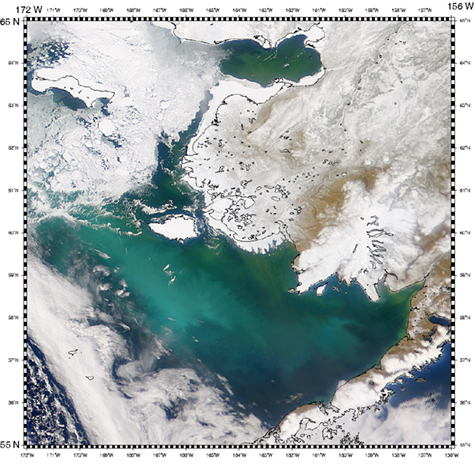
Figure 1. Coccolithophore bloom in the Bering Sea. SeaWiFS image acquired April 29, 2000 (Image courtesy SeaWiFS Project).
The South Atlantic and SO are mesotrophic regions where the amount of coccolithophores is particularly high (Flores et al., 2003; Baumann and Freitag, 2004; Figure 2). Biological productivity in this region is a large component of the ocean’s carbon pump (Hodell et al., 2001); however, determining the history of productivity on glacial timescales has proven difficult due largely to disagreements between individual productivity proxies (Charles et al., 1991; Mortlock et al., 1991; Kumar et al., 1995; Francois et al., 1997; Asmus et al., 1999; Elderfield and Rickaby, 2000; Ikehara et al., 2000; Latimer and Filippelli, 2001). Here, we carried out a comparative study between coccolithophores and some nutrient proxies in the Subantarctic region in the Atlantic Ocean in order to reconstruct the paleoceanographic conditions related to paleoproductivity and nannofossil assemblage records for the last 500 kyr.
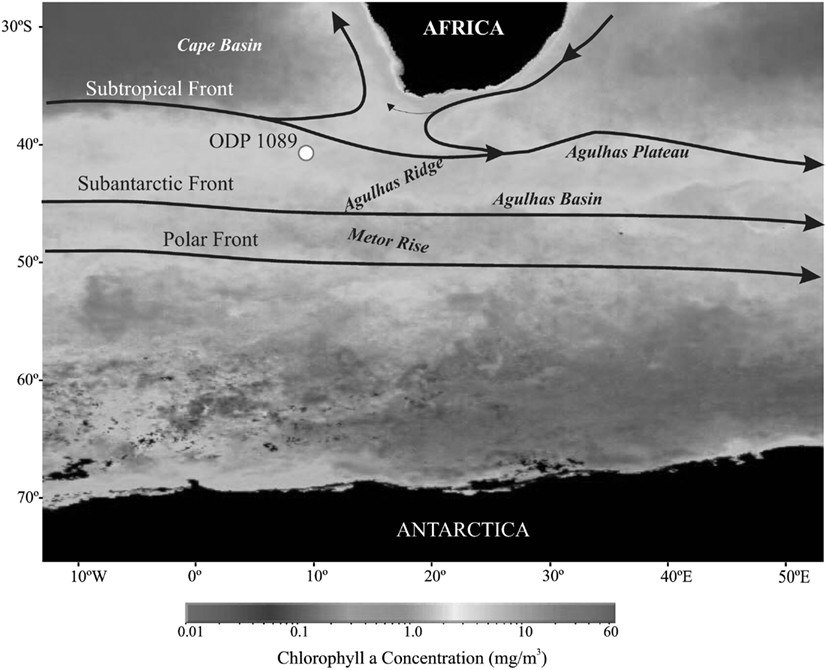
Figure 2. Location of ODP Site 1089 used in this study and main oceanographic features versus the concentration in Chlorophyll a, indicating productivity in the region (courtesy SeaWiFS Project). Arrows depict the surface ocean circulation pattern (after Peterson and Stramma, 1991). Distal warm filaments from the Agulhas Current retroflection may reach as far as the core location (Lutjeharms, 1996).
Site Location and Oceanographic Settings
We analyzed material from Ocean Drilling Program (ODP) Site 1089 situated in the southern Cape Basin off Southwest Africa, just north of the Agulhas Ridge (40°56.2′S, 9°53.6′E), recovered at a water depth of 4620 m (Figure 2). ODP Site 1089 is located on a sediment drift and is characterized by high sedimentation rates, averaging ∼15 cm/kyr during the Pleistocene (Shipboard Scientific Party, 1999) with a continuous sedimentary record for the latest Pleistocene (Hodell et al., 2001).
Ocean drilling program Site 1089 is located in Subantarctic waters, south of the modern position of the Subtropical Front (STF), and north of the Subantarctic Front (SAF; Peterson and Stramma, 1991; Figure 2). Currently, a marked drop in temperature, from 14.2°C north of the STF (Lutjeharms and Valentine, 1984) to 8.4°C south of the STF (Lutjeharms, 1981) can be observed. The area between the STF and SAF is defined as the Subantarctic Zone (SAZ), and is characterized by average surface water temperatures of 6.7°C, salinities of 34.2‰, and surface water oxygen concentrations of 6.63 ml/l (Lutjeharms, 1981).
Deep water in the Cape Basin consists mainly of Circumpolar Deep Water (CDW) which enters the basin from the south (temperature = 0.7°C, salinity = 34.68‰, oxygen concentration = 4.2 ml/l, and silica concentration = 125 μM; Reid et al., 1977; Mantyla and Reid, 1983). CDW can be distinguished from the North Atlantic Deep Water (NADW) in this region by the low concentrations of dissolved silica of NADW (about 12 μM; Orsi et al., 1995). The saturation horizon associated with the boundary between NADW and CDW is located at ca. 4000-m water depth. Carbonate saturation in the Cape Basin decreases with depth conversely to an increase in the content of dissolved silica (Hodell et al., 2001).
Materials and Methods
Stratigraphy
Age assignments are based on Hodell et al. (2001, 2002). These authors describe a high-resolution oxygen isotope record correlated to the SPECMAP timescales of Martinson et al. (1987) and Imbrie et al., 1984; Figure 3). Sample ages in our study were obtained by linear interpolation of composite depths (Shipboard Scientific Party, 1999).
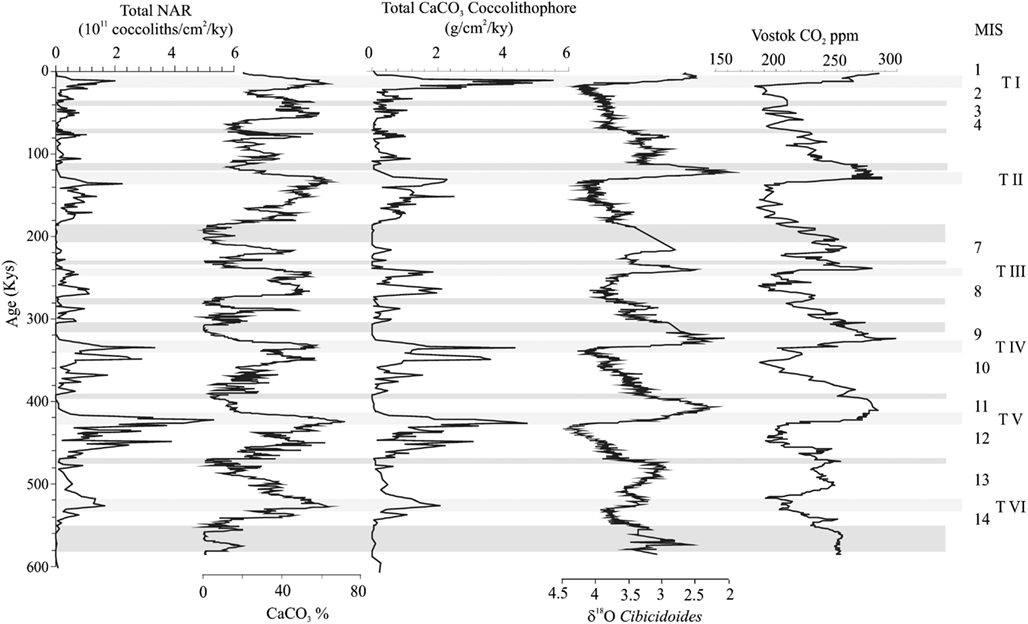
Figure 3. NAR (total nannofossil accumulation rate), calcium carbonate percentages (Hodell et al., 2001), estimation of the calcium carbonate provide by coccolithophores versus δ18O (Hodell et al., 2001) at ODP Site 1089; shown also is the CO2 content in the Vostok ice-core (Siegenthaler et al., 2005). Shaded bands represent high dissolution intervals. MIS, marine isotope stage; T I–T VI, terminations I–VI.
Coccolith Preparation and Estimation of Absolute Abundance
Coccolith slides were prepared using the technique of Flores and Sierro (1997). A total of 296 samples were analyzed with a sample interval of 25 cm yielding an average age resolution of 2.0 kyr resolution. Coccolithophore analyses were made at 1250× magnification using a polarized light microscope. Coccolith counts were performed in random visual fields on slides on which the coccoliths were homogeneously distributed. For each slide, a predetermined mass of sediment was taken. This procedure allows calculation of the number of coccoliths per gram of sediment. Nannofossil accumulation rates (NAR; coccoliths cm−2 ky−1) were calculated following the procedure described in Mayer et al. (1992): the number of coccoliths per gram was multiplied by the dry density and the linear sedimentation rate. Bulk densities were taken from the report given by the Shipboard Scientific Party (1999), and linear sedimentation rates were calculated using the oxygen isotope stratigraphy of Hodell et al. (2001, 2002). In addition, relative coccolith abundances of some species were also calculated and compared with fluctuations in NAR.
To obtain relative abundances, about 300 coccoliths larger than 3 μm were counted per slide in a varying number of fields of view. Coccoliths smaller than 3 μm were counted separately in the same number of fields of view. Rare species were counted in additional fields of view. In addition, routine Scanning Electron Microscope (SEM) analyses were performed to evaluate the preservation of calcareous nannofossils in selected samples.
Dissolution Pattern
For the studied interval, Hodell et al. (2001, 2002, 2003) and Flores et al. (2003) have recorded a detailed pattern of dissolution. In these papers, the authors thoroughly examine fragmentation indexes as well their significance for nannofossil accumulation rate interpretations, from the same oceanic locations as presented in this paper. Essentially, episodes of high dissolution occur at the end of interglacials. Although CaCO3 reaches high values during terminations (especially during Terminations IV and V), an increase in planktonic foraminifer fragmentation index and lower preservation in coccoliths is observed, also supporting dissolution. A number of studies support the correlation between CaCO3 and productivity, citing that the carbonate is mostly due to coccolithophores (Flores et al., 2003; Moreno et al., 2005). Additionally, in this region coccolithophores are the only mineralized primary producer, and the signal is interpreted to be in parallel to the bulk past primary productivity (e.g., Rodrigues et al., 2009; Hernández-Almeida et al., 2011).
Geochemistry
A total of 445 samples were analyzed for geochemistry, with an average sample interval of 20 cm yielding an average age resolution of 1.14 kyr resolution. Geochemical analysis involved complete sediment digestions using microwave assisted strong acid digestion followed by determination of elemental concentrations on sample dilutions using Inductively Coupled Plasma Atomic Emission Spectrometry (Latimer and Filippelli, 2003). The focus here will be on the ratio of P to titanium (P/Ti) and barium to titanium (Ba/Ti). Both Ti and aluminum (Al) content in sediments are used to constrain terrigenous matter input, although some research (Dymond et al., 1997; Averyt and Paytan, 2004) indicates that the particle-reactive nature of Al and its incorporation into opaline diatom tests makes Ti a better estimate of terrigenous input alone. Phosphorus is a key limiting nutrient for biological productivity in the ocean, and supply of this nutrient is likely the dominant factor controlling biological productivity on geologic timescales (Tyrell, 1999). Barium is associated with organic matter and the flux of biogenic Ba to the seafloor is a useful, although not perfect, indicator of surface productivity (e.g., Eagle et al., 2003). The Ti concentration is well correlated to terrigenous input at this site (Kuhn and Diekmann, 2002; Latimer and Filippelli, 2003), and thus normalizing P, the limiting nutrient proxy, and Ba, the organic matter flux proxy, to Ti yields a geochemical record of productivity free of biases due to sediment dilution/enrichment and sedimentation rate issues (and as reported earlier the temporal trends do not change when normalized to Al; Latimer and Filippelli, 2003).
Nutrient Lag Model
The redistribution of phosphorus from continental margins to the deep sea during glacial lowstands, and the subsequent deep sea response to this increased phosphorus loading, was simplistically modeled to a first-order by using the sea level curve to estimate continental margin sink loss (see Filippelli et al., 2007, for complete details). A simple but illustrative exercise involves examining several delay intervals between sea level state and the net impact on nutrient mass balances. The premise is that the transfer of nutrients from the continental shelf sink will start immediately upon a sea level drop associated with glaciation, but the net impact on the phosphorus deep sea mass balance will be delayed in accordance with the oceanic response time of phosphorus (current estimates for the phosphorus residence time in the ocean are 10–20 kyr; Filippelli et al., 2007). The inherent assumption here is that phosphorus burial is controlled only by internal reorganization of burial sinks within the mass balance. This assumption is not likely quantitatively robust given the potential for changes in terrigenous weathering and input of phosphorus (e.g., Filippelli et al., 2007), but this would have a temporal pattern similar to that of the model assumption, and thus likely have an additive effect.
In this model exercise, sea level variation was derived from the composite oxygen isotopic record from ODP Site 846 in the Eastern Equatorial Pacific (a global reference site; Raymo et al., 2004). The inverse of the sea level curve is used to predict the shift of nutrients from the continental margin to the deep sea sink. A response time lag of 20 kyr was used to factor in the phosphorus residence time. The nannofossil accumulation rate record was then plotted as a function of time.
Results and Discussion
Coccolith Record and Productivity
Primary productivity of phytoplankton modulates Earth’s climate system and the partitioning of CO2 between atmosphere and ocean (Broecker, 1982; Rühlemann et al., 1999). Episodes of increased export productivity can be used to monitor changes in surface water masses, their relationship with general thermohaline circulation, the chemistry and flux of upwelled water masses, and the location of frontal systems. In general terms, coccolithophores have their optimum development (even as dominant of the phytoplankton) in mesotrophic/oligotrophic environments. Under eutrophic conditions, coccolithophore production is also high, but is often masked by the mass of other primary producers such as diatoms; these blooms are ordered in time following temporal patterns of ecological succession (Margalef, 1978; Balch, 2004). A “complete” micropaleontological proxy for paleoproductivity should include as much as possible, although preservation factors and technical factors often preclude a complete analysis. In mid-latitude environments the aforementioned succession is mainly linked to the availability of nutrients, sometimes related to mixing in the upper layers of the water column (Balch, 2004). In most of these environments the abundance of coccolithophores controls carbonate production together with planktonic foraminifers (and in minor proportion pteropods and calcareous dinoflagellates). Thus, it is important to connect calcium carbonate production with total primary productivity. Several authors have correlated the calcium carbonate record to paleoproductivity (Rühlemann et al., 1999; Moreno et al., 2002). From this perspective and given the longer-term nature of the record we study here, peaks in coccolithophore accumulation of coccolithophores must be related to increases in general primary productivity. The accumulation of coccolithophores is mainly controlled by three processes: production, dissolution (including alteration during settling), and dilution. The abundance of coccolithophores in the present day and fossil records is higher in eutrophic areas than that in oligotrophic areas (Kleijne et al., 1989; Flores et al., 1995; Giraudeau and Bailey, 1995); consequently, coccolith concentrations in the sediments may be the result of high coccolithophore productivity in surface waters, low coccolith dissolution in water, or at the sediment/water interface, or both. Conversely, low coccolith accumulation may result from low surface water productivity or high dissolution. Dilution, both from organic (e.g., diatoms) and terrigenous material, can obscure the coccolith signal, and only an accurate estimation of accumulation rates can help to solve the problem.
The region studied here is currently a mesotrophic area with moderate primary production. Coccolithophores are important primary producers, and their abundance is linked to nutrient availability (Baumann et al., 1999). According to Baumann and Freitag (2004), maximum production of coccolithophores in the SO occurs in the subtropical gyre and in the Benguela upwelling system, and minimum values in the equatorial Atlantic. For the interval investigated at ODP Site 1089, calcareous nannofossils are the dominant component of the carbonate fraction (Shipboard Scientific Party, 1999; Kuhn and Diekmann, 2002; Flores et al., 2003). However, there are other contributors to total primary production, including those conducive to fossilization (such as diatoms), and those that are not well-preserved in the sediment because of the lack of a mineral skeleton (e.g., bacteria). Additionally, any increase in CaCO3 production in the photic zone releases CO2, favoring dissolution at this level, and counteracting the organic pump effect (sinking of organic matter); although in the deep ocean the solubility of CaCO3 reduces the partial pressure of CO2. As the main CaCO3 producer in the Subantarctic region, it is crucial to differentiate the coccolithophore signal in order to interpret export productivity.
In the interval studied at ODP Site 1089, the highest coccolithophore accumulation and the highest calcium carbonate content occurred during glacial periods and near terminations, whereas minimum values are recorded in interglacial stages (Figure 3). Flores et al. (2003) discussed the meaning of the total abundance of coccoliths versus carbonate, concluding that, although dissolution in an important feature, the general trend is related to the production of coccolithophores, directly correlated to export productivity in the region. A comparison with geochemical data shows some correspondence with some elements and/or ratios, providing new arguments to interpret the coccolithophore signal. A comparison with other paleoproductivity proxies can provide additional information about the reproducibility of the coccolithophore record as paleoproductivity proxy (e.g. Becquey and Gersonde, 2002; Cortese and Abelmann, 2002).
Phosphorus burial is related to organic matter production and burial; therefore, records of P burial are indicators of export productivity (Latimer and Filippelli, 2001). We use the P/Ti ratio, thus removing the effects of dilution by non-biologically active terrigenous material on the net P record. The P/Ti ratio reflects “excess” P delivery to the seafloor not supported by terrigenous components. Thus, increases in the P/Ti ratio record higher P sedimentation to the seafloor from biological processes. Although not directly correlative to the P mass balance, this ratio limits the effect that sediment focusing has on biasing accumulation rate records in drift settings (Frank et al., 1995; Marcantonio et al., 1995; Arrigo et al., 1998), yet retains the character of reflecting high biological export production. Temporal records can be affected somewhat by changes in the ratio of P to Ti in the terrigenous component alone; however, this does not appear to be an issue for the records presented here as they exhibit the same character when normalized to other terrigenous elements (Latimer and Filippelli, 2001, 2003).
P/Ti and NAR exhibit coincident peaks during glacials and particularly at terminations. Even the relative strength of the peaks coincide, with highest values in P/Ti occurring at Terminations IV and V, and thus presumably for total export production of organic matter in the surface ocean. The P/Ti ratio exhibits a phasing of broad peaks that begins during glacial intervals, reaching maxima just after the glacial-interglacial transition, and then decreasing to low values by the beginning of the next glacial interval. These records indicate relatively high “excess” P export occurring about 40–60 kyr after the onset of glacial intervals. Carbonate can be a significant carrier of P in marine sediments (Filippelli and Delaney, 1996). As argued above the NAR is tracking in some way total productivity and thus it is not possible to isolate the effect of P related to organic matter export from the surface ocean and the additional trapping effectiveness of carbonate minerals for P once sediments reach the seafloor.
Some correspondence is observed between NAR and the other organically related elements Cd and Ba. Both of these elements are related to organic matter production/degradation and oceanic nutrient cycles (Boyle, 1990; Lea and Boyle, 1990). Peaks in Cd/Ti roughly correspond to the glacial and termination peaks of P/Ti and NAR; this correspondences is nearly perfect for the Terminations V and VI but is extremely modulated in the record since 400 Ka (Figure 4; note however, that the Cd concentrations are near the analytical detection limit, particularly for this earlier part of the record, giving rise to the possibility that matrix effects during analysis are somewhat amplifying the Cd/Ti signal). Similarly, the Ba/Ti record reveals glacial and termination peaks, with strongest evidence of coincident peaks in Terminations IV–VI (Figure 4). The temporal character of both Cd/Ti and Ba/Ti records shift permanently after ∼300 Ka to a slightly different character (lower baseline for Cd/Ti and higher baseline for Ba/Ti) with few coherent peaks.
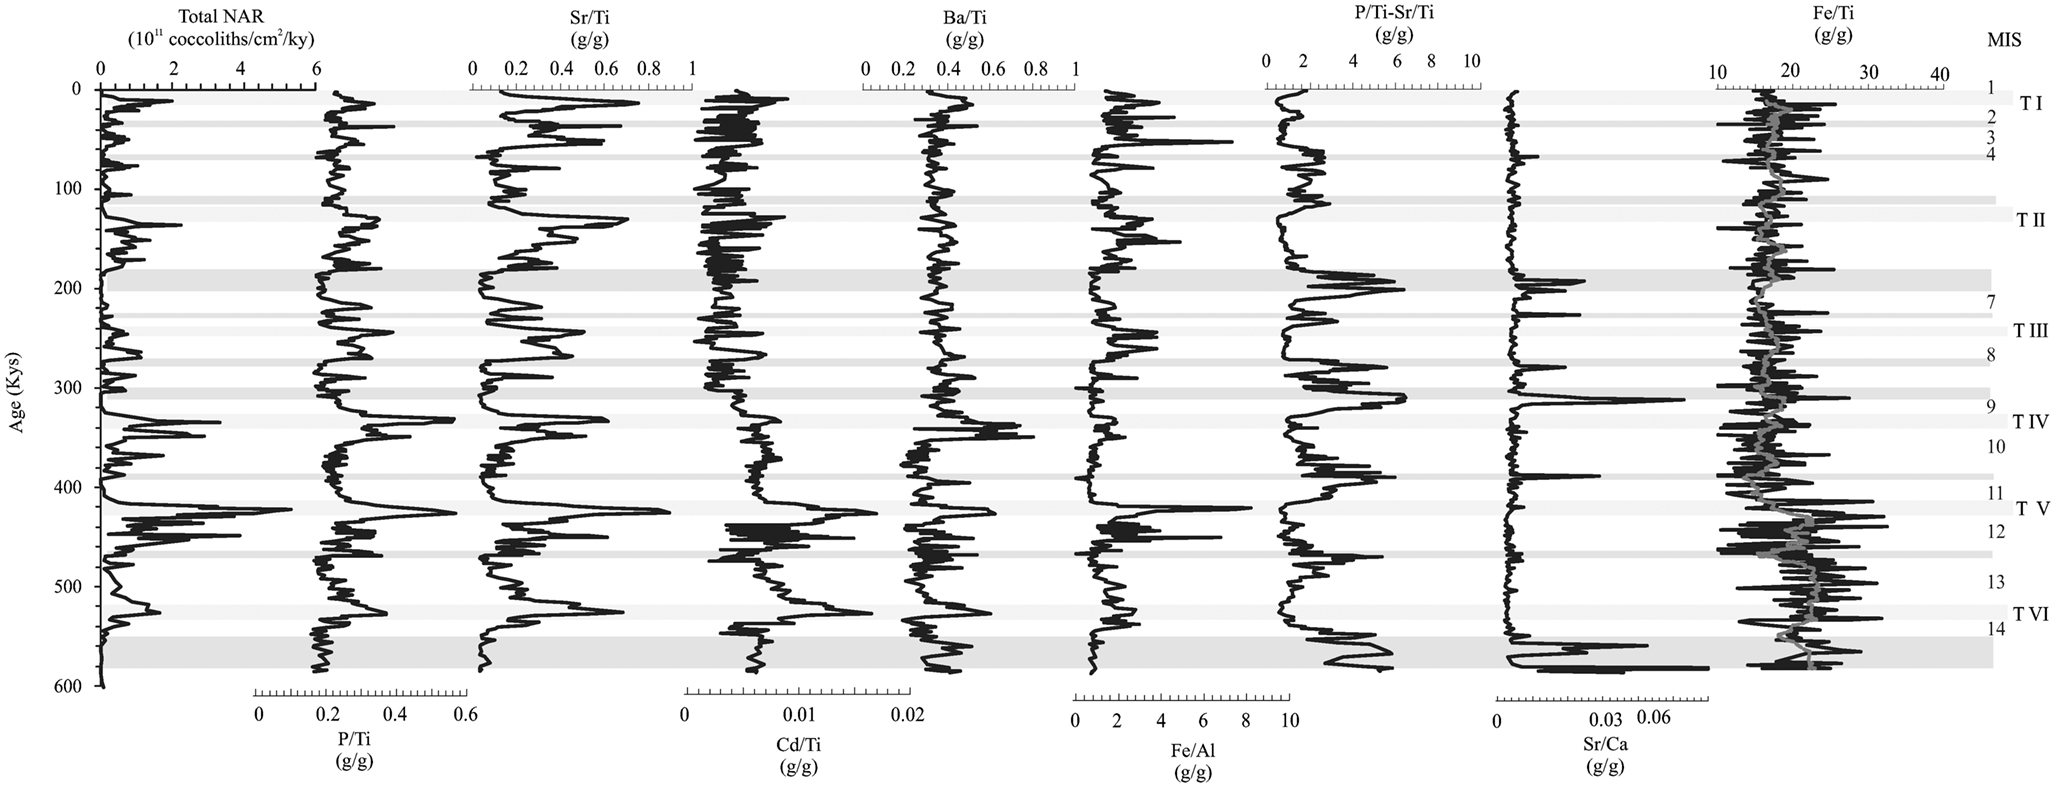
Figure 4. NAR (total nannofossil accumulation rate) versus selected geochemical ratios. Shaded bands represent high dissolution intervals. MIS, marine isotope stage; T I–T VI, terminations I–VI.
As expected, the Sr/Ti ratio shows a good correlation with NAR (Figure 5) due to the incorporation of Sr into the calcitic structure of coccolithophores (Stoll and Schrag, 2000). In general, present day experiments carried out by Stoll et al. (2002) demonstrate a relationship between concentration of Sr and productivity (although these authors use a different ratio: Sr/Ca of the coccoliths themselves). The correlation between Sr/Ti and P/Ti is good (r2 = 0.46 for Sr versus P), suggesting that coccolithophore production and P are related. The P/Ti ratio should reflect total export production (or at least the net export production from the oceanic mass balance), and if the Sr/Ti ratio is driven in part by coccolithophore production, then the difference between these ratios (i.e., P/Ti-Sr/Ti) should reflect the productivity of organisms other than coccolithophores. Interestingly, this ratio difference record does correspond to the observed dissolution intervals by Flores et al. (2003; Figure 4). With the available data we cannot confirm if this signature is due to a dissolution effect, a reduction in the coccolithophore production, or a combination of both.
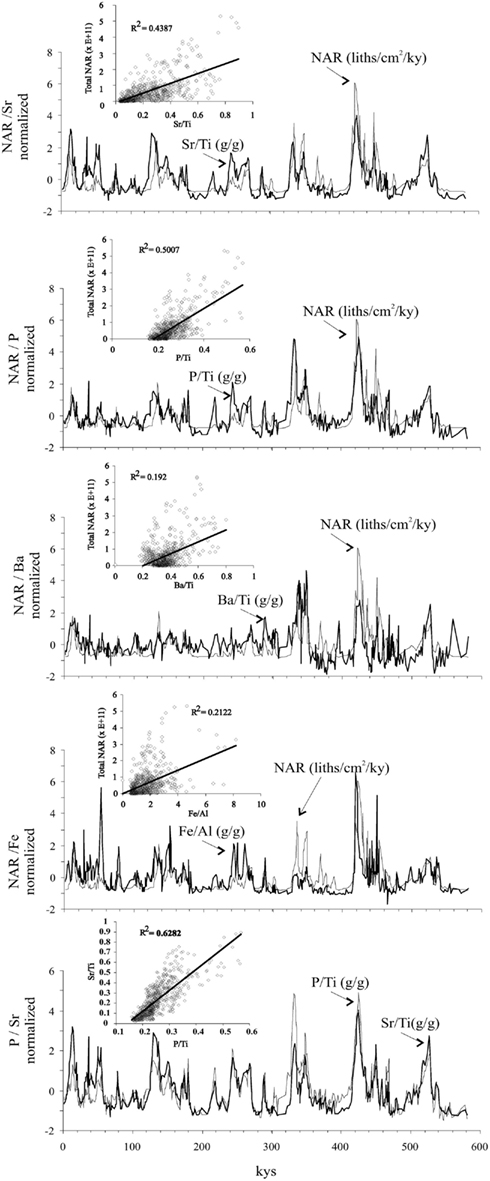
Figure 5. Correlation between NAR (total nannofossil accumulation rate) versus selected Ti-normalized geochemical ratios. Note that the element/Ti records are replotted from Figure 4 to match the NAR record scale.
This data suggest that glacial periods, and especially terminations in the Atlantic sector of the SO, reflect episodes of high productivity. The general maxima in CaCO3 from MIS 13 to 8 is due to the increase of Noelaerhabdaceae (Emiliania huxleyi + Gephyrocapsa), whereas the marked peaks observed in Terminations I, II, and III is produced by an increase in “large” coccolithophores (mainly Helicosphaera carteri) instead of Noelaerhabdaceae (Figure 6). This relates to the strong differences between coccolithophore assemblages between the Mid-Brunhes and the period afterward is likely due to a reduction in the CaCO3 produced by small coccolithophores during the last three terminations, whereas during the Mid-Brunhes interval Gephyrocapsa caribbeanica dominated. However, it is important to note that the estimation of this parameter is based on present day specimens and the values used for the calculation can introduce considerable error (Young and Ziveri, 2000). This aspect is extended in next section of this study.
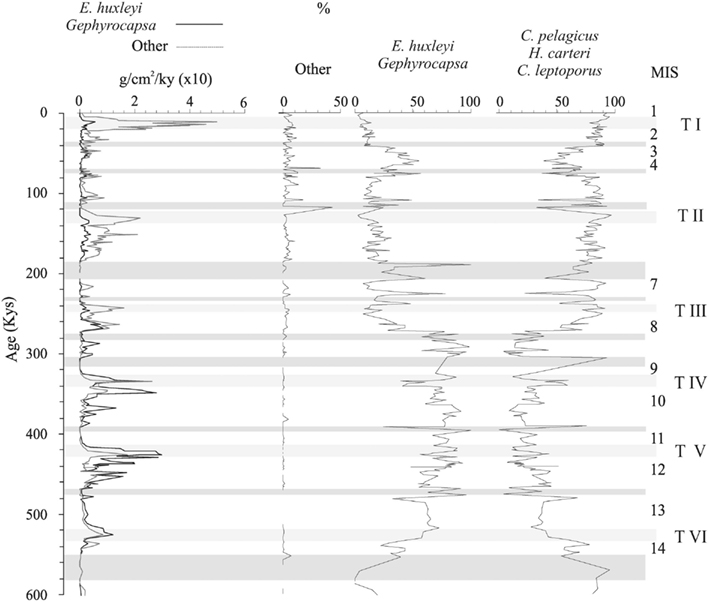
Figure 6. Accumulation rate of the CaCO3 provided for the most abundant coccolithophore species. Calculations are based on the estimation of Young and Ziveri (2000). Shaded bands represent high dissolution intervals. MIS, marine isotope stage; T I–T VI, terminations I–VI.
Regional Paleoceanography
Today and during previous interglacials, the highest concentration of nutrients is found in the Antarctic sector (Figure 2), whereas a northward expansion of sea ice and consequent reduction in surface water productivity is seen in the Antarctic sector during glacial periods (Figure 3). Several authors suggest an increase of export productivity in the SAZ, and a decrease south of the PF during glacials (Charles et al., 1991; Mortlock et al., 1991; Kumar et al., 1995). Kumar et al. (1995) argue that the increase in productivity north of APF is driven by eolian iron fertilization. This productivity was compensated by a reduction south of the PF. Asmus et al. (1999) show an increase in productivity during MIS 2 and 4 south of the PF; whereas Elderfield and Rickaby (2000) argue that values are similar to today, although with a clear reduction in productivity south of the PF due to the development of sea ice. Ikehara et al. (2000) observed higher productivity in the SAZ during glacials, fueled by an increase of terrigenous supply and iron fertilization. Latimer and Filippelli (2001) interpret an increase of productivity during glacials fueled by upwelled hemipelagic iron from the CDW (and Upper CPDW). This model is based in observations by Gordon et al. (1997) and Wells and Okada (1997) in the equatorial Pacific (Figure 7).
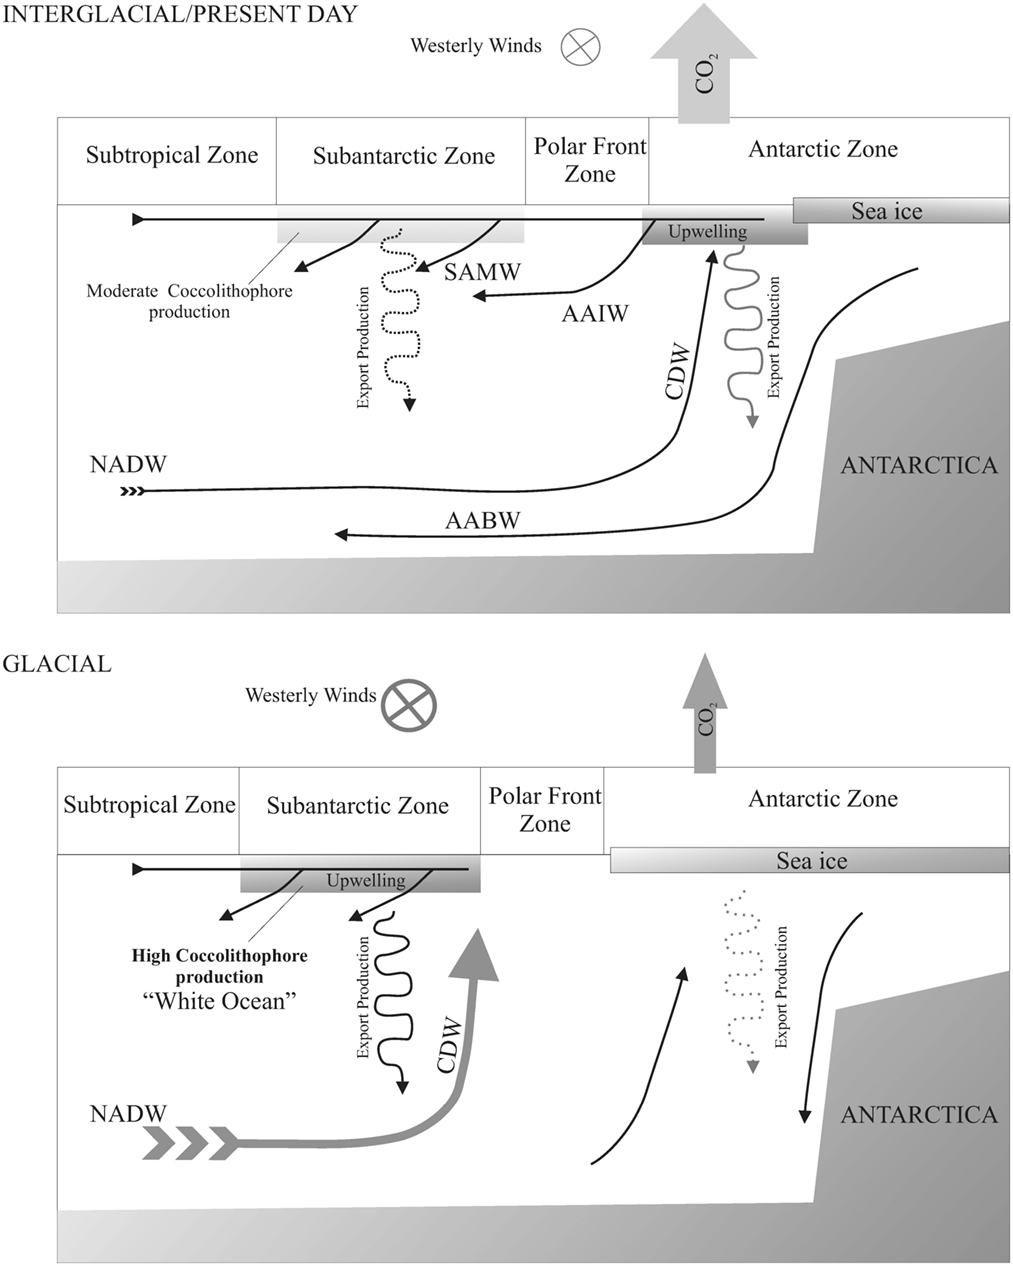
Figure 7. Schematic paleoceanographic scenarios for interglacial and glacial periods in the Atlantic sector of the Southern Ocean. SAMW, Subantarctic Mode Water; AAIW, Antarctic Intermediate Water; NAD, North Atlantic Deep Water; CDW, Circumpolar Deep Water.
Sigman and Boyle (2000) proposed a similar pattern for the last glacial-interglacial cycle. In the present day Atlantic sector of the SO the highest surface concentration of nutrients is found in the upwelled waters south of the PF (between the PF and the sea ice), which also releases a significant flux of CO2 to the atmosphere. During the last ice age, the northward advance of sea ice produced a limitation in surface primary productivity south of the PF. The westerly wind cells were displaced north of the PF, and the main glacial production took place in the subantarctic zone. This phenomenon resulted in a net reduction in CO2 release.
Based on our results, the subantarctic zone is mainly colonized by coccolithophores instead of diatoms and other siliceous organisms; in response to enhanced upwelling, the coccolithophore production increases. In this case, we suggest that a glacial “White Ocean” occurs both north and south of the PF; in one case due to the sea ice, and in the most temperate region (subantarctic) due to the coccolithophore blooms. These blooms could occur in a similar way as those observed in the present day, although for MIS 12 and 10 (and T V and T IV) it appears that there was a much higher production of carbonate than observed in the present day.
One important question is the role of iron and iron fertilization in the glacial ocean of this region. Sigman and Boyle (2000) suggest that an increase of dust (Fe rich) outside of the PFZ should contribute to enhanced productivity in the subantarctic zone. Latimer and Filippelli (2001), on the other hand, argue that the observed peaks in glacial Fe in SO sediments must be driven by enhanced hemipelagic loading of the glacial ocean, but that perhaps the dissolution of some of the iron in the deep and intermediate ocean resulted in a higher dissolved iron flux to the surface ocean and thus glacial iron fertilization from below. Regardless of the source of fertilizing iron to this region (dust, upwelling, provenance; Latimer et al., 2006), it is still an open question whether coccolithophore production is stimulated by enhanced iron in the same way that diatom production increases in response to iron additions in the modern ocean (e.g., Coale et al., 1996, 2004; Watson et al., 2002).
Maxima in dust in the Vostok ice-core coincide with glacial periods, although the peaks in abundance occur just before the deglaciation, where NAR reaches the highest values. Based on our data, we cannot discard the influence of iron fertilization with eolian provenance during glacial intervals, but during Terminations, coinciding with an intense instability in the atmospheric and oceanic features, the peaks in productivity and iron seems to be related to upwelling processes, where a CDW rich in iron, fueled the SAZ.
Global Phosphorus Inventory Increase
As updated in Filippelli et al. (2007) but originally suggested by Broecker (1982), the Shelf-Nutrient Hypothesis suggests that the loss in continental margin sinks for nutrients and carbon during glacial sea level lowstands should result in a net transfer of these components to the deep ocean sink. Such a transfer of phosphorus in particular is critical as it is a limiting nutrient (Tyrell, 1999; Wu et al., 2000; Sañudo-Wilhelmy et al., 2001), and perhaps as the ultimate limiter of oceanic productivity on geologic timescales (Tyrell, 1999). The implications of the shift of nutrients from continental margins to the deep oceans are profound on several fronts. First, newer estimates of the phosphorus residence time in the ocean are about 20,000 years (e.g., Colman and Holland, 2000), indicating that significant mass balance changes for phosphorus can be occur on glacial timescales. Second, newer accumulation rate determinations of biologically reactive phosphorus indicate that, despite comprising less than 10% of total ocean area, the continental margin sink for phosphorus is almost equal to the deep ocean sink because of high sedimentation rates, lower recycling, and relatively high marginal productivity (Föllmi, 1996; Filippelli, 1997). Finally, the reactive phosphorus-bearing material deposited in continental margin sediments is highly soluble in the acidic conditions of subaerial exposure, soil development, and weathering (Guidry and Mackenzie, 2003) which would occur during glacial sea level drops.
The redistribution of phosphorus from continental margins to the deep sea during lowered glacial sea level, and the subsequent deep sea response to this increased phosphorus loading, can be simplistically modeled to a first-order by using the sea level curve to estimate continental margin sink loss. The premise here is that phosphorus is transferred from continental margin sinks to the deep sea environment during glacial sea level lowstands, but the net impact on the phosphorus deep sea mass balance will be delayed in accordance with the oceanic response time of phosphorus (current estimates for the phosphorus residence time in the ocean are 10–20 kyr; Colman and Holland, 2000). With this simplistic model, the NAR can be compared to the sea level curve inferred from the oxygen isotope record at ODP 1089, with the sea level record “lagged” by 20,000 year to reflect the residence time lag between cause (increased shelf area exposed to weathering) and effect (increased phosphorus delivery to the deep sea reservoir). Such a comparison yields a striking correspondence between increased phosphorus inventories in the deep sea and increased nannofossil production (Figure 8). Although modern Emiliania huxleyi are particularly adept to surviving under low phosphate conditions, this may indeed be an adaptive strategy to longer periods of low phosphate since the Mid-Brunhes, and perhaps extinct species were more tightly coupled to phosphate availability. Interestingly, the Sr/Ti record varies on the same timescale but exhibits different magnitudes of variation (Figure 4), with variation most closely matching that of P/Ti in the Mid-Brunhes and not after this interval. This, plus the “over-prediction” of NAR in the Mid-Brunhes (compared to the P-driven nutrient model; Figure 8), support the dominance of coccolithophores and the tight coupling with the marine P cycling in this interval. As noted in Filippelli et al. (2007), other changes are likely occurring in the global phosphorus cycle during glacial intervals, and the lagged sea level model is not an ideal recreation of changes in the marine phosphorus inventory, but on a first-order, this finding is consistent with a correlation between marine phosphorus cycling and coccolithophore bioproduction on these timescales.
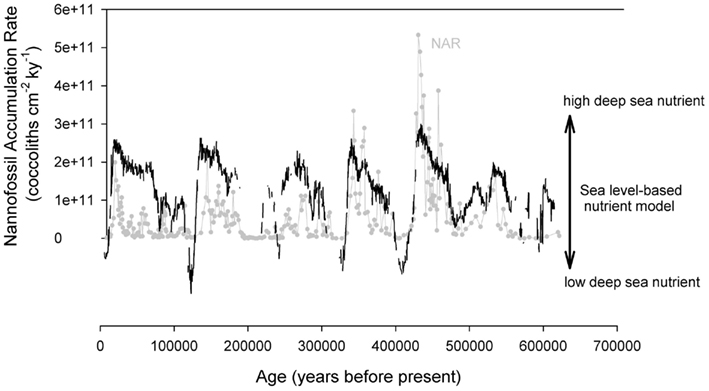
Figure 8. A comparison between the nannofossil accumulation rate and a deep sea nutrient curve modeled from the sea level record derived from oxygen isotopic records at ODP Site 1089. The nutrient model is shelf area “lagged” by 20,000 to reflect the delayed response seen in the marine phosphorus mass balance driven by the residence of phosphorus in the modern ocean.
The Mid-Brunhes Paradox
The Mid-Brunhes interval, including MIS 11 and MIS 9, is considered one of the warmest periods in the last million years. The transition between MIS 12 and 11 (Termination V) represents the largest deglacial amplitude variation observed in the oxygen isotope record (Howard and Prell, 1992; Burckle, 1993; Hodell, 1993; Kukla et al., 1998; Droxler and Farrell, 2000; Droxler et al., 2003; Wang et al., 2003). This warming episode is also linked to melting of the Greenland and West Antarctic ice-sheets and a sea level rise between 13 to 20 m (Rohling et al., 1998; Scherer et al., 1998). All these characteristics indicate a complex scenario with important changes both in surface and deep water dynamics. During MIS 11, significant shelf-carbonate deposits occur at the same time that intense dissolution is recorded at abyssal depths (Droxler and Farrell, 2000), along with the largest-amplitude change in δ18O (Wang et al., 2003) related to a major ice-sheet expansion. This situation is not well explained following strictly orbital models, particularly as MIS 11 coincides with extremely low eccentricity and the estimated insolation does not correspond with the calculated data. Disturbances in the carbon reservoir prior to the MIS 12 glacial pulse may have contributed to a geochemical feedback on the expected orbital effects (Droxler et al., 2003; Wang et al., 2003).
In the coccolithophore record, this interval is characterized by the dominance of the small and highly calcified species G. caribbeanica. This species has a world-wide distribution (Bollmann, 1997; Flores et al., 1999, 2003) and seems to represent a response of the coccolithophore assemblage to changing oceanographic conditions. An intensification in ocean and atmospheric circulation during this interval has been reported in the SO (Jansen et al., 1986), parallel with increases in productivity (Hodell et al., 2000). The interval of dominance of G. caribbeanica may be due to a higher availability of nutrients, perhaps due to a shoaling of the thermocline (Bollmann, 1997), but the dominance of this small species is not easily explained and warrants further investigation.
Conclusion
A fair correspondence between P/Ti, Sr/Ti, and other paleoproductivity records with the accumulation record of coccolithophores in Subantarctic region of the Atlantic sector, allow us to confirm that changes in the abundance of coccolithophore reflect variation in paleoproductivity.
For the last 500 kyr, glacial periods were characterized by high productivity, reaching maxima during terminations, Termination V and Termination IV are of particular importance. During interglacials the pattern is opposite to the glacial, with an increase in the CaCO3 dissolution that amplifies the signal. During glacials, an intensification of the wind regime occurred, and drove a more intense upwelling of CPDW in a region where coccolithophores were the most significant primary producers. Other elements needed for fertilization in the region, such as iron, have a partial eolian source; however, during terminations, when the system is more unstable, the main source of iron may to be hemipelagic.
The Mid-Brunhes interval is dominated by the small and highly calcified species G. caribbeanica that provide most of the carbonate in these sediments. This interval represents an episode of higher nutrient availability due to the intensification of atmospheric and surface water dynamics and the prevalence of a shallow effective mix layer. Under these conditions, some coccolithophore species developed an r-strategy which manifested as a bloom of G. caribbeanica. The seasonal blooms of G. caribbeanica likely caused intense “white tides” similar to those observed today in E. huxleyi.
Conflict of Interest Statement
The authors declare that the research was conducted in the absence of any commercial or financial relationships that could be construed as a potential conflict of interest.
Acknowledgments
Research grants CLI-1002-CO2, PR2006-0446, PASUR CGL2009-08651 MICINN PR2009-0179 (Programa de Movilidad MEC) and Programa Consolider-Ingenio 2010 GRACCIE supported this study. This research used samples and data provided by the ODP. The ODP is sponsored by the U.S. National Science Foundation (NSF) and participating countries under management of Joint Oceanographic Institutions (JOI), Inc., Filippelli and Latimer acknowledge research support from JOI, Inc. (Schlanger Ocean Drilling Fellowship to Latimer), JOI/USSSP (Filippelli), NSF (grants OCE-9711957 and OCE-045248 to Filippelli), and the donors of the American Chemical Society through the Petroleum Research Fund.
References
Ahagon, N., Tanaka, Y., and Ujiié, H. (1993). Florisphaera profunda, a possible nannoplankton indicator of late quaternary changes in sea-water turbidity at the northwestern margin of the Pacific. Mar. Micropaleontol. 22, 255–273.
Arrigo, K., Worthon, D., Schnell, V., and Lizotte, M. P. (1998). Primary production in Southern Ocean waters. J. Geophys. Res. 103, 15587–15600.
Asmus, T., Frank, M., Koschmieder, C., Frank, H., Gersonde, R., Kuhn, G., and Mangini, A. (1999). Variations of biogenic particle flux in the Southern Atlantic section of the Subantarctic Zone during the late quaternary: evidence from sedimentary Pa-231(ex) and Th-230(ex). Mar. Geol. 159, 63–78.
Averyt, K. B., and Paytan, A. (2004). A comparison of multiple proxies for export production in the Equatorial Pacific. Paleoceanography 19, 4003–4016.
Balch, W. M. (2004). “Re-evaluation of the physiological ecology of coccolithophores,” Coccolithophores – From Molecular Processes to Global Impact, eds H. Thierstein and J. Young (Berlin: Springer), 165–190.
Baumann, K.-H., Cepek, M., and Kinkel, H. (1999). “Coccolithophores as indicators of ocean water masses, surface-water temperature, and paleoproductivity – examples from the South Atlantic,” in Use of Proxies in Paleoceanography: Examples from the South Atlantic, eds G. Fischer and G. Wefer (Berlin: Springer), 117–144.
Baumann, K. H., and Freitag, T. (2004). Pleistocene fluctuations in the northern Benguela Current system as revealed by coccolith assemblages. Mar. Micropaloentol. 52, 195–215.
Beaufort, L., de Garidel-Thoron, A., Mix, N., and Pisias, G. (2001). ENSO-like forcing on oceanic primary production during the late Pleistocene. Science 293, 2440–2444.
Beaufort, L., Lancelot, Y., Camberlin, P., Cayre, O., Vincent, E., Bassinot, F., and Labeyrie, L. (1997). Insolation cycles as major control of Equatorial Indian Ocean primary production. Science 278, 1451–1454.
Becquey, S., and Gersonde, R. (2002). Past hydrographic and climatic changes in the Subantarctic Zone of the South Atlantic – the Pleistocene record from ODP Site 1090. Palaeogeogr. Palaeoclimatol. Palaeoecol. 182, 221–239.
Bollmann, J. (1997). Morphology and biogeography of the genus Gephyrocapsa coccoliths, in Holocene sediments. Mar. Micropaleontol. 29, 319–350.
Broecker, W. S. (1982). Glacial to interglacial changes in ocean chemistry. Prog. Oceanogr. 11, 151–197.
Burckle, L. H. (1993). Late Quaternary interglacial stages warmer than present. Quat. Sci. Rev. 12, 825–831.
Charles, C. D., Froelich, P. N., Zibello, M. A., Mortlock, R. A., and Morley, J. J. (1991). Biogenic opal in Southern Ocean sediments over the last 450,000 years: implications for surface water chemistry and circulation. Paleoceanography 6, 697–728.
Coale, K. H., Johnson, K. S., Fitzwater, S. E., Gordon, R. M., Tanner, S., Chavez, F. P., Ferioli, L., Sakamoto, C., Rogers, P., Millero, F., Steinberg, P., Nightingale, P., Cooper, D., Cochlan, W. P., Landry, M. R., Constantinou, J., Rollwagen, G., Trasvina, A., and Kudela, R. (1996). A massive phytoplankton bloom induced by an ecosystem-scale iron fertilization experiment in the equatorial Pacific. Nature 383, 495–501.
Coale, K. H., Kenneth, J. S., Chavez, F. P., Buesseler, K. O., Barber, Ri. T., Brzezinski, M. A., Cochlan, W. P., Millero, F. J., Falkowski, P. G., Bauer, J. E., Wanninkhof, R. H., Kudela, R. M., Altabet, M. A., Hales, B. E., Takahashi, T., Landry, M. R., Bidigare, R. R., Wang, X., Chase, Z., Strutton, P. G., Friederich, G. E., Gorbunov, M. Y., Lance, V. P., Hilting, A. K., Hiscock, M. R., Demarest, M., Hiscock, W. T., Sullivan, K. F., Tanner, S. J., Gordon, R. M., Hunter, C. N., Elrod, V. A., Fitzwater, S. E., Jones, J. L., Tozzi, S., Koblizek, M., Roberts, A. E., Herndon, J., Brewster, J., Ladizinsky, N., Smith, G., Cooper, D., Timothy, D., Brown, S. L., Selph, K. E., Sheridan, C. C., Twining, B. S., and Johnson, Z. I. (2004). Southern Ocean iron enrichment experiment: carbon cycling in high- and low-Si waters. Science 304, 408–414.
Colman, A. S., and Holland, H. D. (2000). The global diagenetic flux of phosphorus from marine sediments to the oceans; redox sensitivity and the control of atmospheric oxygen levels: special publication. J. Sediment. Res. A Sediment. Petrol. Process 66, 53–75.
Cortese, J., and Abelmann, A. (2002). Radiolarian-based paleotemperatures during the last 160 kyrs at ODP Site 1089 (Southern Ocean, Atlantic Sector). Palaeogeogr. Palaeoclimatol. Palaeoecol. 182, 259–286.
Droxler, A. W., and Farrell, J. W. (2000). Marine Isotope Stage 11 (MIS 11): new insights for a warm future. Glob. Planet. Change 24, 1–5.
Droxler, A. W., Poore, P. Z., and Burckle, L. H. (2003). Earth’s Climate and Orbital Eccentricity: The Marine Isotope Stage 11 Question. Washington, DC: Geophysical Monograph, American Geophysical Union, 240.
Dymond, J., Collier, R., and McManus, J. (1997). Can the aluminum and titanium contents of ocean sediments be used to determine the paleoproductivity of the oceans? Paleoceanography 12, 586–593.
Eagle, M., Paytan, A., Arrigo, K. R., van Dijken, G., and Murray, R. W. (2003). A comparison between excess barium and barite as indicators of carbon export. Paleoceanography 18, 1021.
Elderfield, H., and Rickaby, R. E. M. (2000). Oceanic Cd/P ratio and nutrient utilization in the glacial Southern Ocean. Nature 405, 305–310.
Filippelli, G. M. (1997). Controls on phosphorus concentration and accumulation in oceanic sediments. Mar. Geol. 139, 231–240.
Filippelli, G. M., and Delaney, M. L. (1996). Phosphorus geochemistry of equatorial Pacific sediments. Geochim. Cosmochim. Acta 60, 1479–1495.
Filippelli, G. M., Latimer, J. C., Murray, R. W., and Flores, J. A. (2007). Productivity records from the Southern Ocean and the equatorial Pacific Ocean: testing the glacial shelf-nutrient hypothesis. Deep Sea Res. Part II Top. Stud. Oceanogr. 54/21-22, 2443–2452.
Flores, J. A., Gersonde, R., and Sierro, F. J. (1999). Pleistocene fluctuations in the Agulhas Current Retroflection based on the calcareous plankton record. Mar. Micropaleontol. 37, 1–22.
Flores, J. A., Sierro, F. J., and Raffi, I. (1995). Evolution of the calcareous nannofossil assemblage as a response to the paleoceanographic changes in the Eastern equatorial Pacific from 4 to 2 Ma (Leg 138, Sites 849 and 852). Proc. ODP Init. Rep. 138, 163–176.
Flores, J.-A., Marino, M., Sierro, F. J., Hodell, D. A., and Charles, C. D. (2003). Calcareous plankton dissolution pattern and coccolithophore assemblages during the last 600 kyr at ODP Site 1089 (Cape Basin, South Atlantic): paleoceanographic implications. Palaeogeogr. Palaeoclimatol. Palaeoecol. 196, 409–426.
Flores, J. A., and Sierro, F. J. (1997). Revised technique for calculation of calcareous nannofossil accumulation rates. Micropaleontology 43, 321–324.
Föllmi, K. B. (1996). The phosphorus cycle, phosphogenesis and marine phosphate-rich deposits. Earth Sci. Rev. 40, 55–124.
Francois, R., Altabet, M. A., Yu, E. F., Sigman, D. M., Bacon, M. P., Frank, M., Bohrmann, G., Bareille, G., and Labeyrie, L. (1997). Contribution of Southern Ocean surface-water stratification to low atmospheric CO2 concentrations during the last glacial period. Nature 389, 929–935.
Frank, M., Eisenhauer, A., Bonn, W. J., Walter, P., Grobe, H., Kubik, P. W., Dittrich-Hannen, B., and Mangini, A. (1995). Sediment redistribution versus paleoproductivity change: Weddell Sea margin sediment stratigraphy for the last 250,000 years deduced from 230Thex, 10Be and biogenic barium profiles. Earth Planet. Sci. Lett. 136, 559–573.
Giraudeau, J., and Bailey, G. W. (1995). Spatial dynamics of coccolithophore communities during an upwelling event in the Southern Benguela system. Cont. Shelf Res. 15, 1825–1852.
Gordon, R. M., Coale, K. H., and Johnson, K. S. (1997). Iron distributions in the equatorial Pacific: implications for new production. Limnol. Oceanogr. 42, 419–431.
Guidry, M. W., and Mackenzie, F. T. (2003). Experimental study of igneous and sedimentary apatite dissolution: control of pH, distance from equilibrium, and temperature on dissolution rates. Geochim. Cosmochim. Acta 67, 2949–2963.
Hernández-Almeida, I., Bárcena, M. A., Flores, J. A., Sierro, F. J., Sánchez-Vidal, A., and Calafat, A. (2011). Microplankton response to environmental conditions in the Alboran Sea (Western Mediterranean): one year sediment trap record. Mar. Micropaleontol. 78, 14–24.
Hodell, D., Kanfoush, S. L., Venz, K. A., Charles, C. D., and Sierro, F. J. (2003). “The mid-brunhes transition in ODP sites 1089 and 1090 (Subantarctic South Atlantic),” in: Marine Isotope Stage 11: An Extreme Interglacial? eds A. W. Droxler, R. Z. Poore, L. D. Burckle, and L. E. Osterman 113–129. [American geophysical union geophysical monograph 137].
Hodell, D. A. (1993). Late Pleistocene paleoceanography of the South Atlantic sector of the Southern Ocean: ocean drilling program hole 704A. Paleoceanography 8, 47–67.
Hodell, D. A., Charles, C. D., Curtis, J. H., Mortyn, P. G., Ninnemann, U., and Venz, K. A. (2002). “Data report: oxygen isotope stratigraphy of ODP Leg 177 Sites 1088, 1089, 1090, 1093, and 1094,” in Proc. Ocean Drill. Prog. Sci. Results (College Station: Texas A&M), 177.
Hodell, D. A., Charles, C. D., and Ninnemann, U. (2000). Comparison of interglacial stages in the South Atlantic sector of the southern ocean for the past 450 kyr: implications for Marine Isotope Stage (MIS) 11. Glob. Planet. Change 24, 7–26.
Hodell, D. A., Charles, C. D., and Sierro, F. J. (2001). Late Pleistocene evolution of the ocean’s carbonate system. Earth Planet. Sci. Lett. 192, 109–124.
Howard, W. R., and Prell, W. L. (1992). Late quaternary surface circulation of the Southern Indian Ocean and its relationship to orbital variations. Paleoceanography 7, 79–117.
Ikehara, M., Kawamura, K., Ohkouchi, N., Murayama, M., Nakamura, T., and Taira, A. (2000). Variations of terrestrial input and marine productivity in the Southern Ocean (48°S) during the last two deglaciations. Paleoceanography 15, 170–180.
Imbrie, J., Hays, J. D., Martinson, D. G., McIntyre, A., Mix, A., Morley, J. J., Pisias, N. G., Prell, W. L., and Shackleton, N. J. (1984). “The orbital theory of Pleistocene climate: Support from a revised chronology of the marine δ18O record,” in Milankovitch and Climate, Part I, eds A. Berger, J. Imbrie, J. Hays, G. Kukla, and B. Saltzman (Dordrecht: D. Reidel Publishing), 269–305.
Jansen, J. H. F., Kuijpers, A., and Troelstra, S. R. (1986). A Mid-Brunhes climatic event: long-term changes in Global Atmosphere and Ocean circulation. Science 233, 619–622.
Kleijne, A., Kroon, D., and Zevenboom, W. (1989). Phytoplankton and foraminiferal frequencies in Northern Indian Ocean and Red Sea surface waters. J. Sea Res. 24, 531–539.
Kuhn, G., and Diekmann, B. (2002). Late quaternary variability of ocean circulation in the southeastern South Atlantic inferred from the terrigenous sediment record of a drift deposit in the southern Cape Basin (ODP Site 1089). Palaeogeogr. Palaeoclimatol. Palaeoecol. 182, 287–303.
Kukla, G., McManus, J. F., Rousseau, D. D., and Chuine, I. (1998). How long and how stable was the last interglacial? Quat. Sci. Rev. 16, 605–612.
Kumar, N., Anderson, R. F., Mortlock, R. A., Froelich, P. N., Kubik, P., Dittrich-Hannen, B., and Suter, M. (1995). Increased biological productivity and export production in the glacial Southern Ocean. Nature 378, 675–680.
Latimer, J. C., and Filippelli, G. M. (2001). Terrigenous input and paleoproductivity in the Southern Ocean. Paleoceanography 16, 627–693.
Latimer, J. C., and Filippelli, G. M. (2003). Data report: sediment geochemical results from ODP Leg 189, Site 1171 – eocene to present. Proc. Ocean Drill. Prog. Sci. Results 189, 1–16.
Latimer, J. C., Filippelli, G. M., Hendy, I., Gleason, J. D., and Blum, J. D. (2006). Glacial-interglacial terrigenous provenance in the southeastern Atlantic Ocean: the importance of deep water sources and surface currents. Geology 34, 545–548.
Lea, D. W., and Boyle, E. A. (1990). Foraminiferal reconstructions of barium distributions in water masses of the glacial oceans. Paleoceanography 5, 719.
Lutjeharms, J. R. E. (1981). Spatial scales and intensities of circulation in the ocean areas adjacent to South Africa. Deep Sea Res. Part II Top. Stud. Oceanogr. 28, 1289–1302.
Lutjeharms, J. R. E. (1996). “The exchange of water between the South Indian and South Atlantic Oceans” in The South Atlantic: Present and Past Circulation, eds G. Wefer, W. H. Berger, G. Siedler, and D. J. Webb (Berlin: Springer), 125–162.
Lutjeharms, J. R. E., and Valentine, H. R. (1984). Southern Ocean thermal fronts along South Africa. Deep Sea Res. Part II Top. Stud. Oceanogr. 31, 1461–1475.
Mantyla, A. W., and Reid, J. L. (1983). Abyssal characteristics of the World Ocean waters. Deep Sea Res. Part II Top. Stud. Oceanogr. 30, 805–833.
Marcantonio, F., Kumar, N., Stute, M., Anderson, R. F., Seidl, M. A., Schlosser, P., and Mix, A. (1995). Comparative study of accumulation rates derived by He and Th isotopic analysis of marine sediments. Earth Planet. Sci. Lett. 133, 549–555.
Margalef, R. (1978). Life-forms of phytoplankton as survival alternatives in an unstable environment. Oceanol. Acta 1, 493–509.
Martinson, D. O., Pisias, N. G., Hayes, J. D., Imbrie, J., Moore, T. C. J., and Shackleton, N. J. (1987). Age dating and the orbital theory of the ice ages: development of a high resolution 0 to 300,000 year chronostratigraphy. Quaternary Res. 27, 1–29.
Mayer, L., Pisias, N., Janecek, T., Mix, A. C., Lyle, M. W., Arason, P., and Mosher, D. (1992). “Explanatory notes,” in Proceedings of the Ocean Drilling Program, Scientific Results (College Station: Ocean Drilling Program), 13–42.
Molfino, B., and McIntyre, A. (1990). Nutricline variations in the Equatorial Atlantic coincident with theYounger-Dryas. Paleoceanography 5, 997–1008.
Moreno, A., Cacho, I., Canals, M., Grimalt, J. O., Sánchez-Goñi, M. F., Shackleton, N., and Sierro, F. J. (2005). Links between oscillation at the millennial time-scale. A multi-proxy study of the last 50,000 from the Alboran Sea (Western Mediterranean Sea). Quat. Sci. Rev. 24, 1623–1636.
Moreno, A., Cacho, I., Canals, M., Prins, M. A., Sánchez-Goñi, M. F., Grimalt, J. O., and Weltje, G. J. (2002). Saharan dust transport and high-latitude glacial climatic variability: the Alboran Sea record. Quat. Int. 58, 318–328.
Mortlock, R. A., Charles, C. D., Froelich, P. N., Zibello, M. A., Saltzman, J., Hays, J. D., and Burckle, L. H. (1991). Evidence for lower productivity in the Antarctic Ocean during the last glaciations. Nature 351, 220–223.
Orsi, A. H., Whitworth, T., and Worth, N. (1995). On the meridional extent and fronts of the Antarctic Circumpolar current. Deep Sea Res. Part I Oceanogr. Res. Pap. 42, 641–673.
Peterson, R. G., and Stramma, L. (1991). Upper-level circulation in the South Atlantic Ocean. Prog. Oceanogr. 26, 1–73.
Raymo, M. E., Oppo, D. W., Flower, B. P., Hodell, D. A., McManus, J., Venz, K. A., Kleiven, K. F., and McIntyre, K. (2004). Stability of North Atlantic water masses in face of pronounced climate variability during the Pleistocene. Paleoceanography 19, 2008–2021.
Reid, J. L., Nowlin, W. D., and Patzert, W. C. (1977). On the characteristics and circulation of the Southwestern Atlantic Ocean. J. Phys. Oceanogr. 7, 62–91.
Rodrigues, T., Grimalt, J., Abrantes, F., Flores, J. A., and Lebriero, S. M. (2009). Holocene interdependences of changes in sea surface temperature, productivity, and fluvial inputs in the Iberian continental shelf (Tagus mud patch). Geochem. Geophys. Geosyst.
Rohling, E. J., Fenton, M., Jorissen, F. J., Bertrand, P., Ganssen, G., and Caulet, J. P. (1998). Magnitudes of sea-level lowstands of the past 500,000 years. Nature 394, 162–165.
Rühlemann, C., Mulitza, S., Muller, P. J., Wefer, G., and Zahn, R. (1999). Warming of the tropical Atlantic Ocean and slowdown of thermohaline circulation during the last deglaciation. Nature 402, 511–514.
Sañudo-Wilhelmy, S. A., Kustka, A. B., Gobler, C. J., Hutchins, D. A., Yang, M., Lwiza, K., Burns, J., Capone, D. G., Raven, J. A., and Carpenter, E. J. (2001). Phosphorus limitation of nitrogen fixation by Trichodesmium in Central Atlantic Ocean. Nature 411, 66–69.
Scherer, R. P., Aldahan, A., Tulaczyk, S., Kamb, B., Engelhardt, H., and Possnert, G. (1998). Pleistocene collapse of the West Antarctic Ice Sheet. Science 281, 82–85.
Shipboard Scientific Party. (1999). “Leg summary: Southern Ocean paleoceanography,” in Proceedings of the Ocean Drilling Program, Initial Reports (College Station: Texas A&M), 1–101.
Siegenthaler, U., Stocker, T., Monnin, E., Luthi, D., Schwander, J., Stauffer, B., Raynaud, D., Barnola, J. M., Fischer, H., Masson-Delmotte, V., and Jouzel, J. (2005). Stable carbon cycle-climate relationship during the late Pleistocene. Science 310, 1313–1317.
Sigman, D. M., and Boyle, E. A. (2000). Glacial/interglacial variations in atmospheric carbon dioxide. Nature 407, 859–869.
Stoll, H. M., Rosenthal, Y., and Falkowski, P. (2002). Climate proxies from Sr/Ca of coccolith calcite: calibrations from continuous culture of Emiliania Huxley. Geochim. Cosmochim. Acta 66, 927–936.
Stoll, H. M., and Schrag, D. P. (2000). Coccolith Sr/Ca as a new indicator of coccolithophorid calcification and growth rate. Geochem. Geophys. Geosyst. 1, 1–24.
Tyrell, T. (1999). The relative influence of nitrogen and phosphorus on oceanic primary production. Nature 400, 525–527.
Wang, P., Tian, J., Cheng, X., Liu, C., and Xu, J. (2003). Carbon reservoir changes preceded major ice-sheet expansion at the Mid-Brunhes event. Geology 31, 239–242.
Watson, A. J., Bakker, D. C. E., Ridgwell, A. J., Boyd, P. W., and Law, C. S. (2002). Effect of iron supply on Southern Ocean CO2 uptake and implications for glacial atmospheric CO2. Nature 407, 730–733.
Wells, P., and Okada, H. (1997). Response of nannoplankton to major changes in sea-surface temperature and movements of hydrological fronts over Site DSDP 594 (South Chatham Rise, southeastern New Zealand), during the last 130 kyr. Mar. Micropaleontol. 32, 341–363.
Winter, A., Jordan, R. W., and Roth, P. H. (1994). “Biogeography of living coccolithophores in ocean waters,” in Coccolithophores, eds A. Winter and W. G. Siesser (Cambridge: Cambridge University Press), 161–177.
Wu, J., Sunda, W., Boyle, E. A., and Karl, D. S. (2000). Phosphate depletion in the western North Atlantic Ocean. Science 289, 759–762.
Young, J. (1994). “Functions of coccoliths,” in Coccolithophores, eds A. Winter, and W. G. Siesser (Cambridge: Cambridge University Press), 63–82.
Keywords: Southern Ocean, Pleistocene, coccolithophores, phosphorus, paleoecology, paleoproductivity, geochemistry, ocean drilling program
Citation: Flores J-A, Filippelli GM, Sierro FJ and Latimer J (2012) The “White Ocean” hypothesis: a late Pleistocene Southern Ocean governed by coccolithophores and driven by phosphoru. Front. Microbio. 3:233. doi: 10.3389/fmicb.2012.00233
Received: 01 February 2012; Paper pending published: 06 March 2012;
Accepted: 07 June 2012; Published online: 02 July 2012.
Edited by:
Angelicque White, Oregon State University, USAReviewed by:
Kathleen Scott, University of South Florida, USAMatthew David Wolhowe, Oregon State University, USA
Copyright: © 2012 Flores, Filippelli, Sierro and Latimer. This is an open-access article distributed under the terms of the Creative Commons Attribution Non Commercial License, which permits non-commercial use, distribution, and reproduction in other forums, provided the original authors and source are credited.
*Correspondence: Gabriel M. Filippelli, Department of Earth Sciences, Indiana University–Purdue University Indianapolis, 723 West Michigan Street, Indianapolis, IN 46202, USA. e-mail:Z2ZpbGlwcGVAaXVwdWkuZWR1