 Gertjan Kramer1,Perry D. Moerland2,3 Rienk E. Jeeninga4 Wytze J. Vlietstra2 Jeffrey H. Ringrose3,4† Carsten Byrman2,3 Ben Berkhout4
 Dave Speijer1*
- 1 Department of Medical Biochemistry, Academic Medical Center, University of Amsterdam, Amsterdam, Netherlands
- 2 Bioinformatics Laboratory, Department of Clinical Epidemiology, Biostatistics and Bioinformatics, Academic Medical Center, University of Amsterdam, Amsterdam, Netherlands
- 3 Netherlands Proteomics Center, H.R. Kruytgebouw, Utrecht, Netherlands
- 4 Laboratory of Experimental Virology, Department of Medical Microbiology, Center for Infection and Immunity Amsterdam, Amsterdam, Netherlands
This mini-review summarizes techniques applied in, and results obtained with, proteomic studies of human immunodeficiency virus type 1 (HIV-1)–T cell interaction. Our group previously reported on the use of two-dimensional differential gel electrophoresis (2D-DIGE) coupled to matrix assisted laser-desorption time of flight peptide mass fingerprint analysis, to study T cell responses upon HIV-1 infection. Only one in three differentially expressed proteins could be identified using this experimental setup. Here we report on our latest efforts to test models generated by this data set and extend its analysis by using novel bioinformatic algorithms. The 2D-DIGE results are compared with other studies including a pilot study using one-dimensional peptide separation coupled to MSE, a novel mass spectrometric approach. It can be concluded that although the latter method detects fewer proteins, it is much faster and less labor intensive. Last but not least, recent developments and remaining challenges in the field of proteomic studies of HIV-1 infection and proteomics in general are discussed.
Introduction
Human immunodeficiency virus type 1 (HIV-1), the causative agent of AIDS, uses CD4+ T cells as a host. In order to do so efficiently the virus adapts the host cell’s intracellular metabolism. The host cell, in turn, initiates intracellular antiviral responses and signals to the host’s immune system (Lever and Jeang, 2011). Thus, HIV-1 infection and the host response trigger many physiological changes in the infected cell (Gomez and Hope, 2005). HIV-1 survives and persists in infected cells preparing them for production and release of new viral particles. Intracellular changes due to HIV-1 infection have been studied extensively, focusing on the contribution of HIV-1’s accessory proteins to these processes, using microarrays or serial analysis of gene expression (SAGE) to detect mRNA changes in the cell (Van’t Wout et al., 2003; Giri et al., 2006; Roeth and Collins, 2006; Lefebvre et al., 2011; Wu et al., 2011). Gene expression profiling with microarrays is of course easy to perform, generating large datasets quickly (Heller, 2002), but sequences must be known in advance, which SAGE does not require. SAGE, based on direct sequencing of mRNA tags, also does not use hybridization as microarrays do, leading to more reliable probing of mRNA levels. SAGE is currently being replaced by high-throughput sequencing technologies (RNA-Seq; Baginsky et al., 2010). Proteome changes upon HIV infection have also been studied in detail with mass spectrometry (Coiras et al., 2006; Chan et al., 2007; Ringrose et al., 2008; Navare et al., 2012), lately focusing on studies specifically monitoring direct interactions between viral and cellular proteins (Jager et al., 2012a,b).
Changes in gene expression patterns characterize the cellular response to HIV-1 infection. However, changes in mRNA levels are only part of the story. Often stringent correlation between mRNA and protein levels is lacking (Pradet-Balade et al., 2001). In human cells, transcription seems to explain only 30% of variation in protein levels, with translation and protein degradation contributing up to 40% (Vogel et al., 2010; Schwanhausser et al., 2011). In E. coli, relative contributions to regulation of protein levels via transcriptional and/or translational control have even been shown to vary greatly with the kind of signal the cell responds to (Kramer et al., 2010). Direct cellular responses are also strongly accompanied by coordinated protein modifications. A protein can exist in many different isoforms, each with its own specific function, with a relatively limited number of genes giving rise to vast amounts of (functionally) distinct proteins (Jensen, 2006). This is mostly accomplished by post-translational protein modification (PTM). PTMs constitute highly versatile systems allowing cells to respond very quickly to both external and internal signals, as illustrated by protein phosphorylation in signal transduction or metabolic regulation. Of course, such PTM responses cannot be detected using DNA/RNA sequencing technologies. Thus, proteomic studies using mass spectrometry to detect and quantify differences in protein expression, protein isoforms and complexes, as well as PTMs, are essential for understanding the complete set of intracellular responses to HIV-1 infection. In this way new insights and intervention strategies can be developed.
In a previous study, we used the fluorescence two-dimensional differential gel electrophoresis (2D-DIGE) technique for a comparison of uninfected and HIV-1 infected T cells (Ringrose et al., 2008). This technique starts out with minimal protein labeling using cyanine based fluorescent probes recognizing lysine. A subsequent two-dimensional gel electrophoresis allows the quantification of changes in protein expression by mixing cell extracts labeled either with Cy3 or Cy5 and running them on a single gel (Unlu et al., 1997; Alban et al., 2003). Next, differentially expressed proteins can be identified by peptide mass fingerprinting (PMF) using a matrix assisted laser-desorption time of flight (MALDI-TOF) mass spectrometer. PMF uses lists of masses of peptides (“fingerprints”) generated by tryptic digestion of proteins for their identification. NB: In this approach quantification is based on amount of fluorescence and not on ion detection level in a mass spectrometer. The study confirmed several HIV-1 effects on pathways and cellular processes previously described using stable isotope labeling combined with liquid chromatography–mass spectrometry (LC–MS; Chan et al., 2007). But there were novel findings as well, most importantly the downregulation of proteins involved in glycolysis upon full-blown HIV-1 infection, presumably part of a complete metabolic rerouting to preserve glucose for the pentose phosphate pathway, the source of riboses for subsequent viral nucleic acid synthesis (Ringrose et al., 2008). However, despite the success of this 2D-DIGE PMF approach it also comes with some limitations: the technique is very labor intensive and about two-thirds of all the differentially expressed proteins detected could not be identified using PMF because they were not present in sufficient abundance. As we are planning to extend our proteomic analysis of HIV-1 T cell interaction to subcellular fractions, a faster method would be preferable. To that end we compared the 2D-DIGE PMF with one-dimensional separation of peptides using reversed phase LC coupled to MSE (Geromanos et al., 2009) analysis, again using T cells infected with HIV-1. In this approach target proteins are digested with trypsin (as in the PMF method mentioned above), and resulting peptides (parent ions in Figure 1) are now identified as coming from certain proteins by the mass analysis of their fragments (daughter ions in Figure 1), which allows peptide sequencing [in both data-dependent modes of acquisition (DDA) and MSE applications described below] as well as protein quantitation by peptide signal abundance.
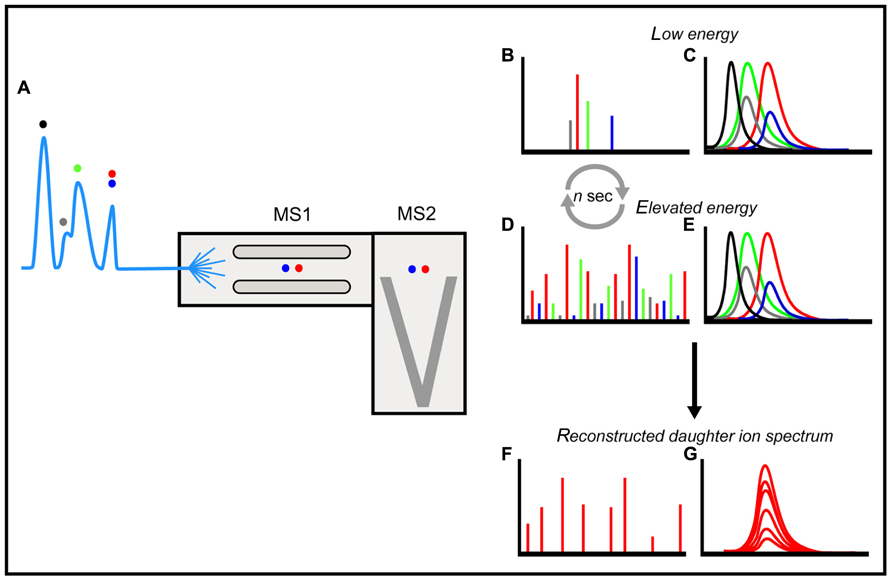
FIGURE 1. An overview of LC–MSE. Separation of peptides (colored dots) on an LC coupled to a QTOF instrument in a data-independent mode of acquisition using electrospray ionization (A). In a data-independent mode of acquisition the quadrupole (MS1) continuously allows passage of all ions, in contrast to DDA where the quadrupole selects ions for fragmentation based on their intensity. Energy in the collision cell is continuously cycled between a low and an elevated profile. This generates spectra of all parent (B) and daughter ions (D) throughout the LC–MS run in the time of flight analyzer (MS2) without bias with respect to their relative intensities. In order to reconstruct fragment ion spectra with daughter ions from a single parent only, an ion-accounting algorithm compares the retention time profiles of all individual parent ions (C) to all individual daughter ions (E) matching them on the basis of retention time profile and intensity (G). In this manner the algorithm creates a reconstructed daughter ion spectrum matched to a single precursor (F) that can be used by proteome search engines to identify peptides and link these to proteins. The unbiased data-independent scanning mode greatly expands the number of peptides – and thus of proteins – detected, compared to the DDA mode of acquisition on QTOF type instruments, especially using limited LC separations on complex mixtures to increase throughput. Adapted from (Plumb et al., 2006).
A Pilot Study Using LC–MSE
One of the most exciting new developments in proteomic analyses is the possibility to perform quantitative protein comparisons without having to introduce quantifiable labels: label-free proteomics. Here we report on the use of label-free proteomics in a pilot study of T cells (PM1 T cell line) infected with HIV-1 (LAI isolate). In this setup a novel data-independent alternate scanning technique (MSE) on a quadrupole time of flight (QTOF) instrument is used. In contrast to DDA, making up the standard method on various types of instruments used in peptide based proteomics, MSE does not select a single precursor ion for fragmentation but rather fragments “all” ions present at any given time during chromatographic separation. As such, mass spectrometric data are collected (in principle) on fragments of “all” ions instead of a subset that is selected for fragmentation during DDA analysis. This decreases bias toward selecting only highly abundant peptides and eliminates the need to measure samples multiple times in order to collect tandem-MS data for “all” ions present (Figure 1). In this manner, MSE greatly expands the number of peptides detected using limited LC-separation compared to DDA on QTOF type instruments (Geromanos et al., 2009).
A drawback of MSE is its incompatibility with quantitation schemes that make use of an amine reactive isotopic-label and specific reporter fragment ions to ascertain protein quantity such as iTRAQ (isobaric tag for relative and absolute quantification; Wiese et al., 2007). This approach was used very recently for quantitation of early effects of HIV infection (Navare et al., 2012) using multi-dimensional separation and an Orbitrap mass spectrometer (Makarov and Scigelova, 2010) in which 1448 proteins were reliably quantified. However, LC–MSE is well suited for label-free quantitation and pilot studies applying it to our model system (uninfected PM1 T cells vs. cells at the peak of HIV-1 infection) are promising. So far we could quantify 358 proteins, with at least 16 proteins clearly up- or downregulated (more than twofold). Six enzymes involved in glycolysis were identified. Consistent with our previous observations these were found either to be hardly changed or downregulated. Several other proteins found to be changed in abundance previously (Ringrose et al., 2008) were again detected, but whereas, e.g. Stathmin (Q96CE4) is downregulated as before, several 14-3-3 proteins are now upregulated instead of downregulated (see Discussion). Total numbers of identified proteins are obviously lower than in the 2D-DIGE approach, but the technique is much faster, and less labor intensive (days vs. months). Also, as lower amounts of protein are needed for analysis, smaller and more reproducible cell culture samples can be used. In the future we plan to combine this approach with in-line enrichment of phosphopeptides using titanium dioxide chromatography (Pinkse et al., 2004, 2011) to look at changes in the cellular phosphoproteome upon HIV-1 infection. In addition, LC–MSE will be used with cell lines containing an inducible HIV-1 provirus (Jeeninga et al., 2008). This allows a more synchronous induction of virus production compared to viral infection, increasing the sensitivity of the assay such that small biological changes can be detected. This will also make it feasible to discriminate between changes induced by the initial virus infection and the subsequent stage of new virus production.
Follow-up Research Using RNAi-Mediated Knockdown of Cell Factors
Follow-up study on some of the proteins identified in the 2D-DIGE study was performed with an RNA interference (RNAi) knockdown screen. Protein induction may reflect host defensive mechanisms to prevent or restrict virus infection or replication. Alternatively, such changes may represent a viral strategy to induce cellular factors facilitating specific steps of the replication cycle (cofactors). For 76 cellular targets the impact on HIV-1 replication was studied upon mRNA knockdown, using short hairpin RNA (shRNA) inhibitors from the MissionTM library (Moffat et al., 2006). For each target gene four to five shRNAs to generate stably transduced T cells were used, thus reducing the chance of scoring off-target effects. Knockdown of 38 individual mRNA targets resulted in decreased virus replication, possibly because of suppression of a viral cofactor. Of these, 27 proteins were upregulated during HIV-1 infection in our previous 2D-DIGE proteomic screen, fitting the cofactor role. For three targets an increase in viral replication was observed, raising the possibility that a viral restriction factor was hit (unpublished results).
Bioinformatic Analysis of 2D-DIGE Data
As mentioned above, one of the most severe limitations of the 2D-DIGE PMF approach lies in the fact that about two-thirds of all the differentially expressed proteins detected cannot be identified using PMF, as they are not sufficiently abundant. This reflects the major challenge in all proteomic studies: identification and (relative) quantification of proteins with lower abundancies. We detected 1920 spots, of which 15% (288) were differentially expressed at 7–10 days post-infection (p.i.; Ringrose et al., 2008). Of these 288 differentially expressed protein spots, 182 remain to be identified. However, we have some additional information regarding these unidentified protein spots: we know the pI and Mw of the protein, i.e. of the specific isoform(s) detected, which in most cases represent the most abundant, mature protein form(s). We can also surmise what pathways the proteins most likely are involved in, based on the results obtained for the ~100 identified spots. Using this information we are developing bioinformatic algorithms to come up with accurate lists of candidate differentially expressed proteins upon virus infection. Obviously, such candidates have to be confirmed experimentally, checked for instance with highly sensitive antibody-based methods such as western blotting. We developed a prioritization approach consisting of five steps (Figure 2). First, for the PMF-identified proteins the theoretical pI and Mw are computed for the mature form using “Compute pI/Mw”1. Second, two non-linear models are fitted to predict pI and Mw, respectively. Parameters of the model are estimated from the x/y-coordinates of the identified spots and the pI and Mw determined in the previous step. Next, we use these models to predict pI and Mw for unidentified spots. Third, for each unidentified spot a list of candidate proteins is determined using the estimated pI and Mw as input for TagIdent2. TagIdent requires specifying a window size for the estimated pI and Mw. Because of uncertainty in the pI and Mw values, we choose relatively large windows so that the candidate list is likely to include the correct protein. However, candidate lists thus often contain hundreds of proteins. This is addressed in the last two steps, using the principle of “guilt by association”: more likely candidate proteins share more features with already identified proteins, e.g., being present in the same pathway. In the fourth step of our algorithm the physical and/or functional interactions of the ~100 identified proteins are extracted from the Search Tool for the Retrieval of Interacting Genes (STRING) database (Szklarczyk et al., 2011). STRING covers co-occurrence in pathways, physical protein–protein interactions, co-occurrence in the abstracts of scientific reports, etc., and provides confidence scores for strengths of the associations. In step 5, candidate proteins are ranked using confidence scores by summing weighted interactions with our “identified protein” STRING set. By combining 2D-DIGE with this kind of bioinformatic algorithm it would become one of the first techniques able to identify differential proteins in the lower regions of the dynamic range.
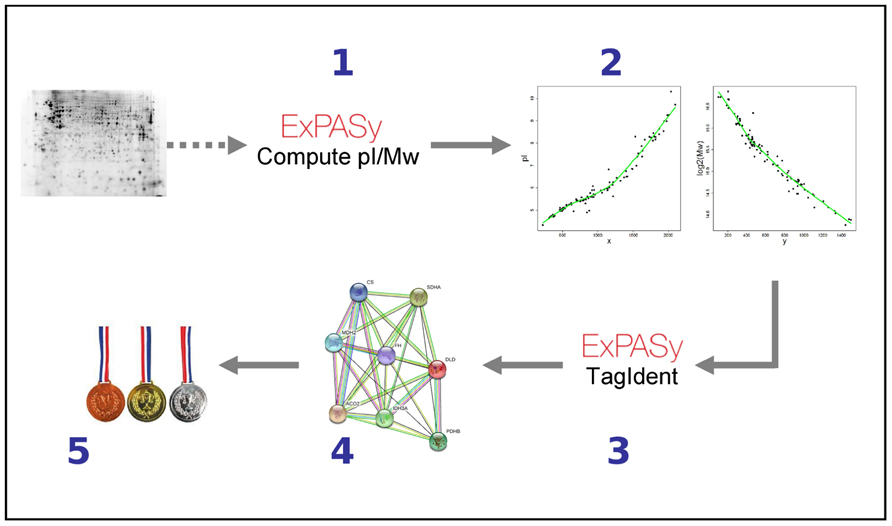
FIGURE 2. How to identify candidate proteins based on pI and Mw. For details see text.
Discussion
Comparing proteomic studies that address HIV–T cell interaction, it is observed that the various approaches yield a wide range in reported numbers of quantifiable proteins, ranging from 3255 (Chan et al., 2007) and 1448 (Navare et al., 2012) in total quantifiable proteins for techniques using multi-dimensional separation of peptides to 92 differentially expressed proteins (out of 1,920 spots) in a 2D-DIGE approach (Ringrose et al., 2008). In contrast, the numbers of differentially expressed proteins are somewhat comparable at various times p.i. Ringrose et al. (2008) reported 9 (42 h p.i.) and 92 (7–10 days p.i.) regulated proteins upon infection, while the group of Katze detected 687 (36 h p.i.) changed proteins (Chan et al., 2007) and found 266 (4 h p.i.), 60 (8 h p.i.), and 22 (20 h p.i.) proteins differentially expressed earlier on in infection (Navare et al., 2012). Although numbers can of course vary according to statistical significance settings, only a small subset of proteins is usually identified by all methods (Fahey et al., 2011). Each experimental setup yields a considerable group of proteins that are not scored by the other methods. This complementarity can be explained not only by differences in detection and quantification methods, but frequently by differences in the experimental biological systems as well. Variations include: host cell type and virus isolate (e.g., with a different receptor use and cell tropism),and timepoint of sampling. Especially the impact of this latter variable should not be underestimated. It can even determine whether differentially expressed protein(form)s are found to be up- or downregulated in the interaction between HIV-1 and its host. 14-3-3 protein epsilon (P62258) is a case in point: it is upregulated after 4 h p.i. and downregulated later on at 7–10 days p.i. (Ringrose et al., 2008). Three other 14-3-3 proteins now seem to follow suit: tau/theta (P27348), gamma (P61981), and zeta/delta (P63104) are found to be upregulated in our latest MSE experiments, but were clearly found to be downregulated in (Ringrose et al., 2008). These proteins can be phosphorylated on serine as well as threonine, e.g., influencing their migration on 2D, and consequently pattern and abundance changes can be difficult to interpret. As mentioned, an interesting recent study to look at the earliest events in HIV infection characterizing the host response at the protein level in CD4+ SUP-T1 cells 4, 8, and 20 h p.i. using HIV-1 strain LAI, was performed by Navare et al. (2012). Comparison of this study to Ringrose et al. (2008), again shows the virus–cell interaction being highly dynamic. Just a few examples: high-mobility group box 1 (P09429) and cofilin (P23528) are strongly upregulated 4 h p.i., return to “normal” 4 and 16 h later, while at 7–10 days p.i. both are downregulated; glucose-6-phosphate isomerase (P06744) is upregulated at 8 h p.i., but at 7–10 days p.i. is found to be downregulated.
Given all this complexity, it is safe to say that proteomic studies on HIV-1 in general, and on HIV–T cell interaction in particular, will continue to generate new insights. But it will not be easy to translate these snapshot datasets into a comprehensive mechanistic understanding of all interactions involved (Haarburger and Pillay, 2010; Zhang et al., 2010). As mentioned, another problem of proteomic studies is identification and quantification of proteins with lower abundancies. One of the possible solutions to do this in a relatively unbiased fashion is sampling a proteome via interaction with random hexameric peptides using Arg, Lys, His, Phe, Tyr, Trp, Leu, and Val only: proteominer beads (Boschetti and Righetti, 2008). Samples still seem to be dominated by the most abundant proteins, however. “Looking at less to see more” might be the better way ahead. Such focusing could be on the analysis of specific cellular fractions (e.g. mitochondrial preparations), or on the selective study of specific classes of protein or PTMs, such as the phosphoproteome mentioned above.
Another example of zooming in on specific protein subsets is the use of methods to enrich for cellular factors that directly interact with HIV-1 proteins. Exciting results have been obtained with such “interactome proteomics” methods. The most general approach was performed with tagged versions of all 18 HIV-1 (poly)proteins. The accessory factors Vif, Vpu, Vpr, and Nef, Tat and Rev, as well as the polyproteins Gag, Pol, and Gp160, and their processed products (MA, CA, NC, and p6; PR, RT, and IN; Gp120 and Gp41, respectively) were used as bait. Interacting proteins were subjected to proteomic analysis by tryptic digestion followed by LC–MS/MS, again using an Orbitrap (Jager et al., 2012a). Interactomics for individual HIV-1 proteins have also been reported. Vif interactomics revealed how Vif targets the antiviral APOBEC3G protein for degradation via CBF-β, using the method just described (Jager et al., 2012a,b). The Rev protein was used as bait to fish for partners in HeLa cell extracts, which were then analyzed by MudPIT (Multidimensional Protein Identification Technology) LC–MS/MS (Naji et al., 2012). “Indirect” interactomics has also been performed by expressing either wild-type Vpu or Vpu that is unable to associate with F-box protein β-TrCP in HeLa cells. Without this interaction Vpu cannot target certain cellular proteins for degradation by the proteasome. Potential targets of Vpu were then identified by quantitative proteomics using SILAC (stable isotope labeling by amino acids in cell culture) followed by LC–MS/MS (Douglas et al., 2009). Much attention has been focused on the multiple roles of the CA (capsid) protein (Mascarenhas and Musier-Forsyth, 2009) and the Tat protein (Sobhian et al., 2010).
In many cases results of proteomic studies were compared with the results of stable RNAi-knockdown experiments. Global approaches to identify host cofactors usually consist of screening for reduced viral replication upon RNAi knockdown, or enhanced replication in case a cellular restriction factor is hit (Zhou et al., 2008; An and Winkler, 2010). Such genome wide RNAi screens can easily lead to both false positives (by off-target effects) and false negatives (by inefficient knockdown). These considerations emphasize the importance of performing a concerted multi-disciplinary experimental approach, including gene expression (transcriptome analysis), RNAi and proteomic studies using different detection and labeling techniques. At the same time, such a wider survey will generate more and larger datasets in formats which are not at all easily compared: an enormous future challenge for bioinformaticians. In light of this we also stress the importance of specific, non “omic,” hypothesis driven follow-up research: not generating large new datasets but asking highly specific questions. The answers might just make integrating these large datasets a lot easier.
Conflict of Interest Statement
The authors declare that the research was conducted in the absence of any commercial or financial relationships that could be construed as a potential conflict of interest.
Footnotes
References
Alban, A., David, S. O., Bjorkesten, L., Andersson, C., Sloge, E., Lewis, S., and Currie, I. (2003). A novel experimental design for comparative two-dimensional gel analysis: two-dimensional difference gel electrophoresis incorporating a pooled internal standard. Proteomics 3, 36–44.
An, P., and Winkler, C. A. (2010). Host genes associated with HIV/AIDS: advances in gene discovery. Trends Genet. 26, 119–131.
Baginsky, S., Hennig, L., Zimmermann, P., and Gruissem, W. (2010). Gene expression analysis, proteomics, and network discovery. Plant Physiol. 152, 402–410.
Boschetti, E., and Righetti, P. G. (2008). The ProteoMiner in the proteomic arena: a non-depleting tool for discovering low-abundance species. J. Proteomics 71, 255–264.
Chan, E. Y., Qian, W. J., Diamond, D. L., Liu, T., Gritsenko, M. A., Monroe, M. E., Camp, D. G., Smith, R. D., and Katze, M. G. (2007). Quantitative analysis of human immunodeficiency virus type 1-infected CD4+ cell proteome: dysregulated cell cycle progression and nuclear transport coincide with robust virus production. J. Virol. 81, 7571–7583.
Coiras, M., Camafeita, E., Urena, T., Lopez, J. A., Caballero, F., Fernandez, B., Lopez-Huertas, M. R., Perez-Olmeda, M., and Alcami, J. (2006). Modifications in the human T cell proteome induced by intracellular HIV-1 Tat protein expression. Proteomics 6(Suppl. 1), S63–S73.
Douglas, J. L., Viswanathan, K., McCarroll, M. N., Gustin, J. K., Fruh, K., and Moses, A. V. (2009). Vpu directs the degradation of the human immunodeficiency virus restriction factor BST-2/tetherin via a {beta}TrCP-dependent mechanism. J. Virol. 83, 7931–7947.
Fahey, M. E., Bennett, M. J., Mahon, C., Jager, S., Pache, L., Kumar, D., Shapiro, A., Rao, K., Chanda, S. K., Craik, C. S., Frankel, A. D., and Krogan, N. J. (2011). GPS-Prot: a web-based visualization platform for integrating host–pathogen interaction data. BMC Bioinformatics 12, 298. doi: 10.1186/1471-2105-12-298
Geromanos, S. J., Vissers, J. P., Silva, J. C., Dorschel, C. A., Li, G. Z., Gorenstein, M. V., Bateman, R. H., and Langridge, J. I. (2009). The detection, correlation, and comparison of peptide precursor and product ions from data independent LC–MS with data dependant LC–MS/MS. Proteomics 9, 1683–1695.
Giri, M. S., Nebozhyn, M., Showe, L., and Montaner, L. J. (2006). Microarray data on gene modulation by HIV-1 in immune cells: 2000–2006. J. Leukoc. Biol. 80, 1031–1043.
Gomez, C., and Hope, T. J. (2005). The ins and outs of HIV replication. Cell. Microbiol. 7, 621–626.
Haarburger, D., and Pillay, T. S. (2010). Discovery proteomics: application to HIV infection. J. Clin. Pathol. 63, 285–287.
Heller, M. J. (2002). DNA microarray technology: devices, systems, and applications. Annu. Rev. Biomed. Eng. 4, 129–153.
Jager, S., Cimermancic, P., Gulbahce, N., Johnson, J. R., McGovern, K. E., Clarke, S. C., Shales, M., Mercenne, G., Pache, L., Li, K., Hernandez, H., Jang, G. M., Roth, S. L., Akiva, E., Marlett, J., Stephens, M., D’Orso, I., Fernandes, J., Fahey, M., Mahon, C., O’Donoghue, A. J., Todorovic, A., Morris, J. H., Maltby, D. A., Alber, T., Cagney, G., Bushman, F. D., Young, J. A., Chanda, S. K., Sundquist, W. I., Kortemme, T., Hernandez, R. D., Craik, C. S., Burlingame, A., Sali, A., Frankel, A. D., and Krogan, N. J. (2012a). Global landscape of HIV–human protein complexes. Nature 481, 365–370.
Jager, S., Kim, D. Y., Hultquist, J. F., Shindo, K., LaRue, R. S., Kwon, E., Li, M., Anderson, B. D., Yen, L., Stanley, D., Mahon, C., Kane, J., Franks-Skiba, K., Cimermancic, P., Burlingame, A., Sali, A., Craik, C. S., Harris, R. S., Gross, J. D., and Krogan, N. J. (2012b). Vif hijacks CBF-beta to degrade APOBEC3G and promote HIV-1 infection. Nature 481, 371–375.
Jeeninga, R. E., Westerhout, E. M., van Gerven, M. L., and Berkhout, B. (2008). HIV-1 latency in actively dividing human T cell lines. Retrovirology 5, 37.
Jensen, O. N. (2006). Interpreting the protein language using proteomics. Nat. Rev. Mol. Cell Biol. 7, 391–403.
Kramer, G., Sprenger, R. R., Nessen, M. A., Roseboom, W., Speijer, D., de Jong, L., de Mattos, M. J., Back, J., and de Koster, C. G. (2010). Proteome-wide alterations in Escherichia coli translation rates upon anaerobiosis. Mol. Cell. Proteomics 9, 2508–2516.
Lefebvre, G., Desfarges, S., Uyttebroeck, F., Munoz, M., Beerenwinkel, N., Rougemont, J., Telenti, A., and Ciuffi, A. (2011). Analysis of HIV-1 expression level and sense of transcription by high-throughput sequencing of the infected cell. J. Virol. 85, 6205–6211.
Lever, A. M., and Jeang, K. T. (2011). Insights into cellular factors that regulate HIV-1 replication in human cells. Biochemistry 50, 920–931.
Makarov, A., and Scigelova, M. (2010). Coupling liquid chromatography to Orbitrap mass spectrometry. J. Chromatogr. A 25, 2938–2945.
Mascarenhas, A. P., and Musier-Forsyth, K. (2009). The capsid protein of human immunodeficiency virus: interactions of HIV-1 capsid with host protein factors. FEBS J. 276, 6118–6127.
Moffat, J., Grueneberg, D. A., Yang, X., Kim, S. Y., Kloepfer, A. M., Hinkle, G., Piqani, B., Eisenhaure, T. M., Luo, B., Grenier, J. K., Carpenter, A. E., Foo, S. Y., Stewart, S. A., Stockwell, B. R., Hacohen, N., Hahn, W. C., Lander, E. S., Sabatini, D. M., and Root, D. E. (2006). A lentiviral RNAi library for human and mouse genes applied to an arrayed viral high-content screen. Cell 124, 1283–1298.
Naji, S., Ambrus, G., Cimermancic, P., Reyes, J. R., Johnson, J. R., Filbrandt, R., Huber, M. D., Vesely, P., Krogan, N. J., Yates, J. R. III, Saphire, A. C., and Gerace, L. (2012). Host cell interactome of HIV-1 Rev includes RNA helicases involved in multiple facets of virus production. Mol. Cell. Proteomics 4, M111.
Navare, A. T., Sova, P., Purdy, D. E., Weiss, J. M., Wolf-Yadlin, A., Korth, M. J., Chang, S. T., Proll, S. C., Jahan, T. A., Krasnoselsky, A. L., Palermo, R. E., and Katze, M. G. (2012). Quantitative proteomic analysis of HIV-1 infected CD4+ T cells reveals an early host response in important biological pathways: protein synthesis, cell proliferation, and T-cell activation. Virology 429, 37–46.
Pinkse, M. W., Lemeer, S., and Heck, A. J. (2011). A protocol on the use of titanium dioxide chromatography for phosphoproteomics. Methods Mol. Biol. 753, 215–228.
Pinkse, M. W., Uitto, P. M., Hilhorst, M. J., Ooms, B., and Heck, A. J. (2004). Selective isolation at the femtomole level of phosphopeptides from proteolytic digests using 2D-NanoLC-ESI-MS/MS and titanium oxide precolumns. Anal. Chem. 76, 3935–3943.
Plumb, R. S., Johnson, K. A., Rainville, P., Smith, B. W., Wilson, I. D., Castro-Perez, J. M., and Nicholson, J. K. (2006). UPLC/MS(E); a new approach for generating molecular fragment information for biomarker structure elucidation. Rapid Commun. Mass Spectrom. 20, 1989–1994.
Pradet-Balade, B., Boulme, F., Beug, H., Mullner, E. W., and Garcia-Sanz, J. A. (2001). Translation control: bridging the gap between genomics and proteomics? Trends Biochem. Sci. 26, 225–229.
Ringrose, J., Jeeninga, R. E., Berkhout, B., and Speijer, D. (2008). Proteomic studies reveal coordinated changes in T cell expression patterns upon HIV-1 infection. J. Virol. 82, 4320–4330.
Roeth, J. F., and Collins, K. L. (2006). Human immunodeficiency virus type 1 Nef: adapting to intracellular trafficking pathways. Microbiol. Mol. Biol. Rev. 70, 548–563.
Schwanhausser, B., Busse, D., Li, N., Dittmar, G., Schuchhardt, J., Wolf, J., Chen, W., and Selbach, M. (2011). Global quantification of mammalian gene expression control. Nature 473, 337–342.
Sobhian, B., Laguette, N., Yatim, A., Nakamura, M., Levy, Y., Kiernan, R., and Benkirane, M. (2010). HIV-1 Tat assembles a multifunctional transcription elongation complex and stably associates with the 7SK snRNP. Mol. Cell 38, 439–451.
Szklarczyk, D., Franceschini, A., Kuhn, M., Simonovic, M., Roth, A., Minguez, P., Doerks, T., Stark, M., Muller, J., Bork, P., Jensen, L. J., and von Mering C. (2011). The STRING database in 2011: functional interaction networks of proteins, globally integrated and scored. Nucleic Acids Res. 39, D561–D568.
Unlu, M., Morgan, M. E., and Minden, J. S. (1997). Difference gel electrophoresis: a single gel method for detecting changes in protein extracts. Electrophoresis 18, 2071–2077.
Van’t Wout, A., Lehrman, G. K., Mikheeva, S. A., O’Keeffe, G. C., Katze, M. G., Bumgarner, R. E., Geiss, G. K., and Mullins, J. I. (2003). Cellular gene expression upon human immunodeficiency virus type 1 infection of CD4(+)-T-cell lines. J. Virol. 77, 1392–1402.
Vogel, C., Abreu, R. S., Ko, D., Le, S. Y., Shapiro, B. A., Burns, S. C., Sandhu, D., Boutz, D. R., Marcotte, E. M., and Penalva, L. O. (2010). Sequence signatures and mRNA concentration can explain two-thirds of protein abundance variation in a human cell line. Mol. Syst. Biol. 6, 400.
Wiese, S., Reidegeld, K. A., Meyer, H. E., and Warscheid, B. (2007). Protein labeling by iTRAQ: a new tool for quantitative mass spectrometry in proteome research. Proteomics 7, 340–350.
Wu, J. Q., Dwyer, D. E., Dyer, W. B., Yang, Y. H., Wang, B., and Saksena, N. K. (2011). Genome-wide analysis of primary CD4+ and CD8+ T cell transcriptomes shows evidence for a network of enriched pathways associated with HIV disease. Retrovirology 8, 18.
Zhang, L., Zhang, X., Ma, Q., and Zhou, H. (2010). Host proteome research in HIV infection. Genomics Proteomics Bioinformatics 8, 1–9.
Keywords: DIGE, HIV-1, host–virus interaction, proteomics, LC–MS/MSE
Citation: Kramer G, Moerland PD, Jeeninga RE, Vlietstra WJ, Ringrose JH, Byrman C, Berkhout B and Speijer D (2012) Proteomic analysis of HIV–T cell interaction: an update. Front. Microbio. 3:240. doi: 10.3389/fmicb.2012.00240
Received: 05 April 2012; Accepted: 15 June 2012;
Published online: 04 July 2012.
Edited by:
Kevin Coombs, University of Manitoba, CanadaReviewed by:
Wataru Nomura, Tokyo Medical and Dental University, JapanKevin Coombs, University of Manitoba, Canada
Copyright: © 2012 Kramer, Moerland, Jeeninga, Vlietstra, Ringrose, Byrman, Berkhout and Speijer. This is an open-access article distributed under the terms of the Creative Commons Attribution Non Commercial License, which permits non-commercial use, distribution, and reproduction in other forums, provided the original authors and source are credited.
*Correspondence: Dave Speijer, K1–262, Medical Biochemistry, Academic Medical Center, University of Amsterdam, Meibergdreef 15, 1105 AZ Amsterdam, Netherlands. e-mail:ZC5zcGVpamVyQGFtYy51dmEubmw=
†Present address: Biomolecular Mass Spectrometry and Proteomics, Bijvoet Center for Biomolecular Research, Utrecht Institute for Pharmaceutical Sciences, Utrecht University, Utrecht, Netherlands