 Adam R. Rivers
 Andrew S. Burns
 Leong-Keat Chan
 Mary Ann Moran
- 1United States Department of Energy, Joint Genome Institute, Walnut Creek, CA, USA
- 2Department of Marine Sciences, University of Georgia, Athens, GA, USA
- 3WaferGen Bio-Systems Inc., Fremont, CA, USA
In oligotrophic ocean waters where bacteria are often subjected to chronic nutrient limitation, community transcriptome sequencing has pointed to the presence of highly abundant small RNAs (sRNAs). The role of sRNAs in regulating response to nutrient stress was investigated in a model heterotrophic marine bacterium Ruegeria pomeroyi grown in continuous culture under carbon (C) and nitrogen (N) limitation. RNAseq analysis identified 99 putative sRNAs. Sixty-nine were cis-encoded and located antisense to a presumed target gene. Thirty were trans-encoded and initial target prediction was performed computationally. The most prevalent functional roles of genes anti-sense to the cis-sRNAs were transport, cell-cell interactions, signal transduction, and transcriptional regulation. Most sRNAs were transcribed equally under both C and N limitation, and may be involved in a general stress response. However, 14 were regulated differentially between the C and N treatments and may respond to specific nutrient limitations. A network analysis of the predicted target genes of the R. pomeroyi cis-sRNAs indicated that they average fewer connections than typical protein-encoding genes, and appear to be more important in peripheral or niche-defining functions encoded in the pan genome.
Introduction
Small non-coding RNAs are common regulators of gene expression in bacteria, including those in marine environments (Shi et al., 2009; Gifford et al., 2011). Research on marine cyanobacteria has identified several key sRNAs important in the regulation of photosystem responses to light stress in Synechococcus (Axmann et al., 2005; Voss et al., 2009; Gierga et al., 2012), response to iron limitation in Prochlorococcus (Steglich et al., 2008), and managing energy requirements in Richelia (Hilton et al., 2014). The sRNAs of pathogenic marine Vibrio have also been investigated, particularly sRNAs involved in the transition to virulence (Bardill and Hammer, 2012). Less is known about the role of sRNAs in non-pathogenic heterotrophic marine bacteria and their involvement in managing chronic nutrient limitation.
Heterotrophic marine bacteria are the primary recyclers of organic matter in the ocean, making their regulation strategies during C and N limitation important facets of marine element cycles. They must respond quickly to heterogeneity in C and nutrient availability on the microscale (resulting from patchy distributions of phytoplankton cells and nutrient plumes) and macroscale (resulting from terrestrial inputs, upwelling events, and phytoplankton blooms) (Azam and Malfatti, 2007; Stocker, 2012). For the model marine heterotroph Ruegeria pomeroyi DSS-3, previous studies indicate that the bacterium scavenges for alternate sources of organic C and reworks the ratios of major biomolecule classes when C limited, and exerts tight control over N uptake and export when N limited. Resource-driven changes in C:N ratios of up to 2.5-fold and in C:P ratios of up to 6-fold have been measured in R. pomeroyi biomass (Chan et al., 2012).
Several sRNAs are already known to be involved in bacterial regulation under C limitation. One of the first bacterial sRNAs discovered was Spot 42 in Escherichia coli (Sahagan and Dahlberg, 1979), which regulates expression of the galactose operon during growth on glucose (Møller et al., 2002). The sRNA SgrS controls accumulation of sugar in E. coli by down-regulating transport when levels of glucose-6-phosphate increase in the cell (Vanderpool and Gottesman, 2004). Mannitol transport is regulated by an sRNA in Vibrio cholerae (Mustachio et al., 2012).
Small RNAs involved in nitrogen metabolism have also been identified. sRNA NsiR4, discovered in the freshwater cyanobacterium Synechocystis sp. PCC 6803, regulates the expression of glutamine synthetase across a range of cyanobacteria (Klähn et al., 2015). In certain Gammaproteobacteria, sRNA GvcB regulates the uptake of peptides by ABC transporters (Urbanowski et al., 2000). sRNA NrsZ is induced under nitrogen limitation and helps induce swarming motility and rhamnolipid production in Pseudomonas aeruginosa PAO1 (Wenner et al., 2014).
To better understand the role of sRNAs in cellular regulation of C and N limitation, we sequenced transcripts from Ruegeria pomeroyi DSS-3 during growth in continuous culture and identified expressed sRNAs. The design allowed us to discriminate between general stress sRNAs (produced under both C and N limitation) and sRNAs specific to either C or N limitation. A study of R. pomeroyi sRNAs during growth on organic sulfur compounds (Burns, unpublished data) allowed us to also identify sRNAs that may be constitutively expressed. To further understand how this heterotrophic marine bacterium uses sRNA-based regulation, network analysis methods determined whether sRNAs were engaged primarily in the regulation of central metabolic processes or whether they played more important roles in peripheral or niche-defining processes.
Methods
Culturing
R. pomeroyi DSS-3 cells used for transcriptome sequencing and RT-qPCR analysis were grown in 200 ml C- and N-limited chemostats at a dilution rate of 0.042 h−1. Continuous culturing was used in this study in order to evaluate sRNA transcription under chronic nutrient limitation rather than the physiologically distinct process of nutrient starvation and shift to stationary phase. A basal medium with a salinity of 25 was amended with vitamins and trace metals (Table S1) and modified to establish C limitation (1 mmol l−1 glucose and 2.8 mmol l−1 NH4Cl) or N limitation (4.5 mmol l−1 glucose and 0.26 mmol l−1 NH4Cl), with three replicates run in each condition. The appropriate concentrations of limiting nutrients to produce similar biomass were determined in initial experiments. Cells were inoculated at an OD600 of 0.05 (~7.3 × 10⁶ cells ml−1) and cultured initially with the outflow pump turned off. After ~16 h, the flow carrying the feed medium was started. Cell cultures were mixed by constant stirring and temperature was maintained at 30°C using a circulating water bath. Air was bubbled into the culture at a flow rate of 2 ml min−1. At steady state, cells maintained an OD600 of 0.3. Additional details of the chemostat design are found in Chan et al. (2012). Exponential and stationary phase cultures of R. pomeroyi grown in ½ YTSS medium (González and Moran, 1997) were also obtained and used to confirm sRNA sizes by Northern blotting (see below).
Transcriptomics
Samples of steady-state R. pomeroyi DSS-3 cells (45 ml; ~2 × 10⁹ cells) were collected from chemostats after five volume exchanges. An RNA stabilization solution (95% ethanol 5% phenol) was added to constitute 10% of the total volume and cells were pelleted by centrifugation at 4500 × g. Pellets were stored frozen at −80°C until processing. For RNA extraction, pellets were thawed and extracted using TriReagent (Molecular Research Center, Cincinnati, OH, USA). DNA was removed by the TURBO DNA-free kit (Applied Biosystems/Ambion, Austin, TX). Purified RNA was depleted of rRNA with the MicrobeExpress Kit (Ambion/Applied Biosystems, Austin, TX) and the mRNA-enriched RNA was subsequently amplified using a strand-specific protocol (MessageAmpII-Bacteria Kit; Ambion/Applied Biosystems). Using the SOLiD Whole Transcriptome Analysis Kit (Applied Biosystems), 5 μg of amplified mRNA from six samples (triplicates from both the C- and N-limitation treatments) were fragmented with RNaseIII and purified and concentrated with the RiboMinus kit (Invitogen). mRNA was examined for fragment length (Agilent 2100 Bioanalyzer) to ensure that the majority were in the 100–200 nt range. All procedures for adaptor ligation and cDNA synthesis were conducted according to the SOLiD protocol. Resultant cDNA was purified and concentrated using the MinElute PCR Purification Kit (Invitrogen), heat-denatured at 95°C, run on a Novex 6% TBE-Urea Gel (Invitrogen) under denaturing conditions with a 50 bp DNA ladder, and stained with SYBR Gold nucleic acid stain. Gel bands containing 100–200 nt cDNA (insert size 50–150 nt) were used for PCR amplification of cDNA using AmpliTaq DNA Polymerase. PCR was carried out with a 5′ SOLiD primer and a barcoded 3′ primer (using a unique barcode for each sample) for 16 cycles. Amplified cDNA was purified and concentrated using PureLink PCR Micro Kit (Invitrogen). Samples were sent to University of Washington for sequencing using a SOLiD system.
Sequence data were mapped to the genome of R. pomeroyi DSS-3 [accession numbers CP000031.2 (chromosome) and CP000032.1 (megaplasmid)] using Bowtie version 0.12.9 (Langmead et al., 2009). Mapping was done in colorspace format to increase efficiency, allowing two mismatches per sequence and a 3′ trimming value of 17. BAM format files from Bowtie were analyzed in SeqMonk (http://www.bioinformatics.bbsrc.ac.uk/projects/seqmonk/). Putative sRNAs were identified by manually searching for RNA reads in intergenic regions or antisense to genes (Figure 1). Regions resembling 5′ untranslated regions were omitted. DESeq2 version 1.4.5 was used to analyze putative sRNAs for differential regulation under C and N limitation. Gene count data from both putative sRNAs and mRNAs were analyzed together since the normalization method (trimmed mean of means) assumed that a fraction of the genes did not change in abundance. Comparisons were made using an exact negative binomial test. For cis-sRNAs, the regulatory target was predicted to be the gene on the antisense strand. Not all cis-sRNAs bind and regulate their antisense transcript efficiently (Georg and Hess, 2011) but this prediction represents the most likely target if an interaction is present. For trans-sRNAs, the target was predicted using TargetRNA2 (Kery et al., 2014). The raw reads, BAM mapping files, and count matrix data have been deposited in EBI's ArrayExpress under accession number E-MTAB-4468.
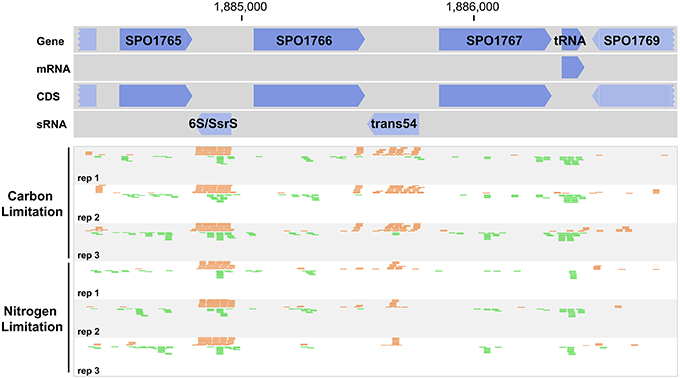
Figure 1. Read mapping pattern indicative of sRNAs encoded in intergenic regions of the Ruegeria pomeroyi genome. Orange and green reads indicate mapping on the positive and negative strand, respectively. Reads are truncated for the 6S/SsrS region, which had very high coverage.
Northern Blotting
DNA probes to central regions of abundant sRNAs were designed using Primer 3 (Untergasser et al., 2012; Table S2). The probes were labeled with biotin by modifying a procedure from Pierce Biotechnology (Rockford, IL). Hydrazide biotin was dissolved to a concentration of 50 mM in dimethyl sulfoxide (DMSO) and then diluted 1:10 in 0.1 M imadizole (pH 6). Between 7.5 and 15 nmol of oligonucleotide and 6.5 μmol of 1-ethyl-3-[3-dimethylaminopropyl]carbodiimide hydrochloride (EDC) were dissolved in 10 μl of phosphate-buffered saline. Twenty-five μl of the hydrazide biotin solution was added and the reaction was incubated at 50°C for 2 h. Labeled probe was purified by ethanol precipitation. Biotinylated RNA markers suitable for bacterial sRNA work were not commercially available, so a ladder was synthesized from the RNA Century Plus Marker Template (Life Technologies, Carlsbad, CA) using a T7 High Yield RNA Synthesis Kit (New England Biolabs, Ipswich, MA) with biotin-11-dCTP. Products were purified by 3 rounds of ethanol precipitation. The ladder is now commercially available from KeraFast (Catalog # EGA701; Boston, MA).
For each exponential and stationary phase sample, 30 μg of total RNA was separated on a 7 M urea 6% polyacrylamide gel. The gel was electro-blotted onto a nylon membrane, and RNA was crosslinked to the membrane by UV light. Probes were denatured, then hybridized overnight in ULTRAHyb-Oligo hybridization buffer (Ambion, Austin, TX). Northern blotting was carried out using the Chemiluminescent Nucleic Acid Detection Kit (Pierce Biotechnology, Rockford, IL). The size of sRNAs were estimated by measuring the migration of standard and sample bands in ImageJ (Schneider et al., 2012) and performing a regression of the standards using a Bayesian generalized linear model (gamma family, inverse link function) in the R package “arm” (Gelman and Hill, 2007).
Reverse Transcription Quantitative PCR
Reverse transcription quantitative PCR (RT-qPCR) was carried out using chemostat RNA for sRNAs that were detected by Northern blotting and/or were significantly differentially expressed in the transcriptome experiments (Table 1). Primers were designed for sixteen sRNA genes plus the control genes rpoC and gyrA (Table S3). Two technical replicates were run for each of the 3 biological replicates for C- and N-limited chemostats. Amplification efficiencies were calculated using a dilution series (n = 8) of purified genes amplified by PCR. Data were analyzed using the R package MCMC.pqcr (Matz et al., 2013) in “classic” normalization mode in which control genes were used to account for any systematic sample variation.
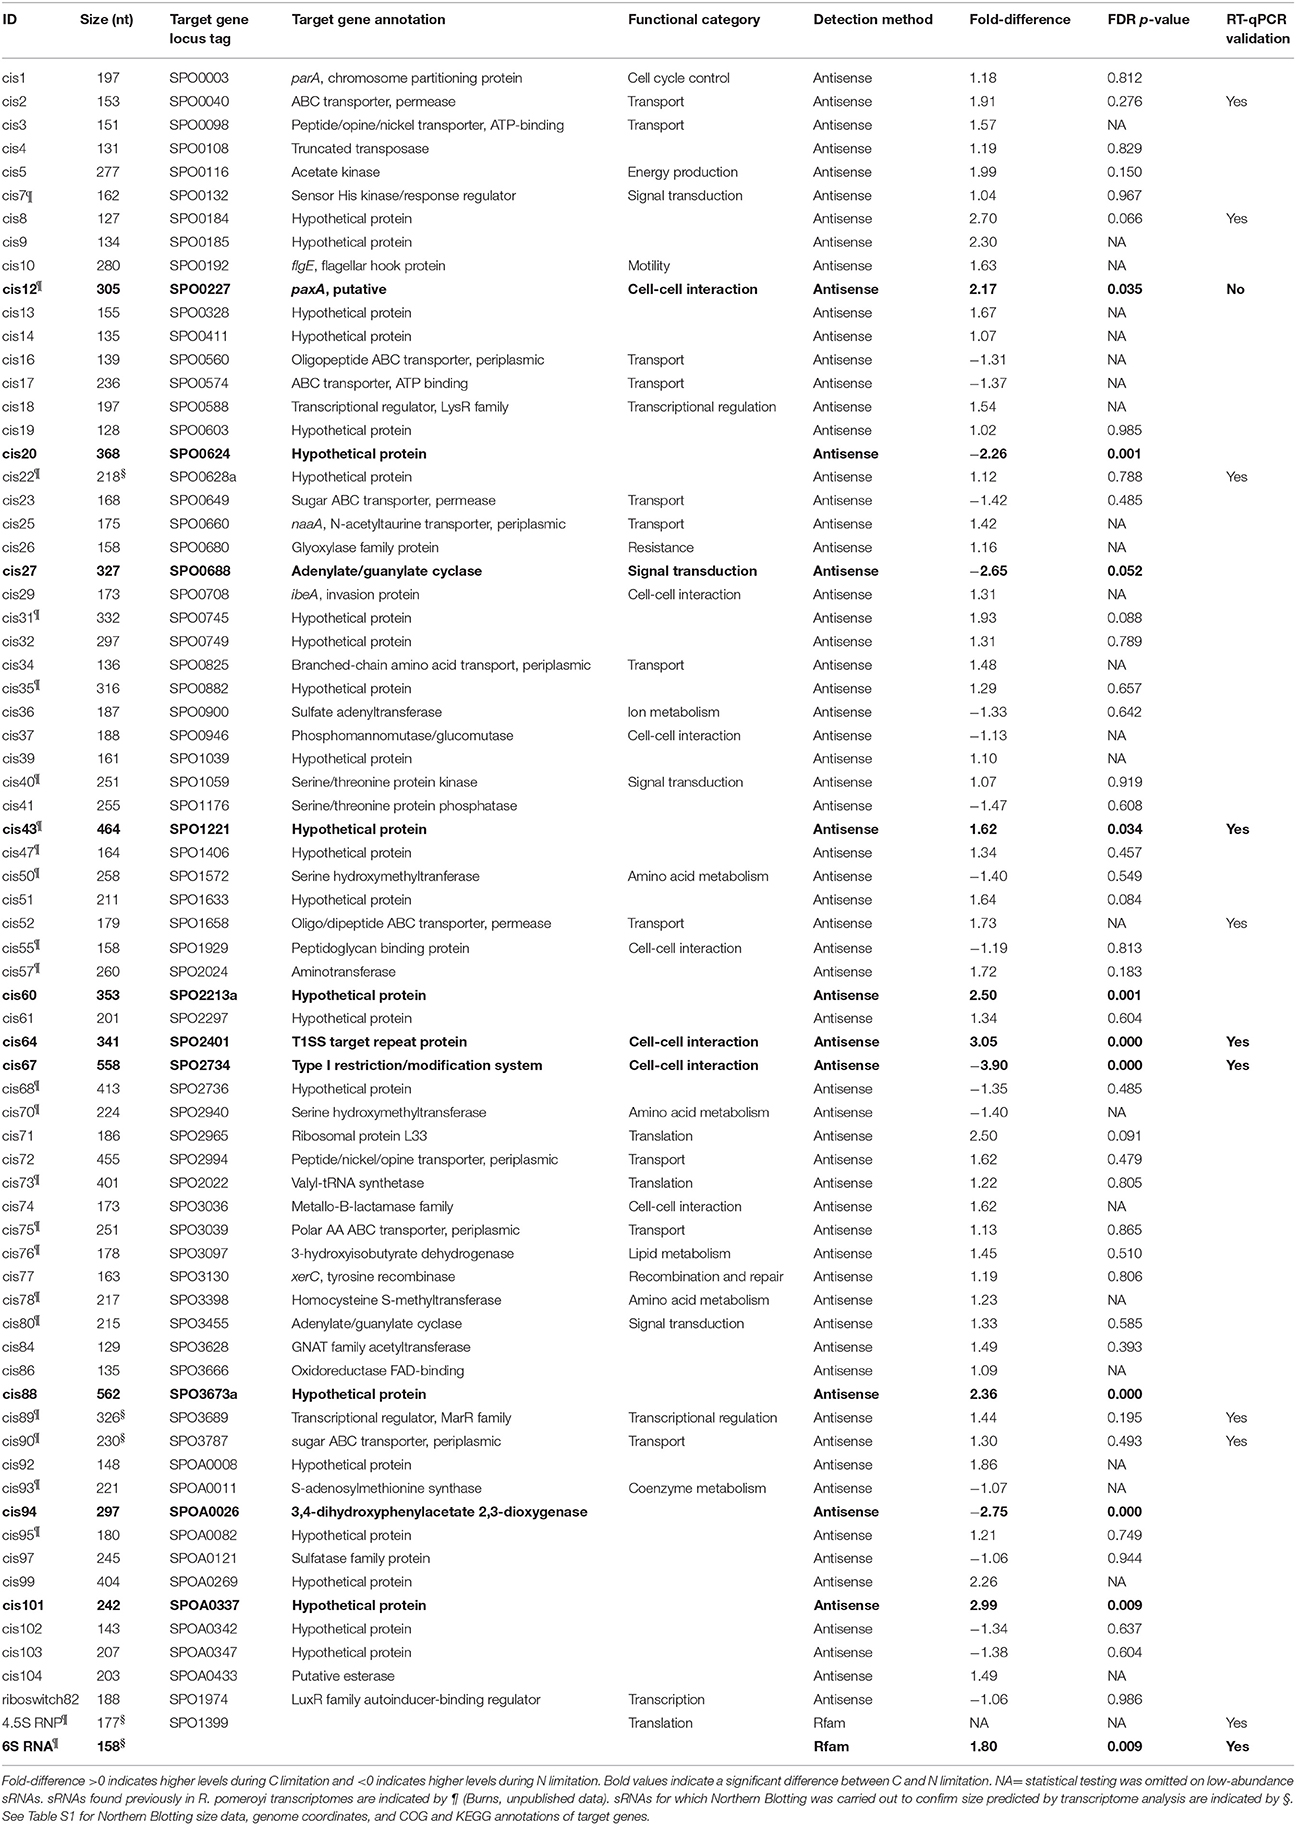
Table 1. Cis and known regulatory sRNAs identified during growth of Ruegeria pomeroyi under C- and N-limited conditions.
Network Analysis
A metabolic network of R. pomeroyi was downloaded in BioPax format from BioCyc version 19 using Pathway Tools (Caspi et al., 2014). The data were imported as a directed network into Cytoscape version 3.2.1 using the SIF import filter (Smoot et al., 2011). Proteins linked by sequential catalysis were selected and the attributes of proteins predicted to be regulated by sRNAs were analyzed relative to all protein nodes in the network. Exponential-family random graph model (ERGM) analysis was done with the statnet version 2015.11.0 package (Handcock et al., 2008) in R and the effect of nodetype on the number of edges was modeled by a Markov chain process.
Results
sRNA Identified in R. pomeroyi DSS-3
A total of 99 uncharacterized sRNAs were found in R. pomeroyi under the growth conditions tested here. Another 3 non-coding RNAs representing known regulators were also found, including a homolog to a cobalamin riboswitch, a 6S RNA which typically associates with the RNA polymerase holoenzyme complex during stationary phase, and the 4.5S or signal recognition particle RNA which directs proteins to the cytoplasmic membrane (Table 1). sRNAs are defined by their position in the genome relative to their target genes, with cis-encoded sRNAs located antisense to their target and trans-encoded sRNAs spatially distant from their target(s) in intergenic regions of the genome. Cis-sRNAs often form high identity duplexes with the target transcript due to extensive complementarity, while trans-sRNAs form short, imperfect duplexes with limited complementarity to their mRNAs (Storz et al., 2011). The sRNAs identified in this study consisted of 69 cis-sRNAs and 30 trans-sRNAs (Figure 2).
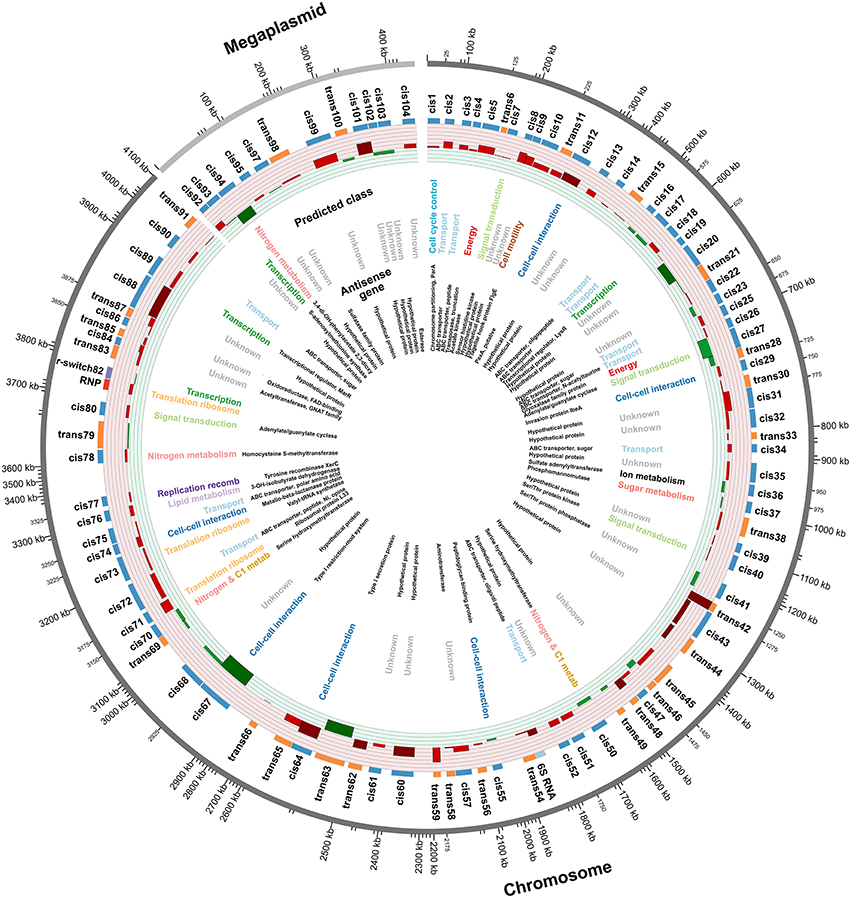
Figure 2. Summary of sRNAs identified in the R. pomeroyi transcriptome during C- and N-limited growth. Outer-to-inner rings: position in the R. pomeroyi chromosome or megaplasmid; sRNA ID; sRNA relative size and location, color-coded according to cis (blue) or trans (orange) mechanisms; sRNA expression level, color coded as higher during C-limited growth (red), significantly higher during C-limited growth (dark red), higher during N-limited growth (green) or significantly higher during N-limited growth (dark green), with each ring representing increments of 0.5 log2-fold units of differential expression; functional category of genes antisense to cis-sRNAs; annotation of genes antisense to cis-sRNAs.
Differential expression of sRNAs from C- and N-limited chemostat cultures was used to identify sRNAs potentially involved in nutrient-specific responses. A total of 14% of the sRNAs (14 out of 99) were differentially expressed between the two conditions compared with 10% of the 4252 protein coding genes in the transcriptome (Chan et al., 2012). More sRNAs were upregulated in the C limitation condition compared to the N limitation condition (10 of 14) (Table 1), and both cis- and trans-encoded sRNA were significantly regulated in similar proportions (Figure 2).
To independently confirm the presence and size of sRNAs identified by transcriptome sequencing, Northern blotting was conducted for 11 abundant sRNAs. This analysis was carried out on cells grown to exponential phase (non-limiting conditions) and stationary phase (limiting conditions) because of constraints in the amount of RNA available from the chemostats. Blotting under these different conditions confirmed the presence of 8 of the sRNAs, most of which were present at higher levels in stationary phase cells compared to exponentially growing cells (Figure 3). For 4 of those, the size estimated from the transcriptome was within the 95% confidence interval of the size estimated from Northern blotting (Table S4). The 4 that fell outside the confidence intervals were all smaller than predicted from the transcriptome data, suggestive of processing of the sRNAs. To validate sRNAs with RNA obtained directly from the chemostats, reverse transcription quantitative PCR was run for sRNAs that were either significantly differentially expressed or abundant enough to be chosen for Northern blotting. Fourteen of the 16 sRNAs tested were detected; only trans42 and cis12 could not be validated by qRT-PCR (Table 1).
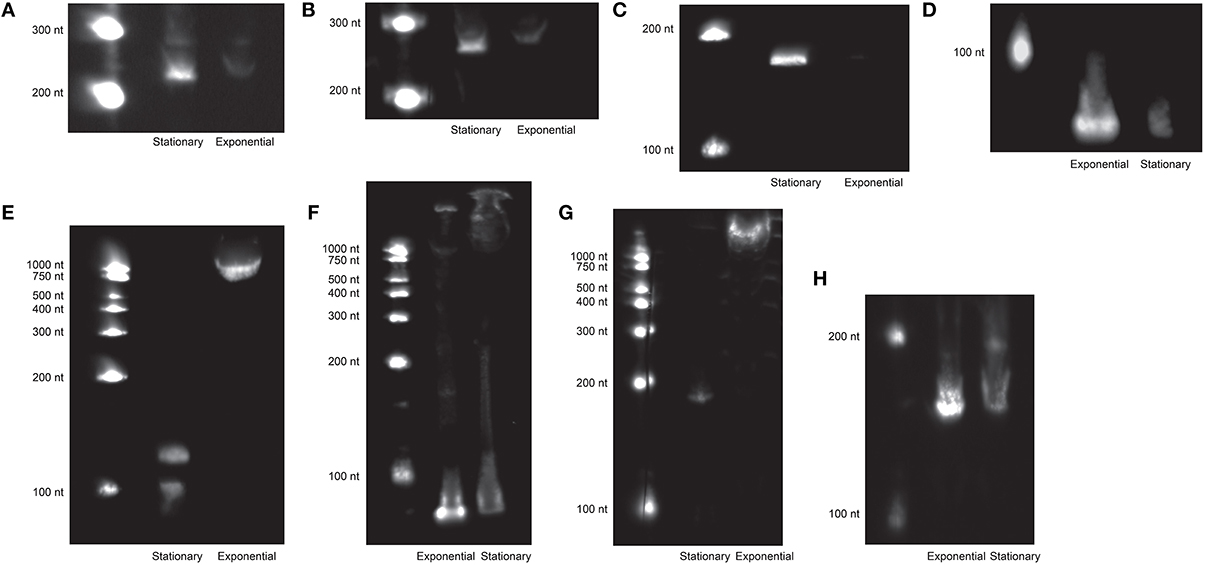
Figure 3. Eight sRNAs were detected by Northern blotting (out of 11 tested). RNA on each blot is from stationary and exponential phase cultures, as indicated. (A), cis-22; (B), trans-44; (C), trans-69; (D), trans-42; (E), trans-62; (F), 4.5S RNP; (G), cis-89; (H), 6S RNA.
A previous analysis of transcription patterns of protein-encoding genes during R. pomeroyi growth under nutrient limiting conditions identified 190 that genes were exclusively responsive to C, N, P, or S limitation (Chan et al., 2012). Only a few of these were identified as potential targets of sRNA regulation: three genes with unknown function (SPO491, SPO1221, and SPOA0337), a response regulator (SPO3223), and paxA (SPO0227), whose function is discussed below.
Functional Roles
The functional category with the highest number of genes opposite the 69 cis-sRNAs was transport (Figure 2). All 11 transporter system proteins identified here are members of the ATP binding cassette family (ABC transporters) which is notable since R. pomeroyi genome also contains 39 tripartite ATP-independent periplasmic (TRAP) transporters (Moran et al., 2004). ABC transporters consume ATP when substrates are taken into the cell, while TRAP transporters rely on a sodium gradient, raising the possibility that R. pomeroyi more closely regulates its energetically expensive transporters. None of the sRNAs that targeted transporters had significantly different expression under C vs. N limitation. Bacterial ABC transporters typically have a periplasmic binding protein, one or two transmembrane proteins, and an ATPase, and all three protein types appeared in the target gene list for sRNA regulation.
The next largest functional category of genes antisense to cis-sRNAs included genes mediating cell-cell interactions, which included sRNAs predicted to regulate a gene involved in lipopolysaccharide biosynthesis (cis37) as well as the gene encoding invasion protein IbeA, shown to be involved in colonization by pathogenic E. coli (cis29) (Wang et al., 2011). Also in this functional category, sRNA cis12 was antisense to paxA, a gene encoding an RTX-like toxin that can play a role in bacterial toxicity (Kuhnert et al., 2000), while cis64 was antisense to a Type I secretion system protein that is required for export of RTX-like toxins (Linhartová et al., 2010). Other sRNAs involved in regulating protein targets potentially involved in cell-cell interactions were cis67, antisense to a Type I restriction modification gene (significantly lower under C limitation), and cis74, regulating a protein predicted to provide resistance to beta-lactam antibiotics.
Other functional categories of genes antisense to cis-sRNAs included nitrogen metabolism (4 sRNAs, none were differentially expressed) and gene regulation (6 sRNAs, 1 was significantly higher under N limitation). Twenty-four of the cis-sRNAs had hypothetical genes identified as their potential regulatory target.
Target gene prediction is more challenging for trans-sRNAs because they typically form imperfect and short RNA-RNA hybrids with their targets (Pain et al., 2015). Potential target genes for the R. pomeroyi trans-sRNAs were predicted computationally (TargetRNA2; p < 0.01), with the number of predicted gene targets ranging from 0 to 13 per sRNA (Table 2). Functional assignments of predicted targets were dominated by the categories of amino acid metabolism, nucleic acid metabolism, coenzyme metabolism, and transport. Functional similarity among predicted targets for a given sRNA provides a hypothesis regarding the role of trans-sRNAs in regulation. Assigned functions of predicted targets were quite diverse for most of the R. pomeroyi trans-sRNAs, although trans28 had several predicted target genes involved in protein catabolism, and trans58 had target genes with assigned roles in cell membrane structure (Table 2).
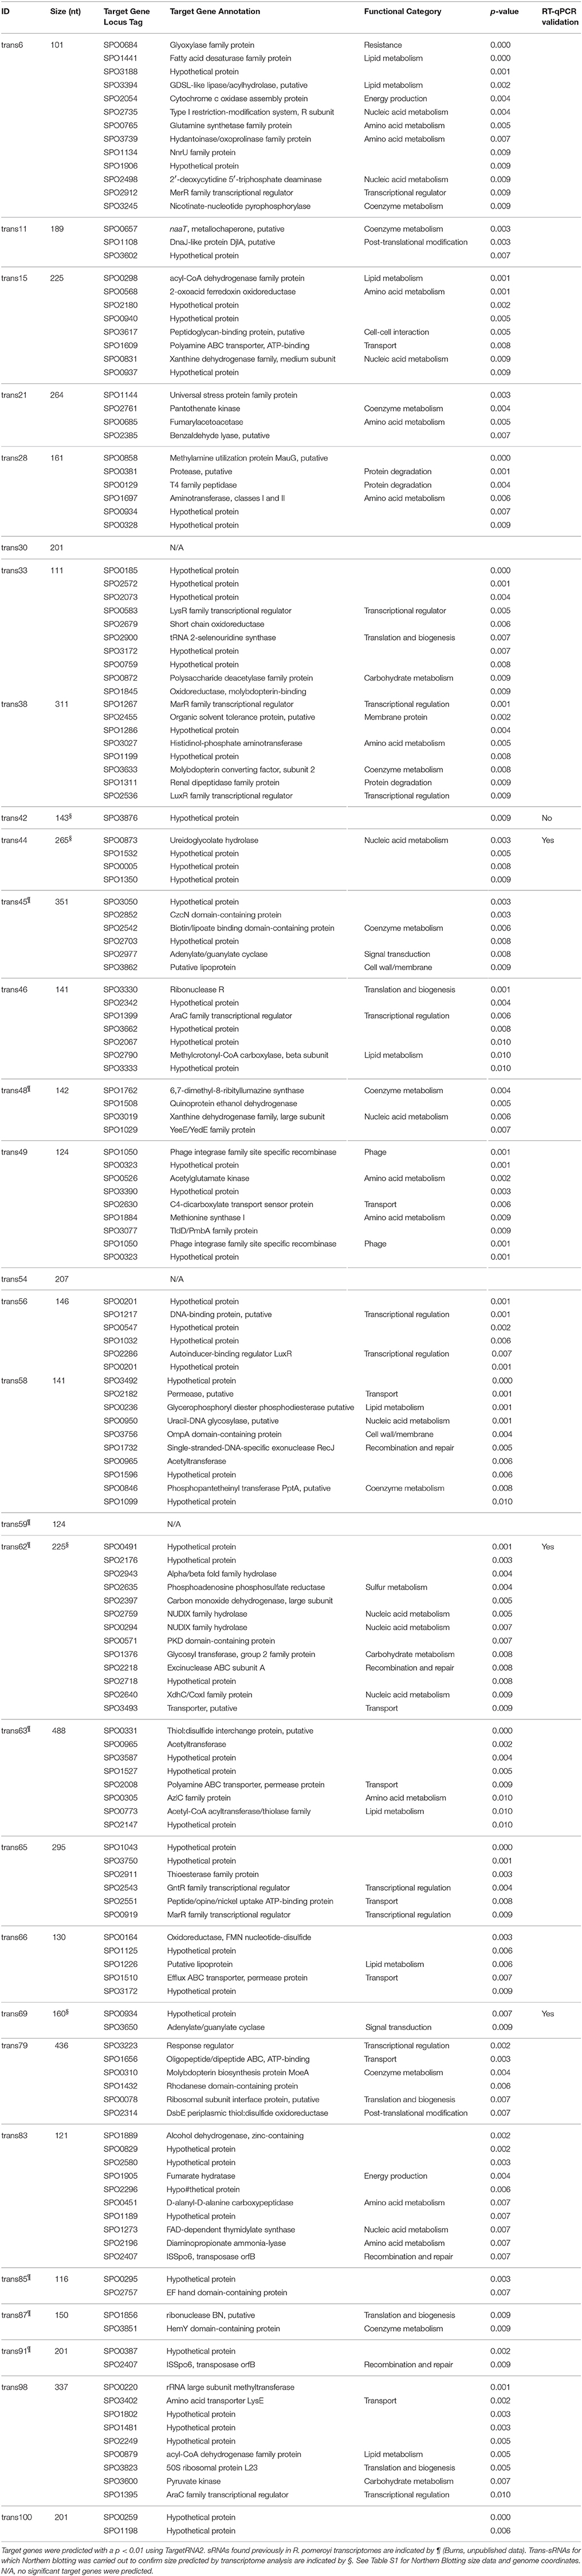
Table 2. Predicted target genes for trans-sRNAs identified during growth of Ruegeria pomeroyi under C- and N-limited conditions.
A non-coding RNA with homology to the 6S RNA was also found in the R. pomeroyi transcriptome. In E. coli and many other bacteria, 6S RNA is a global regulator that downregulates transcription of multiple genes when the bacterium is under stress, including during nutrient limitation (Cavanagh and Wassarman, 2014). In R. pomeroyi, the 6S RNA homolog was significantly upregulated under C limitation relative to N limitation (Table 1), and it was also noted in a previous study of non-coding RNA expression in this bacterium during sulfur metabolism (Burns, unpublished data) (Table S4).
Mode of Action of sRNAs
sRNAs and their regulatory targets may or may not have positively correlated patterns of expression, depending on whether the sRNAs affect transcript stability or instead work at the level of translation, and whether they act as activators or repressors. To determine whether there was any consistency in sRNA mode of action, the fold-difference between C- and N-limiting conditions for predicted target genes was plotted against the fold-difference for their corresponding cis-sRNAs. A weak but significant positive correlation was observed (R2 = 0.22), suggesting that the most common cis-sRNA mode of action under C and N limitation is as a positive regulator of mRNA levels (Figure 4A). To test the likelihood that this outcome could occur by chance, the antisense protein coding genes and sRNAs were paired randomly in 10,000 bootstrap analyses. F statistics for the actual pairs of antisense genes and cis-sRNAs had a value of 17.1 and was significantly higher than the F statistic of the median null sample (0.45) (Figure 4B).
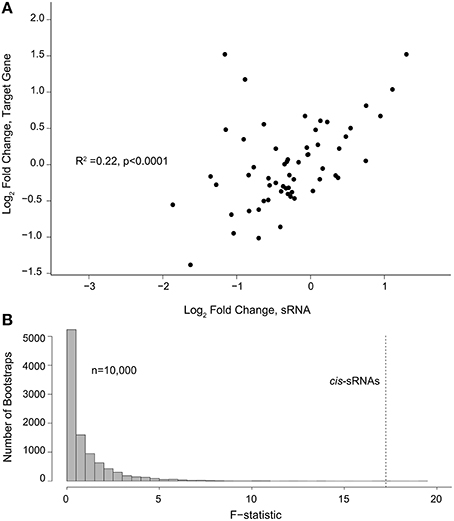
Figure 4. (A) Changes of cis-sRNAs and their predicted gene target (log2 fold-change) under C vs. N limitation. (B) Distribution of F-statistics for correlations from 10,000 random pairings of sRNAs and target genes (null model). The F-statistic for the correlation from (A) is indicated with a dashed line.
We were interested in understanding whether sRNAs play more important roles in the regulation of central metabolism (typically encoded in the core genome) or the regulation of peripheral or non-core metabolic processes (encoded in the pan genome). A metabolic map based on the R. pomeroyi genome (BioCyc Database Collection; http://biocyc.org) was used in a network analysis of the 22 genes antisense to cis-RNAs (Figure 5). Exponential family random graph models (ERGM) were used to independently assess the differences in connectedness for genes antisense to cis-sRNAs compared to all genes. These models behave like generalized linear models in which the response variable is the structure of a network and the predictor variables are categorical or continuous node or edge attributes and emerging network statistics. The vector of response variable coefficients can then be estimated using Markov Chain Monte Carlo (MCMC) simulations and the Akaike Information Criterion (AIC) to assess model fit. Genes antisense to cis-sRNAs had a significantly lower probability of interacting with other genes in the network compared to the average of all genes (Figure 5).
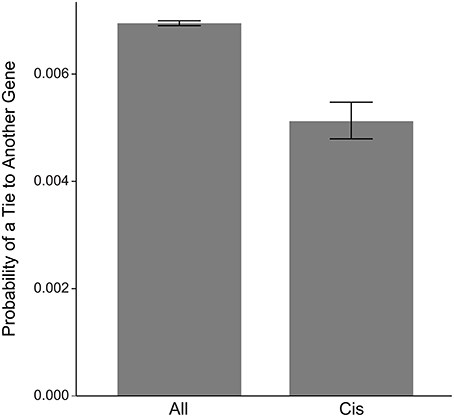
Figure 5. ERGM network analysis of connectedness (probability of links to other genes) for genes regulated by cis-sRNAs compared to all genes in the R. pomeroyi genome.
Discussion
Carbon vs. Nitrogen Limitation
Carbon and nitrogen limitation represent major challenges to the growth of heterotrophic bacteria and affect both anabolic and catabolic processes. Of the 14 sRNAs that showed significant differential regulation in the comparison between C and N limitation, most were higher under C limitation (10 of 14) (Table 1). This may reflect a need by R. pomeroyi for more complex regulatory strategies for the diverse mixture of organic C molecules found in seawater compared to a more constrained suite of inorganic N species and organic N molecules (Singer et al., 2012; Medeiros et al., 2015).
Transporter genes made up the largest functional class of predicted target genes of R. pomeroyi cis-sRNAs. One of the 11 ABC transporter genes in this class encodes an experimentally verified transporter for the sulfonate N-acetyltaurine (Denger et al., 2011), a nitrogen- and sulfur-containing organic compound important in diatom-derived organic matter (Durham et al., 2015). The remainder of the transporters had only general annotations based on homology to previously characterized amino acid, peptide, and sugar transporter systems (7 target proteins), or had no substrate assigned (3 target proteins). None of these sRNAs target genes were differentially regulated under C vs. N limitation.
Two target genes that may work together in the synthesis and export of a toxin were predicted to be under the control of sRNAs (cis12 and cis24) (Table 1), with neither differentially regulated under C vs. N limitation. One of them is the R. pomeroyi gene annotated as paxA, a gene first identified in bacterial pathogen Pasteurella aerogenes to encode an RTX toxin (Kuhnert et al., 2000), a class of protein toxins that form pores in eukaryotic host cells (Benz, 2016). The second gene is the target repeat protein of R. pomeroyi's type I secretion system (T1SS), required for the export of RTX toxins by Gram negative bacteria (Welch, 2001). PaxA has been reported to account for as much as 50% of proteins exported by R. pomeroyi when grown in laboratory medium enriched by the addition of yeast extract, but as little as 3% in conditions mimicking natural seawater (Christie-Oleza et al., 2015).
Although not differentially transcribed, two cis-sRNAs were predicted to regulate components of methionine metabolism, one encoded antisense to metK (S-adenosylmethionine synthase; cis93) and one encoded antisense to a homocysteine S-methyltransferase gene (cis78). Two others were predicted to regulate proteins involved in N-acetyltaurine use. One was transporter component naaA (cis25) and the other a catabolic metallochaperone gene naaT (a predicted target gene for trans11). Other sRNAs that were present but not differentially expressed between C and N limiting conditions included those predicted to regulate a flagellar hook protein (cis10) and a methylamine utilization gene mauG (a predicted target gene for trans28).
Thirty sRNAs identified here were also expressed by R. pomeroyi in a study of organic sulfur metabolism (Burns, unpublished data), and these represent candidates for constitutively expressed sRNAs (Table S4). The distribution of functional categories between the possible constitutively expressed sRNAs and those predicted to be involved specifically in nutrient limitation was similar.
Regulatory Mechanisms of sRNAs in R. pomeroyi
The regulatory mechanisms of bacterial sRNA are typically based on direct RNA-RNA binding with a target mRNA, with some exceptions for sRNAs that interact with proteins (Gottesman and Storz, 2011). They can affect gene expression in several ways, including changing mRNA half-life through stabilization or degradation, and modulation of translation through changes in mRNA secondary structure that open or occlude the ribosome binding site (Wassarman et al., 1999; Papenfort and Vogel, 2014). Each of these mechanisms predicts a different pattern when comparing the change in abundance of sRNAs and their targets. In R. pomeroyi, a statistically significant positive correlation with a slope of ~0.5 was found between cis-sRNAs and their targets (Figure 4A). A bootstrapping analysis with random pairing of predicted target coding genes and sRNAs indicated that the correlation had a very low probability of occurring due to chance or to an underlying bias in the data types. This pattern of target/sRNA expression change suggests that the most common regulatory mechanisms of cis-sRNAs in R. pomeroyi growing under C and N limitation are through stabilization of target gene transcripts or possibly transcriptional activation, although there are relatively few examples of bacterial sRNA transcriptional activators in the literature (Goodson et al., 2012). Some sRNAs fall into the upper left and lower right quadrants of Figure 4A, and these may represent negative regulatory mechanisms. The majority of modes of sRNA interactions described thus far in the literature rely on translational repression or mRNA degradation, although few studies have also looked at genome wide patterns of sRNA regulation. It should be noted that this analysis can only capture sRNAs which regulate by RNA-RNA interaction.
Centrality of Genes Regulated by sRNAs
sRNAs have the potential to participate in expansion of the functional capabilities of marine bacteria by facilitating regulation of genes acquired by horizontal transfer. They are less costly to maintain than protein regulators, and their regulatory abilities are encoded directly with the gene being transferred. Trans-sRNAs may also play an important role in regulation of transferred genes, and among members of the Roseobacter clade, the gene encoding the Hfq protein (used by some trans-acting sRNAs) is one on the most conserved (Newton et al., 2010). sRNAs have also been identified in pathogenicity islands and phage genomes (Gottesman and Storz, 2011). To gain insight into the issue of which classes of genes are more likely to be targeted by sRNAs, the location of cis-RNA-regulated genes within the metabolic network of R. pomeroyi was analyzed. The ERGM network analysis revealed that genes identified as targets of cis-RNAs are about 20% less connected than the average gene. Genes that are part of the core genome are more often included in metabolic networks than those in the pan genome, suggesting that estimates based on metabolic networks may actually understate a central metabolism vs. peripheral function effect. Transporter genes were the largest group of sRNA targets in R. pomeroyi, which is consistent with this possible bias. Only 22% of sRNA target genes were present in the metabolic network while 39% of the total genes were present (p < 0.0, Z-test).
Conclusions
The results of this study emphasize the number and variety of sRNAs produced by a heterotrophic marine bacterium and the need for additional research into the role of sRNAs in facilitating ecological adaptations. sRNAs represent an additional layer of regulation governing the cycling of C and nutrients in the ocean that affects the interpretation of transcriptome data both in model organisms and marine microbial communities.
Author Contributions
AR designed the project, conducted the research, and wrote the paper. AB designed the project, conducted the research, and wrote the paper. LC conducted the research. MM designed the project and wrote the paper.
Conflict of Interest Statement
The authors declare that the research was conducted in the absence of any commercial or financial relationships that could be construed as a potential conflict of interest.
Supplementary Material
The Supplementary Material for this article can be found online at: http://journal.frontiersin.org/article/10.3389/fmicb.2016.00380
Acknowledgments
This research was supported by NSF grants OCE1342694 and OCE1356010 and Gordon and Betty Moore Foundation grant GBMF538.01.
References
Axmann, I. M., Kensche, P., Vogel, J., Kohl, S., Herzel, H., and Hess, W. R. (2005). Identification of cyanobacterial non-coding RNAs by comparative genome analysis. Genome Biol. 6:R73. doi: 10.1186/gb-2005-6-9-r73
Azam, F., and Malfatti, F. (2007). Microbial structuring of marine ecosystems. Nat. Rev. Microbiol. 5, 782–791. doi: 10.1038/nrmicro1747
Bardill, J. P., and Hammer, B. K. (2012). Non-coding sRNAs regulate virulence in the bacterial pathogen Vibrio cholerae. RNA Biol. 9, 392–401. doi: 10.4161/rna.19975
Benz, R. (2016). Channel formation by RTX-toxins of pathogenic bacteria: basis of their biological activity. Biochim. Biophys. Acta 1858, 526–537. doi: 10.1016/j.bbamem.2015.10.025
Caspi, R., Altman, T., Billington, R., Dreher, K., Foerster, H., Fulcher, C. A., et al. (2014). The MetaCyc database of metabolic pathways and enzymes and the BioCyc collection of pathway/genome databases. Nucleic Acids Res. 42, D459–D471. doi: 10.1093/nar/gkt1103
Cavanagh, A. T., and Wassarman, K. M. (2014). 6S RNA, a global regulator of transcription in Escherichia coli, Bacillus subtilis, and beyond. Ann. Rev. Microbiol. 68, 45–60. doi: 10.1146/annurev-micro-092611-150135
Chan, L. K., Newton, R. J., Sharma, S., Smith, C. B., Rayapati, P., Limardo, A. J., et al. (2012). Transcriptional changes underlying elemental stoichiometry shifts in a marine heterotrophic bacterium. Front. Microbiol. 3:159. doi: 10.3389/fmicb.2012.00159
Christie-Oleza, J. A., Scanlan, D. J., and Armengaud, J. (2015). “You produce while I clean up,” a strategy revealed by exoproteomics during Synechococcus-Roseobacter interactions. Proteomics 15, 3454–3462. doi: 10.1002/pmic.201400562
Denger, K., Lehmann, S., and Cook, A. M. (2011). Molecular genetics and biochemistry of N-acetyltaurine degradation by Cupriavidus necator H16. Microbiology 157, 2983–2991. doi: 10.1099/mic.0.048462-0
Durham, B. P., Sharma, S., Luo, H. W., Smith, C. B., Amin, S. A., Bender, S. J., et al. (2015). Cryptic carbon and sulfur cycling between surface ocean plankton. Proc. Natl. Acad. Sci. U.S.A. 112, 453–457. doi: 10.1073/pnas.1413137112
Gelman, A., and Hill, J. (2007). Data Analysis Using Regression and Multilevel/Hierarchical Models. Cambridge; New York, NY: Cambridge University Press.
Georg, J., and Hess, W. R. (2011). cis-antisense RNA, another level of gene regulation in bacteria. Microbiol. Mol. Biol. Rev. 75, 286–300. doi: 10.1128/MMBR.00032-10
Gierga, G., Voss, B., and Hess, W. R. (2012). Non-coding RNAs in marine Synechococcus and their regulation under environmentally relevant stress conditions. ISME J. 6, 1544–1557. doi: 10.1038/ismej.2011.215
Gifford, S. M., Sharma, S., Rinta-Kanto, J. M., and Moran, M. A. (2011). Quantitative analysis of a deeply sequenced marine microbial metatranscriptome. ISME J. 5, 461–472. doi: 10.1038/ismej.2010.141
González, J. M., and Moran, M. A. (1997). Numerical dominance of a group of marine bacteria in the a-subclass of the class Proteobacteria in coastal seawater. Appl. Environ. Microbiol. 63, 4237–4242.
Goodson, M. S., Lynch, J. A., Lamkin, T., and Kramer, R. (2012). Elucidation of small RNAs that activate transcription in bacteria. ACS Synth. Biol. 1, 181–189. doi: 10.1021/sb2000275
Gottesman, S., and Storz, G. (2011). Bacterial small RNA regulators: versatile roles and rapidly evolving variations. Cold Spring Harbor. Perspect. Biol. 3:a003798. doi: 10.1101/cshperspect.a003798
Handcock, M., Hunter, D., Butts, C., Goodreau, S., and Morris, M. (2008). Statnet: software tools for the representation, visualization, analysis and simulation of network data. J. Stat. Softw. 24, 1548–7660. doi: 10.18637/jss.v024.i01
Hilton, J. A., Satinsky, B. M., Doherty, M., Zielinski, B., and Zehr, J. P. (2014). Metatranscriptomics of N2-fixing cyanobacteria in the Amazon River plume. ISME J. 9, 1557–1569. doi: 10.1038/ismej.2014.240
Kery, M. B., Feldman, M., Livny, J., and Tjaden, B. (2014). TargetRNA2: identifying targets of small regulatory RNAs in bacteria. Nucleic Acids Res. 42, W124–W129. doi: 10.1093/nar/gku317
Klähn, S., Schaal, C., Georg, J., Baumgartner, D., Knippen, G., Hagemann, M., et al. (2015). The sRNA NsiR4 is involved in nitrogen assimilation control in cyanobacteria by targeting glutamine synthetase inactivating factor IF7. Proc. Natl. Acad. Sci. U.S.A. 112, E6243–E6252. doi: 10.1073/pnas.1508412112
Kuhnert, P., Heyberger-Meyer, B., Nicolet, J., and Frey, J. (2000). Characterization of PaxA and its operon: a cohemolytic RTX toxin determinant from pathogenic Pasteurella aerogenes. Infect. Immun. 68, 6–12. doi: 10.1128/IAI.68.1.6-12.2000
Langmead, B., Trapnell, C., Pop, M., and Salzberg, S. L. (2009). Ultrafast and memory-efficient alignment of short DNA sequences to the human genome. Genome Biol. 10:R25. doi: 10.1186/gb-2009-10-3-r25
Linhartová, I., Bumba, L., Masin, J., Basler, M., Osicka, R., Kamanova, J., et al. (2010). RTX proteins: a highly diverse family secreted by a common mechanism. FEMS Microbiol. Rev. 34, 1076–1112. doi: 10.1111/j.1574-6976.2010.00231.x
Matz, M. V., Wright, R. M., and Scott, J. G. (2013). No control genes required: Bayesian analysis of qRT-PCR data. PLoS ONE 8:e71448. doi: 10.1371/journal.pone.0071448
Medeiros, P. M., Seidel, M., Dittmar, T., Whitman, W. B., and Moran, M. A. (2015). Drought-induced variability in dissolved organic matter composition in a marsh-dominated estuary. Geophys. Res. Lett. 42, 6446–6453. doi: 10.1002/2015GL064653
Møller, T., Franch, T., Udesen, C., Gerdes, K., and Valentin-Hansen, P. (2002). Spot 42 RNA mediates discoordinate expression of the E. coli galactose operon. Genes Dev. 16, 1696–1706. doi: 10.1101/gad.231702
Moran, M. A., Buchan, A., González, J. M., Heidelberg, J. F., Whitman, W. B., Kiene, R. P., et al. (2004). Genome sequence of Silicibacter pomeroyi reveals adaptations to the marine environment. Nature 432, 910–913. doi: 10.1038/nature03170
Mustachio, L. M., Aksit, S., Mistry, R. H., Scheffler, R., Yamada, A., and Liu, J. M. (2012). The Vibrio cholerae mannitol transporter is regulated posttranscriptionally by the MtlS small regulatory RNA. J. Bacteriol. 194, 598–606. doi: 10.1128/JB.06153-11
Newton, R. J., Griffin, L. E., Bowles, K. M., Meile, C., Gifford, S., Givens, C. E., et al. (2010). Genome characteristics of a generalist marine bacterial lineage. ISME J. 4, 784–798. doi: 10.1038/ismej.2009.150
Pain, A., Ott, A., Amine, H., Rochat, T., Bouloc, P., and Gautheret, D. (2015). An assessment of bacterial small RNA target prediction programs. RNA Biol. 12, 509–513. doi: 10.1080/15476286.2015.1020269
Papenfort, K., and Vogel, J. (2014). Small RNA functions in carbon metabolism and virulence of enteric pathogens. Front. Cell. Infect. Microbiol. 4:91. doi: 10.3389/fcimb.2014.00091
Sahagan, B. G., and Dahlberg, J. E. (1979). A small, unstable RNA molecule of Escherichia coli: spot 42 RNA: I. Nucleotide sequence analysis. J. Mol. Biol. 131, 573–592. doi: 10.1016/0022-2836(79)90008-1
Schneider, C. A., Rasband, W. S., and Eliceiri, K. W. (2012). NIH Image to ImageJ: 25 years of image analysis. Nat. Methods 9, 671–675. doi: 10.1038/nmeth.2089
Shi, Y. M., Tyson, G. W., and DeLong, E. F. (2009). Metatranscriptomics reveals unique microbial small RNAs in the ocean's water column. Nature 459, 266–U154. doi: 10.1038/nature08055
Singer, G. A., Fasching, C., Wilhelm, L., Niggemann, J., Steier, P., Dittmar, T., et al. (2012). Biogeochemically diverse organic matter in Alpine glaciers and its downstream fate. Nat Geosci. 5, 710–714. doi: 10.1038/ngeo1581
Smoot, M. E., Ono, K., Ruscheinski, J., Wang, P.-L., and Ideker, T. (2011). Cytoscape 2.8: new features for data integration and network visualization. Bioinformatics 27, 431–432. doi: 10.1093/bioinformatics/btq675
Steglich, C., Futschik, M. E., Lindell, D., Voss, B., Chisholm, S. W., and Hess, W. R. (2008). The challenge of regulation in a minimal photoautotroph: non-coding RNAs in Prochlorococcus. PLoS Genet. 4:e1000173. doi: 10.1371/journal.pgen.1000173
Stocker, R. (2012). Marine microbes see a sea of gradients. Science 338, 628–633. doi: 10.1126/science.1208929
Storz, G., Vogel, J., and Wassarman, K. (2011). Regulation by small RNAs in bacteria: expanding frontiers. Mol. Cell 43, 880–891. doi: 10.1016/j.molcel.2011.08.022
Untergasser, A., Cutcutache, I., Koressaar, T., Ye, J., Faircloth, B. C., Remm, M., et al. (2012). Primer3—new capabilities and interfaces. Nucleic Acids Res. 40, e115–e115. doi: 10.1093/nar/gks596
Urbanowski, M. L., Stauffer, L. T., and Stauffer, G. V. (2000). The gcvB gene encodes a small untranslated RNA involved in expression of the dipeptide and oligopeptide transport systems in Escherichia coli. Mol. Microbiol. 37, 856–868. doi: 10.1046/j.1365-2958.2000.02051.x
Vanderpool, C. K., and Gottesman, S. (2004). Involvement of a novel transcriptional activator and small RNA in post-transcriptional regulation of the glucose phosphoenolpyruvate phosphotransferase system. Mol. Microbiol. 54, 1076–1089. doi: 10.1111/j.1365-2958.2004.04348.x
Voss, B., Georg, J., Schön, V., Ude, S., and Hess, W. R. (2009). Biocomputational prediction of non-coding RNAs in model cyanobacteria. BMC Genomics 10:123. doi: 10.1186/1471-2164-10-123
Wang, S. H., Niu, C. L., Shi, Z. Y., Xia, Y. J., Yaqoob, M., Dai, J. J., et al. (2011). Effects of ibeA deletion on virulence and biofilm formation of avian pathogenic Escherichia coli. Infect. Immun. 79, 279–287. doi: 10.1128/IAI.00821-10
Wassarman, K., Zhang, A., and Storz, G. (1999). Small RNAs in Escherichia coli. Trends Microbiol. 7, 37–42. doi: 10.1016/S0966-842X(98)01379-1
Welch, R. A. (2001). RTX toxin structure and function: a story of numerous anomalies and few analogies in toxin biology. Curr. Top. Microbiol. 257, 85–111. doi: 10.1007/978-3-642-56508-3_5
Keywords: small RNA, Ruegeria, Roseobacter, ncRNA, sRNA
Citation: Rivers AR, Burns AS, Chan L-K and Moran MA (2016) Experimental Identification of Small Non-Coding RNAs in the Model Marine Bacterium Ruegeria pomeroyi DSS-3. Front. Microbiol. 7:380. doi: 10.3389/fmicb.2016.00380
Received: 22 December 2015; Accepted: 09 March 2016;
Published: 29 March 2016.
Edited by:
Anton F. Post, Coastal Resource Center, University of Rhode Island, USAReviewed by:
Michael Rappe, University of Hawaii at Manoa, USAJens Georg, Universität Freiburg, Germany
Copyright © 2016 Rivers, Burns, Chan and Moran. This is an open-access article distributed under the terms of the Creative Commons Attribution License (CC BY). The use, distribution or reproduction in other forums is permitted, provided the original author(s) or licensor are credited and that the original publication in this journal is cited, in accordance with accepted academic practice. No use, distribution or reproduction is permitted which does not comply with these terms.
*Correspondence: Mary Ann Moran, bW1vcmFuQHVnYS5lZHU=
†Present Address: Andrew S. Burns, Department of Biology, Georgia Institute of Technology, Atlanta, USA