 Mary R. Gradoville
 Byron C. Crump
 Ricardo M. Letelier
 Matthew J. Church
 Angelicque E. White
- 1College of Earth, Ocean and Atmospheric Sciences, Oregon State University, Corvallis, OR, United States
- 2Flathead Lake Biological Station, University of Montana, MT, United States
Filamentous diazotrophic Cyanobacteria of the genus Trichodesmium, often found in colonial form, provide an important source of new nitrogen to tropical and subtropical marine ecosystems. Colonies are composed of several clades of Trichodesmium in association with a diverse community of bacterial and eukaryotic epibionts. We used high-throughput 16S rRNA and nifH gene sequencing, carbon (C) and dinitrogen (N2) fixation assays, and metagenomics to describe the diversity and functional potential of the microbiome associated with Trichodesmium colonies collected from the North Pacific Subtropical Gyre (NPSG). The 16S rRNA and nifH gene sequences from hand-picked colonies were predominantly (>99%) from Trichodesmium Clade I (i.e., T. thiebautii), which is phylogenetically and ecologically distinct from the Clade III IMS101 isolate used in most laboratory studies. The bacterial epibiont communities were dominated by Bacteroidetes, Alphaproteobacteria, and Gammaproteobacteria, including several taxa with a known preference for surface attachment, and were relatively depleted in the unicellular Cyanobacteria and small photoheterotrophic bacteria that dominate NPSG surface waters. Sequencing the nifH gene (encoding a subcomponent of the nitrogenase enzyme) identified non-Trichodesmium diazotrophs that clustered predominantly among the Cluster III nifH sequence-types that includes putative anaerobic diazotrophs. Trichodesmium colonies may represent an important habitat for these Cluster III diazotrophs, which were relatively rare in the surrounding seawater. Sequence analyses of nifH gene transcripts revealed several cyanobacterial groups, including heterocystous Richelia, associated with the colonies. Both the 16S rRNA and nifH datasets indicated strong differences between Trichodesmium epibionts and picoplankton in the surrounding seawater, and also between the epibionts inhabiting Trichodesmium puff and tuft colony morphologies. Metagenomic and 16S rRNA gene sequence analyses suggested that lineages typically associated with a copiotrophic lifestyle comprised a large fraction of colony-associated epibionts, in contrast to the streamlined genomes typical of bacterioplankton in these oligotrophic waters. Additionally, epibiont metagenomes were enriched in specific genes involved in phosphate and iron acquisition and denitrification pathways relative to surface seawater metagenomes. We propose that the unique microbial consortium inhabiting colonies has a significant impact on the biogeochemical functioning of Trichodesmium colonies in pelagic environments.
Introduction
The filamentous, dinitrogen (N2)-fixing (diazotrophic) cyanobacterium Trichodesmium provides a major source of bioavailable nitrogen (N) to the oligotrophic subtropical and tropical oceans (Karl et al., 2002; Capone et al., 2005). Trichodesmium abundances and N2 fixation rates have been integral components of global N2 fixation estimates and models (e.g., Coles et al., 2004; Mahaffey et al., 2005); thus, an accurate understanding of the physiology and ecology of this genus is crucial. Most Trichodesmium laboratory studies have used a single isolate, T. erythraeum strain IMS101, grown in culture with minimal heterotrophic bacteria. In contrast, natural Trichodesmium populations are composed of species from four known phylogenetically distinct clades (Hynes et al., 2012), which can vary in physiological traits, such as carbon (C) affinity and phosphonate biosynthesis (Dyhrman et al., 2009; Hutchins et al., 2013). Furthermore, in nature they are commonly found associated with attached microorganisms (Borstad and Borstad, 1977). The diversity of this complex community likely affects the overall functioning of colonies (Gradoville et al., 2014), yet few studies have examined the ecology of Trichodesmium species and associated epibionts (although see Hmelo et al., 2012; Rouco et al., 2016).
Trichodesmium cells exist as free filaments or aggregate colonies (Letelier and Karl, 1996) with varying morphologies, namely spherical “puffs” and fusiform “tufts.” These colonies have been reported to maintain an active and diverse assemblage of attached organisms, including bacteria, eukaryotic phytoplankton, protozoa, fungi, and copepods (Borstad and Borstad, 1977; Sheridan et al., 2002). Trichodesmium colonies constitute a favorable environment for associated epibionts by providing buoyancy (Walsby, 1992), elevated concentrations of dissolved organic N (Capone et al., 1994), and a substrate for attachment (O'Neil, 1998). Recent studies using 16S rRNA gene sequencing have shown that Trichodesmium-associated bacterial epibionts include surface-associated taxa (Hmelo et al., 2012) and that selective processes appear to drive epibiont community structure (Rouco et al., 2016).
Less is known about how associated microorganisms affect the functioning of the Trichodesmium holobiont. Trichodesmium colonies appear to be hotspots for microbial activity: hydrolytic enzyme activities are elevated within colonies (Stihl et al., 2001; Sheridan et al., 2002) and a metatranscriptome from Trichodesmium bloom material recovered more transcripts from associated organisms than from Trichodesmium cells (Hewson et al., 2009). Microbial processes carried out by associated microorganisms have the potential to influence rates of N2 or C fixation. For instance, quorum sensing by associated bacteria can increase alkaline phosphatase activity within colonies (Van Mooy et al., 2011), which could stimulate Trichodesmium dissolved organic phosphorus utilization, thereby increasing N2 fixation rates when phosphate is limiting. Likewise, specific epibiont bacteria may secrete siderophores, chelating iron which could subsequently become bioavailable to Trichodesmium after photodegradation (Roe et al., 2012). Associated microorganisms may also directly contribute to the fixation of C and/or N2. Phototrophs including filamentous Cyanobacteria (Siddiqui et al., 1992) and diatoms (Borstad and Borstad, 1977) have historically been observed within Trichodesmium colonies. More recently, heterocystous cyanobacterial diazotrophs have been observed within Trichodesmium colonies (Momper et al., 2015) and nifH genes (encoding a subcomponent of the nitrogenase enzyme) phylogenetically clustering among facultative anaerobes and aerobic heterotrophic bacteria have been retrieved from Trichodesmium colonies (Gradoville et al., 2014). The degree to which these associated diazotrophs contribute to bulk colony N2 fixation rates is unknown.
Here, we examine the microbiome associated with Trichodesmium colonies collected from the North Pacific Subtropical Gyre (NPSG). We used a combined approach of high-throughput 16S rRNA and nifH gene sequencing, metagenomics, and 13C and 15N2 fixation assays to survey the diversity of the Trichodesmium holobiont, test for the presence and activity of non-Trichodesmium colony-associated diazotrophs, and explore the functional potential of the colonies. We compare the colony-associated microbiome to the microbial community structure and metagenomic composition of surrounding seawater, revealing diverse and unique microbial structure and functional potential associated with Trichodesmium colonies.
Methods
Sample Collection
Samples were collected in March 2014 aboard the R/V Kilo Moana at Stn. ALOHA (A Long-term Oligotrophic Habitat Assessment; 22.45°N, 158°W), an open-ocean field site ~100 km north of Oahu (Table 1). Trichodesmium colonies were collected using a 202 μm plankton net which was hand-towed at <2 km h−1 through near-surface waters (<10 m depth) for 10–15 min. Once recovered, colonies were isolated using an inoculating loop and rinsed twice with 0.2 μm-filtered surface seawater prior to all analyses. Colonies were sorted into morphological classes of spherical “puffs” (further divided into “radial puffs” and “non-radial puffs” on 23 Mar), fusiform “tufts,” and “mixed” morphologies (Figure 1), and either filtered for subsequent extraction of DNA and RNA or used for C and N2 fixation measurements. Additionally, bulk seawater from 25 m depth was collected for comparison with Trichodesmium colony DNA. Seawater samples were collected using sampling bottles attached to a CTD (conductivity, temperature, depth) rosette, and subsampled into 4 L acid-washed, MilliQ-rinsed polycarbonate bottles prior to filtration.
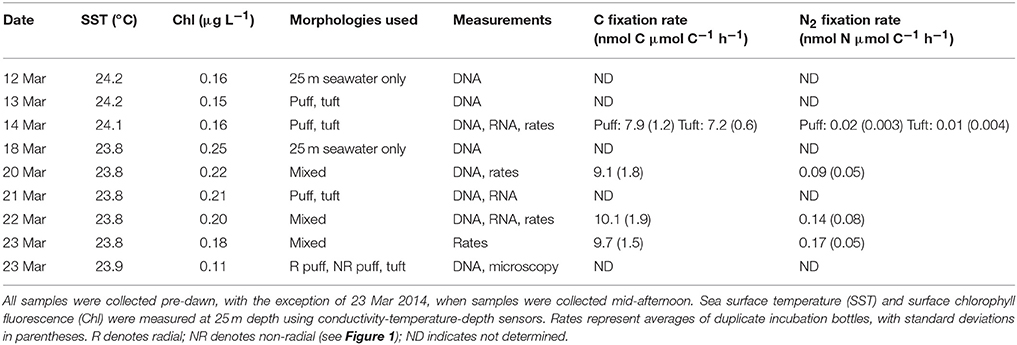
Table 1. Summary and environmental conditions for sampling dates during a March 2014 cruise at Stn. ALOHA.
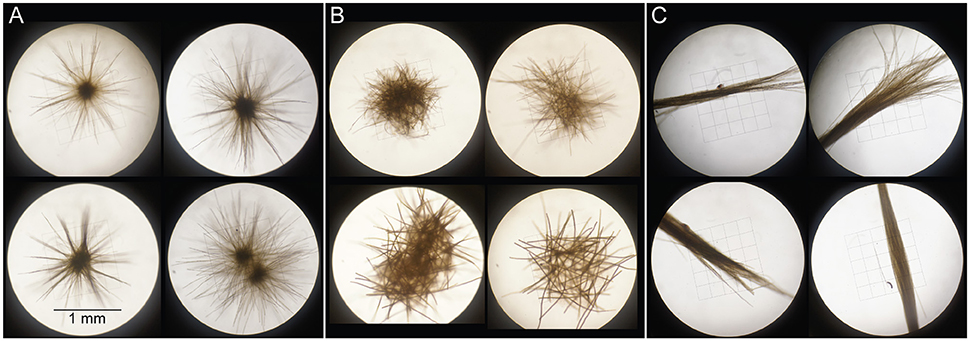
Figure 1. Examples of Trichodesmium colonies sorted into the morphological classes “radial puffs” (A), “non-radial puffs” (B), and “tufts” (C) on 23 Mar 2014. On all other collection days, “puffs” designate mixtures of morphotypes (A,B), “tufts” designate morphotype (C), and “mixed” designates mixtures of all morphotypes.
Carbon and Nitrogen Fixation Rates
Carbon (C) and dinitrogen (N2) fixation rates were measured using the 13C method of Legendre and Gosselin (1997) and a modification of the 15N2 uptake method of Montoya et al. (1996) to avoid delayed bubble dissolution (Mohr et al., 2010; Wilson et al., 2012). 15N2 was added to incubations via 15N2-enriched seawater, which was prepared onshore ~1 week prior to departure using Stn. ALOHA surface seawater according to the methods of Wilson et al. (2012). Briefly, seawater was 0.2 μm-filtered and degassed, then dispensed into gas-tight 3 L PTFE bags (Welch Fluorocarbon); 12.9 mL−L 15N2 gas (Cambridge Isotopes, 99%) was injected into the bag, which was manually agitated to facilitate dissolution. This 15N2-enriched seawater was dispensed into glass serum bottles, which were capped, crimped, and stored at 4°C until use. The 15N2 content of enriched seawater was validated via Membrane Inlet Mass Spectrometry according to the methods of Böttjer et al. (2017).
For the incubations, 20–30 colonies were transferred into 37 mL glass serum bottles filled with 0.2 μm-filtered surface seawater. Samples were spiked with 4 mL 15N2-enriched seawater and 0.5 mL of 48 mmol L−1 13C bicarbonate stock, and bottles were topped off with filtered seawater, capped with Viton septa and aluminum caps, and crimp-sealed. Samples were incubated from dawn to dusk (~12 h) in flow-through deckboard incubators with blue acrylic shading used to simulate ~60% of the sea-surface irradiance. Incubations were terminated by gentle filtration onto 25 mm diameter pre-combusted glass fiber filters (Whatman GF/F). Additionally, 20–30 colonies were preserved for duplicate δ15N natural abundance (time-zero samples) after each net tow. Filters were flash-frozen and shipped to Oregon State University, where they were dried at 60°C overnight and packed into tin and silver capsules. Isotopic composition and masses of particulate N and C were measured with an isotope ratio mass spectrometer at Oregon State University. Fixation rates were calculated according to Montoya et al. (1996) and normalized to particulate C concentrations; thus, N2 fixation rates are expressed as nmol N μmol C−1 d−1 rather than nmol N2 L−1 d−1.
Nucleic Acid Extraction, Amplification, and Sequencing
For samples used for subsequent extraction of DNA and RNA, 20–30 Trichodesmium colonies were transferred into filtered seawater and gently filtered onto 25 mm diameter, 0.2 μm polyethersulfone Supor filters (Pall Corporation). Samples for subsequent extraction of planktonic DNA from 25 m seawater were filtered onto 0.2 μm Supor filters using a peristaltic pump. Filters were placed into empty microcentrifuge tubes (DNA) or microcentrifuge tubes containing 0.5 mL RNAlater (RNA), flash-frozen, transported in liquid N2 to Oregon State University, and stored at −80°C until analysis. DNA was extracted using the DNeasy Plant MiniKit (Qiagen), with a modified protocol to include a freeze-fracture step and Proteinase K treatment. RNA was extracted using the RNeasy MiniKit (Qiagen) according to manufacturer instructions, with additional steps for cell disruption through flash-freezing and bead-beating filters in mixtures of 500 μL RLT buffer, 5 μL β-mercaptoethanol, and 200 μL of mixed 0.1 mm and 0.5 mm glass beads (Biospec products). Possible carry-forward DNA contamination was minimized from RNA extracts by using the Turbo DNA-free kit (Ambion), and extracts were quantified using a Qubit RNA HS Assay kit (Invitrogen). Complimentary DNA (cDNA) was synthesized using the SuperScript III First-Strand kit (Invitrogen) according to the manufacturer's instructions, using the nifH3 gene-specific primer (Zani et al., 2000). DNA and cDNA were quantified with the Quant-iT PicoGreen dsDNA Assay Kit (Invitrogen) using a MicroMax 384 plate reading fluorometer, and extracts were stored at −20 or −80°C.
The polymerase chain reaction (PCR) was used to amplify a portion of the 16S rRNA gene, targeting the entire prokaryotic community (DNA samples only), and the nifH gene, targeting diazotrophs (for both DNA and cDNA). All PCR reactions were performed using a Veriti (Applied Biosystems) or DNAEngine (BioRad) thermocycler and 10 or 20 μL reaction volumes. 16S rRNA PCR consisted of 1X HotMasterMix (5 PRIME), 1 μL DNA extract, and 5 pmol 515f (GTGCCAGCMGCCGCGGTAA) and 806r (GGACTACHVGGGTWTCTAAT) primers (Caporaso et al., 2010) which were modified to include Illumina adapters and dual-index barcodes as described by Kozich et al. (2013). Thermal cycling conditions for 16S rRNA gene amplifications were: 94°C for 3 min, followed by 30 cycles of 94°C for 45 s, 50°C for 60 s, and 72°C for 90 s, with a final 72°C extension for 10 min.
The nifH gene was amplified using nested degenerate nifH primers (Zehr and McReynolds, 1989; Zani et al., 2000). The first round contained 1X PCR buffer, 0.1U Platinum High Fidelity Taq polymerase (Invitrogen), 200 μmol L−1 dNTPs, 3% BSA, 4 mmol L−1 Mg2+, 1 μL DNA or cDNA, and 1 μmol L−1 nifH1 and nifH2 primers (Simon et al., 2014). Reaction conditions were: 94°C for 7 min, followed by 30 cycles of 94°C for 1 min, 57°C for 1 min, and 72°C for 1 min, and a final 72°C extension for 7 min. The second round of nifH PCR used the same components and thermocycling conditions as the first round, except the DNA extract was replaced with 1 μL of the amplified product generated during the first round PCR reaction, and custom primers were used, consisting of gene-specific sites (nifH3 and nifH4), dual-indexed barcodes, Illumina linkers, and a sequencing primer binding region, similar to those described by Kozich et al. (2013; Table S1). PCR negative controls and filter blank samples were included in PCR reactions.
Triplicate PCR reactions were visualized by gel electrophoresis, then pooled and quantified as above. Samples were only sequenced if they had three successful PCR reactions, except for PCR negative controls and filter blanks, which were sequenced despite the absence of visual gel bands after amplification. 16S rRNA and nifH gene amplicons were pooled to equimolar concentrations, cleaned using both the UltraClean PCR (MoBio) and AMPure XP Bead cleanup kits, and sequenced at Oregon State University using MiSeq Standard v.3, 2 × 300 bp paired-end sequencing.
Metagenomes were constructed from two Trichodesmium puff DNA samples (Figure 1). Libraries were constructed using an Illumina Nextera XT library prep kit, and cleaned using the AMPure XP Bead cleanup kits. Samples were sequenced on an Illumina MiSeq using a v.3 MiSeq Reagent Kit and a 2 × 300 bp paired-end protocol. Metagenome library preparation, cleaning, and sequencing were carried out by the Oregon State University Center for Genome Research and Biocomputing Center.
Bioinformatic Analyses
Sequence reads from 16S rRNA gene amplicons, nifH gene amplicons, and metagenomes were demultiplexed using the Illumina MiSeq Reporter (MSR) version 2.5.1. For 16S rRNA gene sequences, primers were also removed using MSR. The majority of 16S rRNA gene paired-end reads were merged and screened for quality, retaining sequences between 245 and 254 bp with no ambiguities using mothur (Schloss et al., 2009). For a subset of 16S rRNA gene samples, only forward reads were used for phylogenetic analyses due to the poor quality of reverse reads. The reverse primer was trimmed from forward reads, and reads with ambiguities, homopolymers (>8 bp) or poor quality (average score <25 or any score <20) were removed using mothur. Finally, forward reads with lengths between 245 and 254 bp were retained and combined with the paired-end sequences for subsequent analyses. Singletons were removed, operational taxonomic units (OTUs) were clustered at 97% nucleotide sequence similarity, and a chimera check was performed with the Gold ChimeraSlayer reference database using USearch (Edgar, 2010). After quality control procedures, two of four PCR negative controls, and one of two triplicate-pooled filter blank samples retained a small number of sequences (8, 1496, and 21 sequences, respectively). Taxonomy was assigned in QIIME using the Silva v123 reference database, and sequences classified as chloroplasts, mitochondria, Archaea, Eukaryota, or an unknown domain were removed. Sequences were subsampled to 7,011 sequences per sample, resulting in near-saturation for most rarefaction curves (Figure S1). Negative control and filter blank samples contained less sequences than this cutoff, and were thus excluded from further analyses. Nonmetric multidimensional scaling analyses (NMDS, via Bray-Curtis similarity) and alpha diversity metric calculations were performed using QIIME (Caporaso et al., 2010). This same procedure was performed on reduced datasets containing Trichodesmium OTUs only (excluding 25 m seawater samples; rarefied to 2,248 sequences per sample) and containing all non-Trichodesmium OTUs (rarefied to 3,128 sequences per sample).
For nifH amplicons, though both forward and reverse barcodes were used for demultiplexing, only forward reads were used for phylogenetic analyses due to the poor quality of reverse reads. Reads with ambiguities, poor quality, or homopolymers were discarded. Forward primers were removed, sequences were trimmed to 244 bp, and OTUs were clustered at 97% nucleotide sequence similarity using USearch with a de novo chimera checker (Edgar, 2010). OTUs containing chimeras, frameshifts, and non-nifH sequences were removed. The three PCR negative controls contained no nifH sequences after these quality control procedures, while two of five filter blank samples contained a small number of sequences (1 and 330 sequences). Sequences were subsampled to 9,651 sequences per sample, saturating most rarefaction curves (Figure S1). Both filter blank samples contained less sequences than this cutoff, and were excluded from further analyses. The nifH OTUs were translated and phylogenetically classified into nifH gene clusters (Zehr et al., 2003) via BLAST-p similarity to a reference database of nifH gene sequences (http://www.jzehrlab.com/#!nifh-database/c1coj). Sequences were termed “undefined” if they had equal amino acid similarity to sequences from multiple nifH gene sequence-types. BLASTn searches of the National Center for Biotechnology Information (https://blast.ncbi.nlm.nih.gov) were also performed for select nifH and 16S rRNA gene OTUs.
Metagenome sequences were demultiplexed using the Illumina MSR version 2.5.1. All further processing steps were performed for the two Trichodesmium colony metagenomes and a metagenome previously constructed from Stn. ALOHA surface seawater DNA (15 m depth, 0.2 μm pore-size filter) on 30 July 2015 (Wilson et al., under review; NCBI BioProject accession PRJNA358725, BioSample S37C001). Raw reads were assembled separately for each sample using MEGAHIT (Li et al., 2015). Assemblies were uploaded to the Joint Genome Institute Genomes Online Database (https://gold.jgi.doe.gov/), where coding sequences (CDS) were predicted and annotated to the Kyoto Encyclopedia of Genes and Genomes (KEGG, Kanehisa and Goto, 2000; Huntemann et al., 2015). Metagenome sequences were processed according to the methods of Nalven (2016). Sequence reads were then trimmed for quality using seqtk (https://github.com/lh3/seqtk) and mapped back to CDS using Bowtie 2 (Langmead and Salzberg, 2012). Counts (one for single reads and two for paired reads mapped), CDS lengths, and alignment lengths were extracted using SAMtools (Li et al., 2009), and counts were normalized to account for length of reads and length of CDS (Wagner et al., 2012). Counts within KEGG ortholog groups (KO) were summed and normalized as counts per million mapped to KO-annotated contigs [Genes Per Million (GPM), Wagner et al., 2012] and as counts per million mapped to KO-annotated contigs of known function (designated GPMK). GPM counts were used to analyze overall taxonomy, while GPMK were used for functional analyses. Counts from each KO were also divided into categories assigned to Cyanobacteria (assumed to be predominantly Trichodesmium) and non-Cyanobacteria. Details on the assembly and annotation of each sample are provided in Table 2.
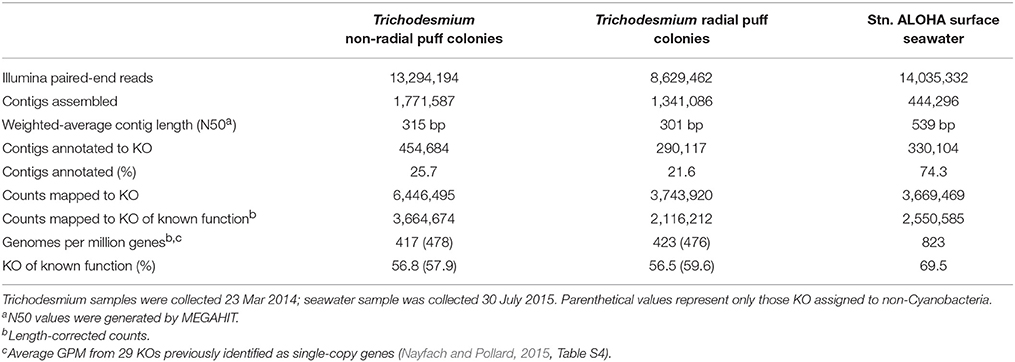
Table 2. Summary of metagenome assembly, annotation, and mapping.
All raw sequences are available from NCBI (accession SRP078449). Assemblies and annotation data are available from IMG/M ER (http://img.jgi.doe.gov/mer; Taxon OIDs 3300009572, 3300009536, and 3300010936).
Statistical Analyses
Two-way ANOVA with subsequent Tukey Honest Significant Difference (HSD) post-hoc tests were used to test the effect of day and sample type on N2 fixation rates and alpha diversity metrics. The Welch Two Sample t-test was used to test for differences in the relative proportion of puff and tuft sequences in dominant OTUs, using the Bonferroni correction for multiple comparisons. Both ANOVA and t-tests were performed using the program R (http://www.r-project.org/). One-way ANOSIM tests were used to test for significant differences in community structure among sample types, using the program PRIMER. Detection limits for N2 fixation rate measurements were calculated using standard propagation of errors via the observed variability between replicate samples as described by Gradoville et al. (2017) (Table S2).
Results
Carbon and Nitrogen Fixation Rates
Shipboard incubation experiments showed that Trichodesmium colonies were actively fixing N2 and C. Biomass-normalized 15N2 fixation rates ranged from 0.24 to 4.16 nmol N μmol C−1 d−1 (Table 1); all rates were above detection limits (Table S2). Biomass-normalized 13C fixation rates ranged from 173 to 243 nmol C μmol C−1 d−1 (Table 1). Both 15N2 and 13C rates were normalized to C content rather than colony number due to the known variability in the size of Trichodesmium colonies (Letelier and Karl, 1996). These ranges are similar to previously reported Trichodesmium colony-specific (Lomas et al., 2012) and C-specific (Gradoville et al., 2014) N2 and C fixation rates. N2 fixation rates varied by day of sampling (two-way ANOVA, p < 0.01) but not by morphology (p > 0.05). C fixation rates did not vary by either day or morphology (two-way ANOVA, p > 0.05).
Trichodesmium Species Diversity
The Trichodesmium species diversity within our samples was assessed via PCR amplification and sequencing of 16S rRNA and nifH genes. Sequences from both genes indicate that Trichodesmium Clade I (e.g., T. thiebautii) dominated our samples, with Clade III (e.g., T. erythraeum) representing <1% of Trichodesmium sequences (Figure 2). The 16S rRNA gene dataset contained 2 OTUs classified as Trichodesmium, with the most abundant OTU classified as Clade I (16S OTU 2, 99.5% of Trichodesmium 16S rRNA sequences). Likewise, 2 of the 3 Trichodesmium nifH gene OTUs (nifH OTU 1 and nifH OTU 27) were classified as Clade I and together comprised 99.9% of the Trichodesmium nifH gene sequences (Figure 2). Puff, tuft, and mixed morphology samples from 16S rRNA and nifH genes all contained >99% Clade I Trichodesmium sequences (Table S3), and the Trichodesmium community structure did not vary by morphology (ANOSIM R = −0.042, p = 0.6; Figure 3C). No sequences from the 16S rRNA or nifH gene datasets were classified as Trichodesmium Clade II or Clade IV.
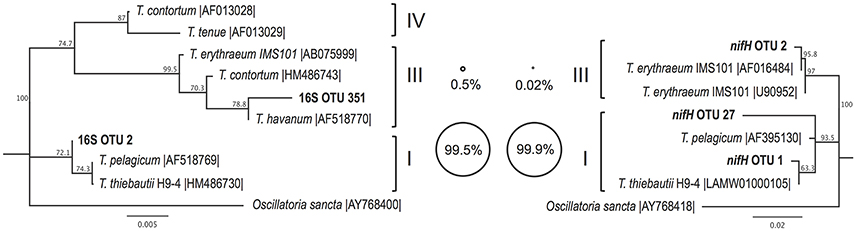
Figure 2. Neighbor joining phylogenetic trees depicting the relationships between Trichodesmium OTUs (97% nucleotide similarity) from partial 16S rRNA (left) and partial nifH (right) gene sequences, together with reference sequences from cultivated representatives (accession numbers given). Major Trichodesmium clades (Lundgren et al., 2005) are shown in Roman numerals. Bubble plots depict the percentage of Trichodesmium DNA sequences from this study which group with each clade, according to partial 16S rRNA (left) and partial nifH (right) amplicon datasets. Bootstrap values (1,000 replicates) of >50% are provided. Scale bars represent nucleotide substitutions per site.
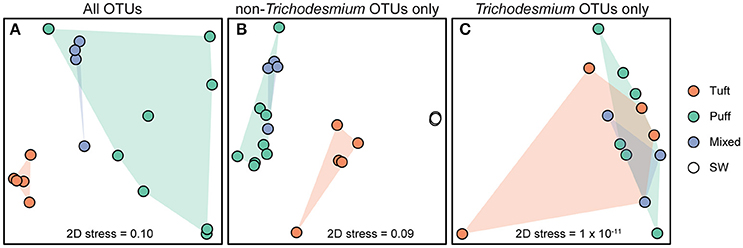
Figure 3. Non-metric multi-dimensional scaling (NMDS) plots derived from the Bray–Curtis dissimilarity matrix of 16S rRNA OTUs from (A) all Trichodesmium colony sample OTUs (7011 sequences per sample), (B) Trichodesmium colony and surface seawater samples excluding Trichodesmium OTUs (3128 sequences per sample), and (C) Trichodesmium colony samples excluding non-Trichodesmium OTUs (2248 sequences per sample). Each point represents an individual sample. Colors represent sample type [tuft colonies, puff colonies, mixed colonies, and bulk seawater (SW) from 25 m].
Microbial Diversity via 16S rRNA Gene Amplicons
The microbial diversity of the Trichodesmium microbiome was assessed using high-throughput sequencing of partial 16S rRNA genes from 17 Trichodesmium colony samples and 4 surface seawater samples for comparison. Trichodesmium sequences represented 24–75% of 16S rRNA amplicons from colony samples; the remaining 25–76% of sequences corresponded to associated bacteria, termed epibionts (though it is possible that a subset of these organisms were endobionts). The most abundant epibiotic taxa belonged to Bacteroidetes (Cytophagia, Sphingobacteriales, and Flavobacteriales), Alphaproteobacteria (predominantly Rhodobacteriales, Rhodospirillales, and Rhizobiales), and Gammaproteobacteria (e.g., Marinicella sp., Alteromonas sp., Oceanospirillales) (Figure 4, Figure S2, Table S3). Even at broad phylum- and class-level taxonomic groupings, the Trichodesmium epibiont community differed from the bacterial community in the surrounding seawater: all colonies were relatively enriched in Bacteroidetes, and puff and mixed colony samples were enriched in Acidobacteria and Deltaproteobacteria, compared to the surrounding seawater (Figure 4). Additionally, some of the most abundant taxa in NPSG near-surface seawater samples, including the Cyanobacteria Prochlorococcus sp., and Synechococcus sp., the Actinobacteria Actionomarina sp., and marine groups AEGEAN-169, SAR11, SAR86, and SAR116, were relatively depleted or absent in Trichodesmium colony samples (Figure 4, Figure S2). At the 97% identity level, Trichodesmium colonies and seawater samples had few dominant epibiont OTUs (OTUs containing >1% non-Trichodesmium sequences in samples of either morphology) in common (Figure S2). NMDS analyses provide further evidence that the community structure of the epibionts was distinct from that of the surrounding seawater, and also illustrate greater dissimilarity among Trichodesmium samples than among surface seawater samples (ANOSIM R = 0.852, p = 0.001; Figure 3B).
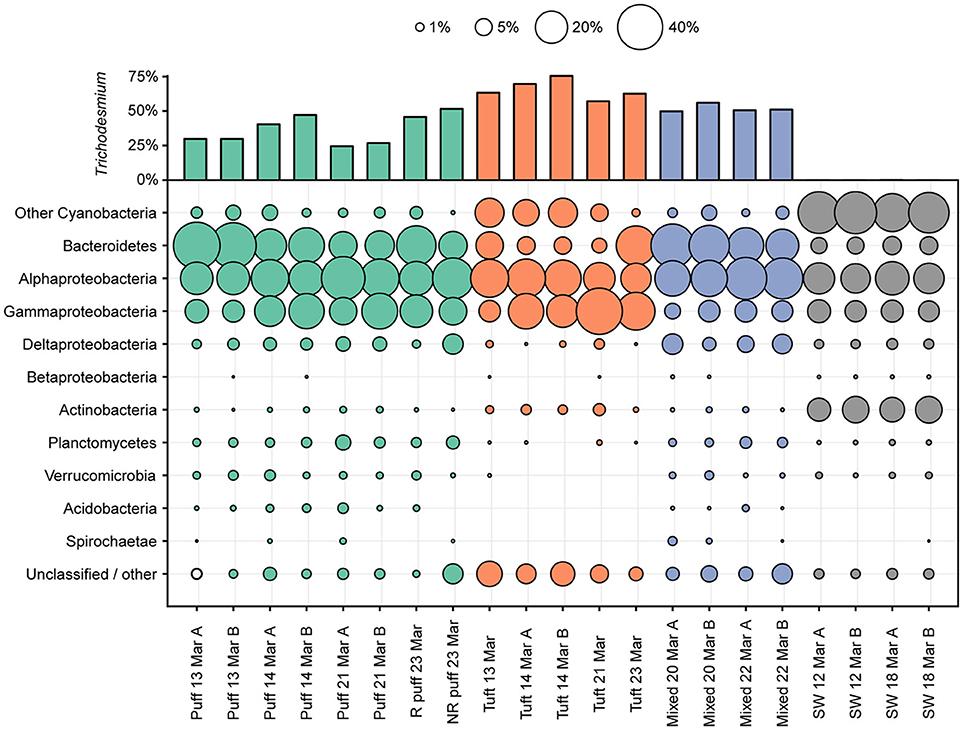
Figure 4. Percentages of partial 16S rRNA gene sequences assigned to bacterial taxa. Percentages of sequences assigned to Trichodesmium are displayed in the upper bar plot. The area plot displays the percentages of non-Trichodesmium sequences assigned to other bacterial taxa. Color indicates the sample type/morphology [green, red, blue, and gray for puff colonies, tuft colonies, mixed colonies, and bulk 25 m seawater (SW), respectively]. R denotes radial and NR denotes non-radial puff morphologies (see Figure 1).
The Trichodesmium epibiont community varied with colony morphology. Trichodesmium colonies with puff morphology (n = 8 samples) contained a smaller fraction of Trichodesmium sequences (24–51% Trichodesmium 16S rRNA), and thus a larger fraction of epibiont sequences, than tuft morphologies (n = 5 samples; 57–75% Trichodesmium 16S rRNA) (Figure 4). The epibiont communities of puff colonies contained a larger fraction of Bacteroidetes (including Cytophagia and Saprospiraceae) and Deltaproteobacteria (including Desulfuromonadales) than tuft colonies (Figure 4, Figure S2). Tuft colonies contained a larger fraction of non-Trichodesmium Cyanobacteria (predominantly Limnothrix) and Gammaproteobacteria (including Alteromonadaceae, Oleiphilaceae, and Piscirickettsiaceae) than puff colonies. There were also differences between puff and tuft colony epibionts at the OTU level: over half of the most abundant Trichodesmium OTUs had significantly different relative abundances between the two morphotypes (Figure S2). NMDS analyses demonstrated that the overall epibiont community structure varied by morphology, with puff colonies clustering separately from tuft colonies (Figure 3).
Alpha diversity metrics were calculated from 16S rRNA gene OTUs at 97% identity (Table 3). Both diversity (Shannon) and species richness (Chao1) varied by sample type (i.e., seawater or morphology) and by day of sampling (p < 0.05, two-way ANOVA). Species richness did not vary among Trichodesmium morphologies (Tukey HSD p > 0.05), but all morphotypes had significantly lower (by a factor of ~2) species richness than surface seawater samples (Tukey HSD p ≤ 0.001). Diversity was higher in Trichodesmium puff samples and mixed morphology samples than in tuft samples (Tukey HSD p < 0.001). Trichodesmium samples of all morphotypes had lower diversity than seawater samples (Tukey HSD p < 0.05); however, when excluding Trichodesmium OTUs, diversity in samples of all Trichodesmium morphotypes were not significantly different from seawater (Tukey HSD p > 0.05). Thus, the Trichodesmium epibiont community had lower species richness, but insignificant differences in evenness, compared to seawater.
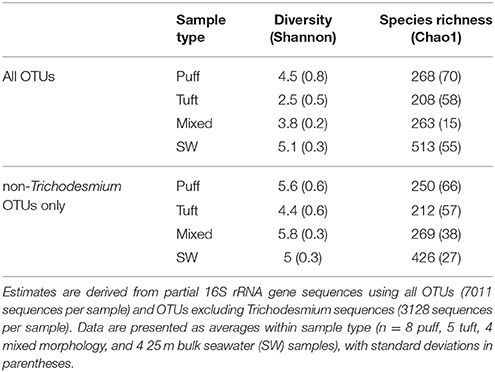
Table 3. Diversity and species richness estimates.
Diazotroph Diversity via nifH Amplicons
We sequenced partial nifH genes and transcripts from Trichodesmium colonies, and from surface seawater samples for comparison, to test for the presence and transcriptional activities of non-Trichodesmium diazotrophs associated with the colonies. While sequences belonging to Trichodesmium dominated the nifH dataset, we also recovered non-Trichodesmium nifH genes and transcripts (Figure 5). In the DNA samples, Trichodesmium represented 64–99% of nifH sequences, with an average of 7% of sequences corresponding to non-Trichodesmium diazotrophs. Most non-Trichodesmium nifH DNA sequences were classified as nifH Cluster III, a group that includes anaerobic microorganisms, such as Desulfovibrio and Clostridium (Zehr et al., 2003). Non-Trichodesmium groups other than Cluster III represented 1.5% of nifH gene sequences, and included previously identified nifH groups, such as 1G (presumed Gammaproteobacteria), 1J/1K (presumed Alpha- and Betaproteobacteria), and a very small percentage of sequences belonging to the cyanobacterium UCYN-A. The non-Trichodesmium diazotrophs associated with the colonies were distinct from diazotrophic taxa in the surrounding seawater, where nifH gene sequences were dominated by UCYN-A and presumed Gammaproteobacteria and contained <0.01% nifH Cluster III.
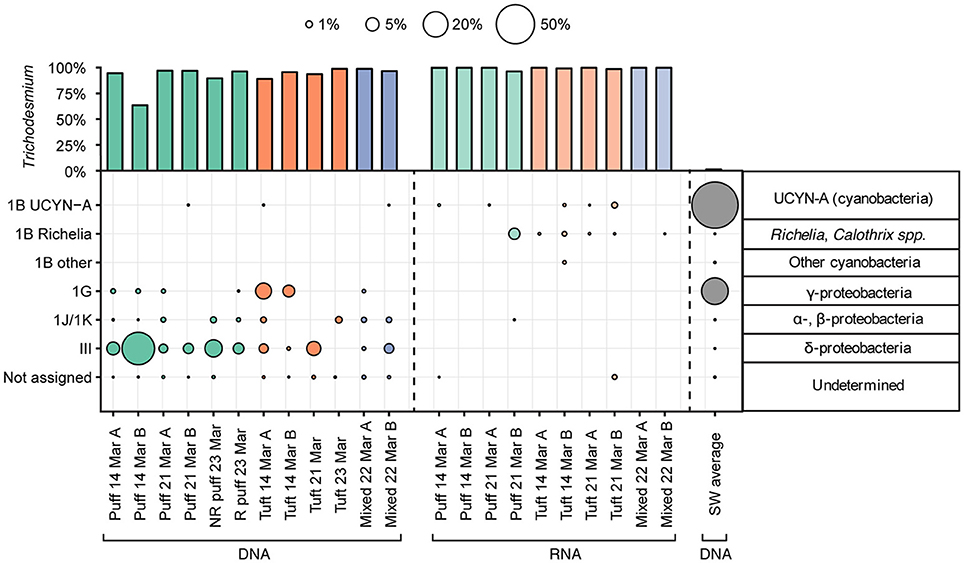
Figure 5. Percentages of nifH gene (left, right) and transcript (center) sequences assigned to nifH cluster groups. Percentages of Trichodesmium sequences are displayed in the upper bar plot; sequences assigned to other taxa are displayed in the lower area plot. Representative taxa from canonical nifH clusters (Zehr et al., 2003) are shown to the right. Color indicates the sample type/morphology [green, red, blue, and gray for puff colonies, tuft colonies, mixed colonies, and bulk 25 m seawater (SW), respectively]. R denotes radial and NR denotes non-radial puff morphologies (see Figure 1).
A much smaller fraction of nifH transcript sequences belonged to non-Trichodesmium diazotrophs (Figure 5). Sequences phylogenetically related to the nifH Cluster III, 1G, and 1J/1K, which constituted a modest proportion of nifH gene sequences, were conspicuously absent from the nifH transcript sequences. The small fraction of non-Trichodesmium nifH transcripts (0–3.5%) belonged to Cyanobacteria, predominantly cyanobacterium UCYN-A and Richelia/Calothrix (with the exception of one sample containing 0.01% 1J/1K, presumed Alpha- and Betaproteobacteria).
The nifH DNA and RNA sequences show that Trichodesmium puff and tuft colonies harbored different communities of non-Trichodesmium diazotrophs (Figure 5). Puff colonies harbored a larger fraction of Cluster III (average 9.6% of nifH gene sequences) than tuft colonies (average 2.1% of nifH DNA sequences), while tuft colonies harbored a larger fraction of 1G (presumed Gammaproteobacteria, average 2.9% of nifH gene sequences) than puff colonies (average 0.2% of nifH gene sequences). Additionally, nifH transcripts from puff and tuft colony morphologies included different phylotypes of heterocystous Cyanobacteria (Richelia/Calothrix). One puff RNA sample contained transcripts derived from the Calothrix SC01/HET-3 group (Foster and Zehr, 2006; Foster et al., 2010). No tuft samples contained Calothrix SC01 sequences, but all 4 tuft RNA samples contained transcripts derived from the Richelia/HET-1 group (Church et al., 2005b). Neither heterocystous phylotype matched qPCR primer sets developed by Momper et al. (2015) to target the heterocystous cyanobiont hetDA (≥4 mismatches with forward primer for both phylotypes; reverse primer was out of our sequencing region).
Metagenomic Taxonomy and Functional Potential
We sequenced metagenomes from two Trichodesmium puff samples collected on 23 Mar 2014 (“radial puff” and “non-radial puff”) and assembled and annotated these sequences along with sequences from a publically available Stn. ALOHA surface seawater metagenome collected in July 2015. Colony metagenomes were dominated by bacteria (>99% of total counts), with ~70% of counts assigned to Cyanobacteria (Table 4). Cyanobacteria accounted for an average of 57 and 67% of counts from a set of 29 single-copy genes (Table S4) from radial and non-radial puff colonies, respectively. Thus, assuming one copy of each of these genes per genome (Nayfach and Pollard, 2015), equal levels of ploidy among taxa, and that the majority of cyanobacterial counts belong to Trichodesmium, both total metagenome and single-copy gene counts produce conservative estimates of ~1 epibiont cell for every 1–3 Trichodesmium cells within colonies. Less than 1% of Trichodesmium colony counts were assigned to Eukarya, Archaea, or viruses, compared to 3.6% of surface seawater counts (Table 4). Eukaryotes represented 0.5 and 0.3% of non-radial and radial puff colony counts, respectfully, with dominant groups including green algae (Streptophyta and Chlorophyta), chordates, heterotrophic flagellates (Choanoflagellida), arthropods, diatoms, ciliates, and fungi (Table 4, Table S5). The relative abundances of bacterial taxa mirrored trends observed in the 16S rRNA gene dataset, with the majority of colony sequences belonging to Cyanobacteria (primarily Trichodesmium), Alphaproteobacteria, Bacteroidetes, and Gammaproteobacteria (Table 4, Figure 4).
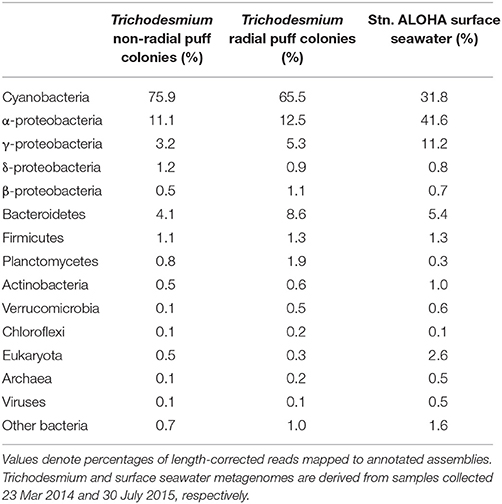
Table 4. Taxonomic assignments from three metagenome samples.
Metagenome counts were annotated to KO and normalized to GPM in order to compare the relative abundance of genes and pathways among samples. However, ~75% of assembled contigs from Trichodesmium colonies failed KO annotation, far exceeding the ~25% of failed contig annotations observed in the surface seawater sample (Table 2). Furthermore, of the sequences that were successfully mapped to annotated contigs, Trichodesmium samples contained a larger fraction of KO with unknown function than the surface seawater sample (Table 2). This resulted in smaller GPM values from Trichodesmium metagenomes than the surface seawater metagenome for most KEGG gene categories (Figure S3). Hence, we chose to use a normalization of counts per million mapped to a KO of known function (GPMK) in order to compare the functional potential of Trichodesmium colonies and surface seawater.
The gene contents of the Trichodesmium colony samples were distinct from those observed in the near-surface seawater. Colonies contained ~40% fewer single-copy GPM than the seawater samples (both in Cyanobacteria and non-Cyanobacteria fractions, Table 2, Table S4), suggesting larger average genome sizes for Trichodesmium and epibiont cells. Summing KOs from KEGG gene groups revealed broad functional differences between colonies and surface seawater (Figure 6). Seawater samples were relatively enriched in KEGG groups including nucleotide and amino acid metabolism, transcription, translation, and replication and repair, while the colony samples were relatively enriched in energy metabolism, metabolism of terpenoids and polyketides, and cell motility.
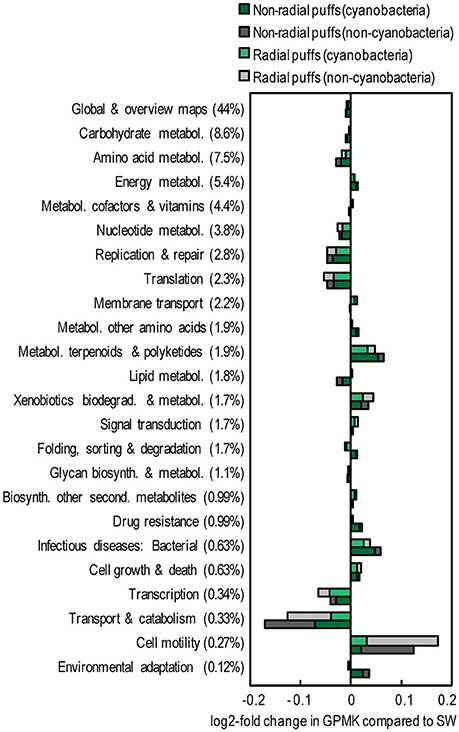
Figure 6. Relative abundance of KEGG gene groups in Trichodesmium colony samples (collected 23 Mar 2014) compared to a surface seawater sample from Stn. ALOHA (collected 30 July 2015). The percentages of total counts within each gene group are provided in parentheses. Colors represent sample type and taxonomic assignment. Pathways involved with organ systems, human disease, and/or representing <0.1% of total GPMK were excluded. Pathways displayed represent >97% of total GPMK.
Trichodesmium colony and surface seawater metagenomes also differed in the abundances of specific genes and pathways involved in nutrient cycling (Figure 7). Colonies were enriched in genes encoding alkaline phosphatase and transporters for phosphate, phosphonates, and Fe(II), but depleted in Fe(III) transporter genes, compared to seawater. There were similar abundances of phosphate starvation response and Fe complex (siderophore) transport genes in colonies and seawater; however, the majority of these genes in the colonies belonged to non-Cyanobacteria (epibionts), which only represented ~30% of total colony metagenome counts. Thus, phosphate starvation response and Fe complex transport genes were enriched in epibionts compared to the surrounding plankton.
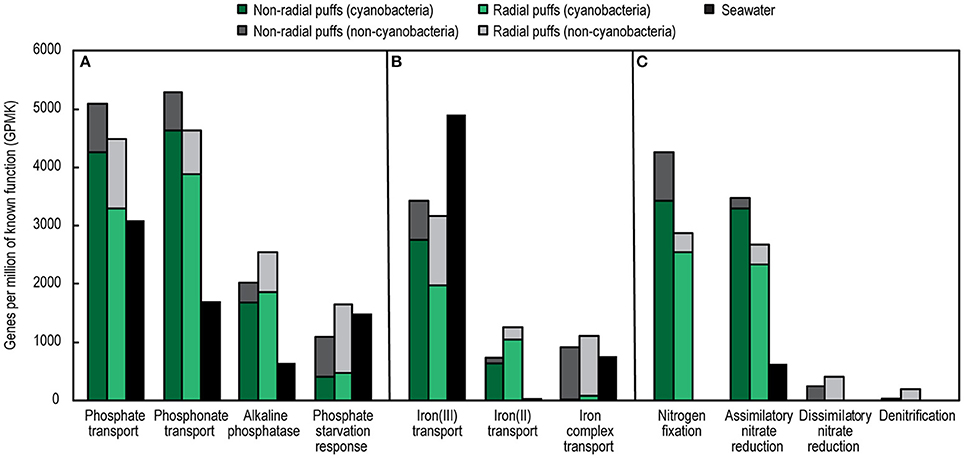
Figure 7. Abundances of select genes and pathways involved in phosphorus (A), iron (B), and nitrogen (C) cycling from Trichodesmium colony and surface seawater metagenomes. Colors represent sample type and taxonomic assignment. See Table S6 for a list of KO included in each pathway.
Trichodesmium colonies were also enriched in N cycling genes. Compared to seawater, the colony metagenomes contained higher total N metabolism gene abundances (34 and 46% higher abundances in radial and non-radial puffs, respectively, Table S6), and were strongly enriched in genes involved in N transformation pathways (Figure 7). Nitrogenase genes were ~2,000X more abundant in colonies than seawater, and included a large fraction assigned to non-Cyanobacteria (11 and 20% of nitrogenase genes in radial and non-radial puff colonies, respectively). Assimilatory nitrate reduction genes were present in both colony and seawater samples, but were ~5X more abundant in colonies, where the majority of genes corresponded to Cyanobacteria. Dissimilatory nitrate reduction and denitrification genes were absent in seawater samples but present in both colony samples; genes in these pathways were nearly exclusively assigned to non-Cyanobacteria (Figure 7). Genes involved in nitrification pathways were not observed in colony or seawater metagenomes.
Discussion
Several decades of research have documented the presence of bacterial and eukaryotic epibionts inhabiting Trichodesmium colonies (Borstad and Borstad, 1977; Siddiqui et al., 1992; Rouco et al., 2016), but the taxonomic composition and functional potential of these associated communities are not well-understood. Here, we used a variety of molecular tools to probe the diversity of Trichodesmium and associated epibionts in colonies from the NPSG. We found that the colonies were dominated by a single clade of Trichodesmium, but harbored a diverse community of associated microorganisms. These microbial assemblages were distinct from the surrounding seawater, differed by colony morphology, and included bacteria with a known preference for surface attachment, as well as putative anaerobic diazotrophs. Colony metagenomes contain genes and pathways not present in Trichodesmium genomes, including siderophore transport and denitrification genes, which likely affects the biogeochemical functioning of Trichodesmium colonies.
Trichodesmium Species Diversity
The abundance and distribution of Trichodesmium have been studied extensively, but most work has focused on Trichodesmium at the genus-level, using techniques including microscopy, video plankton recording, and satellite imaging (e.g., Dugdale, 1961; Subramaniam et al., 2001; Davis and McGillicuddy, 2006). In the laboratory, Trichodesmium isolates have been phylogenetically classified into four major clades (based on the hetR and ITS genes), with the majority of isolates falling into Clade I (e.g., T. thiebautii) and Clade III (e.g., T. erythraeum) (Orcutt et al., 2002; Hynes et al., 2012), but the geographical distributions of these clades in field populations has only begun to be investigated. Our finding of Clade I dominance is in agreement with recent surveys in the N. Pacific, N. Atlantic, and S. Pacific (Hmelo et al., 2012; Gradoville et al., 2014; Rouco et al., 2014, 2016), which all observed the majority of Trichodesmium sequences belonging to Clade I. However, most physiological studies of Trichodesmium use the cultivated Clade III laboratory isolate T. erythraeum IMS101. Isolates from Clade I and Clade III appear to respond differently to environmental stimuli; for example, elevating pCO2 enhances rates of N2 and C fixation by Clade III isolates IMS101 and GBRTRLI101 but not by the Clade I isolate H9-4 (Hutchins et al., 2007, 2013). While more work is needed to resolve the spatial and temporal variability of Trichodesmium species biogeography, current evidence suggests that at a global scale Trichodesmium Clade I may be more abundant than Clade III. Hence, modeling studies using the response of isolate IMS101 to predict the pCO2 response of natural Trichodesmium populations should be viewed with caution. In addition, our findings agree with previous reports that colony morphology is not an accurate proxy for Trichodesmium clade (Hynes et al., 2012), as both puff and tuft colony samples were composed of >99% Clade I (Figure 2).
Diversity of Associated Microbiome
Our samples contained diverse bacterial and eukaryotic taxa associated with Trichodesmium colonies. While relative abundances derived from metagenomic and 16S rRNA gene sequences can be biased by taxa-specific genome sizes and copy numbers of genes and genomes (e.g., Sargent et al., 2016), respectively, the large fractions of non-Trichodesmium sequences in both datasets suggest that epibionts are numerically abundant within the colonies. Colony metagenome sequences were dominated by bacteria, but we also observed sequences from viruses, Archaea, and many eukaryotic taxa previously observed associated with Trichodesmium colonies (Borstad and Borstad, 1977; Sheridan et al., 2002). Bacterial species richness within colonies was ~10-fold higher than the richness previously assessed for Atlantic colonies using clone libraries (Hmelo et al., 2012), and approximately half of the richness in surrounding seawater, reaffirming that colonies harbor a diverse epibiont community (Sheridan et al., 2002; Rouco et al., 2016).
The taxonomic composition of colony epibionts was distinct from that of the surrounding bacterioplankton. The warm, oligotrophic waters of the NPSG are known to be dominated by the Cyanobacteria Prochlorococcus (Campbell et al., 1994) and photo- and chemoheterotrophs including SAR11 and Rhodobacteraceae (DeLong et al., 2006). Indeed, the most abundant taxa in our near-surface seawater samples were those clustering among Prochlorococcus, Synechococcus, and the small photoheterotroph Actinomarina (SAR11 represented only 3.2% of seawater sequences, likely due to a known bias in the 16S rRNA gene primer set used, Apprill et al., 2015); however, these taxa were all conspicuously absent from Trichodesmium colony samples. The relative absence of typical oligotrophic bacteria with streamlined genomes in colonies could be due to elevated nutrient concentrations favoring copiotrophic taxa (Lauro et al., 2009; Giovannoni et al., 2014), and is consistent with previous observations of large marine particle size classes being enriched with copiotrophic bacterial genes (Allen et al., 2013). Instead, colony epibionts were dominated by Bacteroidetes, Alphaproteobacteria, and Gammaproteobacteria, which is consistent with previous 16S rRNA gene surveys of microbial communities associated with Trichodesmium (Hmelo et al., 2012; Rouco et al., 2016). Several dominant epibiont taxa have been previously observed associated with marine particulates, including the Bacteroidetes classes Cytophagia and Flavobacteriia (DeLong et al., 1993; Crump et al., 1999; Bryant et al., 2016), Alteromonadales (Fontanez et al., 2015), and Planctomycetes (DeLong et al., 1993). Though epibiont communities had several abundant taxa in common with the surrounding seawater at the order-level (e.g., Rhodobacterales, Rhodospirillales, and Oceanospirillales), there were few commonalities with surface seawater phylotypes at the 97% OTU-level. The distinct community structure and lower species richness of epibionts compared to surrounding bacterioplankton, and the commonalities between epibiont taxa from our samples and previous Trichodesmium studies (Hmelo et al., 2012; Rouco et al., 2016) together suggest that Trichodesmium colonies provide a niche favoring select bacterial taxa.
In addition, we observed distinct epibiont communities associated with puff and tuft colonies, in agreement with Rouco et al. (2016), as well as evidence that certain bacterial species may consistently associate with specific morphotypes. Tuft colonies contained a larger fraction of Trichodesmium 16S rRNA gene sequences than puff colonies, possibly due to less colonizable surface area in this morphotype, which likely drives the lower diversity values observed for tufts (Table 3). This finding contrasts with the microscopic observations of Sheridan et al. (2002), who reported tuft colonies harboring higher bacterial densities than puff colonies. Furthermore, the epibiont composition differed between the two morphologies, both in terms of phyla-level taxonomy (e.g., puffs contained more Bacteroidetes and tufts contained more non-Trichodesmium Cyanobacteria, Figure 4) and, even more strikingly, in the relative abundance of specific phylotypes (Figure S2). For example, a phylotype clustering among the filamentous Cyanobacteria Limnothrix represented 11.7% of non-Trichodesmium tuft sequences but only 0.1% of non-Trichodesmium puff sequences. Filamentous Cyanobacteria have been observed in close association with Trichodesmium filaments from tuft colonies (e.g., Paerl et al., 1989a; Siddiqui et al., 1992; Hewson et al., 2009), and Limnothrix-like sequences represented 31% of 16S rRNA gene clone library sequences in tuft (but not puff) colonies from the N. Atlantic (Hmelo et al., 2012). Thus, this Limnothrix phylotype may be a common associate of Trichodesmium tufts. Likewise, Microscilla represented 7.7% of tufts but only 0.01% of non-Trichodesmium puff sequences, and this genus has been previously recovered from Trichodesmium tufts in the N. Pacific, N. Atlantic, and Caribbean Sea (Janson et al., 1999; Rouco et al., 2016). Puff colonies also contained abundant phylotypes which were relatively absent from tufts, including Alphaproteobacteria and Bacteroidetes phylotypes, the cyanobacterium Rivularia, and a Marinicella phylotype which shares 100% nucleotide sequence identity to a sequence previously recovered from Trichodesmium colonies (accession GU726121). It is remarkable that so many phylotypes had significantly different relative abundances between the two morphotypes (Figure S2), and also that many of the most abundant genera from our samples have also been dominant in previous surveys of Trichodesmium epibionts (Hmelo et al., 2012; Rouco et al., 2016). Since the species composition of Trichodesmium did not vary by colony morphology, physical (i.e., filament compactness, colonizable surface area) and/or chemical properties of puff and tuft colonies likely drive the observed differences in epibiont community structure.
Colony-Associated Diazotrophs
There have been several reports of cyanobacterial and heterotrophic diazotrophs associated with Trichodesmium colonies (Paerl et al., 1989b; Gradoville et al., 2014; Momper et al., 2015), but the community composition and metabolic activity of these organisms have been largely unexplored. Here, we used high-throughput sequencing of partial nifH genes and transcripts to explore the diversity of colony-associated diazotrophs. We observed non-Trichodesmium nifH genes (including genes from putative heterotrophs) in all Trichodesmium DNA samples, representing 1–35% of the colony nifH sequences (Figure 5).
The ecological importance of non-cyanobacterial marine diazotrophs is a current enigma in N2 fixation research: non-cyanobacterial nifH genes have been recovered from numerous marine environments (Bombar et al., 2016), but rates of N2 fixation in marine environments dominated by non-cyanobacterial diazotrophs are often low or undetectable (e.g., Knapp et al., 2016; Gradoville et al., 2017). Here, we found robust evidence that Trichodesmium colonies comprise yet another habitat for these seemingly cosmopolitan organisms. The majority of our non-Trichodesmium nifH gene sequences phylogenetically grouped among Cluster III nifH genes, which includes diverse anaerobic microorganisms (Zehr et al., 2003). The possibility of anaerobic bacteria inhabiting Trichodesmium colonies appears plausible since colonies have been reported to contain anoxic microzones (Paerl and Bebout, 1988); indeed, we also found denitrification and Fe(II) transporter genes enriched in colony metagenomes (see Functional potential within Trichodesmium colonies). However, nifH Cluster III contains diverse lineages (Zehr et al., 2003), and the physiology and ecology of these organisms are not well-understood. In our study, the three most abundant Cluster III OTUs each share <85% nucleotide identity with any cultured representative in the BLASTn database. One of these OTUs matches a qPCR primer/probe set designed by Church et al. (2005a) to quantify a specific group of Cluster III nifH sequence-types in the NPSG, while all three OTUs share >99% nucleotide identity with sequences previously obtained from Trichodesmium colonies at Stn. ALOHA (Gradoville et al., 2014). Such results suggest that Trichodesmium colonies may selectively harbor members of the Cluster III nifH phylotypes, including organisms not currently captured by existing Cluster III qPCR primers and probes (Church et al., 2005a).
It is interesting to note that both Cluster III and the 1J/1K (presumed Alpha- and Betaproteobacteria) group had higher relative abundances in our Trichodesmium colony samples than in the surrounding seawater, where nifH sequences were dominated by the unicellular cyanobacterium UCYN-A, the Gammaproteobacterial nifH group 1G, and other Cyanobacteria including Trichodesmium (Figure 5). This suggests that Trichodesmium colonies may represent a niche for Cluster III and 1J/1K diazotrophs. It is possible that the relative enrichment of these groups in Trichodesmium colonies could reflect a preference for marine particulates—for example, Bryant et al. (2016) observed marine plastic particles to be enriched in nifH genes—rather than a unique property of the colonies themselves. Marine particles may be favorable environments for heterotrophic diazotrophs (Bombar et al., 2016), especially putative anaerobic Cluster III taxa, which could inhabit anoxic microzones of particles (Benavides et al., 2015). Future research is needed to determine whether Trichodesmium colonies represent an important niche for nifH Cluster III diazotrophs in the NPSG and other oceanic regions.
Though Trichodesmium nifH amplicons included genes belonging to non-Cyanobacteria, the absence of non-cyanobacterial nifH transcripts suggests that these taxa were not actively fixing N2 at the time of sampling (Figure 5). However, we did observe non-Trichodesmium cyanobacterial nifH transcripts, mostly belonging to two OTUs in the heterocystous Calothrix/Richelia group. One of the Calothrix/Richelia OTUs matched primer/probe sets for group HET-1 (Church et al., 2005b), and was present in all tuft RNA samples, while another Calothrix/Richelia OTU, present in one puff RNA sample, matched primer/probe sets for the SC01/HET-3 group (Foster and Zehr, 2006; Foster et al., 2010). This suggests that there may be morphotype-specific associations between heterocystous Cyanobacteria and Trichodesmium other than the cohabitation described by Momper et al. (2015). While Calothrix/Richelia sequences were absent in the nifH DNA dataset (likely due to poor amplification of this group by the nifH primers used; Turk-Kubo et al., 2015), we did see evidence of heterocystous Cyanobacteria inhabiting colonies in the 16S rRNA datset (Rivularia and a small number of Richelia sequences; Figure S2, Table S3). Furthermore, the presence of Calothrix/Richelia nifH transcripts indicates high cell-specific transcription rates by this group. Our observation of higher nifH transcription levels in cyanobacterial diazotrophs than non-cyanobacterial diazotrophs is consistent with previous nifH gene expression surveys using bulk seawater from Stn. ALOHA (Church et al., 2005b).
Functional Potential within Trichodesmium Colonies
Our metagenomic data suggest that Trichodesmium epibionts may benefit from a colony-associated lifestyle and influence nutrient cycling within colonies. Epibionts appeared to possess larger average genome sizes than bulk plankton, suggesting non-streamlined genomes, consistent with the relative absence of oligotrophic taxa (Prochlorococcus, Actinomarina, etc.) observed in colonies. Furthermore, epibionts were depleted in genes involved in replication and basic metabolic functioning relative to seawater metagenomes, again consistent with a lack of streamlined genomes (Giovannoni et al., 2014). Instead, colony samples were enriched in genes involved in motility, which could be useful in a colony-associated lifestyle, and in metabolic pathways not present in the seawater metagenome (Figures 6, 7, Table S6). Additionally, a large fraction of Trichodesmium colony contigs failed annotation. This could be due to the large fraction of non-coding DNA in the Trichodesmium genome (Walworth et al., 2015), but could also arise from a larger fraction of uncultivated microorganisms in the Trichodesmium microbiome than in the surrounding seawater. Likewise, colony samples contained a larger fraction of genes with unknown function than seawater samples. Our findings of enrichments in copiotrophic taxa, motility genes, and genes of unknown function within Trichodesmium colonies have also been observed in particle-attached marine microbial communities (Simon et al., 2014).
The NPSG is a chronically oligotrophic system, with production rates limited by the availability of N (Karl et al., 1997) and sometimes P (Karl et al., 1995). Since diazotrophs such as Trichodesmium circumvent N limitation through N2 fixation, their growth and N2 fixation rates are typically limited by the availability of P and/or Fe (as well as light and temperature, Luo et al., 2014). Hence, there is considerable interest in understanding the mechanisms of P and Fe acquisition by Trichodesmium. We observed enrichments in alkaline phosphatase, phosphate transport, and phosphonate transport genes in colonies, which agrees with previous demonstrations of efficient organic phosphorus scavenging and utilization by Trichodesmium (Dyhrman et al., 2006). Furthermore, colony epibionts contained genes encoding the synthase for acyl homoserine lactoses (Table S6), quorum sensing molecules which have been shown to stimulate alkaline phosphatase activity by Trichodesmium cells in culture (Van Mooy et al., 2011). We also found that phosphate starvation response genes were enriched in epibionts, which could reflect P-limitation due to the release of inorganic and organic N compounds by Trichodesmium cells (Capone et al., 1994; Mulholland et al., 2004).
The genes involved in Fe transport also differed between colony and seawater metagenomes. Fe(II) transporters were enriched in colony samples, consistent with previous observations of these genes in Trichodesmium isolates (Chappell and Webb, 2010), but were nearly absent in the seawater metagenome. In well-oxygenated seawater, most Fe exists as Fe(III), hence our observation of epibionts enriched in Fe(II) transport genes suggests that low-oxygen microzones within colonies could result in reduction of Fe(III). Additionally, we found low abundances of cyanobacterial siderophore transport genes, reflecting the inability of Trichodesmium to use highly chelated Fe sources (Chappell and Webb, 2010), but these genes were enriched in non-cyanobacterial epibionts. Our observations of abundant P and Fe acquisition genes in Trichodesmium and epibionts could reflect competition for these resources in the colony community. However, we also found metagenomic evidence for previously described potential mutualisms, as epibionts could facilitate Trichodesmium nutrient uptake through quorum sensing (Van Mooy et al., 2011) and siderophore production (Roe et al., 2012).
Finally, we observed the genetic capacity for denitrification within Trichodesmium colonies. Both colony samples contained all necessary genes for the denitrification and dissimilatory nitrate reduction pathways, while no genes from either pathway were observed in the seawater sample. Furthermore, 16S OTU 18, comprising 9.9% of non-Trichodesmium 16S rRNA gene sequences from tuft colonies, was classified as the denitrifier Nisaea sp. These results agree with Wyman et al. (2013), who reported nosZ amplicons isolated from Trichodesmium colonies in the Arabian Sea. Denitrification within the colonies would be biogeochemically significant, producing a tight spatial coupling between N2 fixation and denitrification and reducing apparent colony N2 fixation rates. However, denitrification requires nitrate, and we did not observe any nitrification genes within colonies (Table S6), although it is possible that nitrate could be supplied through diurnal migration to deeper nitrate-rich waters (Walsby, 1978). Furthermore, denitrification is an anaerobic process, and while early reports indicated that colonies could contain anoxic zones (Paerl and Bebout, 1988), more recent work has found no evidence for this (Eichner et al., 2017). Thus, it is possible that the presence of denitrification genes does not indicate active denitrification within colonies, but rather reflects the diverse gene repertoire of copiotrophic epibionts.
Conclusions
Our multifaceted high-throughput sequencing approach enabled a detailed view of the Trichodesmium colony microbiome. While the species composition of Trichodesmium was dominated by a single clade and uniform in all of our samples, the community structure of bacterial epibionts differed between puff and tuft colony morphologies, suggesting that differences in biogeochemical rates among colony morphologies may be driven by processes carried out by the associated microbiome. Epibionts appear copiotrophic, with the genetic capacity to influence colony nutrient cycling. Additionally, we found that colonies contained active cyanobacterial diazotrophs and presumed heterotrophic and anaerobic diazotrophs, suggesting that Trichodesmium colonies harbor a unique microbial community with the potential to influence rate processes classically attributed to Trichodesmium spp.
Author Contributions
This study was conceived by MG. Data were collected by MG and analyzed by MG, BC, MC, RL, and AW. MG wrote the first draft of the manuscript. All authors contributed substantial revisions through the drafting process and approved the final submitted manuscript.
Conflict of Interest Statement
The authors declare that the research was conducted in the absence of any commercial or financial relationships that could be construed as a potential conflict of interest.
Acknowledgments
Support for this project was provided by the National Science foundation through the Center for Microbial Oceanography: Research and Education (C-MORE; EF0424599) and the Simons Collaboration on Ocean Processes and Ecology (SCOPE award ID 329108). We are grateful to Ed Delong and Frank Aylward for supplying Stn. ALOHA metagenome data.
Supplementary Material
The Supplementary Material for this article can be found online at: http://journal.frontiersin.org/article/10.3389/fmicb.2017.01122/full#supplementary-material
References
Allen, A. E., Allen, L. Z., and McCrow, J. P. (2013). Lineage specific gene family enrichment at the microscale in marine systems. Curr. Opin. Microbiol. 16, 605–617. doi: 10.1016/j.mib.2013.10.001
Apprill, A., McNally, S., Parsons, R., and Webe, L. (2015). Minor revision to V4 region SSU rRNA 806R gene primer greatly increases detection of SAR11 bacterioplankton. Aquat. Microb. Ecol. 75, 129–137. doi: 10.3354/ame01753
Benavides, M., Moisander, P. H., Berthelot, H., Dittmar, T., Grosso, O., and Bonnet, S. (2015). Mesopelagic N2 fixation related to organic matter composition in the Solomon and Bismarck Seas (Southwest Pacific). PLoS ONE 10:e0143775. doi: 10.1371/journal.pone.0143775
Bombar, D., Paerl, R. W., and Riemann, L. (2016). Marine non-cyanobacterial diazotrophs: moving beyond molecular detection. Trends Microbiol. 24, 916–927. doi: 10.1016/j.tim.2016.07.002
Borstad, G., and Borstad, L. (1977). “The Oscillatoria erythraea (Cyanophyta) community of associates,” in Cooperative Investigations of the Caribbean and Adjacent Regions-II, ed H. B. Stewart, FAO Fish. Report 200, 51–57.
Böttjer, D., Dore, J. E., Karl, D. M., Letelier, R. M., Mahaffey, C., Wilson, S. T., et al. (2017). Temporal variability of nitrogen fixation and particulate nitrogen export at Station ALOHA. Limnol. Oceanogr. 62, 200–216. doi: 10.1002/lno.10386
Bryant, J. A., Clemente, T. M., Viviani, D. A., Fong, A. A., Thomas, K. A., Kemp, P., et al. (2016). Diversity and activity of communities inhabiting plastic debris in the North Pacific Gyre. mSystems 1, e00024–e00016. doi: 10.1128/mSystems.00024-16
Campbell, L., Nolla, H., and Vaulot, D. (1994). The importance of Prochlorococcus to community structure in the central North Pacific Ocean. Limnol. Oceanogr. 39, 954–961. doi: 10.4319/lo.1994.39.4.0954
Capone, D. G., Burns, J. A., Montoya, J. P., Subramaniam, A., Mahaffey, C., Gunderson, T., et al. (2005). Nitrogen fixation by Trichodesmium spp.: an important source of new nitrogen to the tropical and subtropical North Atlantic Ocean. Glob. Biogeochem. Cycles 19, GB2024. doi: 10.1029/2004GB002331
Capone, D. G., Ferrier, M. D., and Carpenter, E. J. (1994). Amino acid cycling in colonies of the planktonic marine cyanobacterium Trichodesmium thiebautii. Appl. Env. Microbiol. 60, 3989–3995.
Caporaso, J. G., Kuczynski, J., Stombaugh, J., Bittinger, K., Bushman, F. D., Costello, E. K., et al. (2010). QIIME allows analysis of high-throughput community sequencing data. Nat. Methods 7, 335–336. doi: 10.1038/nmeth.f.303
Chappell, P. D., and Webb, E. A. (2010). A molecular assessment of the iron stress response in the two phylogenetic clades of Trichodesmium. Env. Microbiol. 12, 13–27. doi: 10.1111/j.1462-2920.2009.02026.x
Church, M. J., Jenkins, B. D., Karl, D. M., and Zehr, J. P. (2005a). Vertical distributions of nitrogen-fixing phylotypes at Stn ALOHA in the oligotrophic North Pacific Ocean. Aquat. Microb. Ecol. 38, 3–14. doi: 10.3354/ame038003
Church, M. J., Short, C. M., Jenkins, B. D., Karl, D. M., and Zehr, J. P. (2005b). Temporal patterns of nitrogenase gene (nifH) expression in the oligotrophic North Pacific Ocean. Appl. Env. Microbiol. 71, 5362–5370. doi: 10.1128/AEM.71.9.5362-5370.2005
Coles, V. J., Hood, R. R., Pascual, M., and Capone, D. G. (2004). Modeling the impact of Trichodesmium and nitrogen fixation in the Atlantic Ocean. J. Geophys. Res. 109, C06007. doi: 10.1029/2002JC001754
Crump, B. C., Armbrust, E. V., and Baross, J. A. (1999). Phylogenetic analysis of particle-attached and free-living bacterial communities in the Columbia River, its estuary, and the adjacent coastal ocean. Appl. Env. Microbiol. 65, 3192–3204.
Davis, C. S., and McGillicuddy, D. J. (2006). Transatlantic abundance of the N2-fixing colonial cyanobacterium Trichodesmium. Science 312, 1517–1520. doi: 10.1126/science.1123570
DeLong, E. F., Franks, D. G., and Alldredge, A. L. (1993). Phylogenetic diversity of aggregate-attached vs. free-living marine bacterial assemblages. Limnol. Oceanogr. 38, 924–934. doi: 10.4319/lo.1993.38.5.0924
DeLong, E. F., Preston, C. M., Mincer, T., Rich, V., Hallam, S. J., Frigaard, N. U., et al. (2006). Community genomics among stratified microbial assemblages in the ocean's interior. Science 311, 496–503. doi: 10.1126/science.1120250
Dugdale, R. (1961). Nitrogen fixation in the Sargasso Sea. Deep Sea Res. Pt. II 7, 297–300. doi: 10.1016/0146-6313(61)90051-x
Dyhrman, S., Chappell, P., Haley, S., Moffett, J., Orchard, E., Waterbury, J., et al. (2006). Phosphonate utilization by the globally important marine diazotroph Trichodesmium. Nature 439, 68–71. doi: 10.1038/nature04203
Dyhrman, S. T., Benitez-Nelson, C. R., Orchard, E. D., Haley, S. T., and Pellechia, P. J. (2009). A microbial source of phosphonates in oligotrophic marine systems. Nat. Geosci. 2, 696–699. doi: 10.1038/ngeo639
Edgar, R. C. (2010). Search and clustering orders of magnitude faster than BLAST. Bioinformatics 26, 2460–2461. doi: 10.1093/bioinformatics/btq461
Eichner, M. J., Klawonn, I., Wilson, S. T., Littmann, S., Whitehouse, M. J., Church, M. J., et al. (2017). Chemical microenvironments and single-cell carbon and nitrogen uptake in field-collected colonies of Trichodesmium under different pCO2. ISME J. 11, 1305–1317. doi: 10.1038/ismej.2017.15
Fontanez, K. M., Eppley, J. M., Samo, T. J., Karl, D. M., and DeLong, E. F. (2015). Microbial community structure and function on sinking particles in the North Pacific Subtropical Gyre. Front. Microbiol. 6:469. doi: 10.3389/fmicb.2015.00469
Foster, R. A., Goebel, N. L., and Zehr, J. P. (2010). Isolation of Calothrix rhizosoleniae (cyanobacteria) strain SC01 from Chaetoceros (Bacillariophyta) spp. diatoms of the Subtropical North Pacific ocean. J. Phycol. 46, 1028–1037. doi: 10.1111/j.1529-8817.2010.00885.x
Foster, R. A., and Zehr, J. P. (2006). Characterization of diatom–cyanobacteria symbioses on the basis of nifH, hetR and 16S rRNA sequences. Env. Microbiol. 8, 1913–1925. doi: 10.1111/j.1462-2920.2006.01068.x
Giovannoni, S. J., Cameron Thrash, J., and Temperton, B. (2014). Implications of streamlining theory for microbial ecology. ISME J. 8, 1553–1565. doi: 10.1038/ismej.2014.60
Gradoville, M. R., Bombar, D., Crump, B. C., Letelier, R. M., Zehr, J. P., and White, A. E. (2017). Diversity and activity of nitrogen-fixing communities across ocean basin. Limnol. Oceanogr. doi: 10.1002/lno.10542. [Epub ahead of print].
Gradoville, M. R., White, A. E., Böttjer, D., Church, M. J., and Letelier, R. M. (2014). Diversity trumps acidification: lack of evidence for carbon dioxide enhancement of Trichodesmium community nitrogen or carbon fixation at Station ALOHA. Limnol. Oceanogr. 59, 645–659. doi: 10.4319/lo.2014.59.3.0645
Hewson, I., Poretsky, R. S., Dyhrman, S. T., Zielinski, B., White, A. E., Tripp, H. J., et al. (2009). Microbial community gene expression within colonies of the diazotroph, Trichodesmium, from the Southwest Pacific Ocean. ISME J. 3, 1286–1300. doi: 10.1038/ismej.2009.75
Hmelo, L. R., Van Mooy, B. A. S., and Mincer, T. J. (2012). Characterization of bacterial epibionts on the cyanobacterium Trichodesmium. Aquat. Microb. Ecol. 67, 1–14. doi: 10.3354/ame01571
Huntemann, M., Ivanova, N. N., Mavromatis, K., Tripp, H. J., Paez-Espino, D., Palaniappan, K., et al. (2015). The standard operating procedure of the DOE-JGI Microbial Genome Annotation Pipeline (MGAP v. 4). Stand. Genomic Sci. 10:86. doi: 10.1186/s40793-015-0077-y
Hutchins, D. A., Fu, F.-X., Webb, E. A., Walworth, N., and Tagliabue, A. (2013). Taxon-specific response of marine nitrogen fixers to elevated carbon dioxide concentrations. Nat. Geosci. 6, 790–795. doi: 10.1038/ngeo1858
Hutchins, D., Fu, F. X., Zhang, Y., Warner, M., Feng, Y., Portune, K., et al. (2007). CO2 control of Trichodesmium N2 fixation, photosynthesis, growth rates, and elemental ratios: implications for past, present, and future ocean biogeochemistry. Limnol. Oceanogr. 52, 1293–1304. doi: 10.4319/lo.2007.52.4.1293
Hynes, A. M., Webb, E. A., Doney, S. C., and Waterbury, J. B. (2012). Comparison of cultured Trichodesmium (Cyanophyceae) with species characterized from the field. J. Phycol. 48, 196–210. doi: 10.1111/j.1529-8817.2011.01096.x
Janson, S., Bergman, B., Carpenter, E. J., Giovannoni, S. J., and Vergin, K. (1999). Genetic analysis of natural populations of the marine diazotrophic cyanobacterium Trichodesmium. FEMS Microbiol. Ecol. 30, 57–65. doi: 10.1111/j.1574-6941.1999.tb00635.x
Kanehisa, M., and Goto, S. (2000). KEGG: Kyoto Encyclopedia of Genes and Genomes. Nucleic Acids Res. 28, 27–30. doi: 10.1093/nar/28.1.27
Karl, D., Letelier, R., Hebel, D., Tupas, L., Dore, J., Christian, J., et al. (1995). Ecosystem changes in the North Pacific subtropical gyre attributed to the 1991–92 El Nino. Nature 373, 230–234. doi: 10.1038/373230a0
Karl, D., Letelier, R., Tupas, L., Dore, J., Christian, J., and Hebel, D. (1997). The role of nitrogen fixation in biogeochemical cycling in the subtropical North Pacific Ocean. Nature 388, 533–538. doi: 10.1038/41474
Karl, D., Michaels, A., Bergman, B., Capone, D., Carpenter, E., Letelier, R., et al. (2002). Dinitrogen fixation in the world's oceans. Biogeochemistry 57, 47–98. doi: 10.1023/A:1015798105851
Knapp, A. N., Casciotti, K. L., Berelson, W. M., Prokopenko, M. G., and Capone, D. G. (2016). Low rates of nitrogen fixation in eastern tropical South Pacific surface waters. Proc. Natl. Acad. Sci. U. S.A. 113, 4398–4403. doi: 10.1073/pnas.1515641113
Kozich, J. J., Westcott, S. L., Baxter, N. T., Highlander, S. K., and Schloss, P. D. (2013). Development of a dual-index sequencing strategy and curation pipeline for analyzing amplicon sequence data on the MiSeq Illumina sequencing platform. Appl. Env. Microbiol. 79, 5112–5120. doi: 10.1128/AEM.01043-13
Langmead, B., and Salzberg, S. L. (2012). Fast gapped-read alignment with Bowtie 2. Nat. Methods 9, 357–359. doi: 10.1038/nmeth.1923
Lauro, F. M., McDougald, D., Thomas, T., Williams, T. J., Egan, S., Rice, S., et al. (2009). The genomic basis of trophic strategy in marine bacteria. Proc. Natl. Acad. Sci. U.S.A. 106, 15527–15533. doi: 10.1073/pnas.0903507106
Legendre, L., and Gosselin, M. (1997). Estimation of N or C uptake rates by phytoplankton using 15N or 13C: revisiting the usual computation formulae. J. Plankton Res. 19, 263–271. doi: 10.1093/plankt/19.2.263
Letelier, R. M., and Karl, D. M. (1996). Role of Trichodesmium spp. in the productivity of the subtropical North Pacific Ocean. Mar. Ecol. Prog. Ser. 133, 263–273. doi: 10.3354/meps133263
Li, D., Liu, C.-M., Luo, R., Sadakane, K., and Lam, T.-W. (2015). MEGAHIT: an ultra-fast single-node solution for large and complex metagenomics assembly via succinct de Bruijn graph. Bioinformatics 31, 1674–1676. doi: 10.1093/bioinformatics/btv033
Li, H., Handsaker, B., Wysoker, A., Fennell, T., Ruan, J., Homer, N., et al. (2009). The sequence alignment/map format and SAMtools. Bioinformatics 25, 2078–2079. doi: 10.1093/bioinformatics/btp352
Lomas, M., Hopkinson, B., Losh, J., Ryan, D., Shi, D., Xu, Y., et al. (2012). Effect of ocean acidification on cyanobacteria in the subtropical North Atlantic. Aquat. Microb. Ecol. 66, 211–222. doi: 10.3354/ame01576
Lundgren, P., Janson, S., Jonasson, S., Singer, A., and Bergman, B. (2005). Unveiling of novel radiations within Trichodesmium cluster by hetR gene sequence analysis. Appl. Env. Microbiol. 71, 190–196. doi: 10.1128/AEM.71.1.190-196.2005
Luo, Y.-W., Lima, I., Karl, D., Deutsch, C., and Doney, S. (2014). Data-based assessment of environmental controls on global marine nitrogen fixation. Biogeosciences 11, 691–708. doi: 10.5194/bg-11-691-2014
Mahaffey, C., Michaels, A. F., and Capone, D. G. (2005). The conundrum of marine N2 fixation. Am. J. Sci. 305, 546–595. doi: 10.2475/ajs.305.6-8.546
Mohr, W., Großkopf, T., Wallace, D. W. R., and LaRoche, J. (2010). Methodological underestimation of oceanic nitrogen fixation rates. PLoS ONE 5:e12583. doi: 10.1371/journal.pone.0012583
Momper, L. M., Reese, B. K., Carvalho, G., Lee, P., and Webb, E. A. (2015). A novel cohabitation between two diazotrophic cyanobacteria in the oligotrophic ocean. ISME J. 9, 882–893. doi: 10.1038/ismej.2014.186
Montoya, J. P., Voss, M., Kahler, P., and Capone, D. G. (1996). A simple, high-precision, high-sensitivity tracer assay for N2 fixation. Appl. Env. Microbiol. 62, 986–993.
Mulholland, M. R., Bronk, D. A., and Capone, D. G. (2004). Dinitrogen fixation and release of ammonium and dissolved organic nitrogen by Trichodesmium IMS101. Aquat. Microb. Ecol. 37, 85–94. doi: 10.3354/ame037085
Nalven, S. G. (2016). Decoding DOM Degradation with Metatranscriptomics: How do Sunlight and Microbial Communities Interact to Degrade Dissolved Organic Matter in Arctic Freshwaters? Dissertation/Master's Thesis, Corvallis OR: Oregon State University.
Nayfach, S., and Pollard, K. S. (2015). Average genome size estimation improves comparative metagenomics and sheds light on the functional ecology of the human microbiome. Genome Biol. 16:51. doi: 10.1186/s13059-015-0611-7
O'Neil, J. M. (1998). The colonial cyanobacterium Trichodesmium as a physical and nutritional substrate for the harpacticoid copepod Macrosetella gracilis. J. Plankton Res. 20, 43–59. doi: 10.1093/plankt/20.1.43
Orcutt, K., Rasmussen, U., Webb, E. A., Waterbury, J. B., Gundersen, K., and Bergman, B. (2002). Characterization of Trichodesmium spp. by genetic techniques. Appl. Env. Microbiol. 68, 2236–2245. doi: 10.1128/AEM.68.5.2236-2245.2002
Paerl, H. W., and Bebout, B. M. (1988). Direct measurement of O2-depleted microzones in marine Oscillatoria: Relation to N2 fixation. Science 241, 442–445. doi: 10.1126/science.241.4864.442
Paerl, H. W., Bebout, B. M., and Prufert, L. E. (1989a). Bacterial associations with marine Oscillatoria sp. (Trichodesmium sp.) populations: Ecological implications. J. Phycol. 25, 773–784. doi: 10.1111/j.0022-3646.1989.00773.x
Paerl, H. W., Priscu, J. C., and Brawner, D. L. (1989b). Immunochemical localization of nitrogenase in marine Trichodesmium aggregates: relationship to N2 fixation potential. Appl. Env. Microbiol. 55, 2965–2975.
Roe, K. L., Barbeau, K., Mann, E. L., and Haygood, M. G. (2012). Acquisition of iron by Trichodesmium and associated bacteria in culture. Env. Microbiol. 14, 1681–1695. doi: 10.1111/j.1462-2920.2011.02653.x
Rouco, M., Haley, S. T., and Dyhrman, S. T. (2016). Microbial diversity within the Trichodesmium holobiont. Env. Microbiol. 18, 5151–5160. doi: 10.1111/1462-2920.13513
Rouco, M., Warren, H. J., McGillicuddy, D. J., Waterbury, J. B., and Dyhrman, S. T. (2014). Trichodesmium sp. clade distributions in the western North Atlantic Ocean. Limnol. Oceanogr. 59, 1899–1909. doi: 10.4319/lo.2014.59.6.1899
Sargent, E. C., Hitchcock, A., Johansson, S. A., Langlois, R., Moore, C. M., LaRoche, J., et al. (2016). Evidence for polyploidy in the globally important diazotroph Trichodesmium. FEMS Microbiol. Lett. 362:fnw244. doi: 10.1093/femsle/fnw244
Schloss, P. D., Westcott, S. L., Ryabin, T., Hall, J. R., Hartmann, M., Hollister, E. B., et al. (2009). Introducing mothur: Open-source, platform-independent, community-supported software for describing and comparing microbial communities. Appl. Environ. Microbiol. 75, 7537–7541. doi: 10.1128/AEM.01541-09
Sheridan, C., Steinberg, D., and Kling, G. (2002). The microbial and metazoan community associated with colonies of Trichodesmium spp.: A quantitative survey. J. Plankton Res. 24, 913–922. doi: 10.1093/plankt/24.9.913
Siddiqui, P., Bergman, B., and Carpenter, E. (1992). Filamentous cyanobacterial associates of the marine planktonic cyanobacterium Trichodesmium. Phycologia 31, 326–337. doi: 10.2216/i0031-8884-31-3-4-326.1
Simon, H. M., Smith, M. W., and Herfort, L. (2014). Metagenomic insights into particles and their associated microbiota in a coastal margin ecosystem. Front. Microbiol. 5:466. doi: 10.3389/fmicb.2014.00466
Stihl, A., Sommer, U., and Post, A. F. (2001). Alkaline phosphatase activities among populations of the colony-forming diazotrophic cyanobacterium Trichodesmium spp. (cyanobacteria) in the Red Sea. J. Phycol. 37, 310–317. doi: 10.1046/j.1529-8817.2001.037002310.x
Subramaniam, A., Brown, C. W., Hood, R. R., Carpenter, E. J., and Capone, D. G. (2001). Detecting Trichodesmium blooms in SeaWiFS imagery. Deep Sea Res. Pt. II 49, 107–121. doi: 10.1016/S0967-0645(01)00096-0
Turk-Kubo, K. A., Frank, I. E., Hogan, M. E., Desnues, A., Bonnet, S., and Zehr, J. P. (2015). Diazotroph community succession during the VAHINE mesocosm experiment (New Caledonia lagoon). Biogeosciences 12, 7435–7452. doi: 10.5194/bg-12-7435-2015
Van Mooy, B. A., Hmelo, L. R., Sofen, L. E., Campagna, S. R., May, A. L., Dyhrman, S. T., et al. (2011). Quorum sensing control of phosphorus acquisition in Trichodesmium consortia. ISME J. 6, 422–429. doi: 10.1038/ismej.2011.115
Wagner, G. P., Kin, K., and Lynch, V. J. (2012). Measurement of mRNA abundance using RNA-seq data: RPKM measure is inconsistent among samples. Theory Biosci. 131, 281–285. doi: 10.1007/s12064-012-0162-3
Walsby, A. (1978). The properties and buoyancy-providing role of gas vacuoles in Trichodesmium Ehrenberg. Brit. Phycol. J. 13, 103–116. doi: 10.1080/00071617800650121
Walsby, A. (1992). “The gas vesicles and buoyancy of Trichodesmium,” in Marine Pelagic Cyanobacteria: Trichodesmium and Other Diazotrophs, eds E. J. Carpenter, D. G. Capone, and J. G. Rueter (Berlin: Springer), 141–161.
Walworth, N., Pfreundt, U., Nelson, W. C., Mincer, T., Heidelberg, J. F., Fu, F., et al. (2015). Trichodesmium genome maintains abundant, widespread noncoding DNA in situ, despite oligotrophic lifestyle. Proc. Natl. Acad. Sci. U.S.A. 112, 4251–4256. doi: 10.1073/pnas.1422332112
Wilson, S. T., Böttjer, D., Church, M. J., and Karl, D. M. (2012). Comparative assessment of nitrogen fixation methodologies, conducted in the oligotrophic North Pacific Ocean. Appl. Env. Microbiol. 78, 6516–6523. doi: 10.1128/AEM.01146-12
Wyman, M., Hodgson, S., and Bird, C. (2013). Denitrifying Alphaproteobacteria from the Arabian Sea that express nosZ, the gene encoding nitrous oxide reductase, in oxic and suboxic waters. Appl. Env. Microbiol. 79, 2670–2681. doi: 10.1128/AEM.03705-12
Zani, S., Mellon, M. T., Collier, J. L., and Zehr, J. P. (2000). Expression of nifH genes in natural microbial assemblages in Lake George, New York, detected by reverse transcriptase PCR. Appl. Env. Microbiol. 66, 3119–3124. doi: 10.1128/AEM.66.7.3119-3124.2000
Zehr, J. P., Jenkins, B. D., Short, S. M., and Steward, G. F. (2003). Nitrogenase gene diversity and microbial community structure: a cross-system comparison. Env. Microbiol. 5, 539–554. doi: 10.1046/j.1462-2920.2003.00451.x
Keywords: Trichodesmium, marine microbiome, nifH diversity, heterotrophic marine diazotrophs, metagenomics, 16S rRNA, nitrogen fixation
Citation: Gradoville MR, Crump BC, Letelier RM, Church MJ and White AE (2017) Microbiome of Trichodesmium Colonies from the North Pacific Subtropical Gyre. Front. Microbiol. 8:1122. doi: 10.3389/fmicb.2017.01122
Received: 29 December 2016; Accepted: 01 June 2017;
Published: 06 July 2017.
Edited by:
Sophie Rabouille, Centre National de la Recherche Scientifique (CNRS), FranceReviewed by:
Eric A. Webb, University of Southern California, United StatesAlyson E. Santoro, University of California, Santa Barbara, United States
Copyright © 2017 Gradoville, Crump, Letelier, Church and White. This is an open-access article distributed under the terms of the Creative Commons Attribution License (CC BY). The use, distribution or reproduction in other forums is permitted, provided the original author(s) or licensor are credited and that the original publication in this journal is cited, in accordance with accepted academic practice. No use, distribution or reproduction is permitted which does not comply with these terms.
*Correspondence: Mary R. Gradoville, bWdyYWRvdmlsbGVAdWNzYy5lZHU=
†Present Address: Mary R. Gradoville, Ocean Sciences Department, University of Santa Cruz, Santa Cruz, CA, United States