 Ruoyu Guo1
 Yantao Liang1
 Yu Xin2
 Long Wang1
 Shanli Mou1
 Chunjie Cao1
 Ruize Xie1
 Chuanlun Zhang3
 Jiwei Tian2*
 Yongyu Zhang1*
- 1Key Laboratory of Biofuels, Shandong Provincial Key Laboratory of Energy Genetics, Qingdao Institute of Bioenergy and Bioprocess Technology, Chinese Academy of Sciences, Qingdao, China
- 2Physical Oceanography Laboratory/Qingdao Collaborative Innovation Center of Marine Science and Technology, Key Laboratory of Marine Chemistry Theory & Engineering, Ocean University of China, Qingdao, China
- 3Department of Ocean Science and Engineering, Southern University of Science and Technology, Shenzhen, China
As photoautotrophs, phytoplankton are generally present in the euphotic zone of the ocean, however, recently healthy phytoplankton cells were found to be also ubiquitous in the dark deep sea, i.e., at water depths between 2000 and 4000 m. The distributions of phytoplankton communities in much deeper waters, such as the hadal zone, are unclear. In this study, the vertical distribution of the pico- and nano-phytoplankton (PN) communities from the surface to 8320 m, including the epipelagic, mesopelagic, bathypelagic, and hadal zones, were investigated via both 18S and p23S rRNA gene analysis in the Challenger Deep of the Mariana Trench. The results showed that Dinoflagellata, Chrysophyceae, Haptophyta, Chlorophyta, Prochloraceae, Pseudanabaenaceae, Synechococcaceae, and Eustigmatophyceae, etc., were the predominant PN in the Mariana Trench. Redundancy analyses revealed that depth, followed by temperature, was the most important environmental factors correlated with vertical distribution of PN community. In the hadal zone, the PN community structure was considerably different from those in the shallower zones. Some PN communities, e.g., Eustigmatophyceae and Chrysophyceae, which have the heterotrophic characteristics, were sparse in shallower waters, while they were identified with high relative abundance (94.1% and 20.1%, respectively) at the depth of 8320 m. However, the dinoflagellates and Prochloraceae Prochlorococcus were detected throughout the entire water column. We proposed that vertical sinking, heterotrophic metabolism, and/or the transition to resting stage of phytoplankton might contribute to the presence of phytoplankton in the hadal zone. This study provided insight into the PN community in the Mariana Trench, implied the significance of phytoplankton in exporting organic matters from the euphotic to the hadal zone, and also hinted the possible existence of some undetermined energy metabolism (e.g., heterotrophy) of phytoplankton making themselves adapt and survive in the hadal environment.
Introduction
Oceans represent the world’s largest ecosystem, which comprise diverse visible and invisible organisms that directly or indirectly support carbon cycling in the global biosphere. The hadal trench, which is deeper than 6000 m below the sea surface, represents the most pressurized aquatic environment (Jamieson et al., 2010; Nunoura et al., 2015). Many organisms, such as metazoans, protozoans, bacteria, and archaea, have been identified from the hadal trench, and previous results have shown that the genetic characteristics and community structures of organisms in the hadal zone were differentiated from those in shallower waters or the abyssal zone (Kato et al., 1997; Takami et al., 1997; Vinogradova, 1997; Nunoura et al., 2015; Jonathan et al., 2016). The unique environmental factors, such as geomorphology and hydrostatic pressure, may contribute to shaping the distinct assemblage structure of organisms in the hadal trench (Nunoura et al., 2015; Jonathan et al., 2016). The distinct phenotypical and genetic features of the metazoans, protozoans, and microbes that inhabit the hadal zone (Danovaro et al., 2002; Tamburini et al., 2013; Lan et al., 2017) may be optimized for adapting to the extreme environmental conditions.
Phytoplankton are a tremendously diverse group of single-celled bacteria and eukaryotes that are the base of food web in the ocean ecosystem, and are the most important primary producer that could be responsible for approximately 50% of the net primary production of the global biosphere (Field et al., 1998; Halsey and Jones, 2015). They could affect the abundance and diversity of marine organisms (Chassot et al., 2010; Buchan et al., 2014) and biogeochemical cycling (Behrenfeld et al., 2005; Richardson and Jackson, 2007; Lomas et al., 2014; Marañón, 2015; Leblanc et al., 2018). Picophytoplankton (0.2–2 or 3 μm) and nanophytoplankton (2 or 3–20 μm) are ubiquitous and principal components of phytoplankton biomass and make an important contribution to primary production in the ocean (Detmer and Bathmann, 1997; Kaiser et al., 2007; Vaulot et al., 2008; Wang et al., 2010; Liang et al., 2017), and these small phytoplankton also play important roles in biogeochemical cycling such as contributing to carbon export from the surface ocean (Richardson and Jackson, 2007; Tang et al., 2014; Leblanc et al., 2018). To date, most of phytoplankton study focus on the shallower waters, little is known about the phytoplankton in the deep sea especially in the hadal zone. However, several studies have identified the phytoplankton cells and phytodetritus from the deep sea as well as the hadal trench. Healthy phytoplankton cells have been found at water depths of 2000–4000 m in the world’s oceans (Agusti et al., 2015). Prochlorococcus, which is the smallest autotroph in the ocean, has been identified in the Challenger Deep of the Mariana Trench (Jonathan et al., 2016), and algal pigments, such as phaeophytin and chlorophyll a, have also been identified in the hadal trench and in the sediments (Glud et al., 2013). Latest study revealed that algae might be the primary source of organic matter at the Challenger Deep and in the hadal trench as well (Luo et al., 2017). Nevertheless, the diversity and composition of phytoplankton in the hadal trench is still unclear.
In recent years, molecular methods have been widely employed to study phytoplankton communities in various environmental conditions (Shi et al., 2011; Treusch et al., 2012; Kirkham et al., 2013; Agusti et al., 2015; Balzano et al., 2015; Liu et al., 2015). These molecular methods generally include the amplicon sequencing-based detection technique. The choice of the proper primer is one of the most important factors that affect the results. The ribosomal DNA genes have become standard target genes to investigate the community structure and diversity of microbes. For phytoplankton, several primers that target plastid 23S rRNA (p23S rRNA), plastid 16S rRNA (p16S rRNA), and 18S rRNA have been employed to investigate the community structure (Sherwood and Presting, 2007; Treusch et al., 2012; Bazin et al., 2014). For a comprehensive understanding of the phytoplankton composition, a combination of analyses using several primers has been suggested as a better solution (Shi et al., 2011).
The Challenger Deep of the Mariana Trench in the Northwest Pacific is the deepest biosphere on Earth, with a water depth of 10,920 m (Nakanishi and Hashimoto, 2011). The physical and chemical characteristics, such as geomorphology, temperature, salinity, current patterns, oxygen consumption, organic matter (Fujioka et al., 2002; Taira et al., 2004; Taira et al., 2005; Glud et al., 2013; Luo et al., 2017), and microbial community diversity and composition, have been investigated (Nunoura et al., 2015; Jonathan et al., 2016). Nevertheless, knowledge about the phytoplankton diversity in the Mariana Trench is very limited. In this study, we conducted 18S and p23S rRNA gene surveys on pico- and nano-phytoplankton (PN) communities (0.22 μm ≤ size < 20 μm). The vertical distribution of PN communities in the epipelagic, mesopelagic, bathypelagic, and hadal zones of the Mariana Trench were investigated. The data illustrated key environmental factors that regulate the vertical distribution patterns of the PN communities in the Mariana Trench and potential reasons of the presence of phytoplankton in the dark sea.
Materials and Methods
Sampling and Geochemical Analyses
Water samples were collected at the station Challenge Deep from 11 layers of the Mariana Trench (See sample information, Supplementary Table S1) in March 2017. Seawater samples from 4 to 4000 m were collected by Niskin Bottle mounted to a Seabird conductivity, temperature, and depth (CTD; SBE 25, Sea-Bird Co.); whereas water samples at depth of 6050 and 8320 m were collected by a self-designed acoustic-controlled full ocean depth water sampler. Five-liter of seawater from each layer was firstly filtered using 20-μm pore-size membrane filters, and then the subsamples were harvested onto 0.22-μm pore-size membrane filters (Millipore, Germany). The 0.22-μm pore-size membrane filters were used in the further analysis. A total of two filters (duplicates) were prepared for each seawater sample. The filters were frozen immediately in liquid nitrogen and kept at -20°C on board. By the end of cruise, the filters were transferred to -80°C refrigerator in land-based lab until DNA extraction. The environmental parameters (i.e., depth, temperature, and salinity) were measured using a CTD sensor (SBE 25, Sea-Bird Co.). Nutrients and dissolved oxygen (DO) were sampled and analyzed following the protocols described in Grasshoff et al. (1999).
Cell Abundance Measurement
Heterotrophic prokaryote and picoeukaryote abundances were determined on a BD FACSAria II flow cytometer (BD Biosciences, CA, United States). The procedure and analysis followed the protocol described by Liang et al. (2016). For the picoeukaryote abundances, only the autotrophic picoeukaryote was included in the analysis.
DNA Extraction and Sequencing
Total DNA was extracted following the method described by Boopathi et al. (2015). DNA quantity and integrity were verified using NanoDrop (Thermo-Fisher, United States) and 1% (w/v) agarose gel. To investigate the PN composition, two gene markers including nuclear 18S rRNA and p23S rRNA gene were employed. The 18S rRNA gene can provide information on the eukaryotic PN composition, and the p23S rRNA gene can be used to analyze the community composition of cyanobacteria and eukaryotic algae (Presting, 2006). The V1–V3 region of the eukaryotic 18S rRNA gene was amplified with the primers 82F (5′-GAAACTGCGAATGGCTC-3′) (López-García et al., 2003) and 516R (5′-ACCAGACTTGCCCTCC-3′) (Casamayor et al., 2002). For plastid 23S rRNA gene analysis, the primers p23SrV_f1 (5′-GGA CAG AAA GAC CCT ATG AA-3′) and p23SrV_r1 (5′ TCA GCC TGT TAT CCC TAG AG-3′) (Presting, 2006) were used in the PCR amplification. Equimolar amounts of each sample were mixed and sequenced using Illumina MiSeq (Illumina Inc., United States). The sequencing was conducted at Majorbio Bio-Pharm Technology Co., Ltd. (Shanghai, China). The two filters from each layer were used for DNA extraction and sequencing, respectively. All the sequence data generated in this study have been deposited in NCBI Sequence Read Archive database under the accession number SRP154062.
Sequence Processing, Operational Taxonomic Unit (OTU) Assignment, and Environmental Factor Analyses
The raw data were filtered to eliminate low-quality reads to obtain clean reads. The raw data trimming and assembly were performed using Trimmomatic and FLASH v1.2.11, respectively (Magoc and Salzberg, 2011; Bolger et al., 2014). The reads were assembled with a minimum overlap length of 10 bp. All reads that completely matched the barcodes were retained, as were reads with a maximum 2 bp mismatch from the primers. Then, the primers and barcodes were trimmed from the sequences. The sequences were clustered into OTUs at a similarity of 97% using USEARCH (version 7.0) (Edgar, 2010).
For the taxonomic annotation, the representative 18S rRNA gene OTU sequences were annotated by comparison against the SILVA database with a similarity cutoff value of 0.7 (Quast et al., 2013). The p23S rRNA gene sequences were annotated by BLASTn alignment against the NCBI non-redundant nucleotide (NT) database. Taxonomic classifications for each OTU (similarity ≥97%) were obtained using the RDP Classifier. According to taxonomic annotation of 18S and p23S rRNA gene, only the OTUs that assigned to phytoplankton were employed in further analysis by removing OTUs assigned to opisthokonta, heterotrophic bacteria, and so on. The Chao1 richness (Chao and Bunge, 2002) and Shannon diversity index (Magurran, 1989) values were calculated using MOTHUR version v.1.30.1 (Schloss et al., 2011). All of the mentioned analyses above were carried out on the free online platform of Majorbio I-Sanger Cloud Platform1. The taxonomy classification was described according to the taxonomic description of NCBI taxonomy database. Generally, the phylum level was used as classification for eukaryotic phytoplankton. However, some phytoplankton belonged to stramenopiles (no rank), in this case, the class level were employed for taxonomy description. As for the cyanobacteria, all the identified OTUs belonged to cyanobacteria Synechococcales (order; no classification at class level), the family level were employed to distinguish them. Redundancy analysis (RDA) was conducted using CANOCO (Version 5, Microcomputer Power). Core species were defined as the species that were present in all sampled layers, and specific species were defined as the species that were only present within a specified water zone. The circos analysis for core species was done via online tool on http://circos.ca/.
Results
Environmental Conditions and Cellular Abundance
A total of 11 water samples were collected from depths 4–8320 m at the same location (11.38°N, 142.41°E, Supplementary Table S1), and these included samples from the epipelagic (Epi; 4 and 100 m), mesopelagic (Mes; 200 and 500 m), bathypelagic (Bat; 1000, 1500, 2000, 3000, and 4000 m), and hadal (6050 and 8320 m) zones. The temperature gradually decreased from the surface to the hadal zone, and these results were similar to those of a previous observation (Nunoura et al., 2015). The salinity ranged from 34.06 to 34.83 PSU, the highest salinity was found at 200 m (Figure 1A). The DO concentration was 197.50 μM/L at 100 m, and DO decreased to 84.92 μM/L at 1000 m, where an oxygen minimum zone exists and was firstly reported by Nunoura et al. (2015); then DO gradually increased with the increase in depth. The DO concentrations of the hadal zone, which were 174.40 and 174.80 μM/L at 6050 and 8320 m, respectively, were lower than those of the Epi zone (Figure 1A). The concentration of nitrate (NO3-) was 0.09 μM/L at 4 m, and it gradually increased to a maximum concentration of 39.35 μM/L at 1500 m before it decreased to 34.00 μM/L at 8320 m (Figure 1B). The concentration of nitrite (NO2-) was less than 0.4 μM/L throughout the water column. The distribution pattern of the PO4 concentration was similar to that of nitrate and nitrite. The phosphate (PO43-) concentration was 0.018 μM/L at 4 m, and it reached a maximum concentration of 2.70 μM/L at 1500 m before it slightly decreased to 2.28 μM/L at 8320 m (Figure 1B). The concentration of silicate (SiO44-) ranged from 0.55–149.61 μM/L, and the maximum concentration was detected at 3000 m (Figure 1B); furthermore, the silicate concentration of the Epi zone was higher than that of the other zones.
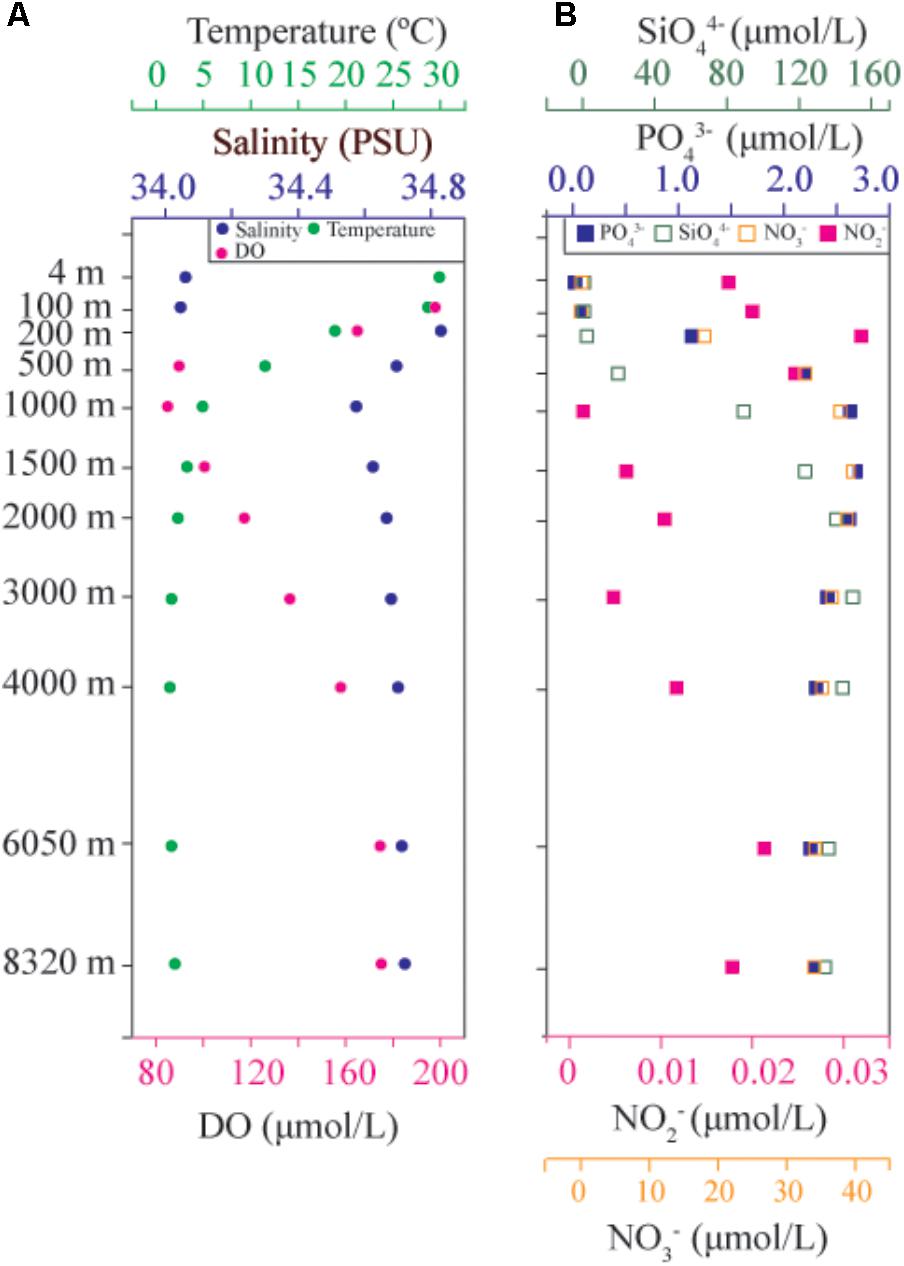
FIGURE 1. Vertical distribution patterns of environmental parameters. (A) Temperature, salinity, DO, and pH; (B) Nutrient concentrations, including PO4, NO3, NO2, and SiO4.
The cellular abundance of PN were measured based on the differential cell types, including heterotrophic bacteria, Prochlorococcus, Synechococcus, and picoeukaryotes, by using flow cytometry. The maximum (1.92 × 10⁵ cells mL-1) and minimum (2.78 × 10⁴ cells mL-1) abundances of heterotrophic bacteria were found at depths of 4 and 8320 m, respectively. The abundance of Prochlorococcus was 1.66 × 10⁴ cells mL-1 and 6.74 × 10⁴ cells mL-1 at the depths of 4 and 100 m, respectively (Figure 2). However, the Prochlorococcus from the other nine layers (i.e., 200–8320 m) and the Synechococcus and abundance of picoeukaryotes from all 11 layers were less than 1.0 × 10⁴ cells mL-1.
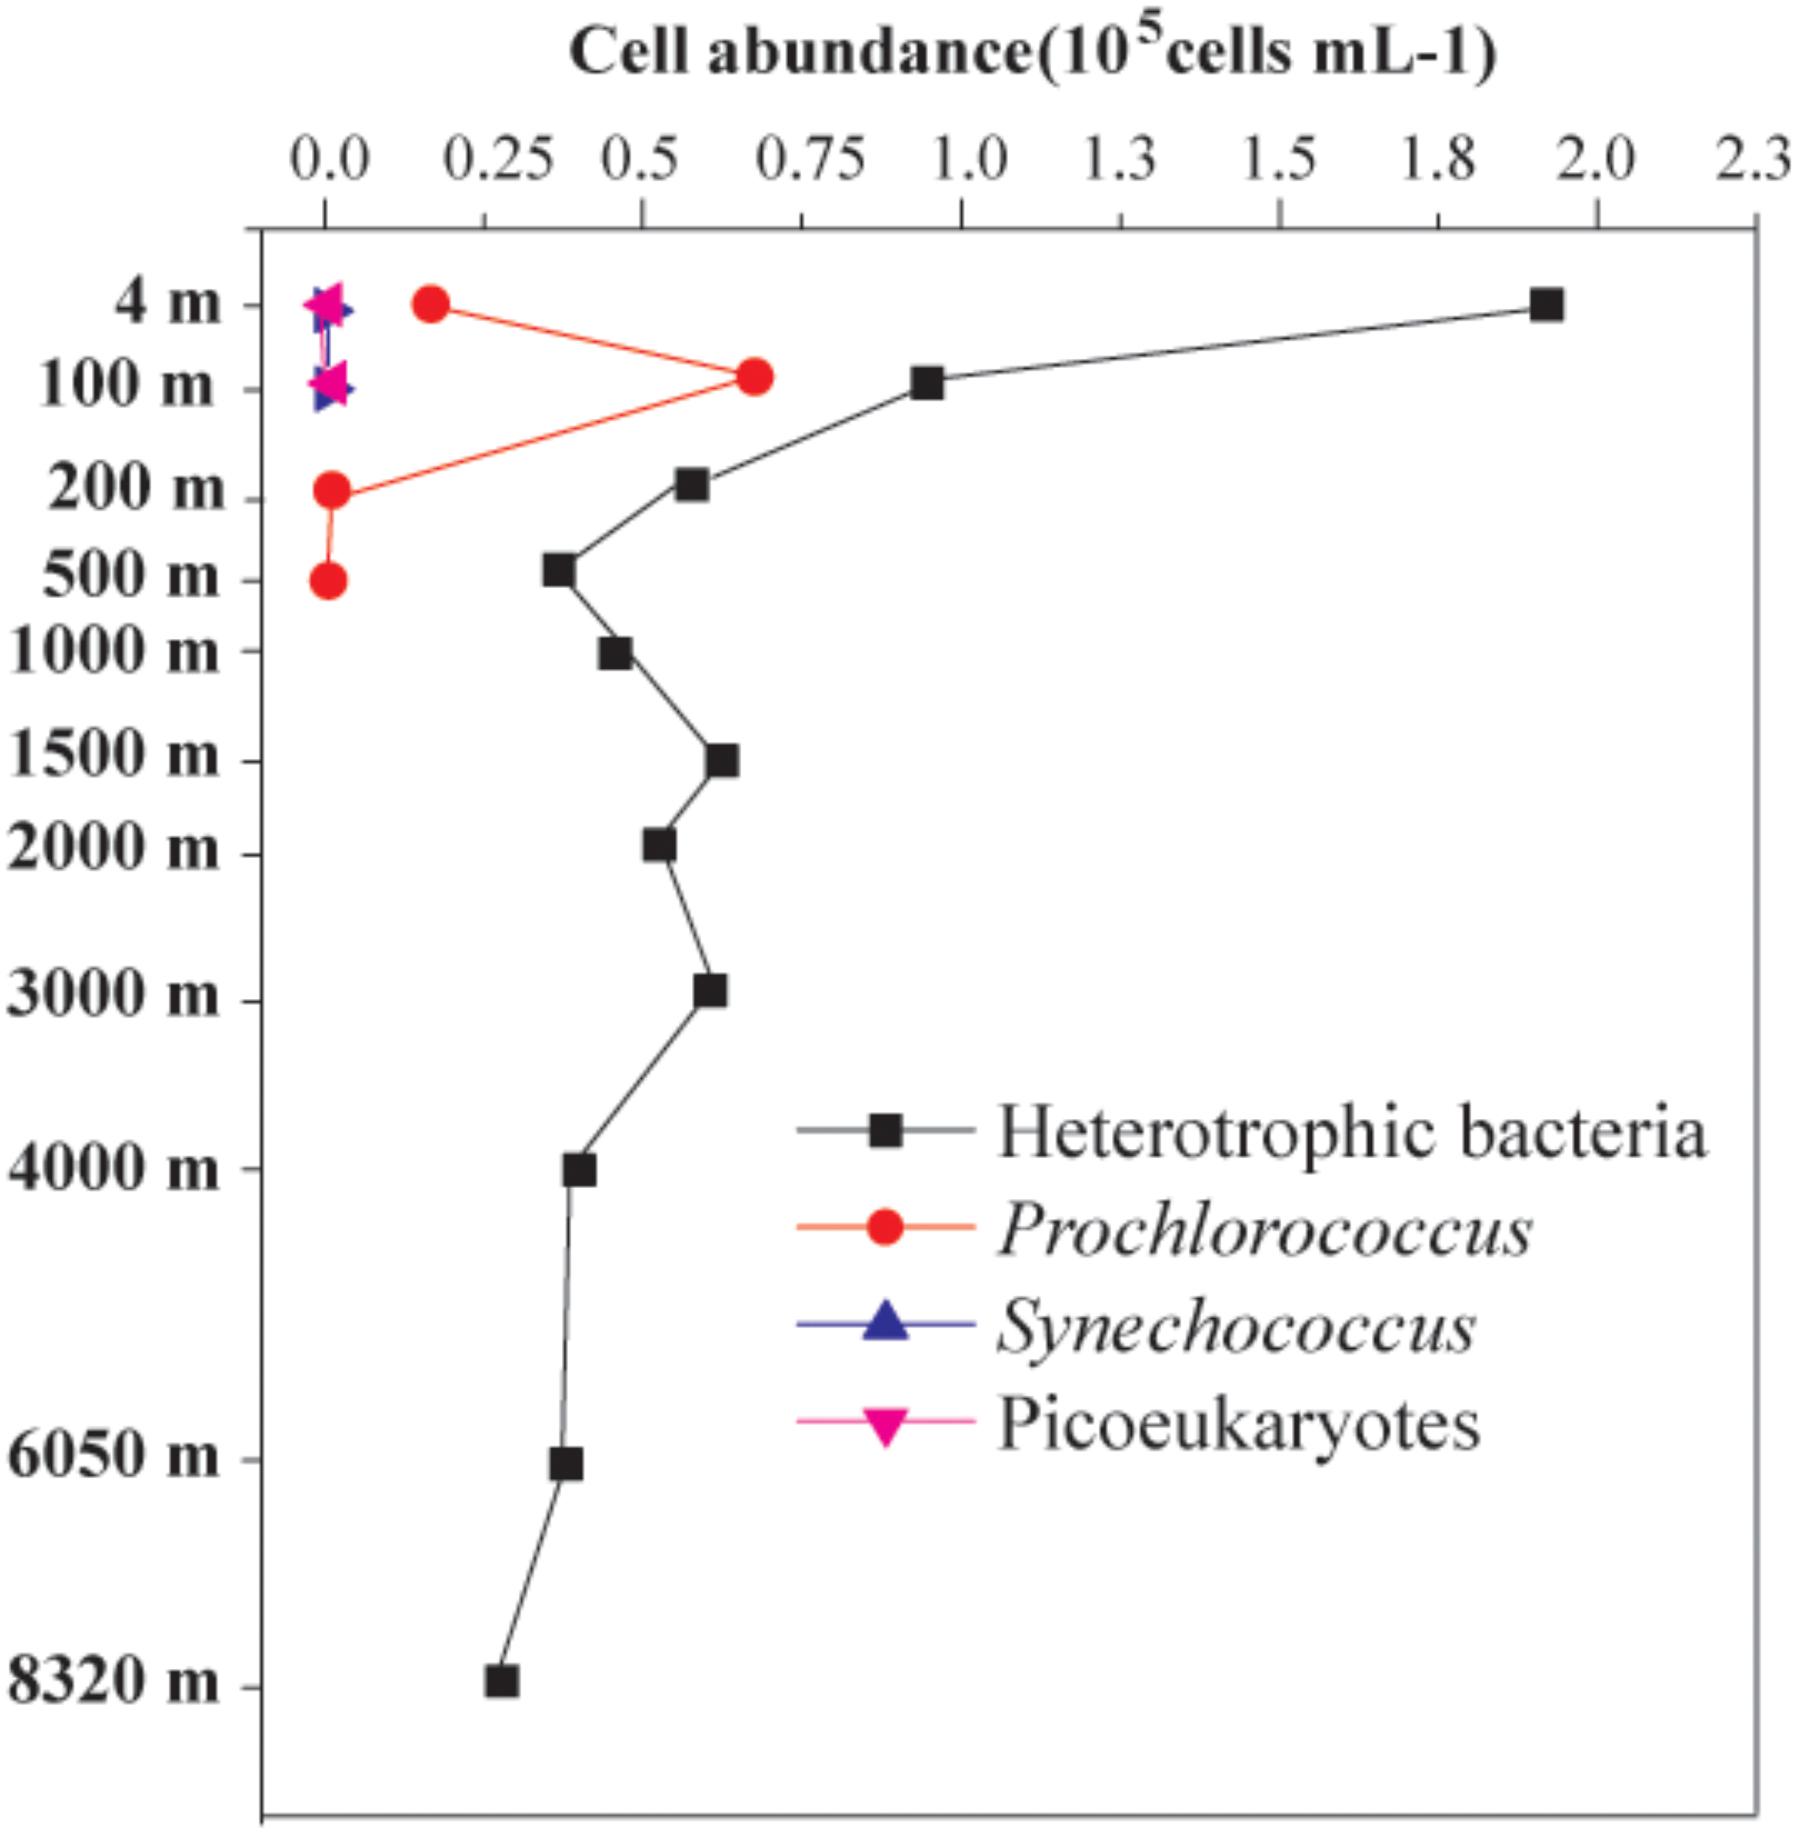
FIGURE 2. Vertical distribution patterns of the abundances of Prochlorococcus, Synechococcus, picoeukaryotes, and heterotrophic bacteria.
Alpha-Diversity Patterns
The phytoplankton richness and diversity were evaluated using the Chao1 and Shannon indexes, respectively (Figure 3). The diversity pattern revealed by the 18S rRNA was quite different than that revealed by the p23S rRNA (Figure 3A). The 18S rRNA analysis showed that the duplicates of each layer were very similar, but the p23S rRNA analysis showed a slightly different pattern. In the p23S rRNA gene analysis results, both the 2000 and the 4000 m samples displayed large differences between their duplicates, which might have been caused by sequencing bias and/or sampling. As previously reported, the technical reproducibility of the amplicon sequencing-based detection technique is quite low; however, amplicon sequencing-based detection is still useful in analyzing microbial community structure (Zhou et al., 2011). Furthermore, because we performed two sequences, there should be an increase in the confidence of our results. The highest diversity of the 18S rRNA gene was found at 4 m, and the highest diversity of the p23S rRNA gene was found at 200 m. The richness of the Epi zone was relative higher than the richness values of the other zones, as revealed by the 18S rRNA analysis; however, the highest richness revealed by the p23S analysis was in the Mes zone (Figure 3B). Interestingly, the community diversity and richness values of the samples from 8320 m (i.e., the hadal zone) were not the lowest.
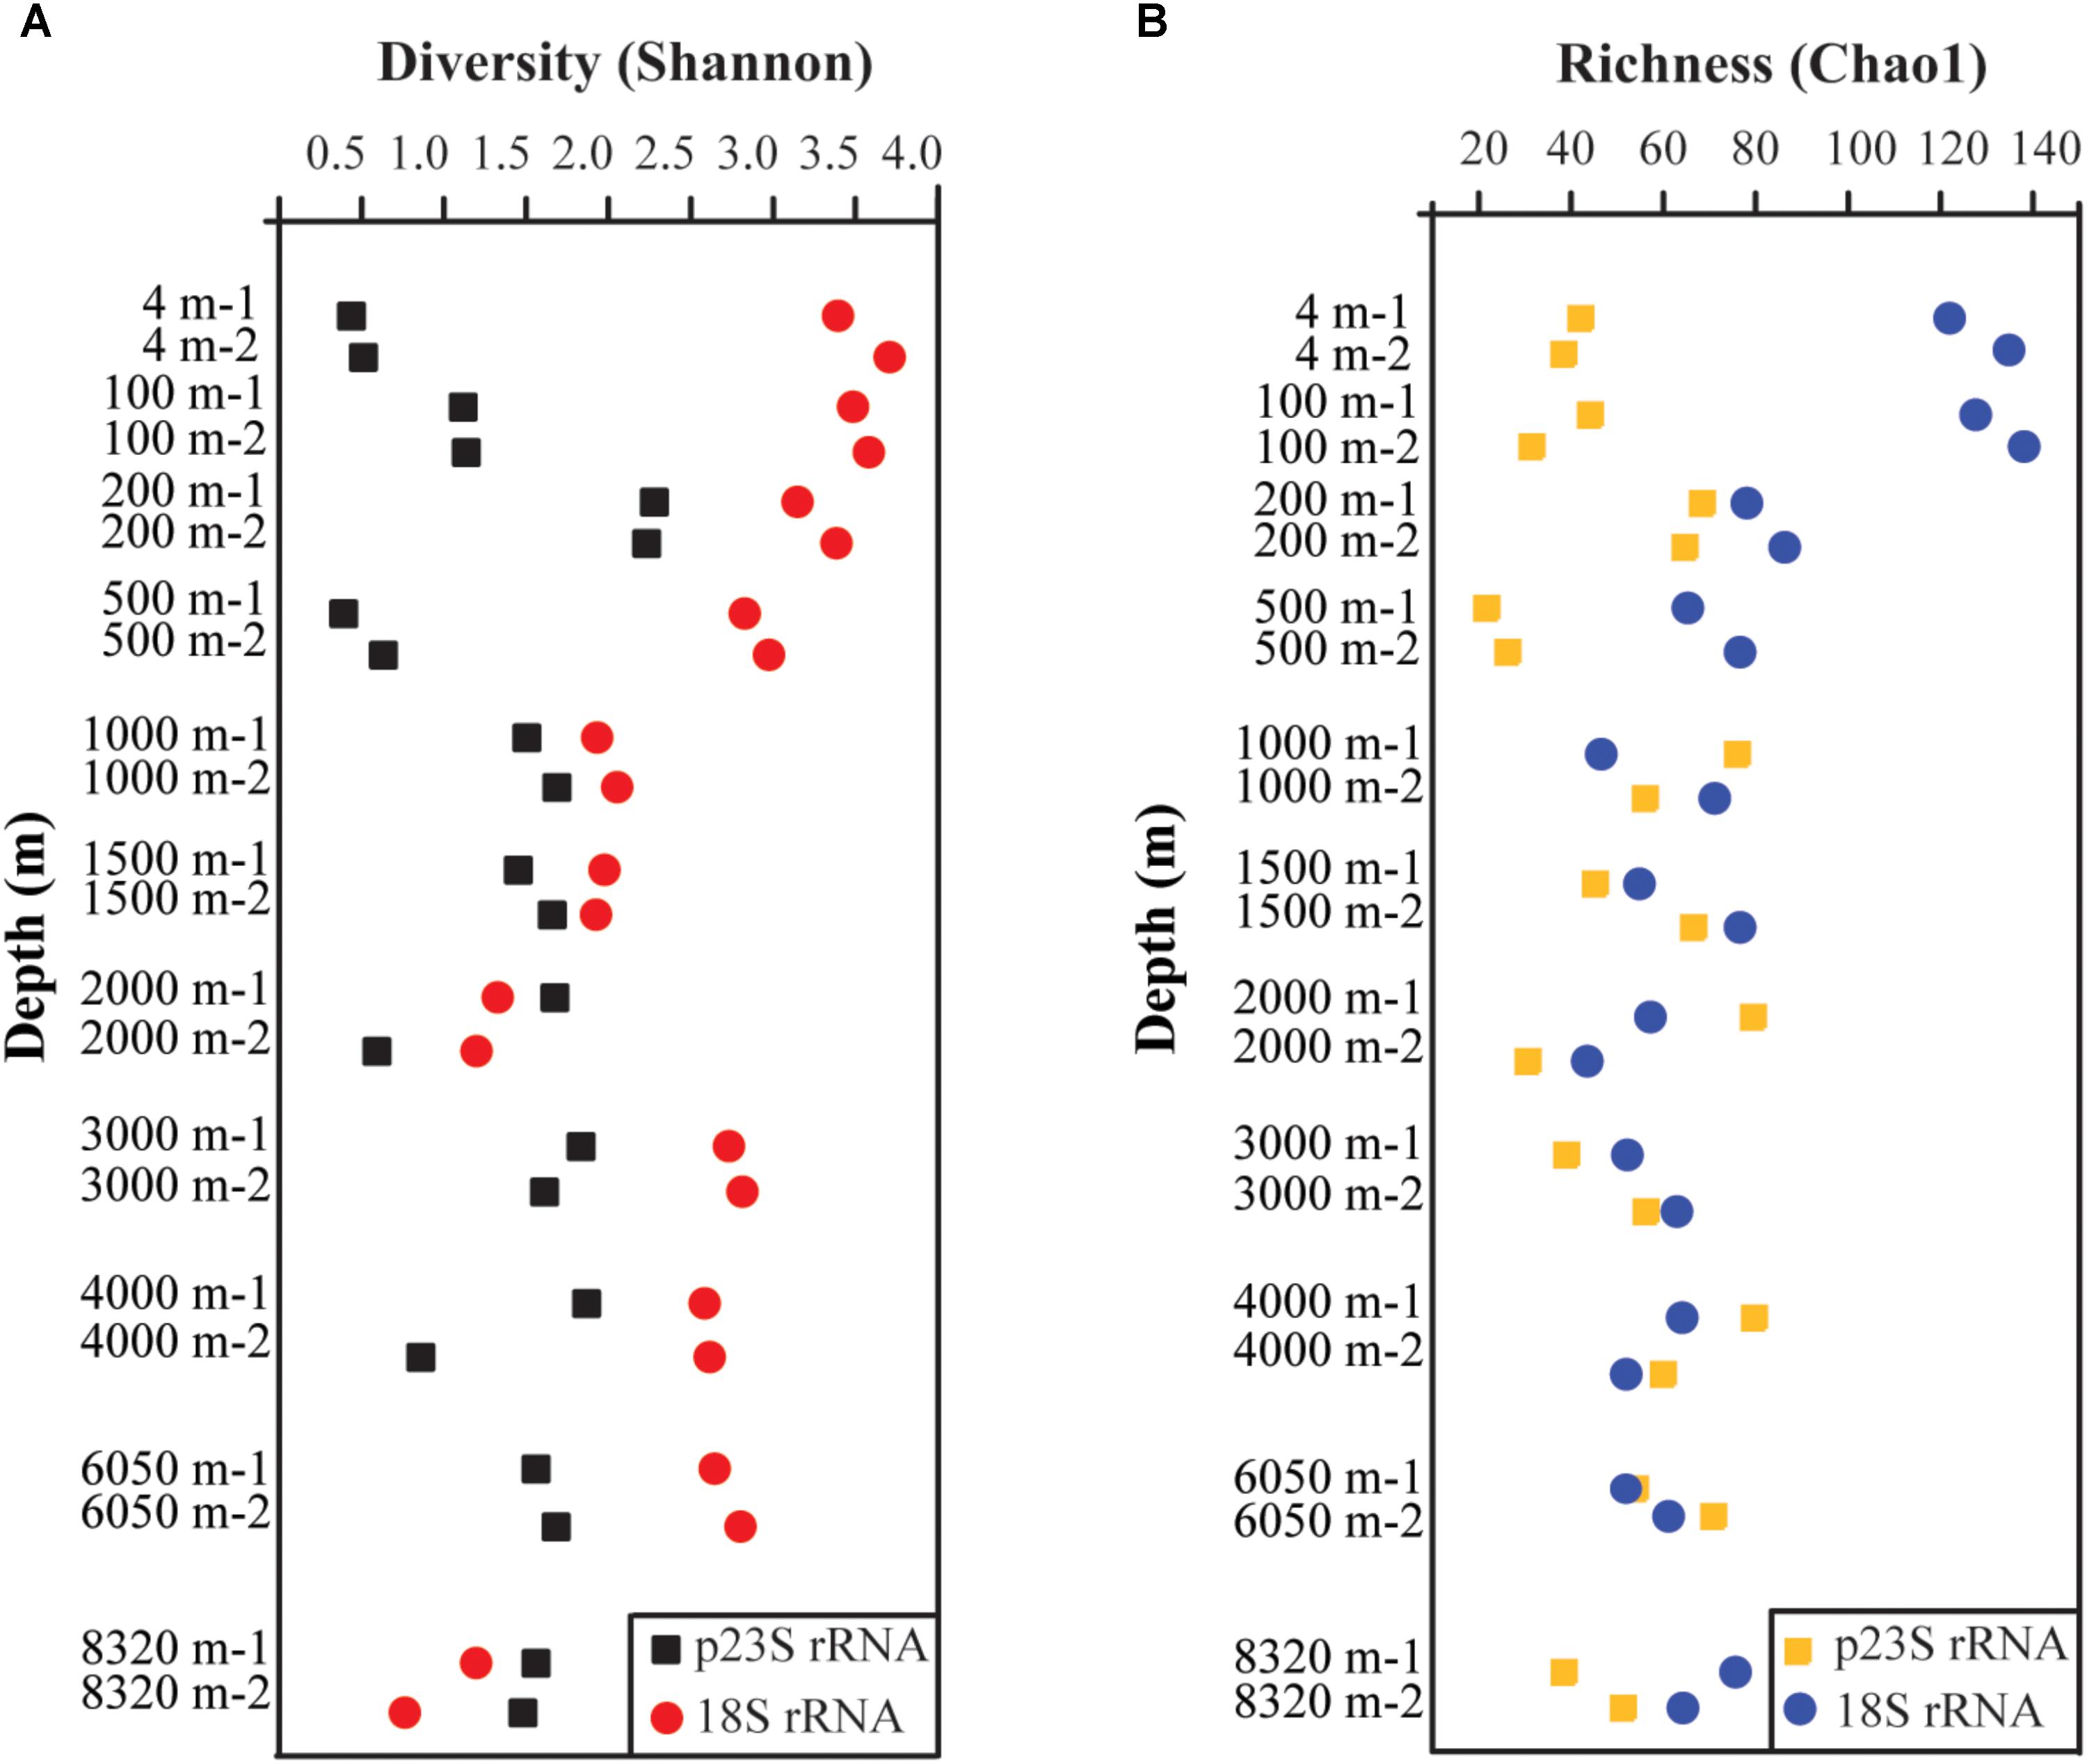
FIGURE 3. Vertical distribution patterns of diversity (Shannon) (A) and richness (Chao1) (B) of 18S and p23S rRNA gene analysis for PN.
Pico- and Nano-Phytoplankton in the Mariana Trench
The results of the 18S rRNA analysis showed that the compositions of the duplicates from each layer were very similar, and a total of 169 OTUs were identified as PN. These 169 OTUs belonged to eight main phytoplankton groups (reads >0.1% in total), including Dinoflagellata (103 OTUs, 81.2% of total reads), Chlorophyta (13 OTUs, 1.5%), Haptophyta (22 OTUs, 4.6%), Cryptophyceae (3 OTUs, 0.1%), Chrysophyceae (11 OTUs, 10.0%), Bacillariophyta (3 OTUs, 0.1%), Eustigmatophyceae (3 OTUs, 0.1%), Pelagophyceae (1 OTU, 0.9%), and some other groups (reads <0.1% in total) (Figure 4A). The dinoflagellates were the dominant phytoplankton between the depths of 4 and 6050 m (Figure 4A), regardless of whether the relative abundance level or OTU level was used in the calculation; however, the dominant phytoplankton changed to Chrysophyceae at the depth of 8320 m.
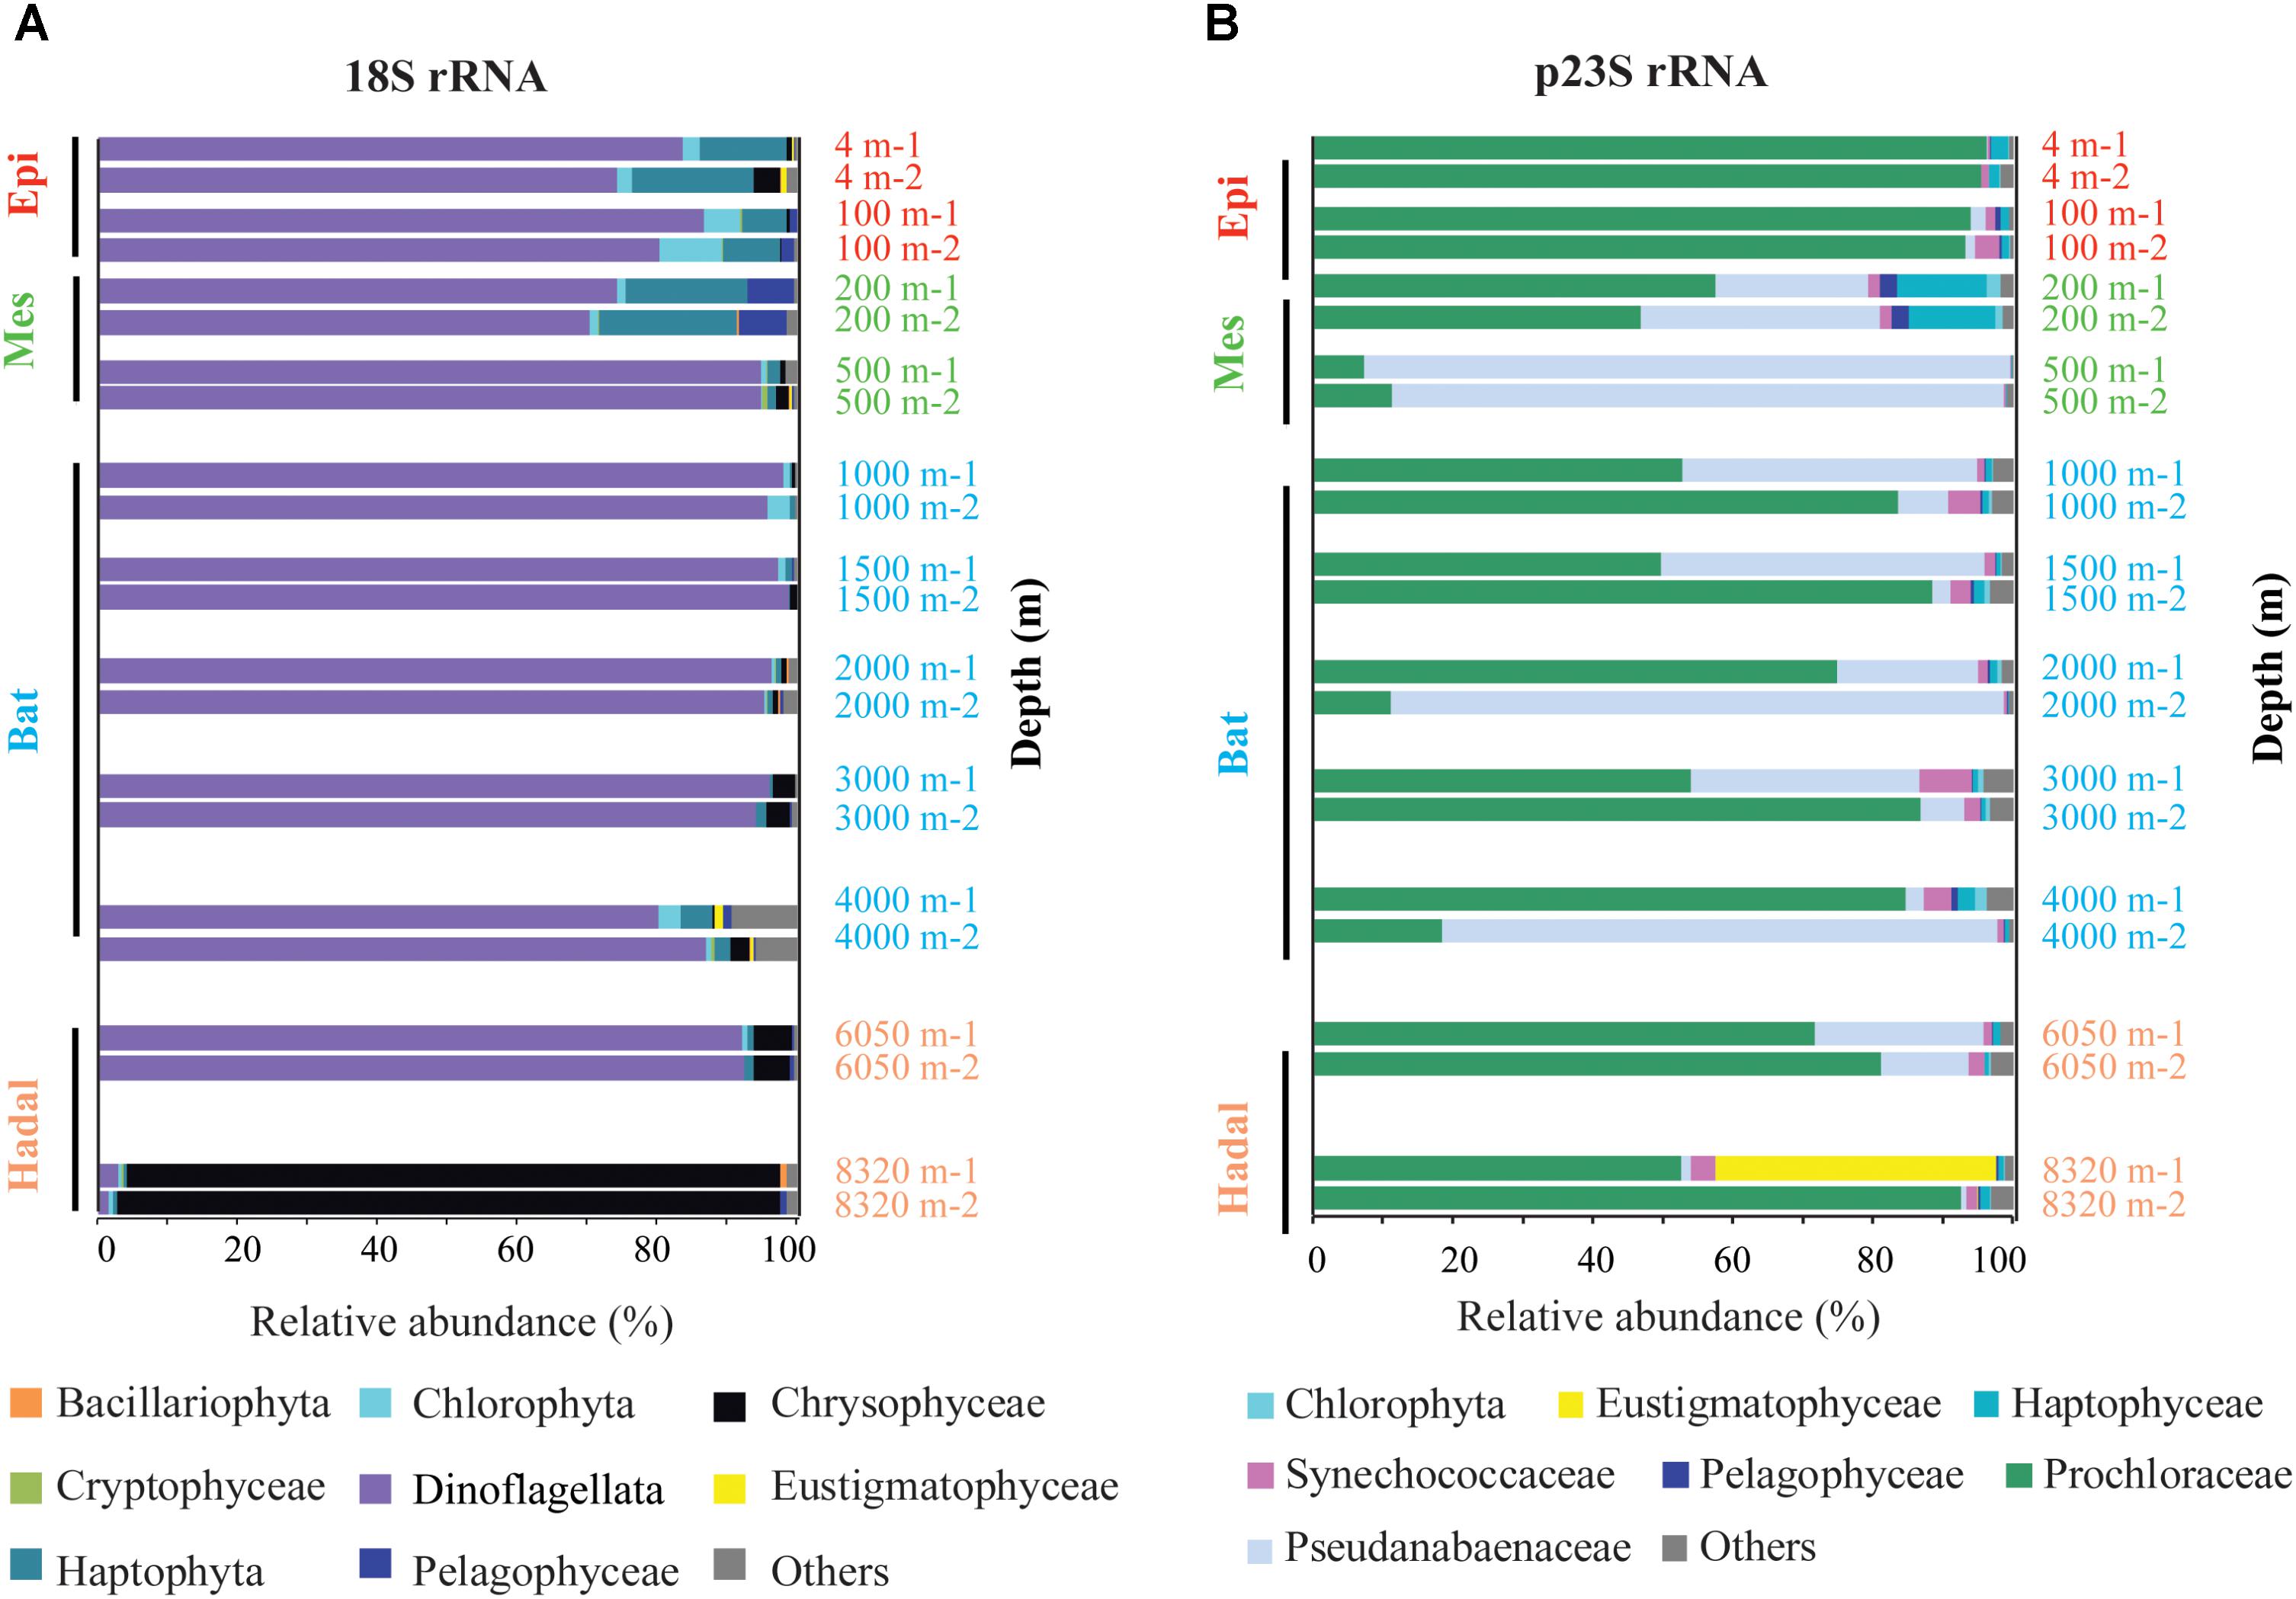
FIGURE 4. Vertical distribution patterns of PN community composition in the Challenger Deep. (A) 18S rRNA gene assemblage and (B) plastid 23S rRNA gene assemblage. “1” and “2” at the end of depth were used to distinguish the duplicates.
The p23S rRNA analysis revealed 130 OTUs that belonged to phytoplankton, including species of cyanobacteria and other eukaryotic phytoplankton. Different from 18S rRNA, the p23S rRNA analysis results showed that the compositions of the duplicates from some layers were quite different, such as the samples from 1500, 2000, and 4000 m. The main differences were related to the cyanobacteria Jaaginema (OTU 92) and Prochlorococcus (OTU 8). The Prochlorococcus, which contributed to approximately 62.2% of the total reads, were the predominant genus in most of the layers. Haptophyta (2.0%), Synechococcaceae (2.1%), and Eustigmatophyceae (1.8%) were also identified with relative abundances higher than 1% of the total reads (Figure 4B). In addition, Pelagophyceae (0.4%) and Chlorophyta (0.4%) showed relative abundances higher than 0.1% but less than 1%, as determined by p23S rRNA analysis. At the OTU level, 46 OTUs and 15 OTUs contributed to Haptophyta and Chlorophyta, respectively, and Haptophyta was the most diverse group.
Core and Specific Pico- and Nano-Phytoplankton
To identify the core and specific phytoplankton that were present in each water zone, the comparison analysis was constructed at the OTU level (Supplementary Figure S1A and Supplementary Table S2). The 18S rRNA gene analysis revealed 33 core OTUs present in all four zones. These OTUs contained species from Dinoflagellata (23 OTUs), Pelagophyceae (1 OTU), Chlorophyta (2 OTUs), Haptophyta (4 OTUs), Cryptophyceae (1 OTU), Bacillariophytina (1 OTU), and one uncultured species. Among core species, the OTU727 assigned to the dinoflagellate Heterocapsa displayed the highest relative abundance and was followed by OTU723, which was assigned to the dinoflagellate Gymnodinium (Figure 5A). Furthermore, 31 OTUs, 6 OTUs, 15 OTUs, and 6 OTUs specifically belonged to the Epi, Mes, Bat, and hadal zones, respectively. For the OTUs that were specific to the hadal zone, the specific species were assigned to Chrysophyceae, Dinoflagellata, Bacillariophyta, and Haptophyta.
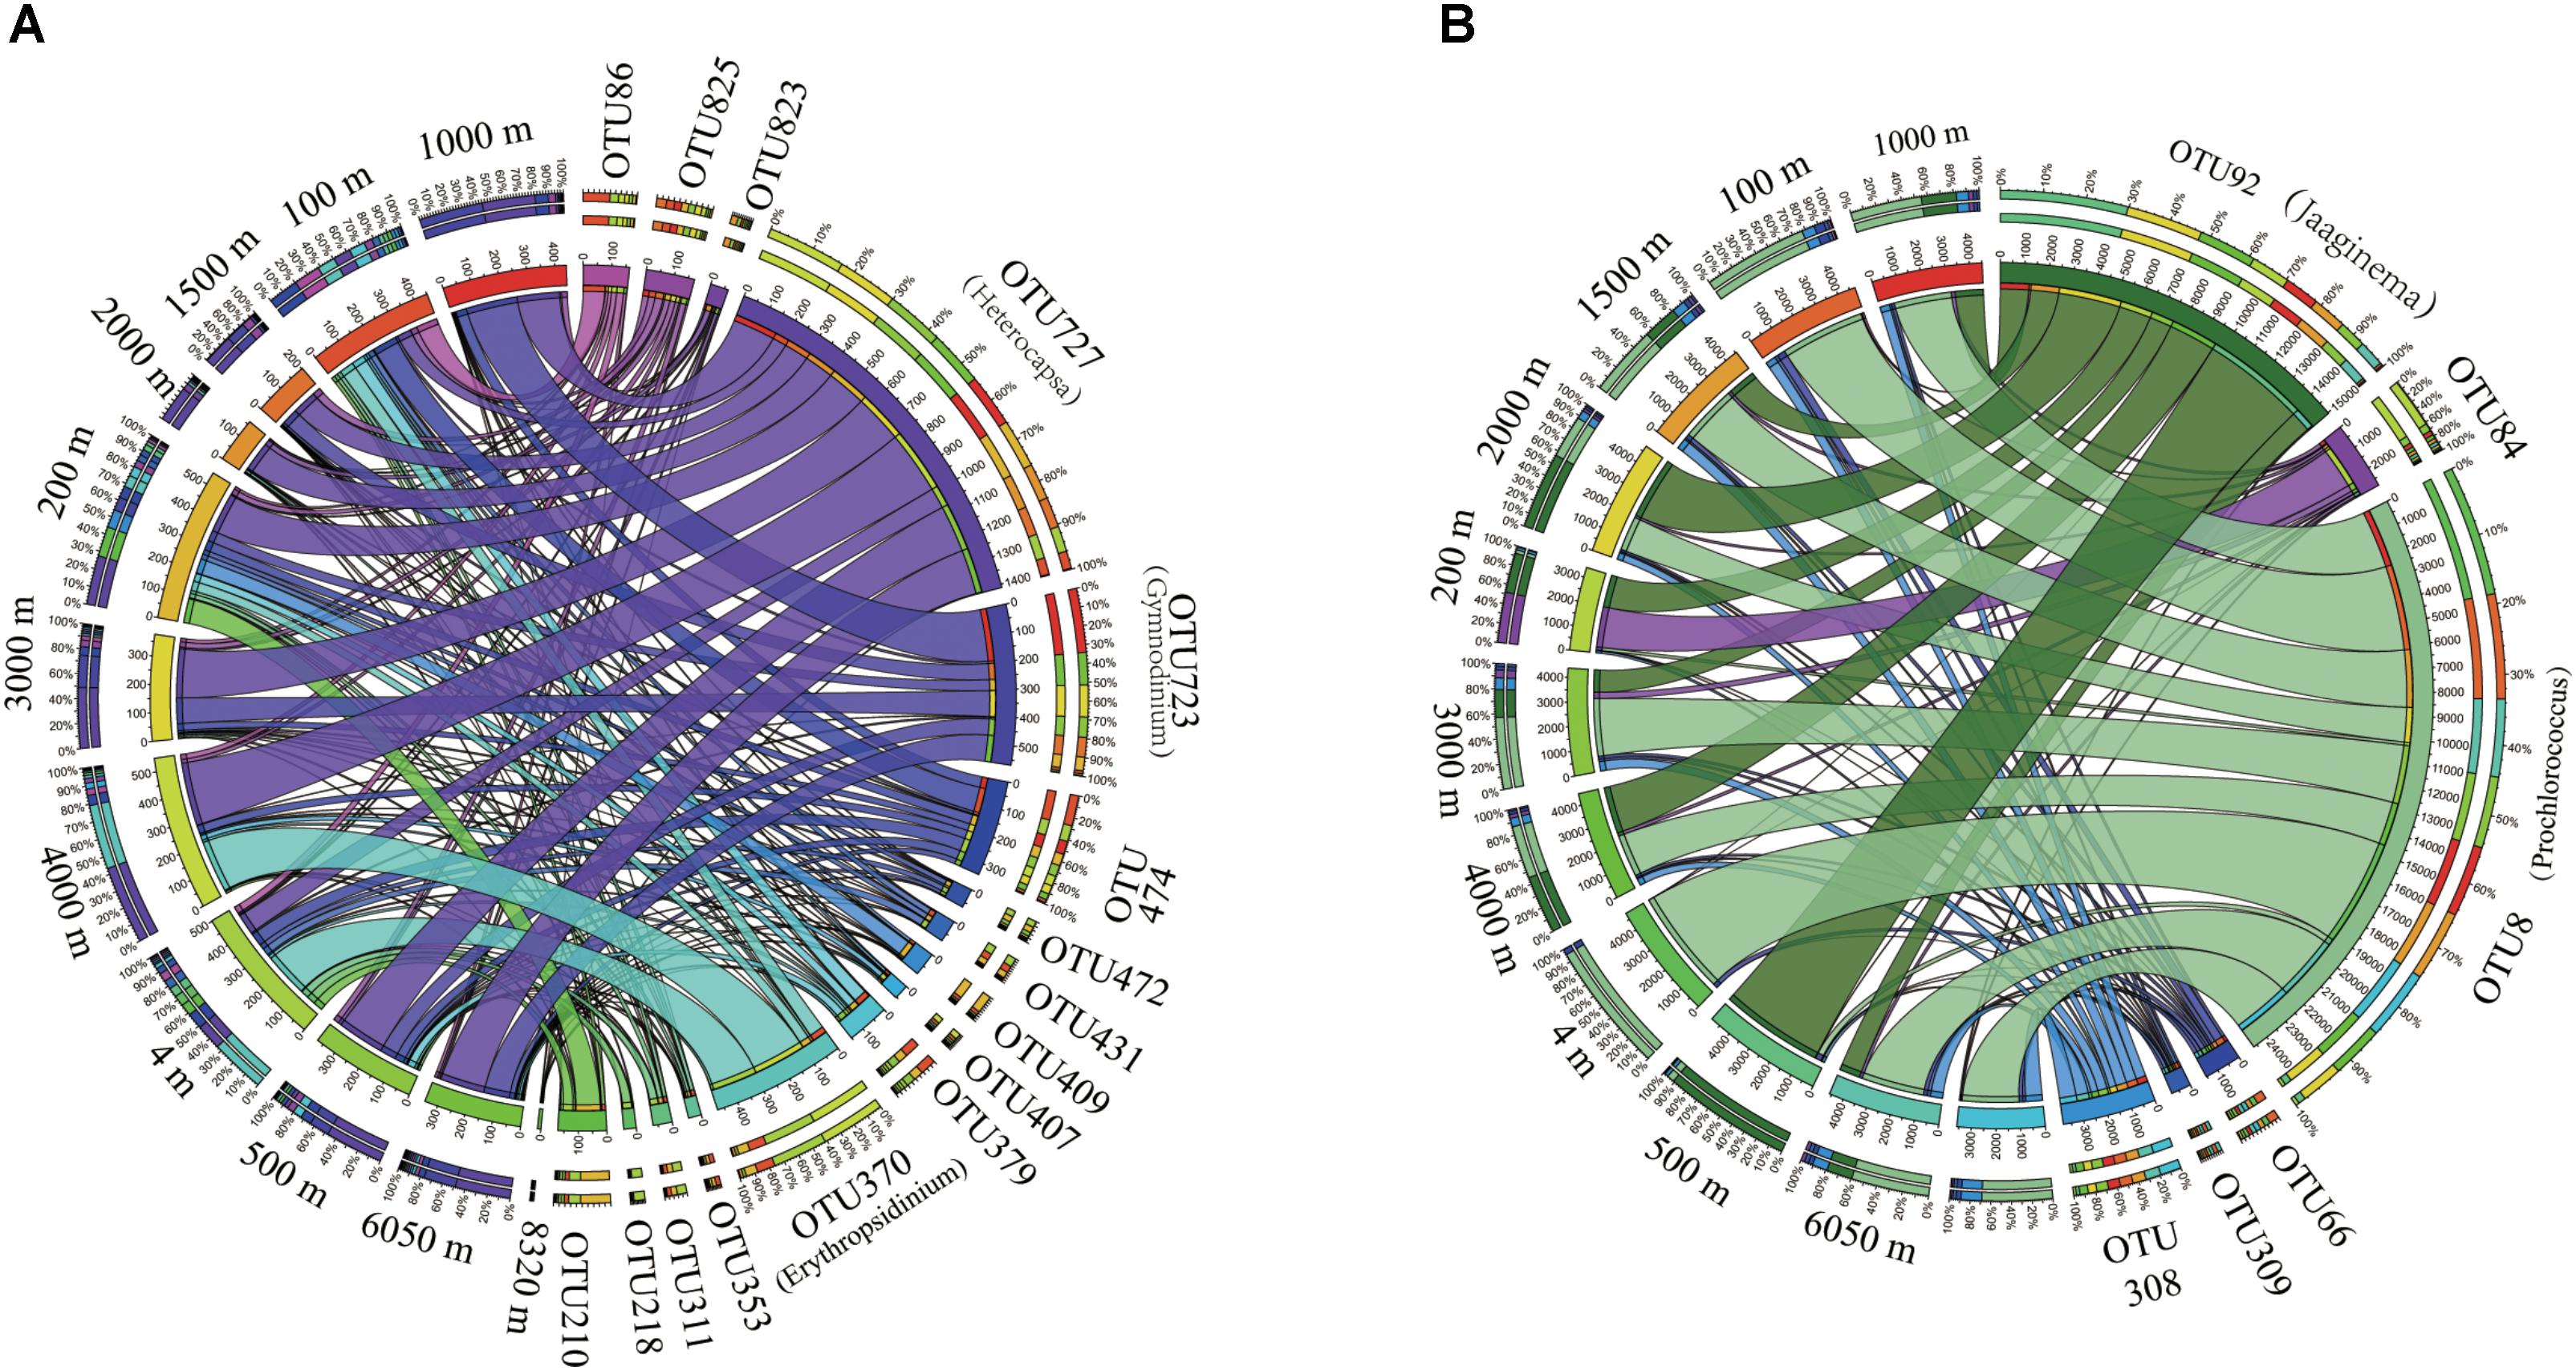
FIGURE 5. The distribution of core OTUs along the water column in the Mariana Trench. (A) 18S rRNA gene assemblage, the OTUs with relative abundances >0.1% were used in this analysis and (B) plastid 23S rRNA gene assemblage, the OTUs with relative abundances >0.1% were used in this analysis. The annotation of each OTUs were listed in the Supplementary Table S2.
In the p23S rRNA gene analysis, 27 core OTUs were identified, and they were assigned to Haptophyta (7 OTUs), Pelagophyceae (1 OTU), Prochlorococcus (11 OTUs), Synechococcus (3 OTUs), Chlorophyta (1 OTU), and one unranked eukaryote (Supplementary Figure S1B and Supplementary Table S2). In all of these core OTUs, OTU8 (Prochlorococcus) [followed by OTU92 (Jaaginema)] was the most dominant OTU in all of the four zones (Figure 5B). For the specific OTUs, 8 OTUs, 11 OTUs, 21 OTUs, and 5 OTUs were only present in the Epi, Bat, Mes, and hadal zones, respectively. The OTUs that were specific to the hadal zone included Coccomyxa (Chlorophyta), Chrysochromulina (Haptophyta), Ochromonas (Chrysophyceae), and Synura (Synurophyceae).
Relationships Between Pico- and Nano-Phytoplankton and Environmental Factors
RDA was employed to assess the relationships between the PN and environmental factors. The environmental factor correlation analysis showed that PO4 and NO3 had a positive relationship; thus, only the PO4 was selected for further analysis. According to the RDA across all the 18S rRNA PN communities, four environmental factors, including depth, PO4, salinity, and temperature, significantly contributed to the variation in the PN communities; in contrast, NO2, SiO4, and DO had almost no correlation with the distribution of PN communities (Supplementary Table S3). RDA (Figure 6A) showed that the first axis explained 44.47%, while the first two axes explained 65.54% of the total variation in the relative abundance of the 18S rRNA communities and 76.50% of the cumulative variation in the 18S rRNA communities and environmental factors. Chrysophyceae and Bacillariophyta were positively correlated with depth, while some groups, such as Chlorophyta and Haptophyta were significant negatively correlated with depth. Haptophyta, Chlorophyta, and Pelagophyceae were negatively correlated with salinity and PO4; however, they were positively correlated with temperature.
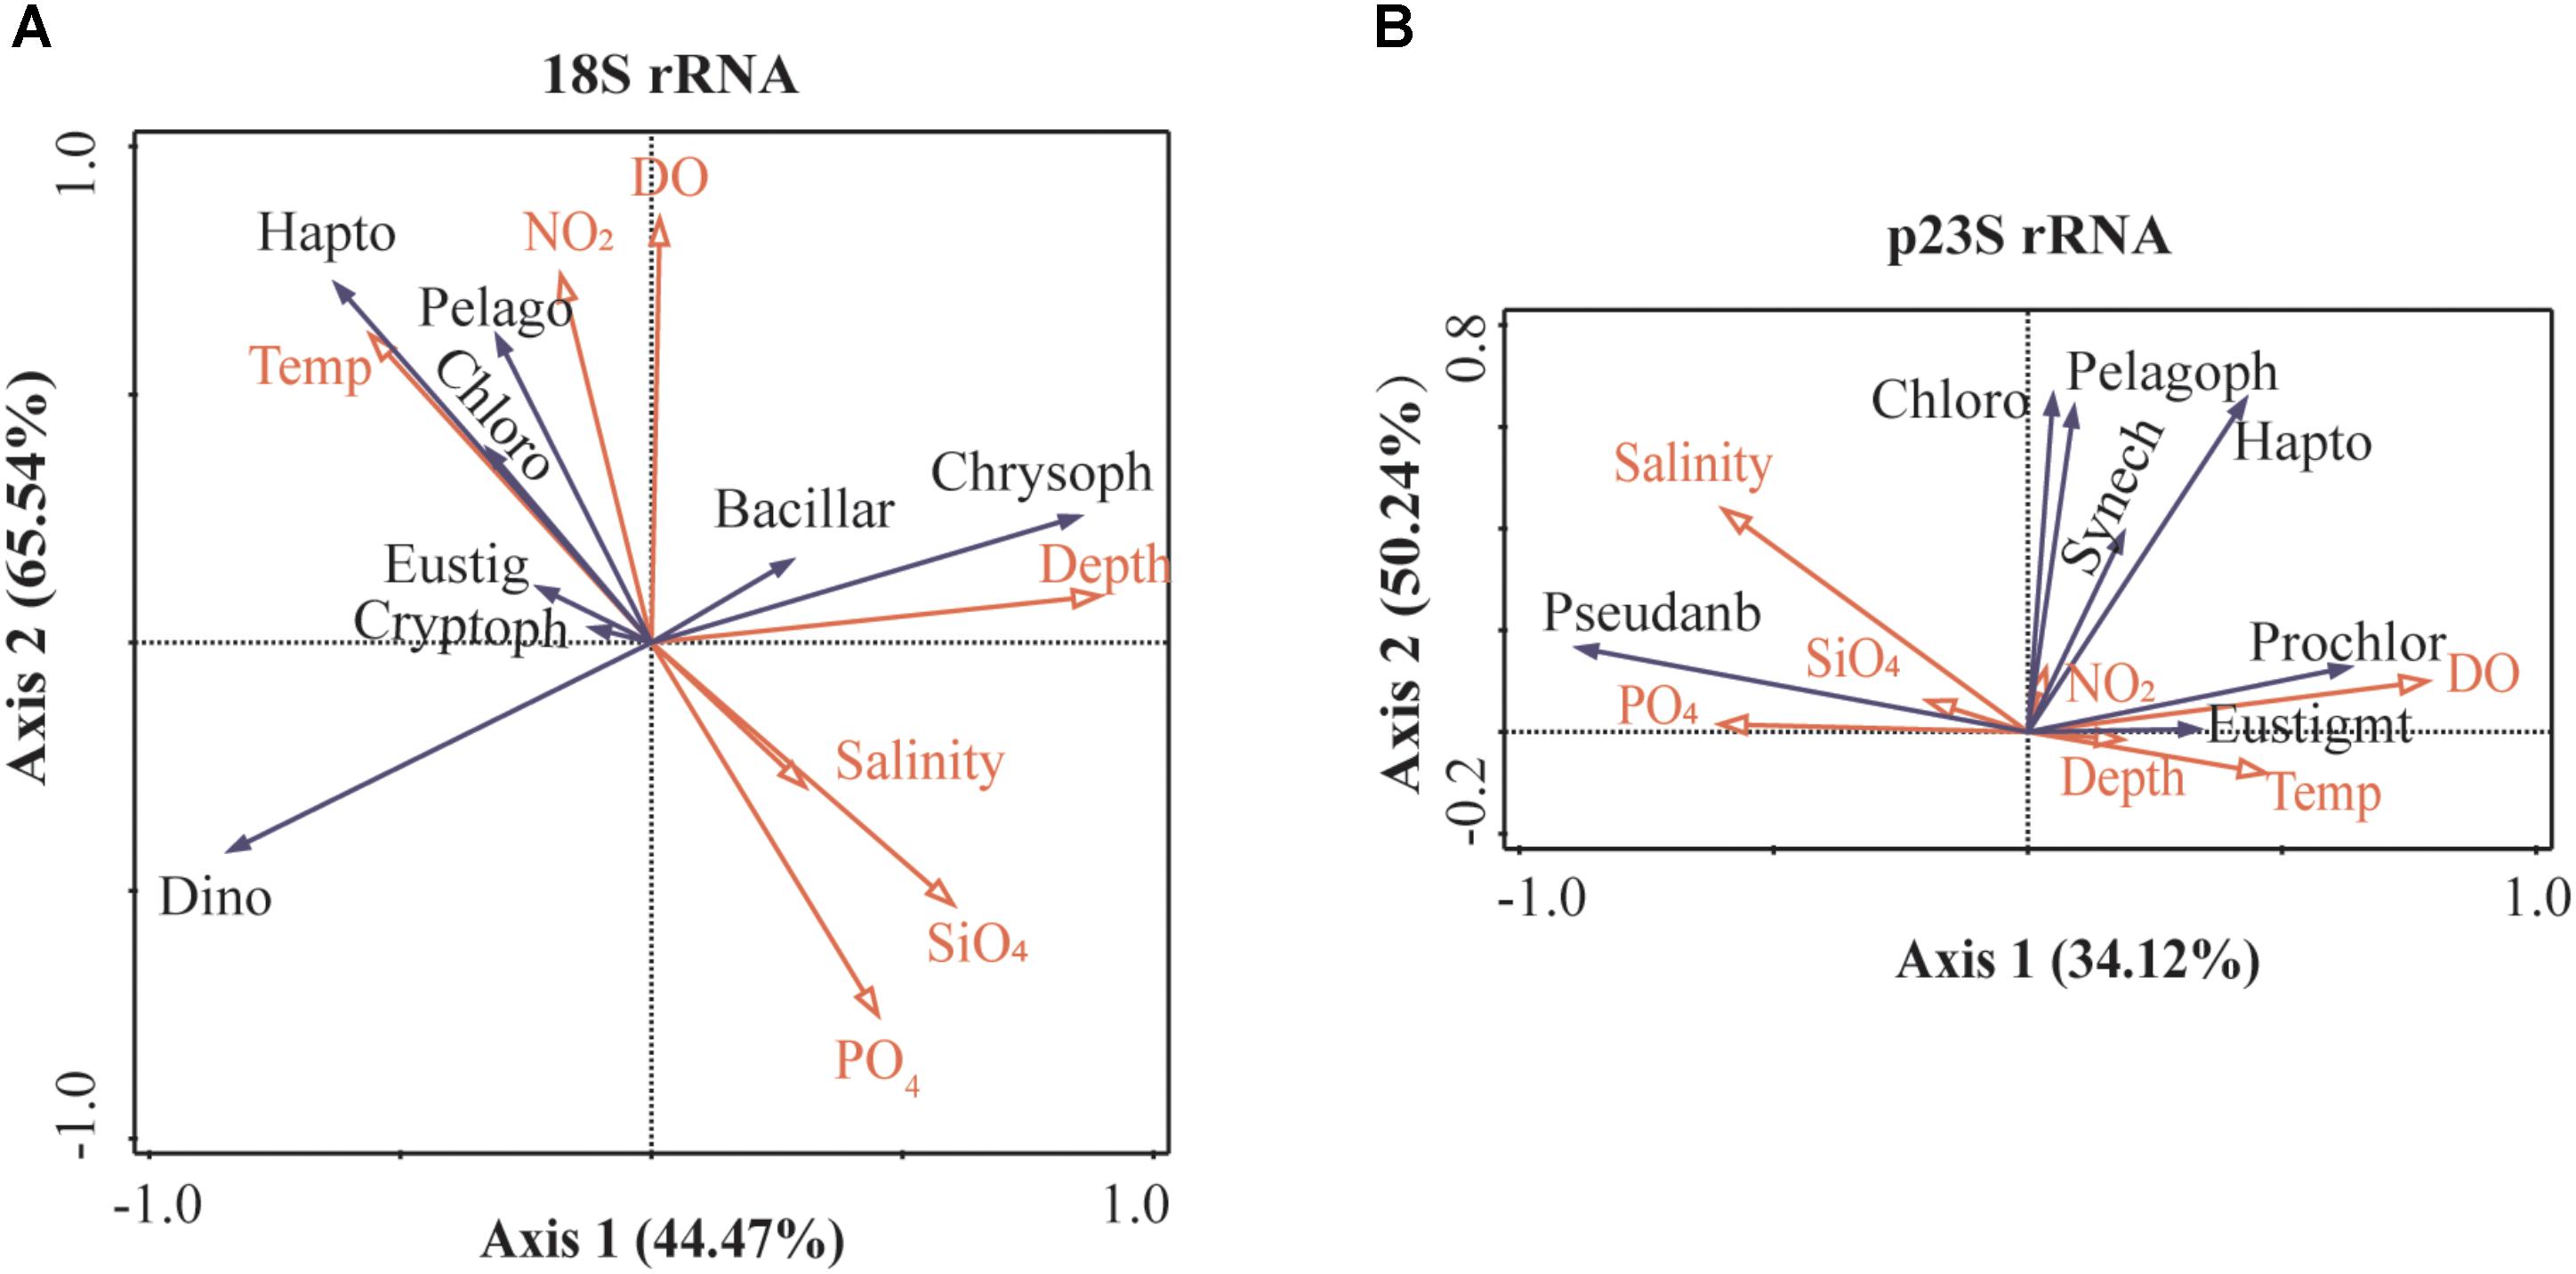
FIGURE 6. Redundancy analysis (RDA) diagram illustrating the relationship between PN community and environmental factors in the Mariana Trench. (A) 18S rRNA gene assemblage and (B) plastid 23S rRNA gene assemblage. The OTUs with relative abundances >0.01% were used in this analysis. Bacillar, Bacillariophyta; Chloro, Chlorophyta; Chrsop, Chrysophyceae; Crypto, Cryptophyceae; Dino, Dinoflagellata; Eustig, Eustigmatophyceae; Hapto, Haptophyta; Pelago, Pelagophyceae; Prochlor, Prochloraceae; Pseudanb, Pseudanabaenaceae; and Synechoc, Synechococcaceae.
RDA explained 63.10% of the cumulative variation in the p23S rRNA communities and environmental factor relationships; furthermore, RDA showed that DO, depth, and salinity significantly contributed to the variation in the PN communities, while the other environmental factors had almost no correlation with the distribution of the PN communities (Supplementary Table S3). The results (Figure 6B) showed that the first RDA axis explained 34.12% of the total variation in the p23S rRNA communities. The first two RDA axes explained 50.24% of the total variation in the relative abundance of the p23S rRNA communities. Chlorophyta, Pelagophyceae, and Pseudanabaenaceae were negatively correlated with depth, and Chlorophyta and Pseudanabaenaceae were positively correlated with salinity. Haptophyta and Prochloraceae were positively correlated with DO.
In addition, the 18S and p23S rRNA communities were combined together, and their correlations with the environmental factors were analyzed (Supplementary Table S3). The results indicated that the depth, which was followed by temperature, was the most important environmental factor in terms of structuring the vertical distribution of PN community in the Mariana Trench. The temperatures were gradually decreased with increasing depth (Supplementary Table S1). RDA (Supplementary Figure S2) showed that the first axis explained 36.83%, while the first two axes explained 55.03% of the total variation in the relative abundance of the 18S rRNA + p23S rRNA communities and 68.2% of the cumulative variation in the 18S rRNA + p23S rRNA communities and environmental factors. Chrysophyceae, Eustigmatophyceae, Synechococcaceae, and Prochloraceae were positively correlated with depth, while Dinoflagellata, Chlorophyta, Haptophyta, and Pseudanabaenaceae were significant negatively correlated with depth. Haptophyta, Dinoflagellata, and Prochloraceae were significant positively correlated with temperature, while Chrysophyceae, Pseudanabaenaceae, Eustigmatophyceae, Cryptophyceae, and Bacillariophyta were negatively correlated with temperature. In addition, the nutrients (PO4, NO3, and NO2) and salinity also significantly contributed to the structure of the PN communities.
Discussion
As important players in the oceanic biological carbon pump processes, phytoplankton contribute to the export of carbon from the surface of the ocean to the deep ocean (Richardson and Jackson, 2007; Tréguer et al., 2017; Leblanc et al., 2018), and may even provide an important source of energy to organisms present in the hadal trench. In this study, the diversity and composition of the PN present in the Challenger Deep were examined by 18S and p23 rRNA gene analysis. Compared to single gene analysis, the two target gene analysis methods potentially offer a more comprehensive view of the phytoplankton diversity. Both cyanobacteria and various eukaryotic PN communities were identified from the hadal trench. The vertical distribution pattern identified here suggested that the PN communities have important roles in the process of exporting organic matters from the surface to the deep sea in the Mariana Trench, and these results improved the understanding of the biological carbon pump of the hadal trench.
Environmental Factors Controlling the Mariana Trench Pico- and Nano-Phytoplankton
The RDA revealed that the depth, temperature, salinity, and nutrients (PO4, NO3, and NO2) might be the significant environment factors that structure the PN community in the Mariana Trench. Abiotic environmental factors, such as salinity, depth, temperature, light, and nutrients, can significantly influence the physiological and ecological characteristics of phytoplankton (Chen et al., 2014; Liang et al., 2016; Gittings et al., 2018; Wei et al., 2018). In addition, some unexpected results were found, such as the positive relationships between depth and Chrysophyceae and between depth and Eustigmatophyceae. Similarly, the Chrysophyceae were also predominant microbial eukaryotes at the depth of 8727 m of the Challenger Deep (Xu et al., 2018). These results suggested that Chrysophyceae and Eustigmatophyceae may sink to the deep sea more easily than other phytoplankton groups, and/or they possess special biological characteristics that help them resist the extreme conditions, such as the cold temperature and high hydrostatic pressure. For example, a high relative abundance of the Eustigmatophyceae Nannochloropsis was found at 8320 m. Nannochloropsis species are capable of accumulating a large amount of lipids, which may help them adapt to low temperatures (Murakami et al., 2018). For Chrysophyceae, the most OTUs were assigned to the genus Paraphysomonas, which include the heterotrophic and potentially low-temperature resistant species (Rose et al., 2009).
Moreover, other environmental factors and accidental events, such as currents, turbulence, and earthquakes, were not included in the analysis; however, these factors could also affect the phytoplankton community in the Mariana Trench.
The Composition of the Cyanobacteria Community in the Mariana Trench
In this study, the sampling site that belonged to the oligotrophic zone and was located at a low latitude had a small population of Synechococcus (i.e., less than 1000 cells at 4 and 100 m), and its abundance was considerably less than that of Prochlorococcus. The results were similar to previous findings that stated Prochlorococcus was most abundant at the surface (i.e., 0–100 m) and decreased with depth (Johnson et al., 2006); furthermore, its abundance corresponded to previous reports in which it ranged from 2.8 × 10³ to 4.4 × 10⁴ cells mL-1 (Flombaum et al., 2013). Both Prochlorococcus and Synechococcus are prokaryotic picophytoplankton, but their distribution patterns were quite different. Synechococcus are vitally ubiquitous in all oceans, and they are more abundant in the eutrophic zone than in the oligotrophic zone; in contrast, Prochlorococcus are less ubiquitous and much more commonly distributed in low latitudes (40°N to 40°S), and they extend much deeper in the water column, with a common maximum concentration at depths of ∼150–200 m (Partensky et al., 1999; Johnson et al., 2006). The temperature and light (but not the nutrients) were the factors that had the most control over the distribution of Prochlorococcus and Synechococcus (Flombaum et al., 2013).
Interestingly, Jaaginema, one type of filamentous cyanobacterium, was found by the p23S rRNA analysis, and they were abundant from 200 to 6050 m. In general, the genus Jaaginema is mainly present in freshwater ecosystems; however, several species have been identified in marine ecosystems, including Jaaginema litorale (Brito et al., 2017). The species identified from this study corresponded to the previously described marine species Jaaginema litorale. Most studies of this genus have been based on morphology, and only very few sequences have been recorded in the database, which may explain why they have rarely been identified in oceans in previous studies that used gene analysis-based methods.
The Composition of Eukaryotic Pico- and Nano-Phytoplankton in the Mariana Trench
The abundance of eukaryotic PN was relatively low, i.e., less than 2000 cells mL-1. Nevertheless, the 18S rRNA and p23S rRNA gene analyses revealed the diversity of eukaryotic PN due to the high sensitivity of this molecular method. The phytoplankton structure was dependent on the seasons, geographical location, and environmental nutrient conditions (de Vargas et al., 2015; Kataoka et al., 2017), and the physical conditions, such as turbulence, mixed layer depth and thermal stratification, were also important regulators of phytoplankton abundance (Barton et al., 2015). Generally, diatoms and dinoflagellates are the most dominant phytoplankton in the world’s ocean. However, the dinoflagellates were among the predominant PN, whereas diatoms were rare in this study. Diatoms are often dominant phytoplankton in eutrophic regions; moreover, diatoms are very rarely found in mesotrophic regions, and no significant relative abundance has been found in oligotrophic regions (Shi et al., 2011). These data corresponded to the traditional views of dinoflagellate and diatom ecology. In the traditional view, these two phytoplankton are generally distributed in differential niches; the diatoms prefer turbulent, nutrient-rich conditions, while the dinoflagellates prefer calm, nutrient-poor conditions (Irwin et al., 2012; Barton et al., 2015). Moreover, since we have only analyzed the PN communities, the results were also similar to previous findings that the population of diatoms (pico- and nano-size) were smaller than that of dinoflagellates in the sunlit waters of the global oceans (de Vargas et al., 2015).
In addition, the dinoflagellates, as eukaryotes, were the dominant PN according to the 18S rRNA gene analysis. The high copy numbers of some dinoflagellates species 18S rRNA genes may contribute to their relative high abundance in 18S rRNA gene communities (Guo et al., 2016). Few dinoflagellate OTUs were found using the p23S rRNA gene analysis, and the complex genetic feature of dinoflagellate plastids may explain these results, i.e., the multiple origins of plastid during evolution resulted in the genetic divergence of dinoflagellate plastids (Zhang et al., 2000; Xia et al., 2013; Yamada et al., 2017). Furthermore, the dinoflagellates are very diverse and include autotrophs (photosynthetic), heterotrophs, and mixotrophs. All photosynthetic and mixotrophic dinoflagellates contain the plastid, while the heterotrophic dinoflagellates lost the most of the plastid genes (Saldarriaga et al., 2001). In the taxonomic analysis, since it was difficult to classify the OTUs at the species level, some of the heterotrophic dinoflagellates could be included in the final analysis.
The Haptophyta, of which most of them were Prymnesiophyceae, were identified as one of the dominant picophytoplankton in the Epi and Mes zones. The molecular methods confirmed that Prymnesiophyceae were present in the Pacific Ocean, Atlantic Ocean, and Indian Ocean (Shi et al., 2011; Kirkham et al., 2013), suggesting they have a wide geographic distribution, especially in most mesotrophic and oligotrophic regions (Fuller et al., 2006; Lepere et al., 2009; Jardillier et al., 2010; Shi et al., 2011). Moreover, the relatively high abundance of pico-Prymnesiophyceae were found in the Pacific Ocean, Atlantic Ocean, and Indian Ocean (Kirkham et al., 2013), and the Tera ocean also had a relatively high abundance of Haptophyta (de Vargas et al., 2015).
In addition, the OTUs assigned to Chlorophyta, Pelagophyceae, Synurophyceae, Eustigmatophyceae, and Chrysophyceae were also identified, but their relative abundances were very rare. These phytoplankton are widespread in the world’s oceans, but their distribution characteristics are different. Pelagophyceae were generally present in the open ocean or/and the oligotrophic region as well as the mesotrophic region, while the Chlorophyta were mostly distributed in the coastal ocean or/and the eutrophic region (Not et al., 2008; Shi et al., 2011; Balzano et al., 2012; Kataoka et al., 2017). Moreover, Pelagophyceae and Chlorophyta are not generally the dominant phytoplankton in most oceans (Kirkham et al., 2011, 2013; Shi et al., 2011; de Vargas et al., 2015; Kataoka et al., 2017). Chrysophyceae showed similar geographic distribution patterns as Prymnesiophyceae at a global scale; however, Chrysophyceae were detectable at deeper depths of the water column (Kirkham et al., 2013). Synurophyceae and Eustigmatophyceae have been detected sporadically in the open ocean in previous studies (Kirkham et al., 2011, 2013; Pernice et al., 2016; Xu et al., 2017).
The Presence of Pico- and Nano-Phytoplankton in the Deep Sea and Hadal Trench
Interestingly, many PN were found in the deep sea, including the hadal zone; moreover, some OTUs were found in the Bat and hadal zones but were not found in the upper layer zones. This was not the first time phytoplankton have been detected in the deep-sea/dark ocean. Living phytoplankton cells, including dinoflagellates, diatoms, and cyanobacteria, were observed at depths of 2000–4000 m using a microscope and/or flow cytometry analysis (Jiao et al., 2013; Agusti et al., 2015). The phytoplankton Dinoflagellata, Bacillariophyceae, Chrysophyceae, Prymnesiophyceae, Prasinophyceae, and Dictyochophyceae were detected in the water column at depths of 3000–4000 m using 18S rRNA analysis (Pernice et al., 2016). Furthermore, some phytoplankton, such as Chrysophyceae, Synurophyceae, and Pelagophyceae, were also detected in the deep sea of the South China Sea (Xu et al., 2017). To date, the sinking mechanism is the most common and accepted theory accounting for the presence of phytoplankton cells in the deep sea (Jiao et al., 2013; Agusti et al., 2015). The sinking rate is one important factor of phytoplankton sinking mechanism (Huisman et al., 2002; Agusti et al., 2015; Leblanc et al., 2018). The sinking rate of micro-phytoplankton cells might reach to 124–732 m per day (Agusti et al., 2015), however, the sinking rate would be decreased with decreasing cell size (Richardson and Jackson, 2007). It indicated that the PN communities identified from hadal zone in this study might have presented in the dark for several weeks or several months. Furthermore, some of the PN cells from the hadal zone have been successfully cultivated in f/2 medium (Supplementary Figure S3), and the intact cells of cyanobacteria, dinoflagellates, and diatoms have been found in the deep sea at depths of 2000–4000 m (Jiao et al., 2013; Agusti et al., 2015). Moreover, the metabolic activity of phytoplankton did not decrease in the deep sea compared to that in the shallower waters (Xu et al., 2017). These data implied that the PN communities have survived for long time in the dark sea. There are at least three aspects that could explain this phenomenon. First, the sink rate should be much faster than expected if the sinking mechanisms account for this (Xu et al., 2017), the physical processes as well as biological processes, which could accelerate the sink rate, are involved in the transportation of phytoplankton to the deep sea (Jiao et al., 2013; Agusti et al., 2015). Second, the potential heterotrophic characteristic of phytoplankton may contribute to their long time survival in the dark sea. It is well known that many phytoplankton are mixotrophic (Stoecker et al., 2017), meaning they can obtain energy and/or nutrients through different methods under various environmental conditions. The heterotrophic phytoplankton could eat bacteria and/or large particulate matter via phagocytosis (Maruyama and Kim, 2013; Raven, 2013). In the present results, the predominant abundant phytoplankton communities at 8320, e.g., Eustigmatophyceae Nannochloropsis and Chrysophyceae Paraphysomonas, were reported to have heterotrophic characteristics. It indicated that heterotrophy is most likely a way of metabolism in the dark ocean. Third, some of phytoplankton cells in the deep sea might be in the resting stages, which could help phytoplankton cells present in the darkness for several decades or even up to 100 years (Ribeiro et al., 2011), and could survive again once be back to the suitable environments.
However, the sinking mechanism cannot explain our results, as some OTUs were found only in the Bat zone and the hadal zone, and these OTUs did not appear to have sunk from the vertical water layers. Physical processes such as currents and Ekman transport may contribute to these phytoplankton cells. Furthermore, the phytoplankton composition pattern in the hadal zone, especially at very deep depths (8320 m), was quite different from that in the shallower layers in this study (Figure 4). Distinct patterns and features were also revealed with other factors. For example, phototrophic pigments, including chlorophyll a and phaeophytin, were analyzed in the Challenger Deep, and the results revealed that the concentrations of these pigment were highest in the Challenger Deep compared to the shallower waters, implying that the pigment in the Challenger Deep was younger, more labile and possibly more nutritious than those at the shallower reference site (58 km from the trench and approximately 6000 m in depth) (Glud et al., 2013). The bacterial community was different from those of the shallower zones, and the chemolithotrophic populations of the hadal zone were more abundant in the upper abyssal waters (Nunoura et al., 2015); furthermore, this unique community formation could not be explained by the vertical flux of sinking organic particles, but it may due to the endogenous recycling of organic matter in the hadal waters (Nunoura et al., 2015). In addition, biomass generally decreases with increases in depth in the deep sea (Rex et al., 2006); however, this pattern may be different in the hadal zone (Glud et al., 2013). All of these data suggested that the general distribution pattern of organisms in the oceans could not be applied to the hadal zone, and the distinct geomorphology of the hadal zone may contribute to the unique organism composition characteristics.
To date, studies on the phytoplankton of the deep sea are limited. It is very difficult to explain the presence and origins of the phytoplankton found in the deep sea. However, the relative abundances of phytoplankton in the deep sea could contribute to the transfer of carbon to the dark oceans, which would indicate they play important roles in the deep-sea carbon cycle. We hypothesized that the phytoplankton present in the deep sea (aphotic zone) could be separated into at least two types (Figure 7). One part of the phytoplankton cells came from the upper layer zones via fast sinking mechanisms. These cells may sink alone or within aggregates and/or zooplankton fecal pellets, and various physical processes could help these cells sink faster into the deep sea (Kriest and Evans, 2000; Turner, 2002; Jansen and Bathmann, 2007). These cells could live for several days, and they could ultimately be degraded into phytodetritus, and they also might become as resting cells or cyst. Another part of the phytoplankton cells could be heterotrophs that have been present in the deep sea for a long time. They may prey on bacteria and/or large particulate matter to survive.
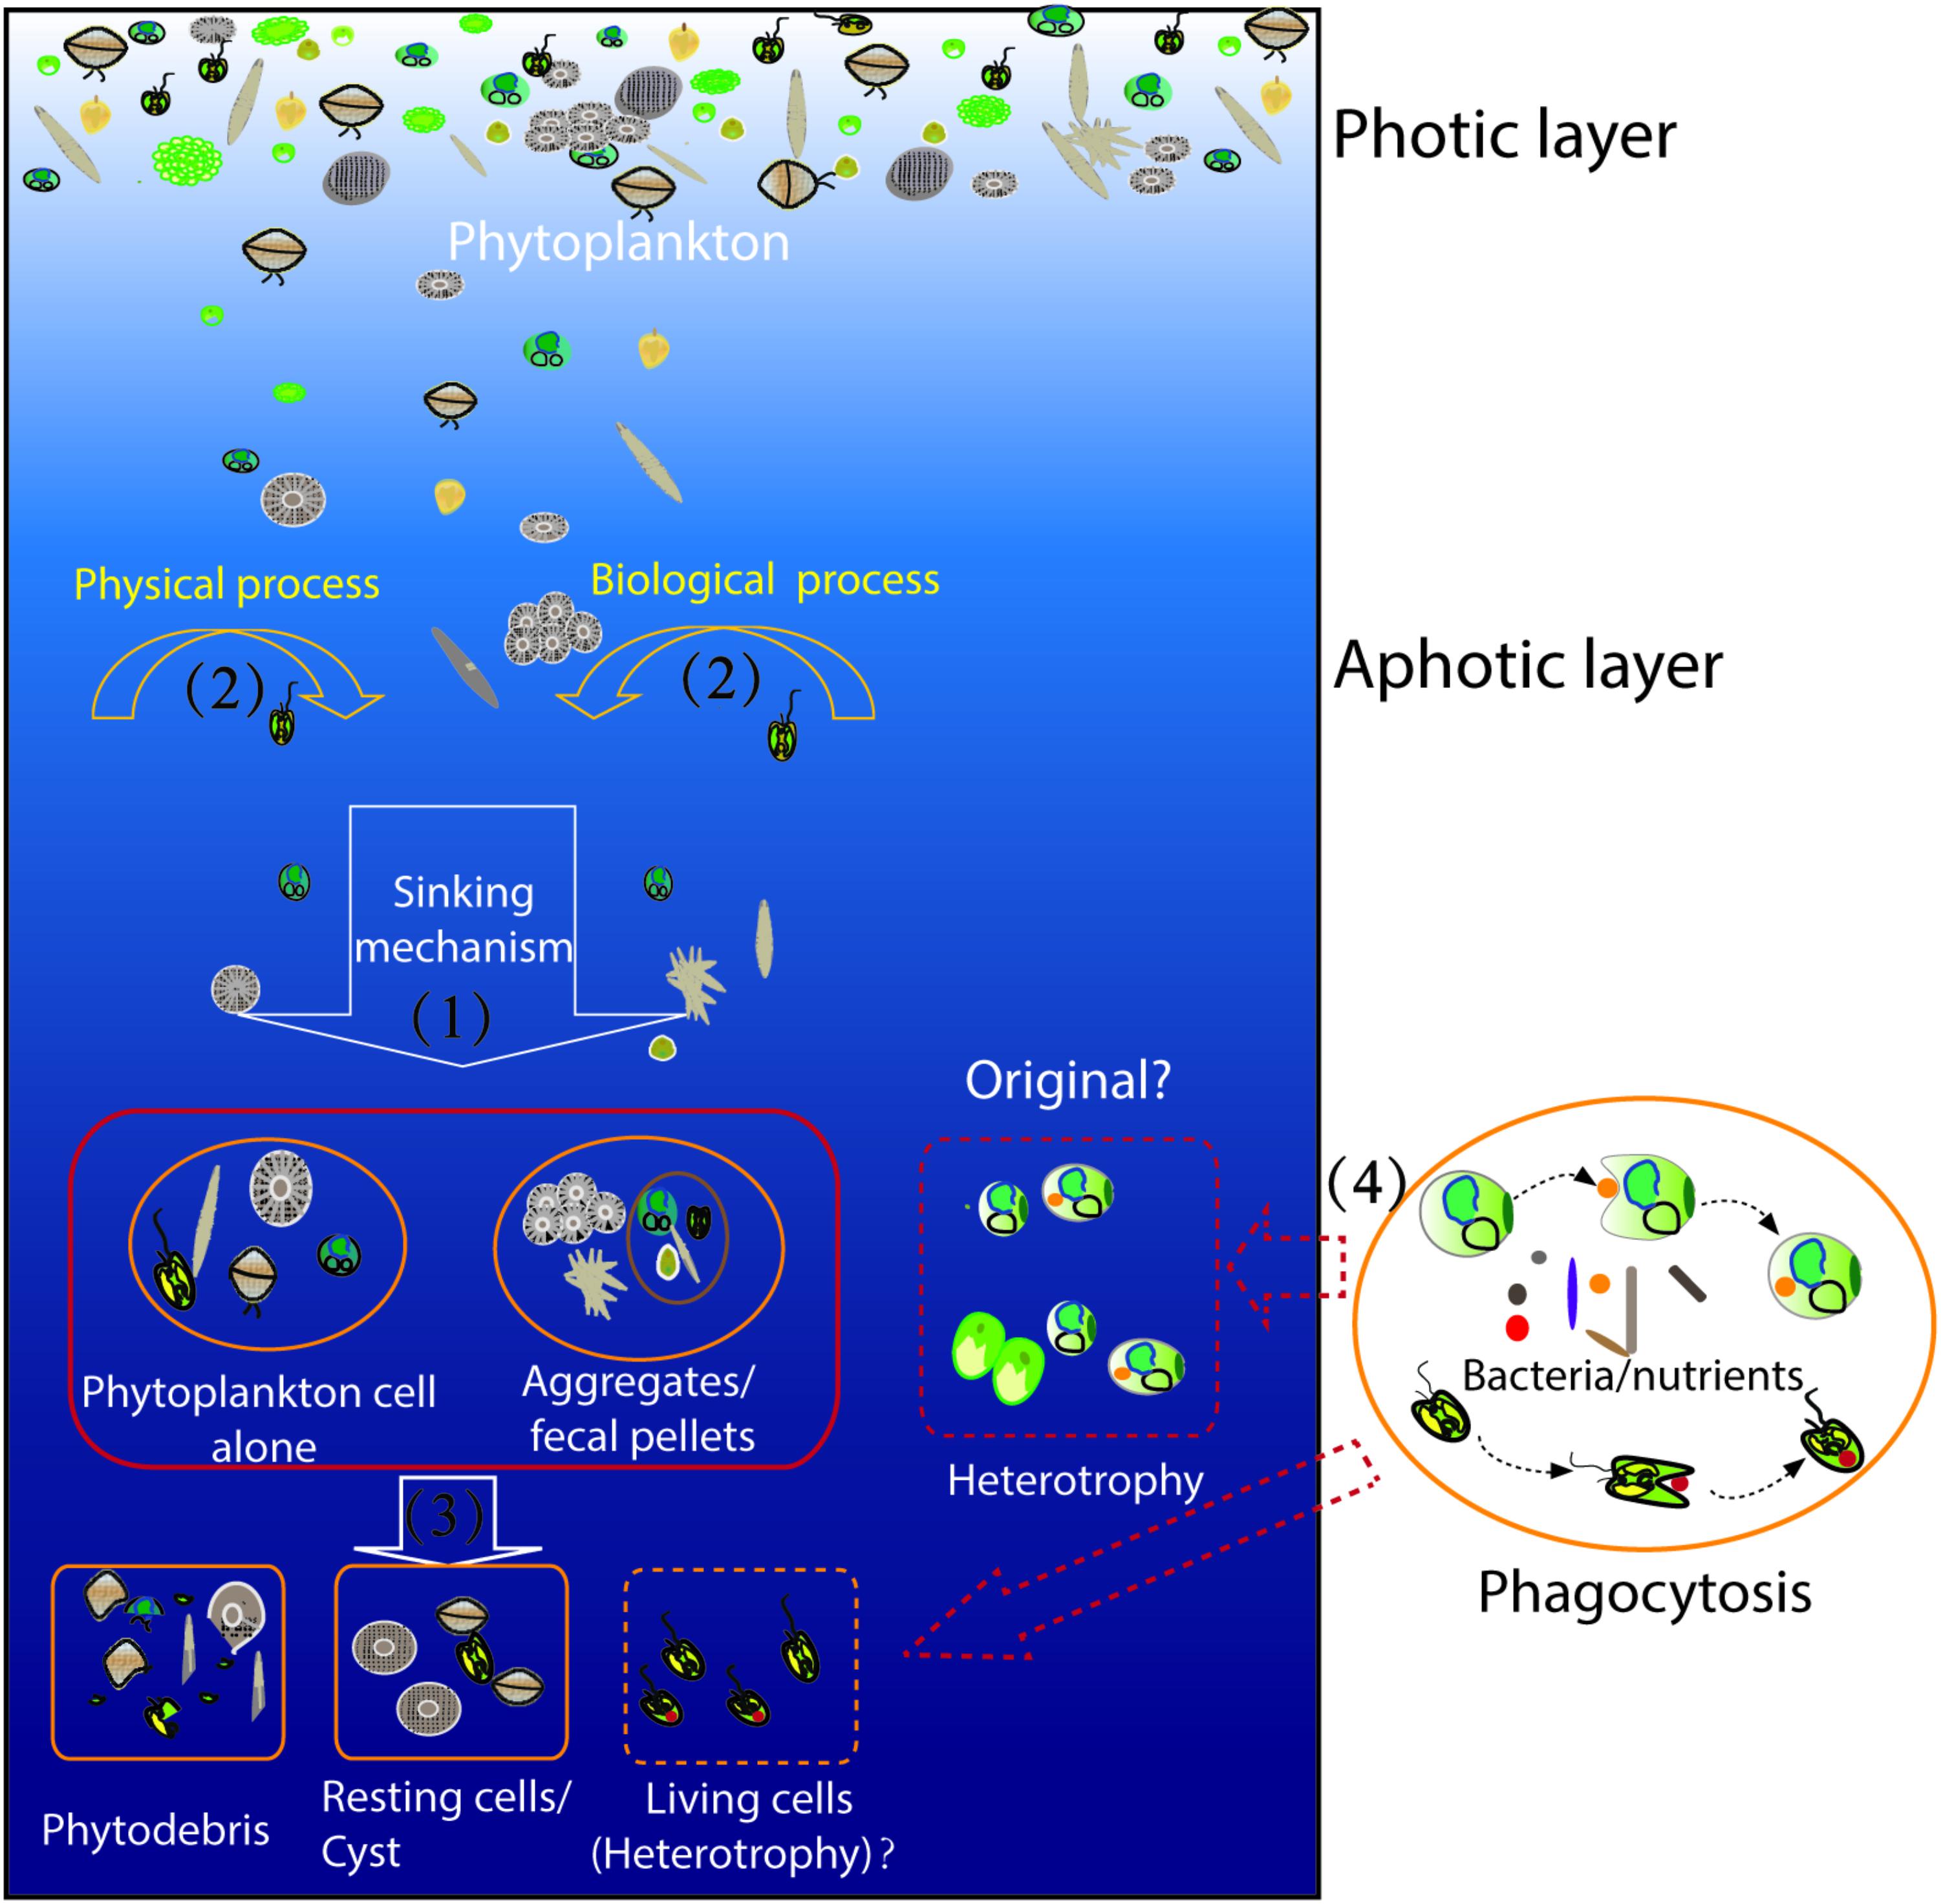
FIGURE 7. Schematic illustration of the mechanism of phytoplankton presence in the aphotic layer. The shown process/phenomenon marked within the solid-lined box indicate they have been identified; the marks within the dotted box indicate they were hypothesized. (1) Phytoplankton cells sank from aphotic layers into the aphotic layers of the sea; they could sink alone or within the aggregates/fecal pellets; (2)the physical process and/or biological process might be involved in the sinking process to accelerate cell sink; (3) the phytoplankton cells might be ultimately degraded into phytodetritus, or the cells might become resting cells or cysts; the cells also might live in the dark sea as heterotroph; and (4) the phytoplankton cells as heterotroph might prey on bacteria and/or large particulate matter to survive.
Conclusion
The present study for the first time reported the vertical distribution pattern of PN in the Mariana Trench. The dinoflagellates and the cyanobacteria Prochlorococcus were present throughout the entire water column. Some PN communities, which possess the heterotrophic characteristics, e.g., Eustigmatophyceae and Chrysophyceae, displayed higher relative abundance in the hadal zone. The presence of phytoplankton cells in the hadal zone may benefit from sinking mechanism and/or heterotrophic characteristics as well as resting characteristics of the cell. The present results highlighted the distinctive biosphere characteristics of the hadal trench environment and indicated that the phytoplankton could be involved in transportation of organic matters from euphotic to hadal zone, and some phytoplankton might survive with undetermined energy metabolism in the hadal zone.
Author Contributions
RG performed the experiments. RG, YL, YX, and LW analyzed the data. CC and RX performed sampling. SM identified the phytoplankton cells. CZ and JT provided expedition oversight. CZ and JT participated in data analysis and discussion. YL and YZ designed the experiments. RG and YZ wrote the manuscript.
Funding
This work was supported by the National Key Research and Development Program of China (2016YFA0601402), the Fourth Polar Observation Program (i.e., Deep Sea Exploration Program, Qingdao National Laboratory for Marine Science and Technology), the open task of Qingdao National Laboratory for Marine Science and Technology (QNLM2016ORP0311), the China Postdoctoral Science Foundation funded project (2017M610452), the Natural Science Foundation of China (41606153, 41673073, and 41806172), the CNOOC Tianjin project (CNOOC-KJ 125 FZDXM 00TJ 001-2014), the senior user’s project of RV KEXUE (KEXUE2018G02), and the “One Three Five” research project of QIBEBT. This study was a contribution to the international IMBER project.
Conflict of Interest Statement
The authors declare that the research was conducted in the absence of any commercial or financial relationships that could be construed as a potential conflict of interest.
Acknowledgments
We thank the captain, crew, and marine technicians of the R/V Dongfanghong 2 during the cruise.
Supplementary Material
The Supplementary Material for this article can be found online at: https://www.frontiersin.org/articles/10.3389/fmicb.2018.02289/full#supplementary-material
FIGURE S1 | Venn diagram of PN community composition from different ocean zones. (A) 18S rRNA gene assemblage; (B) plastid 23S rRNA gene assemblage. Epi, epipelagic; Bat, bathypelagic; and Mes, mesopelagic.
FIGURE S2 | Redundancy analysis (RDA) diagram illustrating the relationship between PN community (18S rRNA + plastid 23S rRNA gene assemblages) and environmental factors in the Mariana Trench. The OTUs with relative abundances >0.01% were used in this analysis. Bacillar, Bacillariophyta; Chloro, Chlorophyta; Chrsop, Chrysophyceae; Crypto, Cryptophyceae; Dino, Dinoflagellata; Eustig, Eustigmatophyceae; Hapto, Haptophyta; Pelago, Pelagophyceae; Prochlor, Prochloraceae; Pseudanb, Pseudanabaenaceae; and Synechoc, Synechococcaceae.
FIGURE S3 | Image of Chaetoceros sp. isolated from the hadal zone (depth, 8320 m) of Mariana Trench.
TABLE S1 | Co-ordinates and environmental data.
TABLE S2 | Annotation of core, specific bathypelagic, and specific Hadal OTUs by 18S rRNA and plastid 23S rRNA gene analysis.
TABLE S3 | Explains and contribution value of each evironmental factor (18S rRNA + p23S rRNA).
Footnotes
References
Agusti, S., Gonzálezgordillo, J. I., Vaqué, D., Estrada, M., Cerezo, M. I., Salazar, G., et al. (2015). Ubiquitous healthy diatoms in the deep sea confirm deep carbon injection by the biological pump. Nat. Commun. 6:7608. doi: 10.1038/ncomms8608
Balzano, S., Ellis, A. V., Le Lan, C., and Leterme, S. C. (2015). Seasonal changes in phytoplankton on the north-eastern shelf of Kangaroo Island (South Australia) in 2012 and 2013. Oceanologia 57, 251–262. doi: 10.1016/j.oceano.2015.04.003
Balzano, S., Marie, D., Gourvil, P., and Vaulot, D. (2012). Composition of the summer photosynthetic pico and nanoplankton communities in the Beaufort Sea assessed by T-RFLP and sequences of the 18S rRNA gene from flow cytometry sorted samples. ISME J. 6, 1480–1498. doi: 10.1038/ismej.2011.213
Barton, A. D., Lozier, M. S., and Williams, R. G. (2015). Physical controls of variability in North Atlantic phytoplankton communities. Limnol. Oceanogr. 60, 181–197. doi: 10.1002/lno.10011
Bazin, P., Jouenne, F., Friedl, T., Deton-Cabanillas, A. F., Roy, B. L., and Véron, B. (2014). Phytoplankton diversity and community composition along the estuarine gradient of a temperate macrotidal ecosystem: combined morphological and molecular approaches. PLoS One 9:e94110. doi: 10.1371/journal.pone.0094110
Behrenfeld, M. J., Boss, E., Siegel, D. A., and Shea, D. M. (2005). Carbon-based ocean productivity and phytoplankton physiology from space. Glob. Biogeochem. Cycles 19:GB1006. doi: 10.1029/2004GB002299
Bolger, A. M., Lohse, M., and Usadel, B. (2014). Trimmomatic: a flexible trimmer for Illumina sequence data. Bioinformatics 30, 2114–2120. doi: 10.1093/bioinformatics/btu170
Boopathi, T., Faria, D. G., Lee, M. D., Lee, J., Chang, M., and Ki, J. S. (2015). A molecular survey of freshwater microeukaryotes in an Arctic reservoir (Svalbard, 79°N) in summer by using next-generation sequencing. Polar Biol. 38, 179–187. doi: 10.1371/journal.pone.0094110
Brito,Â., Ramos, V., Mota, R., Lima, S., Santos, A., Vieira, J., et al. (2017). Description of new genera and species of marine cyanobacteria from the Portuguese Atlantic coast. Mol. Phylogenet. Evol. 111, 18–34. doi: 10.1016/j.ympev.2017.03.006
Buchan, A., Lecleir, G. R., Gulvik, C. A., and Gonzà lez, J. M. (2014). Master recyclers: features and functions of bacteria associated with phytoplankton blooms. Nat. Rev. Microbiol. 12, 686–698. doi: 10.1038/nrmicro3326
Casamayor, E. O., Massana, R., Benlloch, S., Øvreås, L., Díez, B., Goddard, V. J., et al. (2002). Changes in Archaeal, bacterial and eukaryal assemblages along a salinity gradient by comparison of genetic fingerprinting methods in a multipond solar saltern. Environ. Microbiol. 4, 338–348. doi: 10.1046/j.1462-2920.2002.00297.x
Chao, A., and Bunge, J. (2002). Estimating the number of species in a stochastic abundance model. Biometrics 58, 531–539. doi: 10.1111/j.0006-341X.2002.00531.x
Chassot, E., Bonhommeau, S., Dulvy, N. K., Mélin, F., Watson, R., Gascuel, D., et al. (2010). Global marine primary production constrains fisheries catches. Ecol. Lett. 13, 495–505. doi: 10.1111/j.1461-0248.2010.01443.x
Chen, B., Liu, H., Huang, B., and Wang, J. (2014). Temperature effects on the growth rate of marine picoplankton. Mar. Ecol. Prog. Ser. 505, 37–47. doi: 10.3354/meps10773
Danovaro, R., Gambi, C., and Croce, N. D. (2002). Meiofauna hotspot in the Atacama Trench, eastern South Pacific Ocean. Deep Sea Res. Part 1 Oceanogr. Res. Pap. 49, 843–857. doi: 10.1016/S0967-0637(01)00084-X
de Vargas, C., Audic, S., Henry, N., Decelle, J., Mahe, F., Logares, R., et al. (2015). Ocean plankton. Eukaryotic plankton diversity in the sunlit ocean. Science 348:1261605. doi: 10.1126/science.1261605
Detmer, A. E., and Bathmann, U. V. (1997). Distribution patterns of autotrophic pico- and nanoplankton and their relative contribution to algal biomass during spring in the Atlantic sector of the Southern Ocean. Deep Sea Res. Part 2 Top. Stud. Oceanogr. 44, 299–320. doi: 10.1016/S0967-0645(96)00068-9
Edgar, R. C. (2010). Search and clustering orders of magnitude faster than BLAST. Bioinformatics 26, 2460–2461. doi: 10.1093/bioinformatics/btq461
Field, C. B., Behrenfeld, M. J., Randerson, J. T., and Falkowski, P. (1998). Primary production of the biosphere: integrating terrestrial and oceanic components. Science 281, 237–240. doi: 10.1126/science.281.5374.237
Flombaum, P., Gallegos, J. L., Gordillo, R. A., Rincon, J., Zabala, L. L., Jiao, N., et al. (2013). Present and future global distributions of the marine cyanobacteria Prochlorococcus and Synechococcus. Proc. Natl. Acad. Sci. U.S.A. 110, 9824–9829. doi: 10.1073/pnas.1307701110
Fujioka, K., Okino, K., Kanamatsu, T., and Ohara, Y. (2002). Morphology and origin of the challenger deep in the southern Mariana trench. Geophys. Res. Lett. 29, 10-1–10-14. doi: 10.1029/2001GL013595
Fuller, N. J., Tarran, G. A., Cummings, D. G., Woodward, E. M. S., Orcutt, K. M., Marian, Y., et al. (2006). Molecular analysis of photosynthetic picoeukaryote community structure along an Arabian Sea Transect. Limnol. Oceanogr. 51, 2502–2514. doi: 10.4319/lo.2006.51.6.2502
Gittings, J. A., Raitsos, D. E., Krokos, G., and Hoteit, I. (2018). Impacts of warming on phytoplankton abundance and phenology in a typical tropical marine ecosystem. Sci. Rep. 8:2240. doi: 10.1038/s41598-018-20560-5
Glud, R. N., Wenzhöfer, F., Middelboe, M., Oguri, K., Turnewitsch, R., Canfield, D. E., et al. (2013). High rates of microbial carbon turnover in sediments in the deepest oceanic trench on Earth. Nat. Geosci. 6, 284–288. doi: 10.1038/NGEO1773
Grasshoff, K., Kremling, K., and Ehrhardt, M. (1999). Methods of Seawater Analysis. Weinheim: Verlag Chemie Press.
Guo, L., Sui, Z., and Yuan, L. (2016). Quantitative analysis of dinoflagellates and diatoms community via Miseq sequencing of actin gene and v9 region of 18S rDNA. Sci. Rep. 6:34709. doi: 10.1038/srep34709
Halsey, K. H., and Jones, B. M. (2015). Phytoplankton strategies for photosynthetic energy allocation. Ann. Rev. Mar. Sci. 7, 265–297. doi: 10.1146/annurev-marine-010814-015813
Huisman, J., Arrayás, M., Ebert, U., and Sommeijer, B. (2002). How do sinking phytoplankton species manage to persist? Am. Nat. 159, 245–254. doi: 10.1086/338511
Irwin, A. J., Nelles, A. M., and Finkel, Z. V. (2012). Phytoplankton niches estimated from field data. Limnol. Oceanogr. 57, 787–797. doi: 10.4319/lo.2012.57.3.0787
Jamieson, A. J., Fujii, T., Mayor, D. J., Solan, M., and Priede, I. G. (2010). Hadal trenches: the ecology of the deepest places on Earth. Trends Ecol. Evol. 25, 190–197. doi: 10.1016/j.tree.2009.09.009
Jansen, S., and Bathmann, U. (2007). Algae viability within copepod faecal pellets: evidence from microscopic examinations. Mar. Ecol. Prog. Ser. 337, 145–153. doi: 10.3354/meps337145
Jardillier, L., Zubkov, M. V., Pearman, J., and Scanlan, D. J. (2010). Significant CO2 fixation by small prymnesiophytes in the subtropical and tropical northeast Atlantic Ocean. ISME J. 4, 1180–1192. doi: 10.1038/ismej.2013.166
Jiao, N., Luo, T., Zhang, R., Yan, W., Lin, Y., Johnson, Z. I., et al. (2013). Presence of Prochlorococcus in the aphotic waters of the western Pacific Ocean. Biogeosciences 10, 9345–9371. doi: 10.5194/bg-11-2391-2014
Johnson, Z. I., Zinser, E. R., Coe, A., McNulty, N. P., Woodward, E. M., and Chisholm, S. W. (2006). Niche partitioning among Prochlorococcus ecotypes along ocean-scale environmental gradients. Science 311, 1737–1740. doi: 10.1126/science.1118052
Jonathan, T., Peoples, L. M., Kevin, H., James, C., and Bartlett, D. H. (2016). Identification of free-living and particle-associated microbial communities present in Hadal regions of the Mariana Trench. Front. Microbiol. 7:665. doi: 10.3389/fmicb.2016.00665
Kaiser, M., Attrill, M., Jennings, S., Thomas, D., Barnes, D., Brierley, A., et al. (2007). Marine Ecology: Processes, Systems and Impacts. New York, NY: Oxford University Press, 36.
Kataoka, T., Yamaguchi, H., Sato, M., Watanabe, T., Taniuchi, Y., Kuwata, A., et al. (2017). Seasonal and geographical distribution of near-surface small photosynthetic eukaryotes in the western North Pacific determined by pyrosequencing of 18S rDNA. FEMS Microbiol. Ecol. 93:fiw229. doi: 10.1093/femsec/fiw229
Kato, C., Li, L., Tamaoka, J., and Horikoshi, K. (1997). Molecular analyses of the sediment of the 11,000-m deep Mariana Trench. Extremophiles 1, 117–123. doi: 10.1007/s007920050024
Kirkham, A. R., Jardillier, L. E., Tiganescu, A., Pearman, J., Zubkov, M. V., and Scanlan, D. J. (2011). Basin-scale distribution patterns of photosynthetic picoeukaryotes along an Atlantic meridional transect. Environ. Microbiol. 13, 975–990. doi: 10.1111/j.1462-2920.2010.02403.x
Kirkham, A. R., Lepere, C., Jardillier, L. E., Not, F., Bouman, H., Mead, A., et al. (2013). A global perspective on marine photosynthetic picoeukaryote community structure. ISME J. 7, 922–936. doi: 10.1038/ismej.2012.166
Kriest, I., and Evans, G. T. (2000). A vertically resolved model for phytoplankton aggregation. J. Earth Syst. Sci. 109, 453–469. doi: 10.1007/BF02708333
Lan, Y., Sun, J., Tian, R., Bartlett, D. H., Li, R., Wong, Y. H., et al. (2017). Molecular adaptation in the world’s deepest-living animal: insights from transcriptome sequencing of the hadal amphipod Hirondellea gigas. Mol. Ecol. 26, 3732–3743. doi: 10.1111/mec.14149
Leblanc, K., Quéguiner, B., Diaz, F., Cornet, V., Michelrodriguez, M., Durrieu, X. D. M., et al. (2018). Nanoplanktonic diatoms are globally overlooked but play a role in spring blooms and carbon export. Nat. Commun. 9:953. doi: 10.1038/s41467-018-03376-9
Lepere, C., Vaulot, D., and Scanlan, D. J. (2009). Photosynthetic picoeukaryote community structure in the South East Pacific Ocean encompassing the most oligotrophic waters on Earth. Environ. Microbiol. 11, 3105–3117. doi: 10.1111/j.1462-2920.2009.02015.x
Liang, Y., Zhang, Y., Wang, N., Luo, T., Zhang, Y., and Rivkin, R. B. (2017). Estimating primary production of picophytoplankton using the carbon-based ocean productivity model: a preliminary study. Front. Microbiol. 8:1926. doi: 10.3389/fmicb.2017.01926
Liang, Y., Zhang, Y., Zhang, Y., Luo, T., Rivkin, R. B., and Jiao, N. (2016). Distributions and relationships of virio- and picoplankton in the epi-, meso- and bathypelagic zones of the Western Pacific Ocean. FEMS Microbiol. Ecol. 93:fiw238. doi: 10.1093/femsec/fiw238
Liu, X., Hou, W., Dong, H., Wang, S., Jiang, H., Wu, G., et al. (2015). Distribution and diversity of Cyanobacteria and eukaryotic algae in Qinghai-Tibetan lakes. Geomicrobiol. J. 33, 860–869. doi: 10.1080/01490451.2015.1120368
Lomas, M. W., Bonachela, J. A., Levin, S. A., and Martiny, A. C. (2014). Impact of ocean phytoplankton diversity on phosphate uptake. Proc. Natl. Acad. Sci. U.S.A. 111, 17540–17545. doi: 10.1073/pnas.1420760111
López-García, P., Philippe, H., Gail, F., and Moreira, D. (2003). Autochthonous eukaryotic diversity in hydrothermal sediment and experimental microcolonizers at the Mid-Atlantic Ridge. Proc. Natl. Acad. Sci. U.S.A. 100, 697–702. doi: 10.1073/pnas.0235779100
Luo, M., Gieskes, J., Chen, L., Shi, X., and Chen, D. (2017). Provenances, distribution, and accumulation of organic matter in the southern Mariana Trench rim and slope: implication for carbon cycle and burial in hadal trenches. Mar. Geol. 386, 98–106. doi: 10.1016/j.margeo.2017.02.012
Magoc, T., and Salzberg, S. L. (2011). FLASH: fast length adjustment of short reads to improve genome assemblies. Bioinformatics 27, 2957–2963. doi: 10.1093/bioinformatics/btr507
Magurran, A. E. (1989). Ecological Diversity and Its Measurement, Vol. 46. Princeton, NJ: Princeton University Press, 81–99. doi: 10.1007/978-94-015-7358-0
Marañón, E. (2015). Cell size as a key determinant of phytoplankton metabolism and community structure. Ann. Rev. Mar. Sci. 7, 241–264. doi: 10.1146/annurev-marine-010814-015955
Maruyama, S., and Kim, E. (2013). A modern descendant of early green algal phagotrophs. Curr. Biol. 23, 1081–1084. doi: 10.1016/j.cub.2013.04.063
Murakami, H., Nobusawa, T., Hori, K., Shimojima, M., and Ohta, H. (2018). Betaine lipid is crucial for adapting to low temperature and phosphate deficiency in Nannochloropsis. Plant Physiol. 177, 181–193. doi: 10.1104/pp.17.01573
Nakanishi, M., and Hashimoto, J. (2011). A precise bathymetric map of the world’s deepest seafloor, Challenger Deep in the Mariana Trench. Mar. Geophys. Res. 32, 455–463. doi: 10.1007/s11001-011-9134-0
Not, F., Latasa, M., Scharek, R., Viprey, M., Karleskind, P., Balagué, V., et al. (2008). Protistan assemblages across the Indian Ocean, with a specific emphasis on the picoeukaryotes. Deep Sea Res. Part 1 Oceanogr. Res. Pap. 55, 1456–1473. doi: 10.1016/j.dsr.2008.06.007
Nunoura, T., Takaki, Y., Hirai, M., Shimamura, S., Makabe, A., Koide, O., et al. (2015). Hadal biosphere: insight into the microbial ecosystem in the deepest ocean on Earth. Proc. Natl. Acad. Sci. U.S.A. 112, E1230–E1236. doi: 10.1073/pnas.1421816112
Partensky, F., Blanchot, J., and Vaulot, D. (1999). Differential distribution and ecology of Prochlorococcus and Synechococcus in oceanic waters: a review. Bioscience 61, 743–749.
Pernice, M. C., Giner, C. R., Logares, R., Perera-Bel, J., Acinas, S. G., Duarte, C. M., et al. (2016). Large variability of bathypelagic microbial eukaryotic communities across the world’s oceans. ISME J. 10, 945–958. doi: 10.1038/ismej.2015.170
Presting, G. G. (2006). Identification of conserved regions in the plastid genome: implications for DNA barcoding and biological function. Can. J. Bot. 84, 1434–1443. doi: 10.1139/B06-117
Quast, C., Pruesse, E., Yilmaz, P., Gerken, J., Schweer, T., Yarza, P., et al. (2013). The SILVA ribosomal RNA gene database project: improved data processing and web-based tools. Nucleic Acids Res. 41, D590–D596. doi: 10.1093/nar/gks1219
Raven, J. A. (2013). Cells inside cells: symbiosis and continuing phagotrophy. Curr. Biol. 23, R530–R531. doi: 10.1016/j.cub.2013.05.006
Rex, M. A., Etter, R. J., Morris, J. S., Crouse, J., Mcclain, C. R., Johnson, N. A., et al. (2006). Global bathymetric patterns of standing stock and body size in the deep-sea benthos. Mar. Ecol. Prog. Ser. 1975, 1–8. doi: 10.3354/meps317001
Ribeiro, S., Berge, T., Lundholm, N., Andersen, T. J., Abrantes, F., and Ellegaard, M. (2011). Phytoplankton growth after a century of dormancy illuminates past resilience to catastrophic darkness. Nat. Commun. 2:311. doi: 10.1038/ncomms1314
Richardson, T. L., and Jackson, G. A. (2007). Small phytoplankton and carbon export from the surface ocean. Science 315, 838–840. doi: 10.1126/science.1133471
Rose, J. M., Vora, N. M., Countway, P. D., Gast, R. J., and Caron, D. A. (2009). Effects of temperature on growth rate and gross growth efficiency of an Antarctic bacterivorous protist. ISME J. 3, 252–260. doi: 10.1038/ismej.2008.96
Saldarriaga, J. F., Taylor, F. J., Keeling, P. J., and Cavalier-Smith, T. (2001). Dinoflagellate nuclear SSU rRNA phylogeny suggests multiple plastid losses and replacements. J. Mol. Evol. 53, 204–213. doi: 10.1007/s002390010210
Schloss, P. D., Gevers, D., and Westcott, S. L. (2011). Reducing the effects of PCR amplification and sequencing artifacts on 16S rRNA-based studies. PLoS One 6:e27310. doi: 10.1371/journal.pone.0027310
Sherwood, A. R., and Presting, G. G. (2007). Universal primers amplify a 23S rDNA plastid marker in eukaryotic algae and cyanobacteria. J. Phycol. 43, 605–608. doi: 10.1111/j.1529-8817.2007.00341.x
Shi, X. L., Lepère, C., Scanlan, D. J., and Vaulot, D. (2011). Plastid 16S rRNA Gene diversity among eukaryotic picophytoplankton sorted by flow cytometry from the South Pacific Ocean. PLoS One 6:e18979. doi: 10.1371/journal.pone.0018979
Stoecker, D. K., Hansen, P. J., Caron, D. A., and Mitra, A. (2017). Mixotrophy in the marine plankton. Ann. Rev. Mar. Sci. 9, 311–335. doi: 10.1146/annurev-marine-010816-060617
Taira, K., Kitagawa, S., Yamashiro, T., and Yanagimoto, D. (2004). Deep and bottom currents in the Challenger Deep, Mariana Trench, measured with super-deep current meters. J. Oceanogr. 60, 919–926. doi: 10.1007/s10872-005-0001-y
Taira, K., Yanagimoto, D., and Kitagawa, S. (2005). Deep CTD casts in the challenger deep, Mariana trench. J. Oceanogr. 61, 447–454. doi: 10.1007/s10872-005-0001-y
Takami, H., Inoue, A., Fuji, F., and Horikoshi, K. (1997). Microbial flora in the deepest sea mud of the Mariana Trench. FEMS Microbiol. Lett. 152, 279–285. doi: 10.1111/j.1574-6968.1997.tb10440.x
Tamburini, C., Boutrif, M., Garel, M., Colwell, R. R., and Deming, J. W. (2013). Prokaryotic responses to hydrostatic pressure in the ocean-a review. Environ. Microbiol. 15, 1262–1274. doi: 10.1111/1462-2920.12084
Tang, T., Kisslinger, K., and Lee, C. (2014). Silicate deposition during decomposition of cyanobacteria may promote export of picophytoplankton to the deep ocean. Nat. Commun. 5:4143. doi: 10.1038/ncomms5143
Tréguer, P., Bowler, C., Moriceau, B., Dutkiewicz, S., Gehlen, M., Aumont, O., et al. (2017). Influence of diatom diversity on the ocean biological carbon pump. Nat. Geosci. 11, 27–37. doi: 10.1038/s41561-017-0028-x
Treusch, A. H., Demirhilton, E., Vergin, K. L., Worden, A. Z., Carlson, C. A., Donatz, M. G., et al. (2012). Phytoplankton distribution patterns in the northwestern Sargasso Sea revealed by small subunit rRNA genes from plastids. ISME J. 6, 481–492. doi: 10.1038/ismej.2011.117
Turner, J. (2002). Zooplankton fecal pellets, marine snow and sinking phytoplankton blooms. Aquat. Microb. Ecol. 27, 57–102. doi: 10.3354/ame027057
Vaulot, D., Eikrem, W., Viprey, M., and Moreau, H. (2008). The diversity of small eukaryotic phytoplankton ( < = μm) in marine ecosystems. FEMS Microbiol. Lett. 32, 795–820. doi: 10.1111/j.1574-6976.2008.00121.x
Vinogradova, N. G. (1997). Zoogeography of the abyssal and hadal zones. Adv. Mar. Biol. 32, 325–387. doi: 10.1016/S0065-2881(08)60019-X
Wang, M., Liang, Y. T., Bai, X. G., Jiang, X. J., Fang, W., and Qian, Q. (2010). Distribution of microbial populations and their relationship with environmental parameters in the coastal waters of Qingdao, China. Environ. Microbiol. 12, 1926–1939. doi: 10.1111/j.1462-2920.2010.02197.x
Wei, Y., Sun, J., Zhang, X., Wang, J., and Huang, K. (2018). Picophytoplankton size and biomass around equatorial eastern Indian Ocean. Microbiologyopen doi: 10.1002/mbo3.629 [Epub ahead of print].
Xia, S., Zhang, Q., Zhu, H., Cheng, Y., Liu, G., and Hu, Z. (2013). Systematics of a Kleptoplastidal dinoflagellate, Gymnodinium eucyaneum Hu (Dinophyceae), and its cryptomonad endosymbiont. PLoS One 8:e53820. doi: 10.1371/journal.pone.0053820
Xu, D., Li, R., Hu, C., Sun, P., Jiao, N., and Warren, A. (2017). Microbial eukaryote diversity and activity in the water column of the South China Sea based on DNA and RNA high throughput sequencing. Front. Microbiol. 8:1121. doi: 10.3389/fmicb.2017.01121
Xu, Z., Wang, M., Wu, W., Li, Y., Liu, Q., Han, Y., et al. (2018). Vertical distribution of microbial eukaryotes from surface to the hadal zone of the mariana trench. Front. Microbiol. 9:2023. doi: 10.3389/fmicb.2018.02023
Yamada, N., Sym, S. D., and Horiguchi, T. (2017). Identification of highly divergent diatom-derived chloroplasts in dinoflagellates, Including a description of Durinskia kwazulunatalensis sp. nov. (Peridiniales, Dinophyceae). Mol. Biol. Evol. 34, 1335–1351. doi: 10.1093/molbev/msx054
Zhang, Z., Green, B. R., and Cavalier-Smith, T. (2000). Phylogeny of ultra-rapidly evolving dinoflagellate chloroplast genes: a possible common origin for sporozoan and dinoflagellate plastids. J. Mol. Evol. 51, 26–40. doi: 10.1007/s002390010064
Keywords: pico- and nano-phytoplankton, 18S rRNA, plastid 23S rRNA, Mariana Trench, deep sea
Citation: Guo R, Liang Y, Xin Y, Wang L, Mou S, Cao C, Xie R, Zhang C, Tian J and Zhang Y (2018) Insight Into the Pico- and Nano-Phytoplankton Communities in the Deepest Biosphere, the Mariana Trench. Front. Microbiol. 9:2289. doi: 10.3389/fmicb.2018.02289
Received: 31 May 2018; Accepted: 07 September 2018;
Published: 26 September 2018.
Edited by:
Senjie Lin, University of Connecticut, United StatesReviewed by:
Yonghong Bi, Institute of Hydrobiology (CAS), ChinaRui Zhang, Xiamen University, China
Copyright © 2018 Guo, Liang, Xin, Wang, Mou, Cao, Xie, Zhang, Tian and Zhang. This is an open-access article distributed under the terms of the Creative Commons Attribution License (CC BY). The use, distribution or reproduction in other forums is permitted, provided the original author(s) and the copyright owner(s) are credited and that the original publication in this journal is cited, in accordance with accepted academic practice. No use, distribution or reproduction is permitted which does not comply with these terms.
*Correspondence: Jiwei Tian, dGlhbmp3QG91Yy5lZHUuY24= Yongyu Zhang, emhhbmd5eUBxaWJlYnQuYWMuY24=