 Zhongbao Ma1,2
 Chao Ye1,2
 Weiwei Deng2Mengmeng Xu1,2Qiong Wang1,2Gaoqiang Liu3
 Feng Wang4
 Liming Liu1,2
 Zhenghong Xu1,2Guiyang Shi1,2
 Zhongyang Ding1,2*
- 1Key Laboratory of Carbohydrate Chemistry and Biotechnology, Ministry of Education, School of Biotechnology, Jiangnan University, Wuxi, China
- 2National Engineering Laboratory for Cereal Fermentation Technology, Jiangnan University, Wuxi, China
- 3Key Laboratory of Cultivation and Protection for Non-Wood Forest Trees, Ministry of Education, College of Life Science and Technology, Central South University of Forestry and Technology, Changsha, China
- 4School of Food and Biological Engineering, Jiangsu University, Zhenjiang, China
In this study, we reconstructed for the first time a genome-scale metabolic model (GSMM) of Ganoderma lucidum strain CGMCC5.26, termed model iZBM1060, containing 1060 genes, 1202 metabolites, and 1404 reactions. Important findings based on model iZBM1060 and its predictions are as follows: (i) The extracellular polysaccharide (EPS) biosynthetic pathway was elucidated completely. (ii) A new fermentation strategy is proposed: addition of phenylalanine increased EPS production by 32.80% in simulations and by 38.00% in experiments. (iii) Eight genes for key enzymes were proposed for EPS overproduction. Model iZBM1060 provides a useful platform for regulating EPS production in terms of system metabolic engineering for G. lucidum, as well as a guide for future metabolic pathway construction of other high value-added edible/ medicinal mushroom species.
Introduction
Ganoderma lucidum (lingzhi or reishi mushroom) is a species well known for its edible and medicinal properties, and has a long history of use for prevention and treatment of various human diseases. Extracellular polysaccharides (EPSs) from G. lucidum comprise a structurally diverse group of macromolecules that display immunomodulatory, antitumor, and a wide range of other biological activities (Ferreira et al., 2015). Many studies have described enhancement of EPS production through optimization of medium and culture conditions in submerged fermentation (Tang and Zhong, 2003). However, EPS molecules, their structural features, and their biosynthetic pathways are all highly complex, and attempts to improve EPS production are often hampered by this complexity. There is an urgent need for more extensive, systematic knowledge of physiological features and metabolism of G. lucidum EPSs.
Genome-scale metabolic models (GSMMs), in which a systems biology approach is used to integrate genomic, transcriptomic, proteomic, and metabolomic data, are highly effective tools for metabolism research. GSMMs have been widely used for analysis of network properties, prediction of growth phenotypes, and interpretation of experimental data, particularly in Escherichia coli and Saccharomyces cerevisiae models (Kim et al., 2017).
There have been no reports to date of GSMMs for edible/ medicinal mushroom species. The publication in 2012 of the whole genome sequence of G. lucidum strain CGMCC5.26 (Chen et al., 2012), and subsequent related reports, have made GSMM reconstruction feasible for this species. Such reconstruction will help clarify G. lucidum global metabolism, guide design of metabolic regulation strategies, and indicate useful research targets of “wet” experiments. Biosynthetic pathways of EPSs remain poorly known at this point because of our inadequate knowledge of related enzymes and their functions. Adequate knowledge will require gene cloning and genetic transformation studies (Wang et al., 2017).
We describe here reconstruction of the first GSMM of G. lucidum, model iZBM1060, and its application to elucidate detailed physiological characteristics and production of EPSs in this species. The nucleoside sugar biosynthetic pathway of model iZBM1060 was elucidated completely, the reactions of this pathway are summarized and illustrated, and related strategies for improving EPS production are proposed.
Materials and Methods
Reconstruction and Refinement of G. lucidum GSMM
The availability of the whole genome sequence of G. lucidum allowed us to perform GSMM reconstruction according to a three-step general workflow scheme described previously (Thiele and Palsson, 2010).
(i) Sequenced G. lucidum genome data were downloaded from the UniProt database (UniProt, 2010). Genes were functionally annotated by two methods: (a) Thresholds of the bidirectional BLAST for a functional sequence were set to have e-value < 1 × 10⁻³⁰, amino acid sequence identity > 40%, and matching length ≥ 70% of the query sequence (Liu et al., 2012). An original reactions list was produced by selecting GSMMs of Aspergillus niger iMA871(Andersen et al., 2008), Mortierella alpina iCY1106 (Ye et al., 2015), and Aspergillus terreus iJL1454 (Liu, et al., 2013) as template frameworks to map the assigned genes. (b) The KEGG Automatic Annotation Server (KAAS) (Moriya et al., 2007) was used for functional annotation of all amino acid query sequences.
(ii) A draft model was developed and used as a starting point for subsequent network refinements. Biochemical information was acquired from public databases [KEGG (Kanehisa et al., 2010), MetaCyc (Caspi et al., 2008), CELLO (Yu et al., 2004), and TCDB (Saier et al., 2006)], and manual revisions (deletion of error reactions, addition of organism-specific information, checking of mass-charge balance, filling of metabolic gaps) were conducted sequentially.
(iii) The COBRA Toolbox was used to simulate growth rate and product formation, and the model was validated by comparison of results with experimentally observed phenotypes (Figure 1).
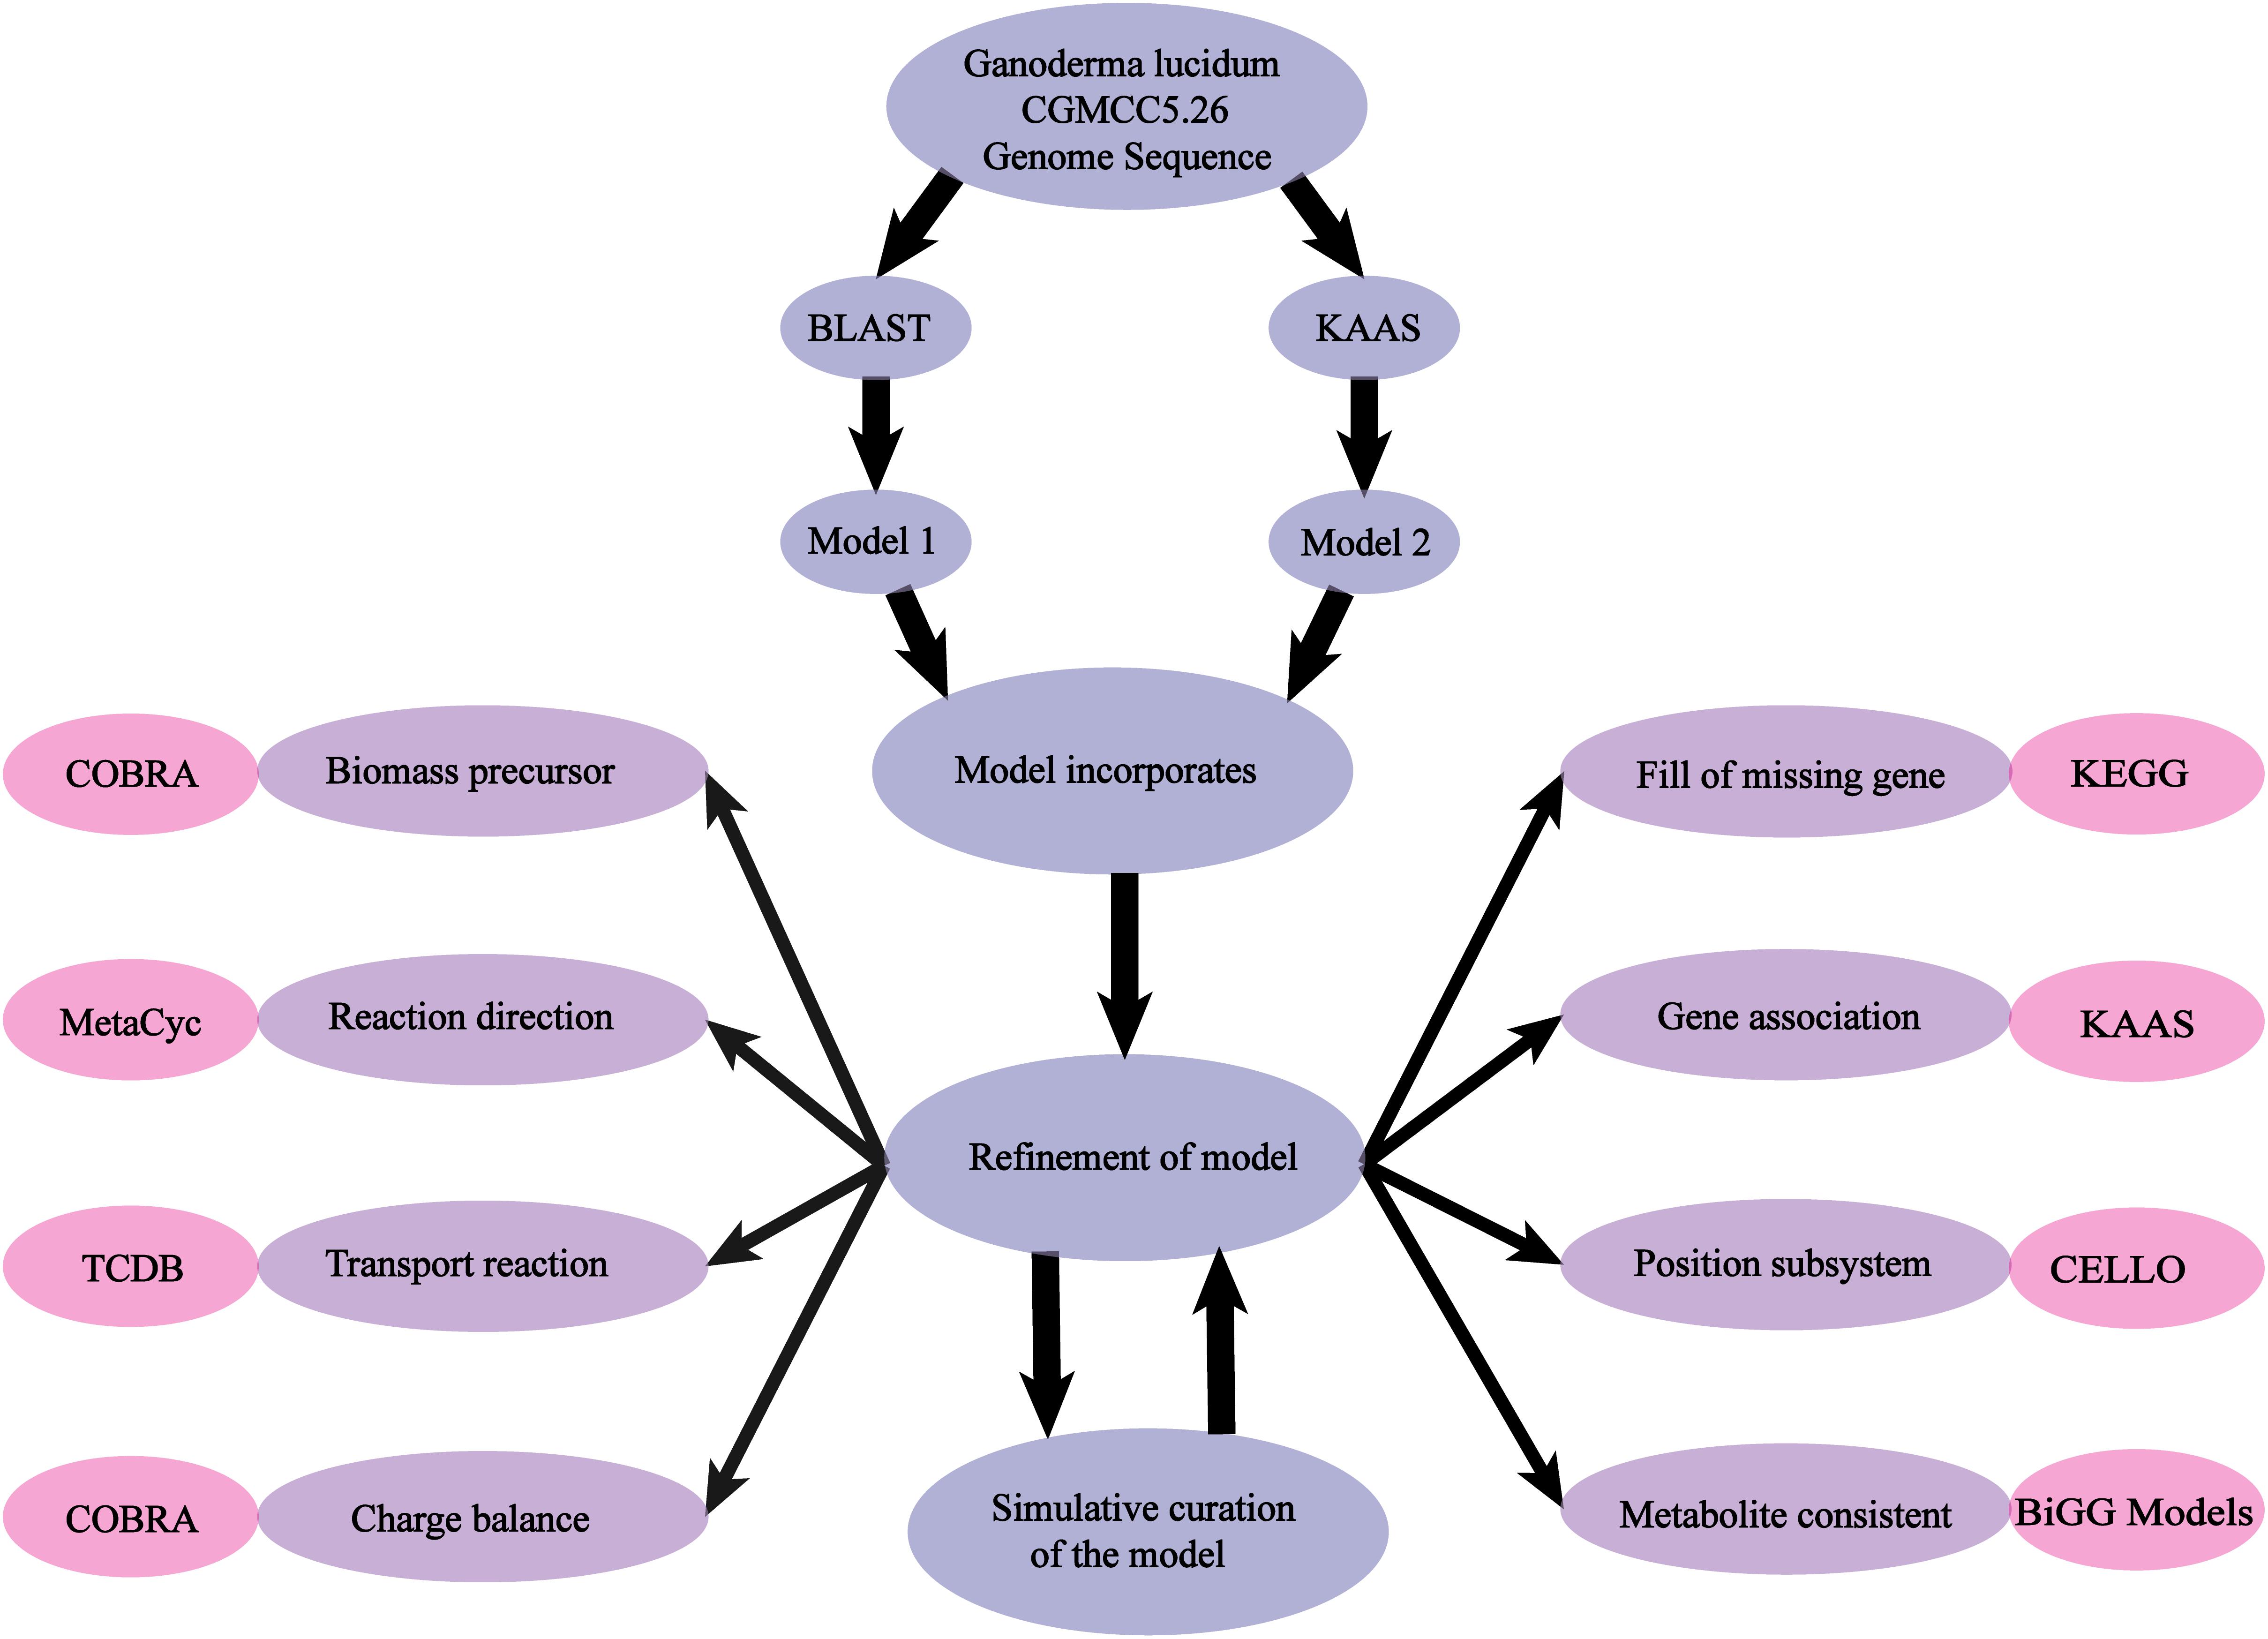
Figure 1. Scheme of model reconstruction process used in this study. Blue: basic process of model reconstruction. Purple: major aspects of refinement of the model. Pink: usage of Database and Toolbox to refine the process.
Biomass Composition and Determination of Target Equation
The biomass components of G. lucidum are proteins, DNA, RNA, lipids, glucan, chitin and small molecules. Detailed information on biomass composition is summarized in Supplementary Table S1. A metabolic model (Andersen et al., 2008) were used as reference to calculate ATP required for cell growth and RNA: DNA ratio. Nucleotide and amino acid compositions were calculated based on G. lucidum genome (Chen et al., 2012). Detailed compositions of individual macromolecules were derived from published reports on G. lucidum (Mau et al., 2001; Stojkovic et al., 2014). A target equation of EPS production was determined based on mole percentages of monosaccharides in EPSs (Peng et al., 2015).
G. lucidum Strain and Culture Conditions
Ganoderma lucidum CGMCC5.26 was obtained from the China General Microbiological Culture Collection Center (Beijing) and maintained on potato dextrose agar slants at 4°C. The seed and fermentation medium [glucose 20 g/L, yeast nitrogen base without amino acids (YNB) 5 g/L, tryptone 5 g/L, KH2PO4 4.5 g/L, MgSO4⋅7H2O 2 g/L, initial pH 6.0] was kept at 30°C on a rotary shaker (150 rpm). The minimal growth medium for functional tests was composed of carbon source 20 g/L, nitrogen source 10 g/L, KH2PO4 4.5 g/L, MgSO4⋅7 H2O 2 g/L, initial pH 6.0.
Determination of Biomass, Residual Sugar in Medium, and EPS
Mycelia were harvested by centrifugation (10,000 rpm) for 10 min. The precipitate was washed three times with distilled water, and dried at 60°C to constant weight. Dry weight (DW) was determined by gravimetric method. Amount of residual sugar in medium was determined by 3, 5-dinitrosalicylic acid (DNS) method (Dubois et al., 1956).
For determination of EPS, centrifugal fluid as above was precipitated with adding 4 times of 95% (v/v) ethanol and left 8 h at 4°C to precipitate crude polysaccharides. Precipitate was collected by centrifugation (8,000 rpm) for 20 min, washed three times with 80% (v/v) ethanol, and dried at 60°C to remove residual ethanol. Total EPS content was assayed by phenol-sulfuric acid method (Dubois et al., 1951).
Simulation, Curation, and Analysis of Model iZBM1060
To assess the ability of the reconstruction to accurately reflect metabolic processes of G. lucidum, we converted the reaction list to a standard SBML document that could be read by COBRA Toolbox (Schellenberger et al., 2011) and subjected to Flux balance analysis (FBA) (Lakshmanan et al., 2014). Flux ranges of reactions in the network were limited for simulations (Thiele and Palsson, 2010). Essential elements must be obtained from the environment through the exchange reaction (Wang et al., 2016). For growth simulation, the biomass equation in minimal medium (no amino acids) was set as the objective function. A complex fermentation medium (basic elements and 20 amino acids) was simulated for EPS production, and maximal uptake rate for each amino acid was set to 0.01 mmol/gDW/h (Ye et al., 2015). Essential genes were assessed by setting fluxes of reactions to zero, and simulating optimal growth rate with FBA. The criterion for an essential gene was that its deletion results in zero growth.
For identification of target genes, MOMA (Segre et al., 2002) framework was used for better prediction of flux distribution. The overexpression algorithm involved five steps (Boghigian et al., 2012): (i) EPS production flux was imposed on the reconstructed model. (ii) Flux for each reaction was calculated based on the fermentation medium. (iii) Amplification of flux was imposed on individual reactions with non-zero flux, to simulate the effect of gene overexpression. (iv) MOMA was performed to overcome the problem of overexpression. (v) An overexpressed target having higher EPS production and fPH value > 1 was identified (Equation 1), fPH being the product of the specific biomass overexpression and specific EPS overexpression rates.
Results and Discussion
Reconstruction and Characteristics of Model iZBM1060
The GSMM reconstruction was completed by automatic annotation and manual refinement, and a reaction list was obtained through KAAS and BLASTP. The final reconstructed GSMM of G. lucidum, termed model iZBM1060, contained 1060 genes, 1202 metabolites, and 1404 reactions (Supplementary Table S2). The 1404 reactions in model iZBM1060 were classified into 10 subsystems, according to the KEGG Pathway Database (Figure 2A). The largest subsystem (accounting for 21.97% of the 1404 reactions) was lipid metabolism (fatty acid biosynthesis; fatty acid degradation; glycerolipid, glycerophospholipid, sphingolipid, and steroid metabolism), followed by amino acid metabolism and carbohydrate metabolism. These three subsystems, combined, accounted for >50% of the 1404 reactions. There were a total of 1047 gene-associated reactions. In eight of the 10 subsystems, >80% of the reactions were associated with genes (the exceptions were lipid metabolism and transport reactions; Figure 2B).
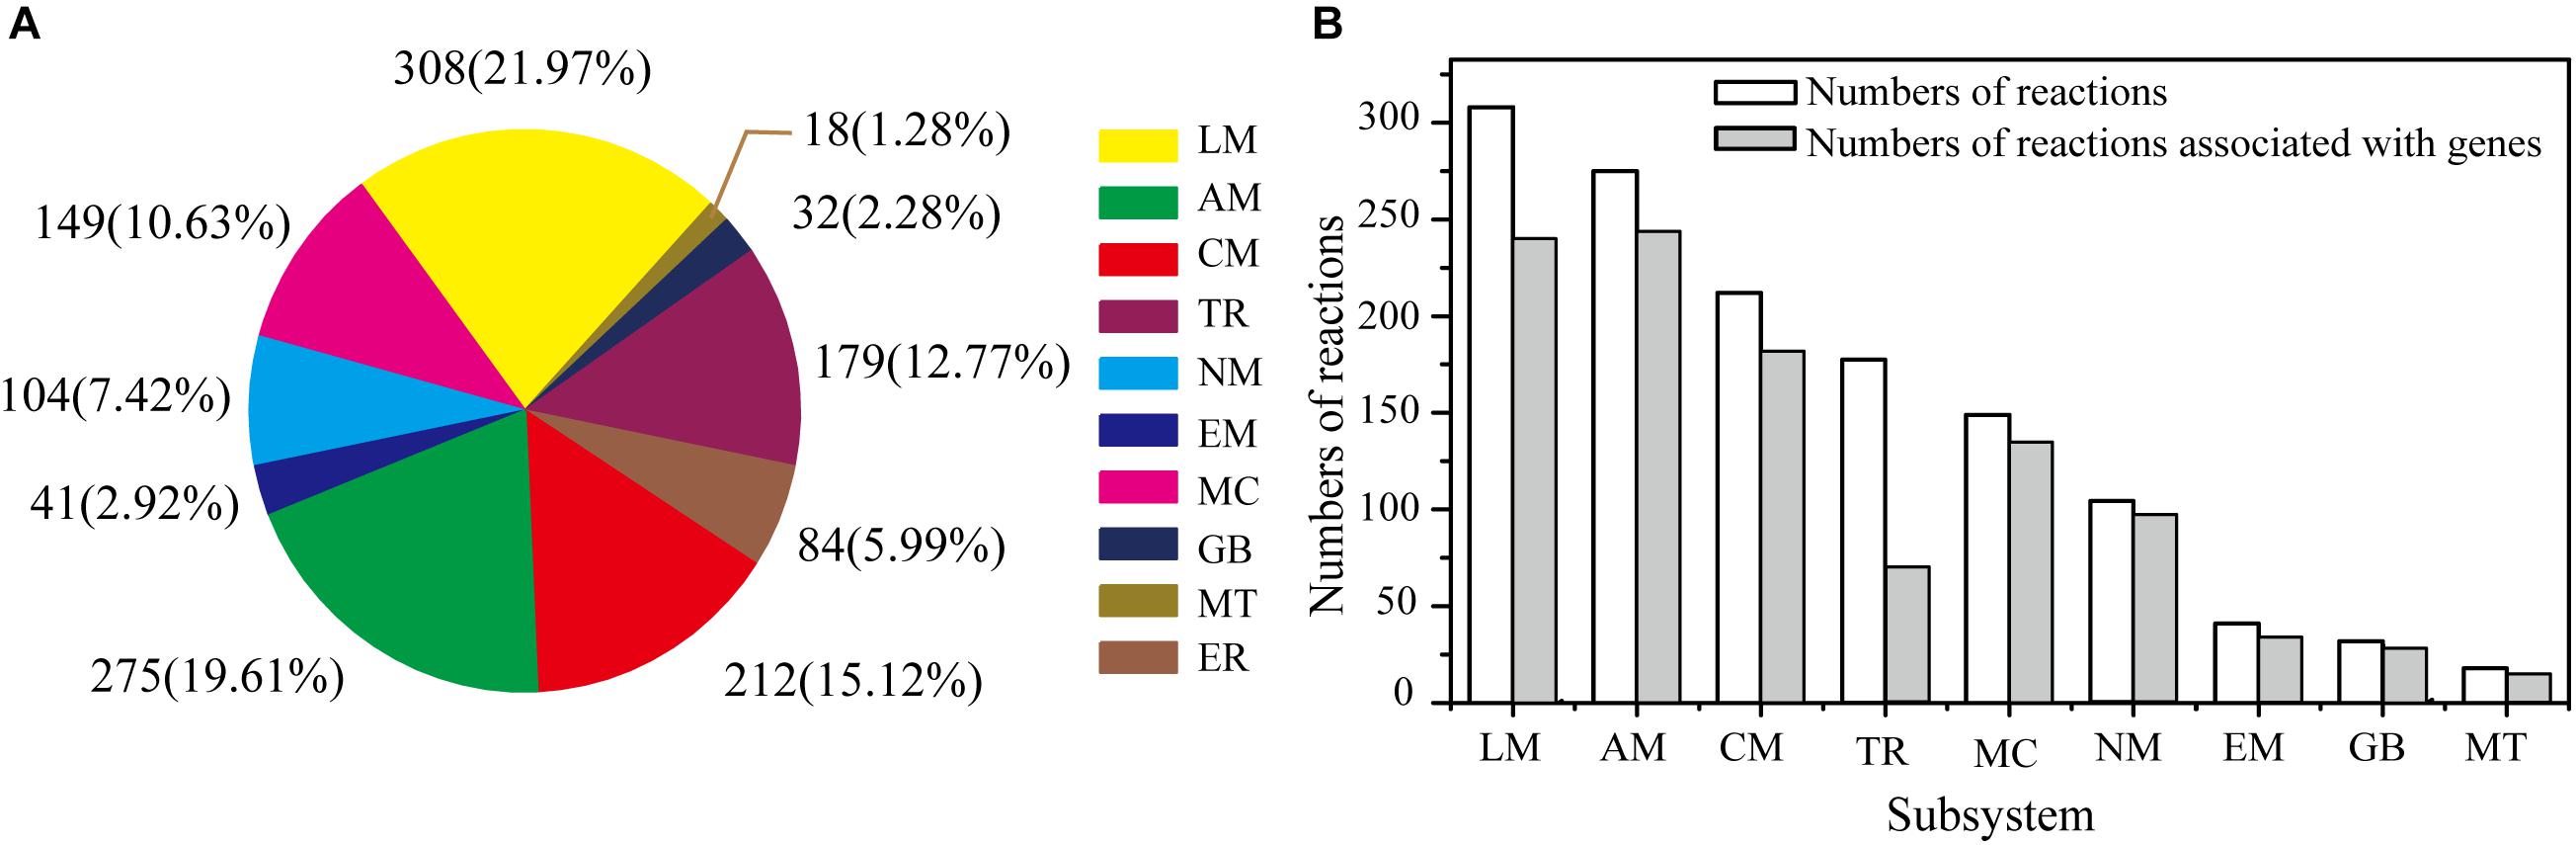
Figure 2. Properties of model iZBM1060. (A) Numbers of reactions in each subsystem, and corresponding percentages of total reactions. (B) Numbers of reactions associated with genes in each subsystem. LM, lipid metabolism; AM, amino acid metabolism; CM, carbohydrate metabolism; TR, transport reactions; MC, metabolism of cofactors and vitamins; NM, nucleotide metabolism; EM, energy metabolism; GB, glycan biosynthesis and metabolism; MT, metabolism of terpenoids and polyketides; ER, exchange reactions.
Growth Verification and Simulation in Model iZBM1060
Qualitative Verification and Analysis of Growth Phenotypes
The central metabolic pathway of G. lucidum carbon sources is shown schematically in Figure 3. Glucose, galactose, mannose, and fructose produce a corresponding phosphate monosaccharide through action of a kinase, and the monosaccharide then passes directly into the tricarboxylic acid (TCA) cycle, glyoxylate cycle, and pentose phosphate pathway (PPP). Xylose and arabinose are first phosphorylated by oxidation-reduction reaction, and then fructose-6-phosphate (fructose-6-P) is synthesized. In rhamnose and fucose metabolism, pyruvate and glycerone phosphate (respectively) are synthesized firstly.
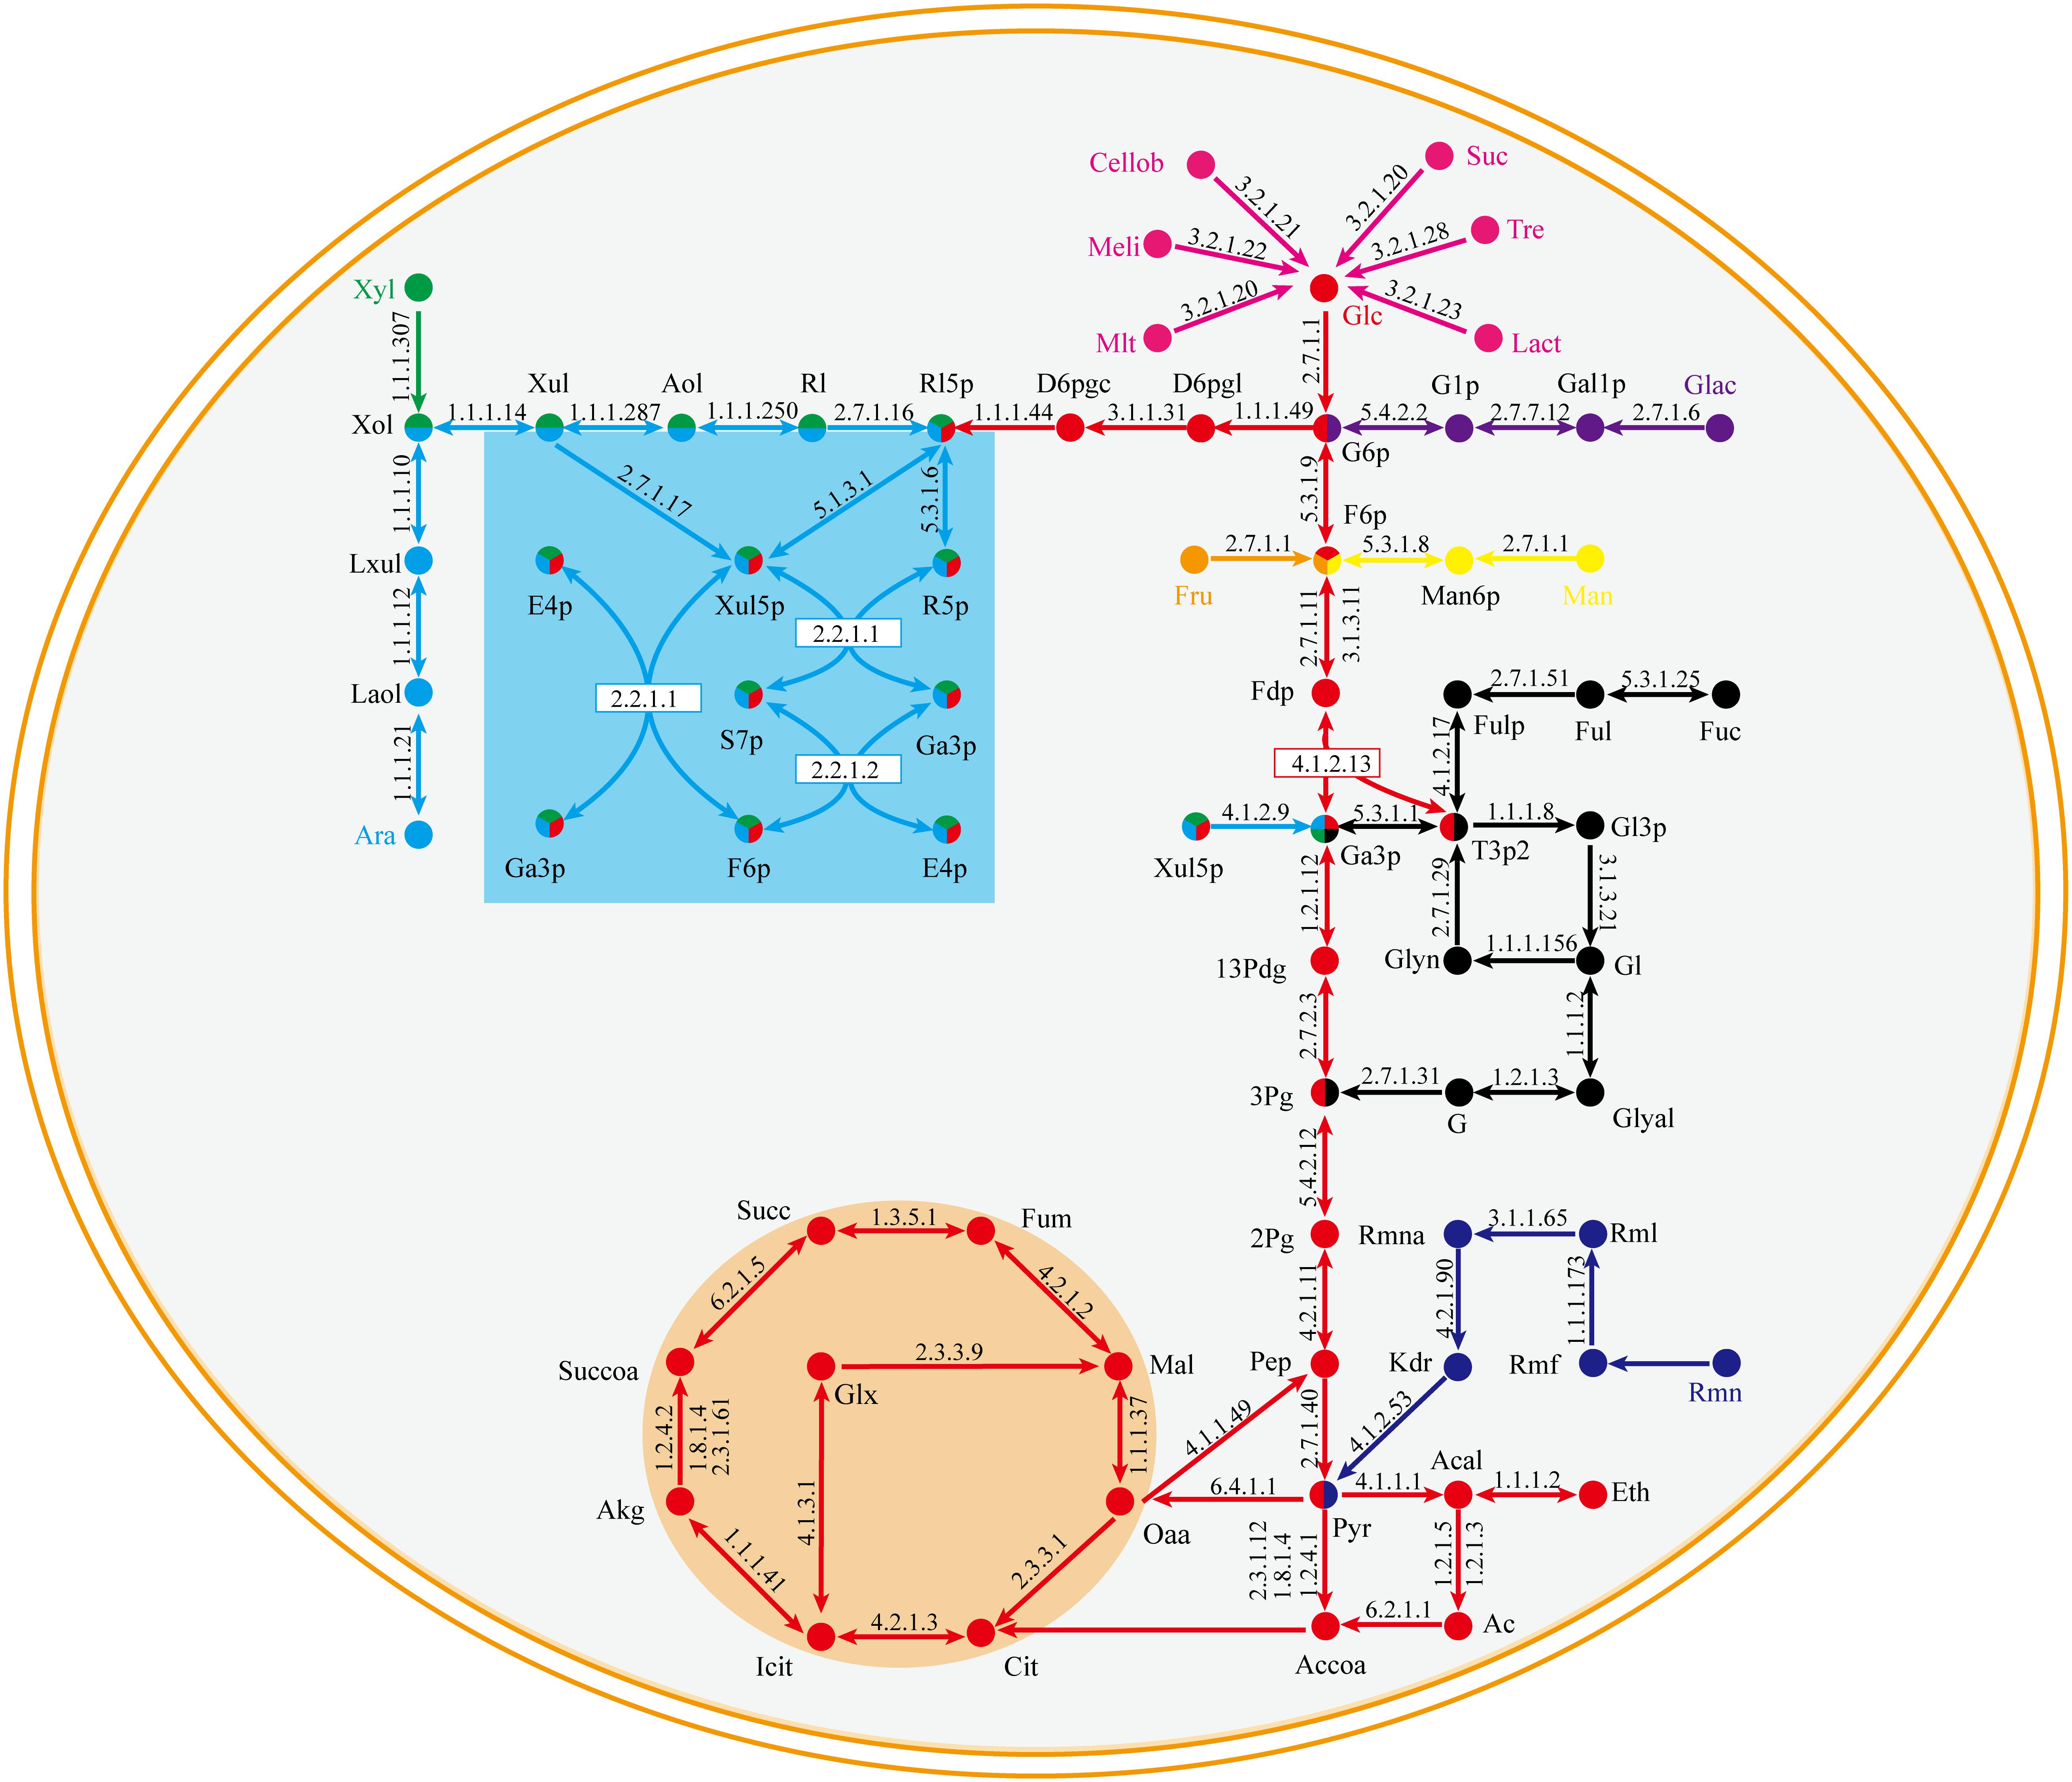
Figure 3. Central metabolic pathway of representative carbon sources in model iZBM1060 (detailed information on enzyme information and reactions are presented in Supplementary Table S3).
The capability of G. lucidum to utilize 18 different carbon sources (13 saccharides, 3 alcohols, 2 carboxylic acids) for cell growth was predicted qualitatively by FBA. Each of the carbon sources was used as sole carbon source in minimal growth medium. Results were compared to experimental data, and the growth phenotype matching rate was 94.4%(Table 1). G. lucidum is able to utilize not only glucose, galactose, mannose, arabinose, xylose, rhamnose, fucose, and other monosaccharides, but also sucrose, maltose, lactose, and other disaccharides. FBA also predicted the capability to utilize various nitrogen sources (nitrate, urea, 20 amino acids) for cell growth. When results were compared to experimental data, the matching rate was 95.5% (Table 2).
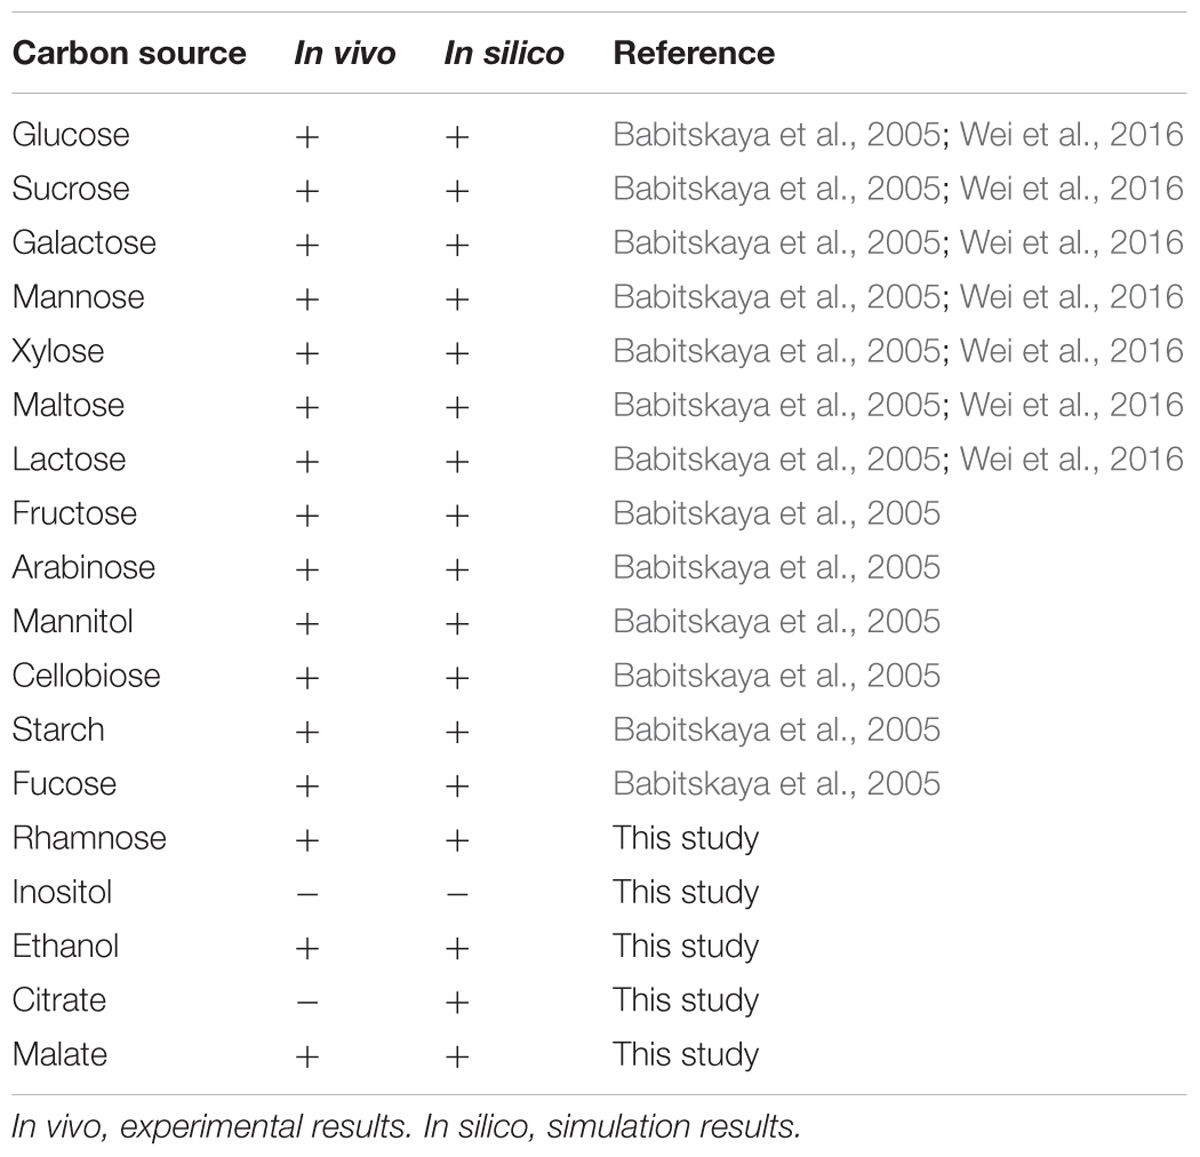
Table 1. Growth phenotypic validation under a sole carbon source.
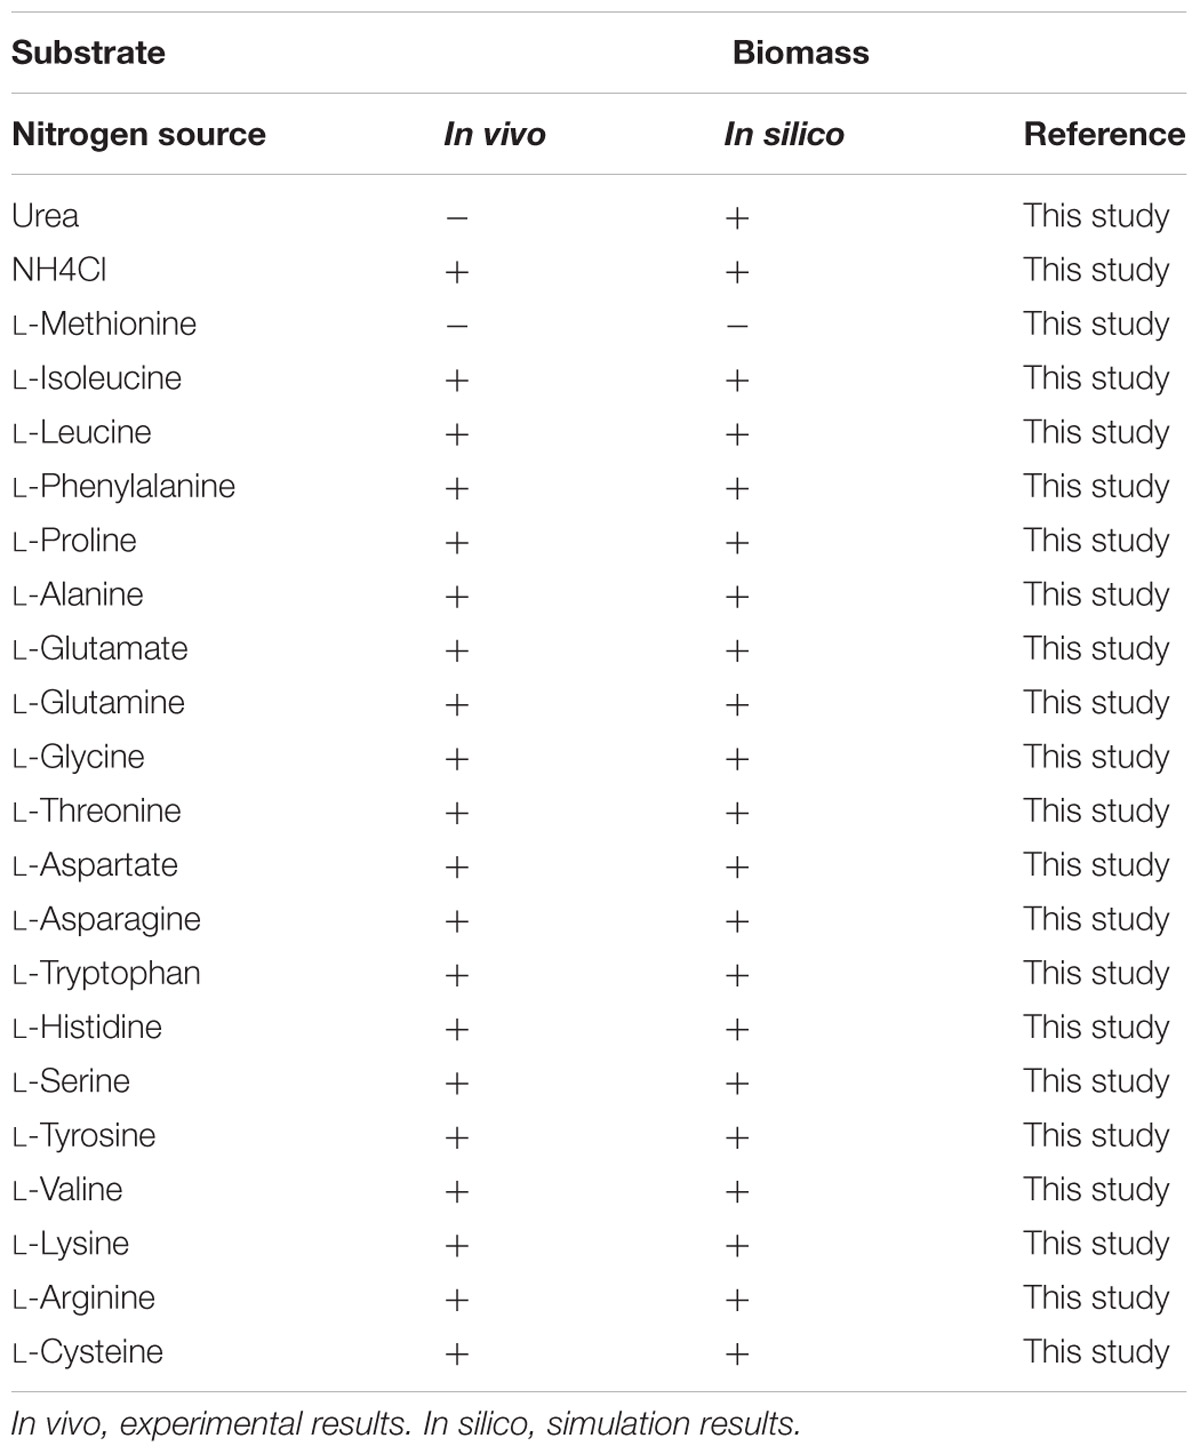
Table 2. Growth phenotypic validation under a sole nitrogen source.
Ganoderma lucidum grew successfully on 17 of the 18 carbon sources and 20 of the 22 nitrogen sources as above, indicating its broad substrate adaptability. There were no “fatal gaps” in model iZBM1060, and it can therefore be used for predicting catabolic pathways of various carbon and nitrogen sources. Two of the apparently non-conforming sources (citrate and urea) can be attributed to unclear transport pathways and the absence of regulatory mechanisms in this stoichiometric model.
On the basis of carbon source metabolic pathways and the experimental results, we selected seven monosaccharides as single carbon sources for evaluation of effects of various carbon sources on biomass and EPS production (Supplementary Figure S1 and Figure 4A). The consistency of results further supports the validity of the model.
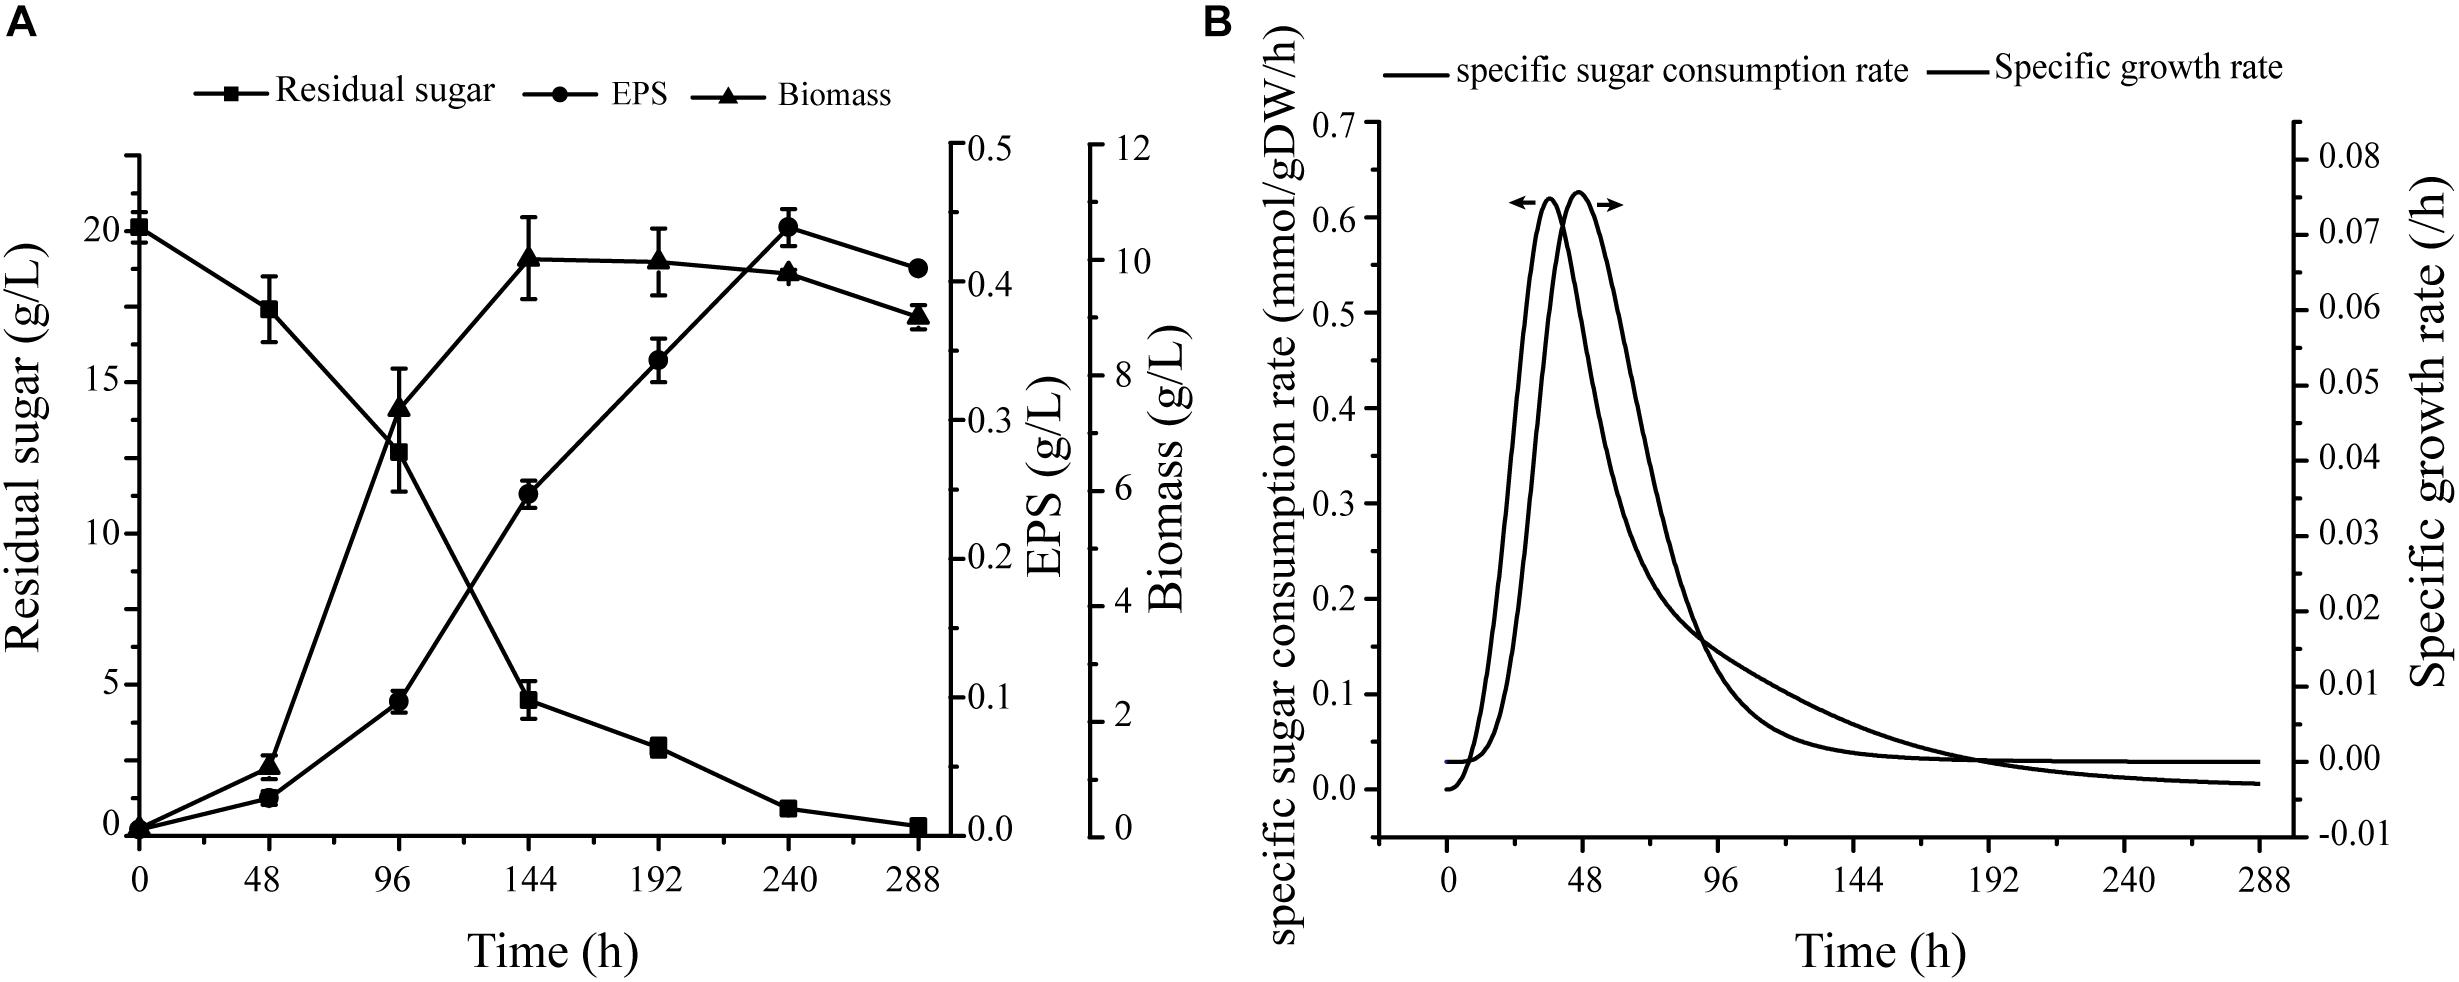
Figure 4. Verification of specific growth rates in cells. (A) Under conditions of fermentation medium, cell growth, EPS production, and sugar consumption curve. (B) Nonlinear curve fit of growth curve and sugar consumption curve.
Quantitative Verification
Fermentation data were used as constraints for simulation of cell growth, including specific growth rate and glucose uptake rate. Maximal specific growth rate was 0.076 h−1, and corresponding sugar consumption rate was 0.506 mmol/gDW/h (Figure 4B). For simulation of cell growth in various media, the biomass equation was maximized in flux analysis. For glucose medium without production constraints, predicted cell growth rate was 0.077 h−1 – only 1.3% higher than experimental growth rate (0.076 h−1).
Identification and Analysis of Essential Genes for Cell Growth
Consistency of growth rate in silico and in vivo indicated that model iZBM1060 successfully reflected G. lucidum cellular metabolism. Essential genes for cell growth were predicted by single-gene deletion in COBRA Toolbox (MATLAB package) with two media (minimal growth medium, fermentation medium). Hundred and nineteen genes (11.23% of 1060 total genes) were predicted to be essential in minimal growth medium, and 88 genes (8.30% of total) were predicted to be essential in fermentation medium (Figure 5A). On minimal growth medium, >50% of the essential genes for growth were involved in either amino acid (32.77%) or carbohydrate metabolism (19.33%) (Figure 5B). In contrast, on fermentation medium, >90% of essential genes for growth were classified in 5 subsystems (amino acid metabolism, metabolism of cofactors and vitamins, nucleotide metabolism, carbohydrate metabolism, lipid metabolism) (Figure 5C), reflecting the important roles of these subsystems in cell growth (essential genes and simulation conditions are listed in Supplementary Table S4).
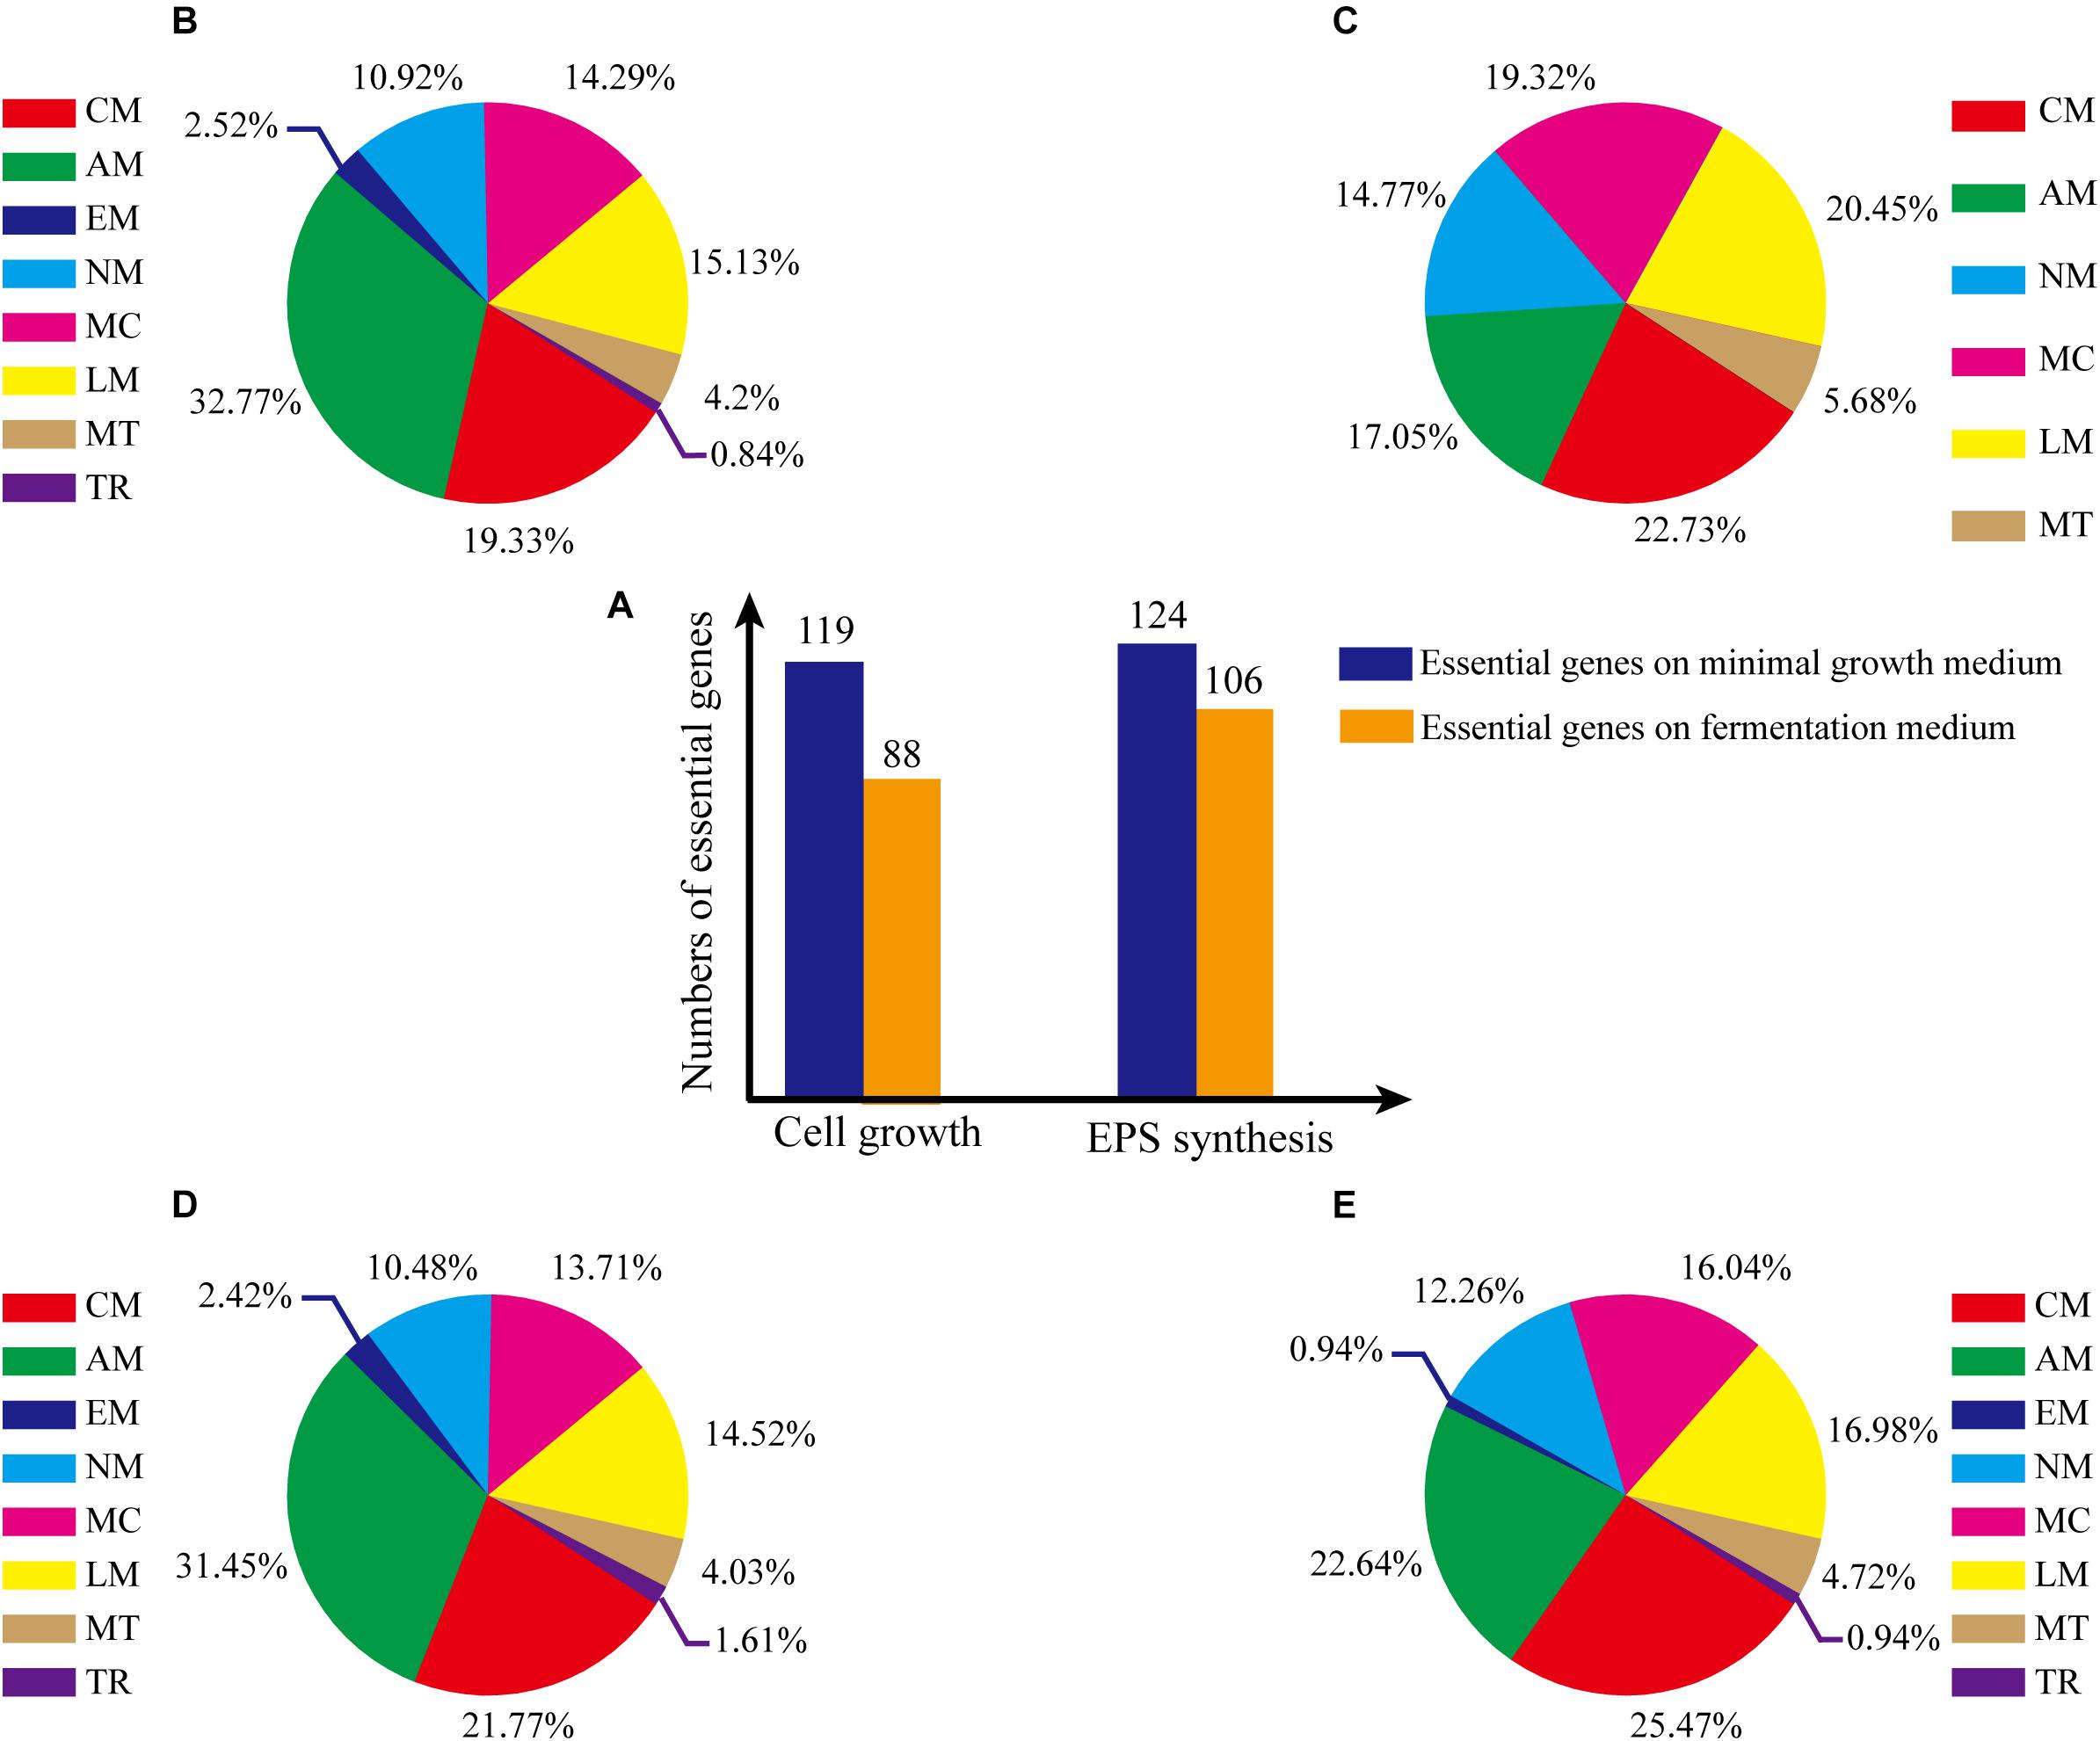
Figure 5. Percentages of essential genes in each subsystem under various culture conditions. (A) Numbers of essential genes under various conditions. (B) Essential genes for cell growth, on minimal growth medium. (C) Essential genes for cell growth, on fermentation medium. (D) Essential genes for EPS production, on minimal growth medium. (E) Essential genes for EPS production, on fermentation medium. The abbreviations of each subsystem are the same with that in Figure 2.
Nucleoside Sugar Biosynthetic Pathway in G. lucidum
Construction of Nucleoside Sugar Biosynthetic Pathway
The biosynthetic pathway of EPSs can be divided into three stages: (i) biosynthesis of nucleoside sugar precursors; (ii) assembly of repeating units; (iii) process of polymerization (Li et al., 2016). The monosaccharide composition of all EPSs includes glucose, galactose mannose, xylose, arabinose, fucose, and rhamnose. Typically, the proportion of glucose is high whereas that of fucose and rhamnose is low (Peng et al., 2015; Wang et al., 2017). Monosaccharide heterogeneity is reflected in the complexity of EPS biosynthetic pathways.
Biosynthetic pathways of EPSs are poorly known because of our inadequate knowledge of related enzymes and their functions. On the basis of model iZBM1060, we hereby propose a detailed nucleoside sugar biosynthetic pathway. Glucose, galactose, fucose, mannose, and arabinose reactions are catalyzed by monosaccharide kinase to produce corresponding phosphate monosaccharides, and UDP-glucose, UDP-galactose, GDP-mannose, and UDP-arabinose are then synthesized through action of pyrophosphorylase. E.g., hexokinase (GL26783-R1, GL20491-R1, and GL20491-R2) and mannose phosphomutase (GL20742-R1 and GL21817-R1) participate respectively in synthesis of mannose-6-P and mannose-1-P. GDP-mannose is then synthesized by action of GDP-mannose pyrophosphorylase (GL25424-R1).
Xylose enters the PPP to synthesize fructose-6-P, and then a nucleoside precursor. Fucose and rhamnose can also synthesize fructose-6-P via the gluconeogenesis pathway. Fructose-6-P has two pathways for synthesis of nucleoside sugar: (i) glucose-6-P isomerase (GL22245-R1) catalyzes conversion of fructose-6-P to glucose-6-P; (ii) fructose-6-P is converted to mannose-6-P by mannose-6-P isomerase (GL17878-R1 and GL22193-R1) and further synthesizes GDP-mannose and GDP-fucose (Figure 6).
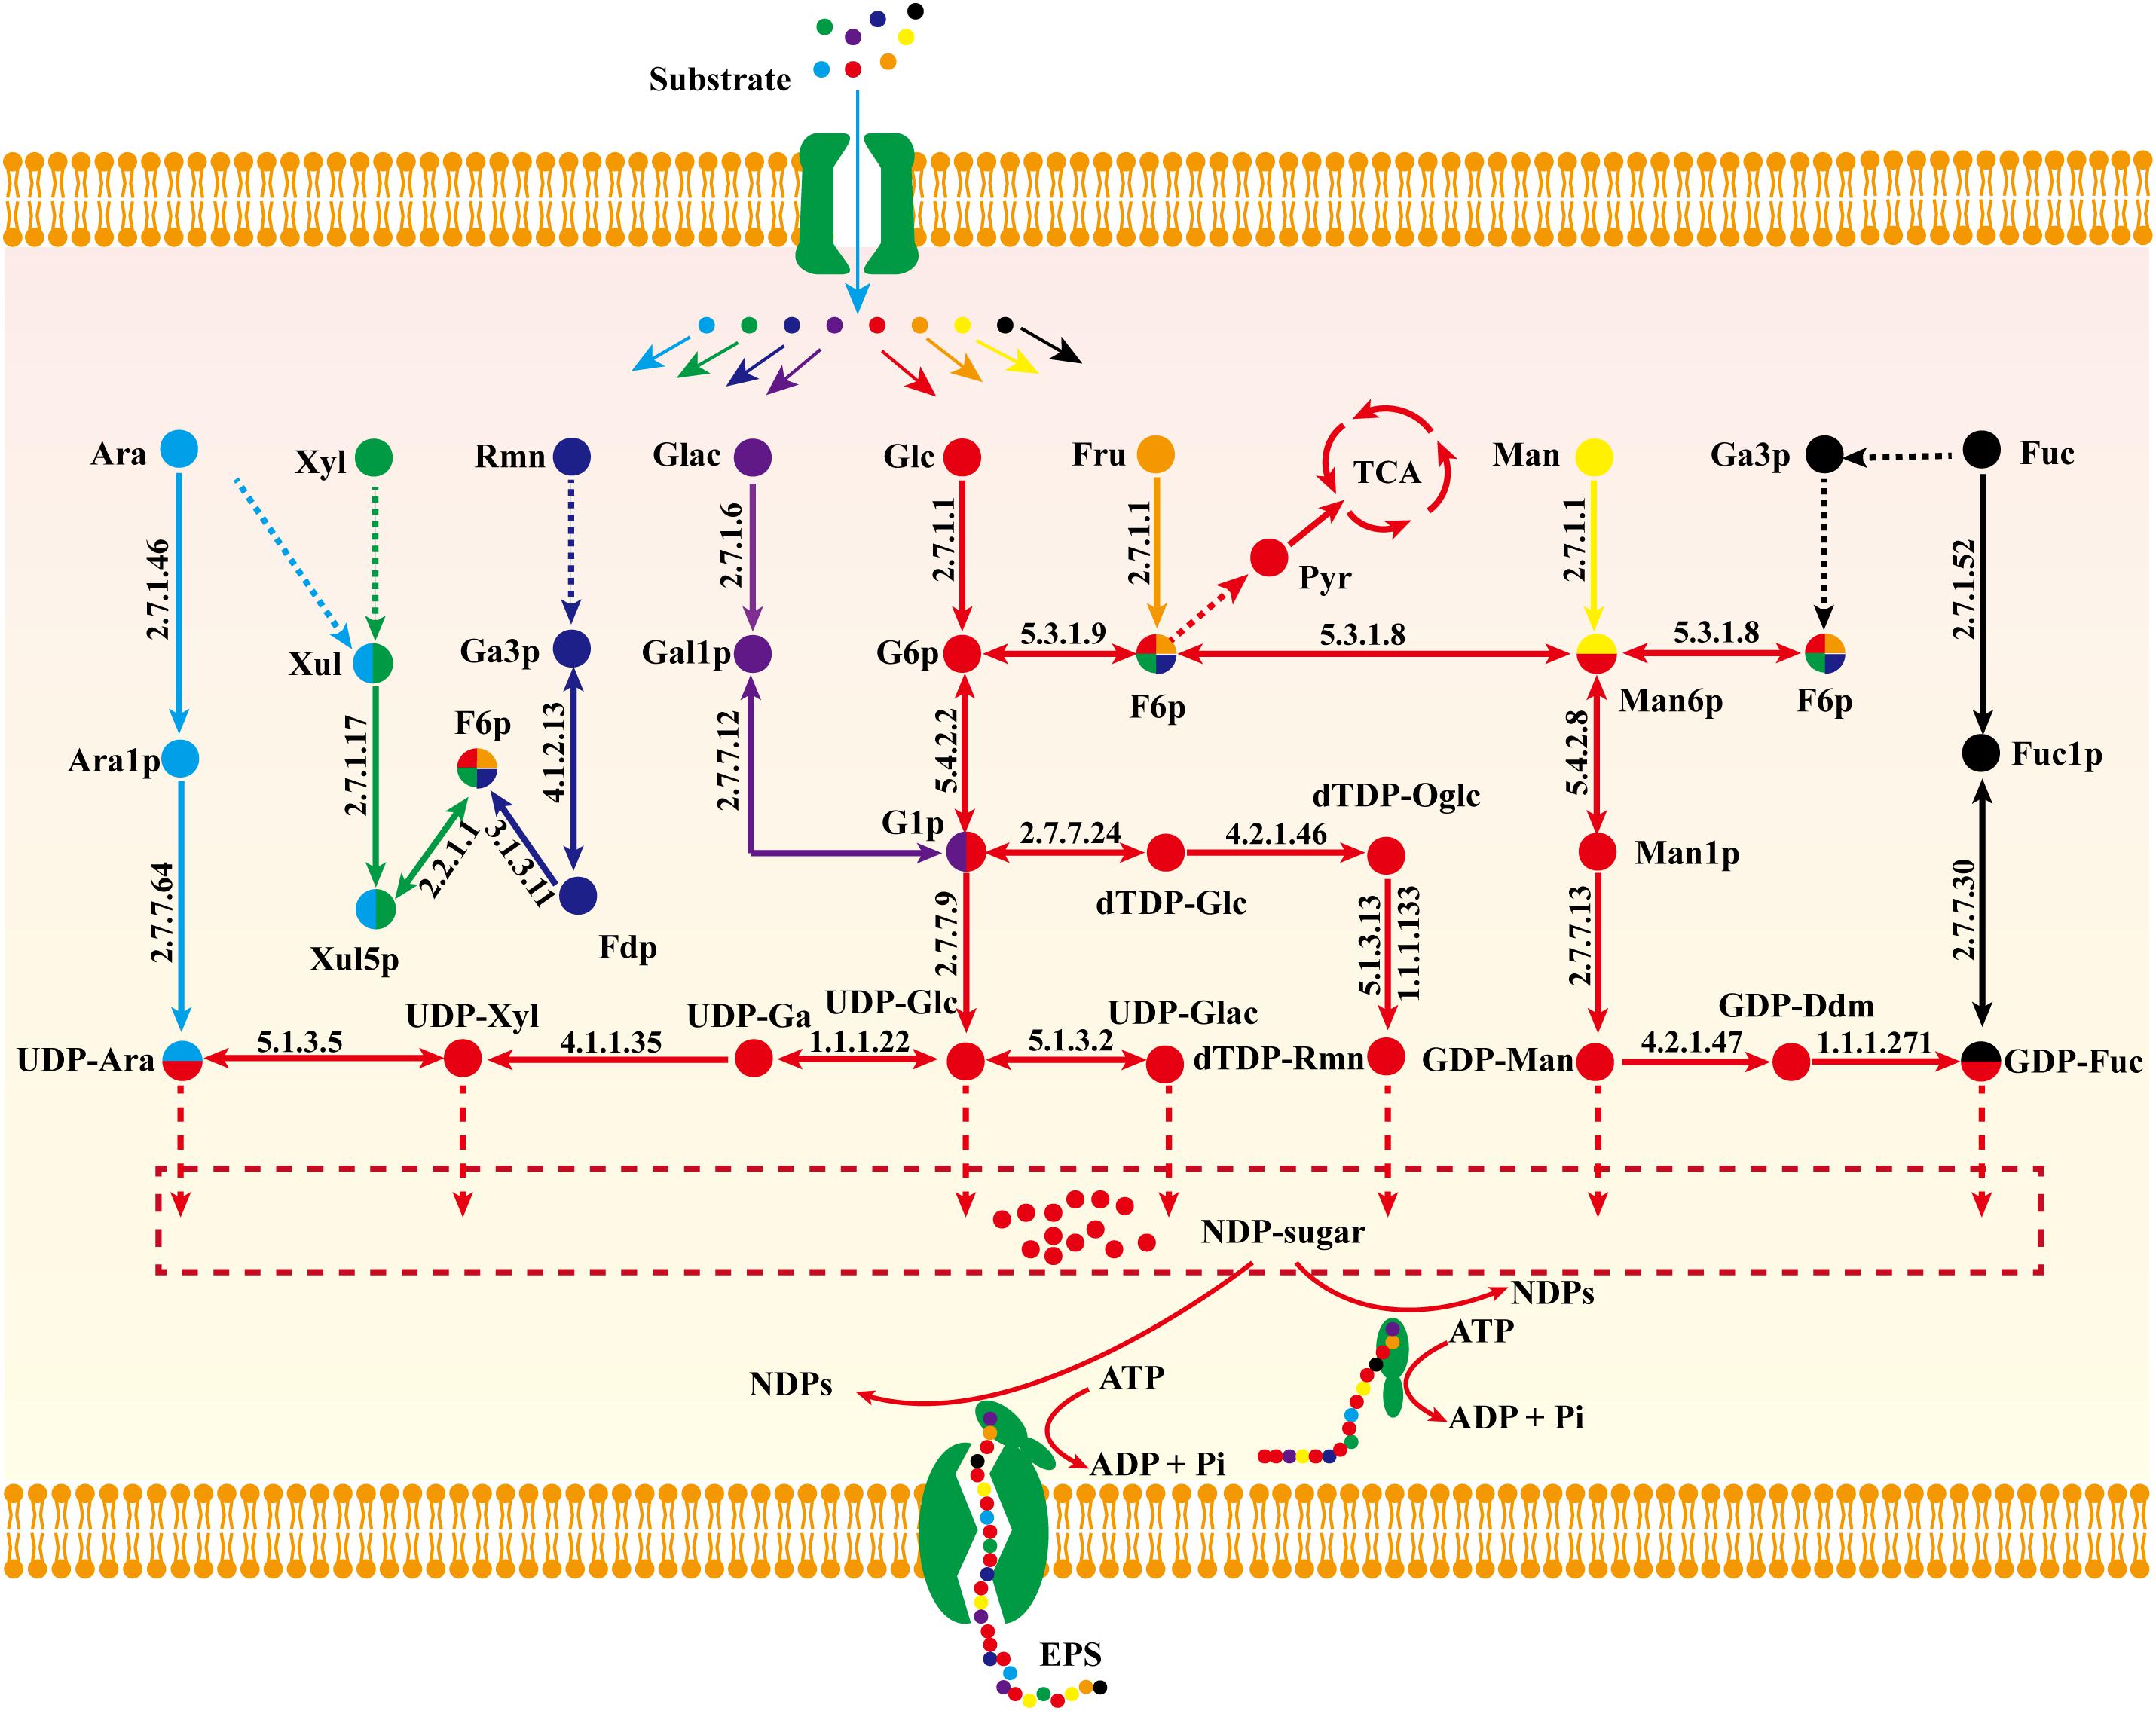
Figure 6. Proposed nucleoside sugar biosynthetic pathway of G. lucidum based on model iZBM1060 (detailed information on enzyme information and reactions are presented in Supplementary Table S3).
Glucose, galactose, mannose, fucose, and arabinose are able to synthesize nucleoside sugars via short metabolic pathways. In contrast, xylose, fructose, and rhamnose cannot directly enter the nucleoside sugar biosynthetic pathway, and are therefore less ideal carbon sources. This concept is supported by our “wet” experimental results (Supplementary Figure S1 and Figure 4A).
The proposed nucleoside sugar biosynthetic pathway involves 20 genes, 17 enzymes, and glucose as carbon source. Peng et al. (2015) observed activity of related enzymes in a biosynthetic pathway, indicating the accuracy of our reconstructed pathway (Table 3).
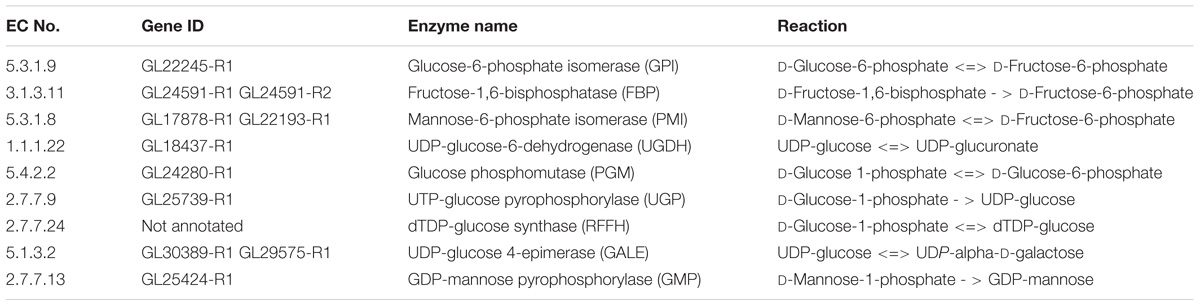
Table 3. The reported enzymes of G. lucidum EPS biosynthetic pathway (Peng et al., 2015).
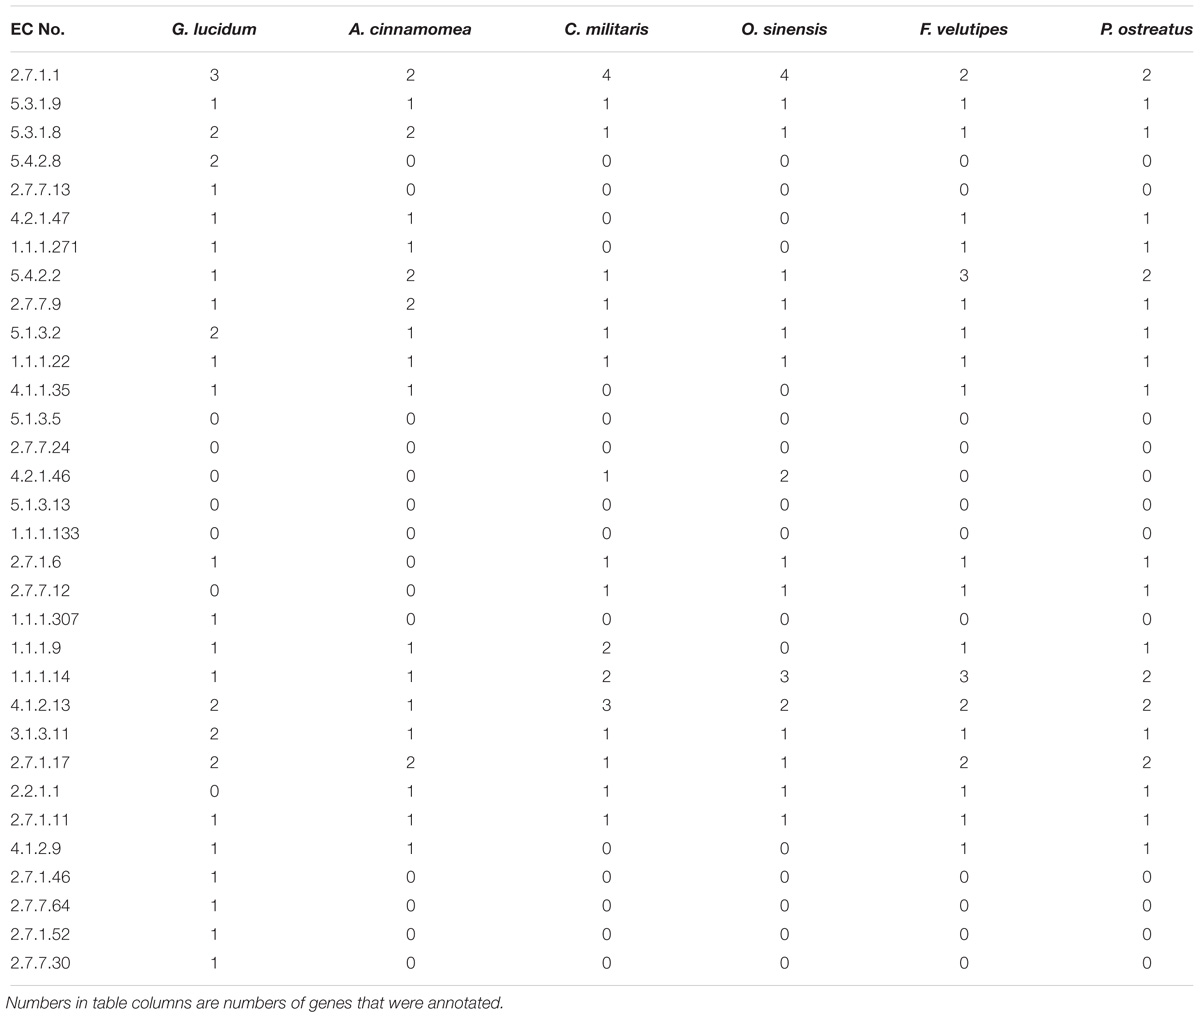
Table 4. Key enzymes of EPS biosynthesis in six well-studied mushroom species.
Identification and Analysis of Essential Genes for EPS Synthesis
Essential genes for EPS synthesis were predicted by single-gene deletion using COBRA Toolbox in two media. Prior to such prediction, biomass function must be constrained to ensure normal growth of cells. For minimal growth medium and fermentation medium, 124 genes (11.70% of total) and 106 genes (10.00%), respectively, were identified as essential for EPS synthesis (Figure 5A; essential genes and simulation conditions are listed in Supplementary Table S4).
For minimal growth medium, predicted essential genes for EPS synthesis were involved primarily in amino acid metabolism (31.45%) and carbohydrate metabolism (21.77%) (Figure 5D). For fermentation medium, predicted essential genes were involved in amino acid metabolism (22.64%), metabolism of cofactors and vitamins (16.04%), lipid metabolism (16.98%, and carbohydrate metabolism (25.47%) (total ∼80%; Figure 5E). These findings indicate that more carbon metabolism pathways are needed for EPS synthesis on minimal growth medium than on fermentation medium.
Comparative Genomics Analysis of Nucleoside Sugar Biosynthetic Pathway
To further elucidate EPS metabolic mechanisms and pathways, we performed comparative genomics analysis of G. lucidum EPSs and other important fungi.
Genomes of five related edible/ medicinal mushroom species (Antrodia cinnamomea (Riley et al., 2014), Cordyceps militaris (Zheng et al., 2011), Ophiocordyceps sinensis (Hu et al., 2013), Flammulina velutipes (Park et al., 2014), Pleurotus ostreatus (Riley et al., 2014) were annotated by KAAS. Metabolic enzymes related to EPS biosynthesis in these other species were compared with those in G. lucidum to clarify the characteristics of EPS biosynthesis. A total of 32 key enzymes were annotated. Numbers of key enzymes annotated were 25 for G. lucidum, 18 for A. cinnamomea, 17 for C. militaris, 16 for O. sinensis, 20 for F. velutipes, and 20 for P. ostreatus (Table 4). G. lucidum and the other five species had comprehensive gene annotations in the glycolysis pathway. All six species displayed gene deletion in the dTDP-rhamnose biosynthetic pathway. For example, dTDP-glucose synthase participated in synthesis of dTDP-glucose, and dTDP-4-dehydro-6-deoxy- D-glucose 3,5-epimerase and dTDP-4-dehydrorhamnose reductase participated in synthesis of dTDP-rhamnose. UDP-arabinose 4-epimerase, which catalyzed conversion of UDP-xylose to UDP-arabinose, was absent.
The above findings, taken together, indicate that the metabolic network of G. lucidum is more complex than other fungi, and allows synthesis of a greater variety of fungal nucleoside sugar precursors.
Optimization Strategies for Improving EPS Production in silico
On the basis of our model analysis, we propose two feasible optimization strategies for improvement of EPS production.
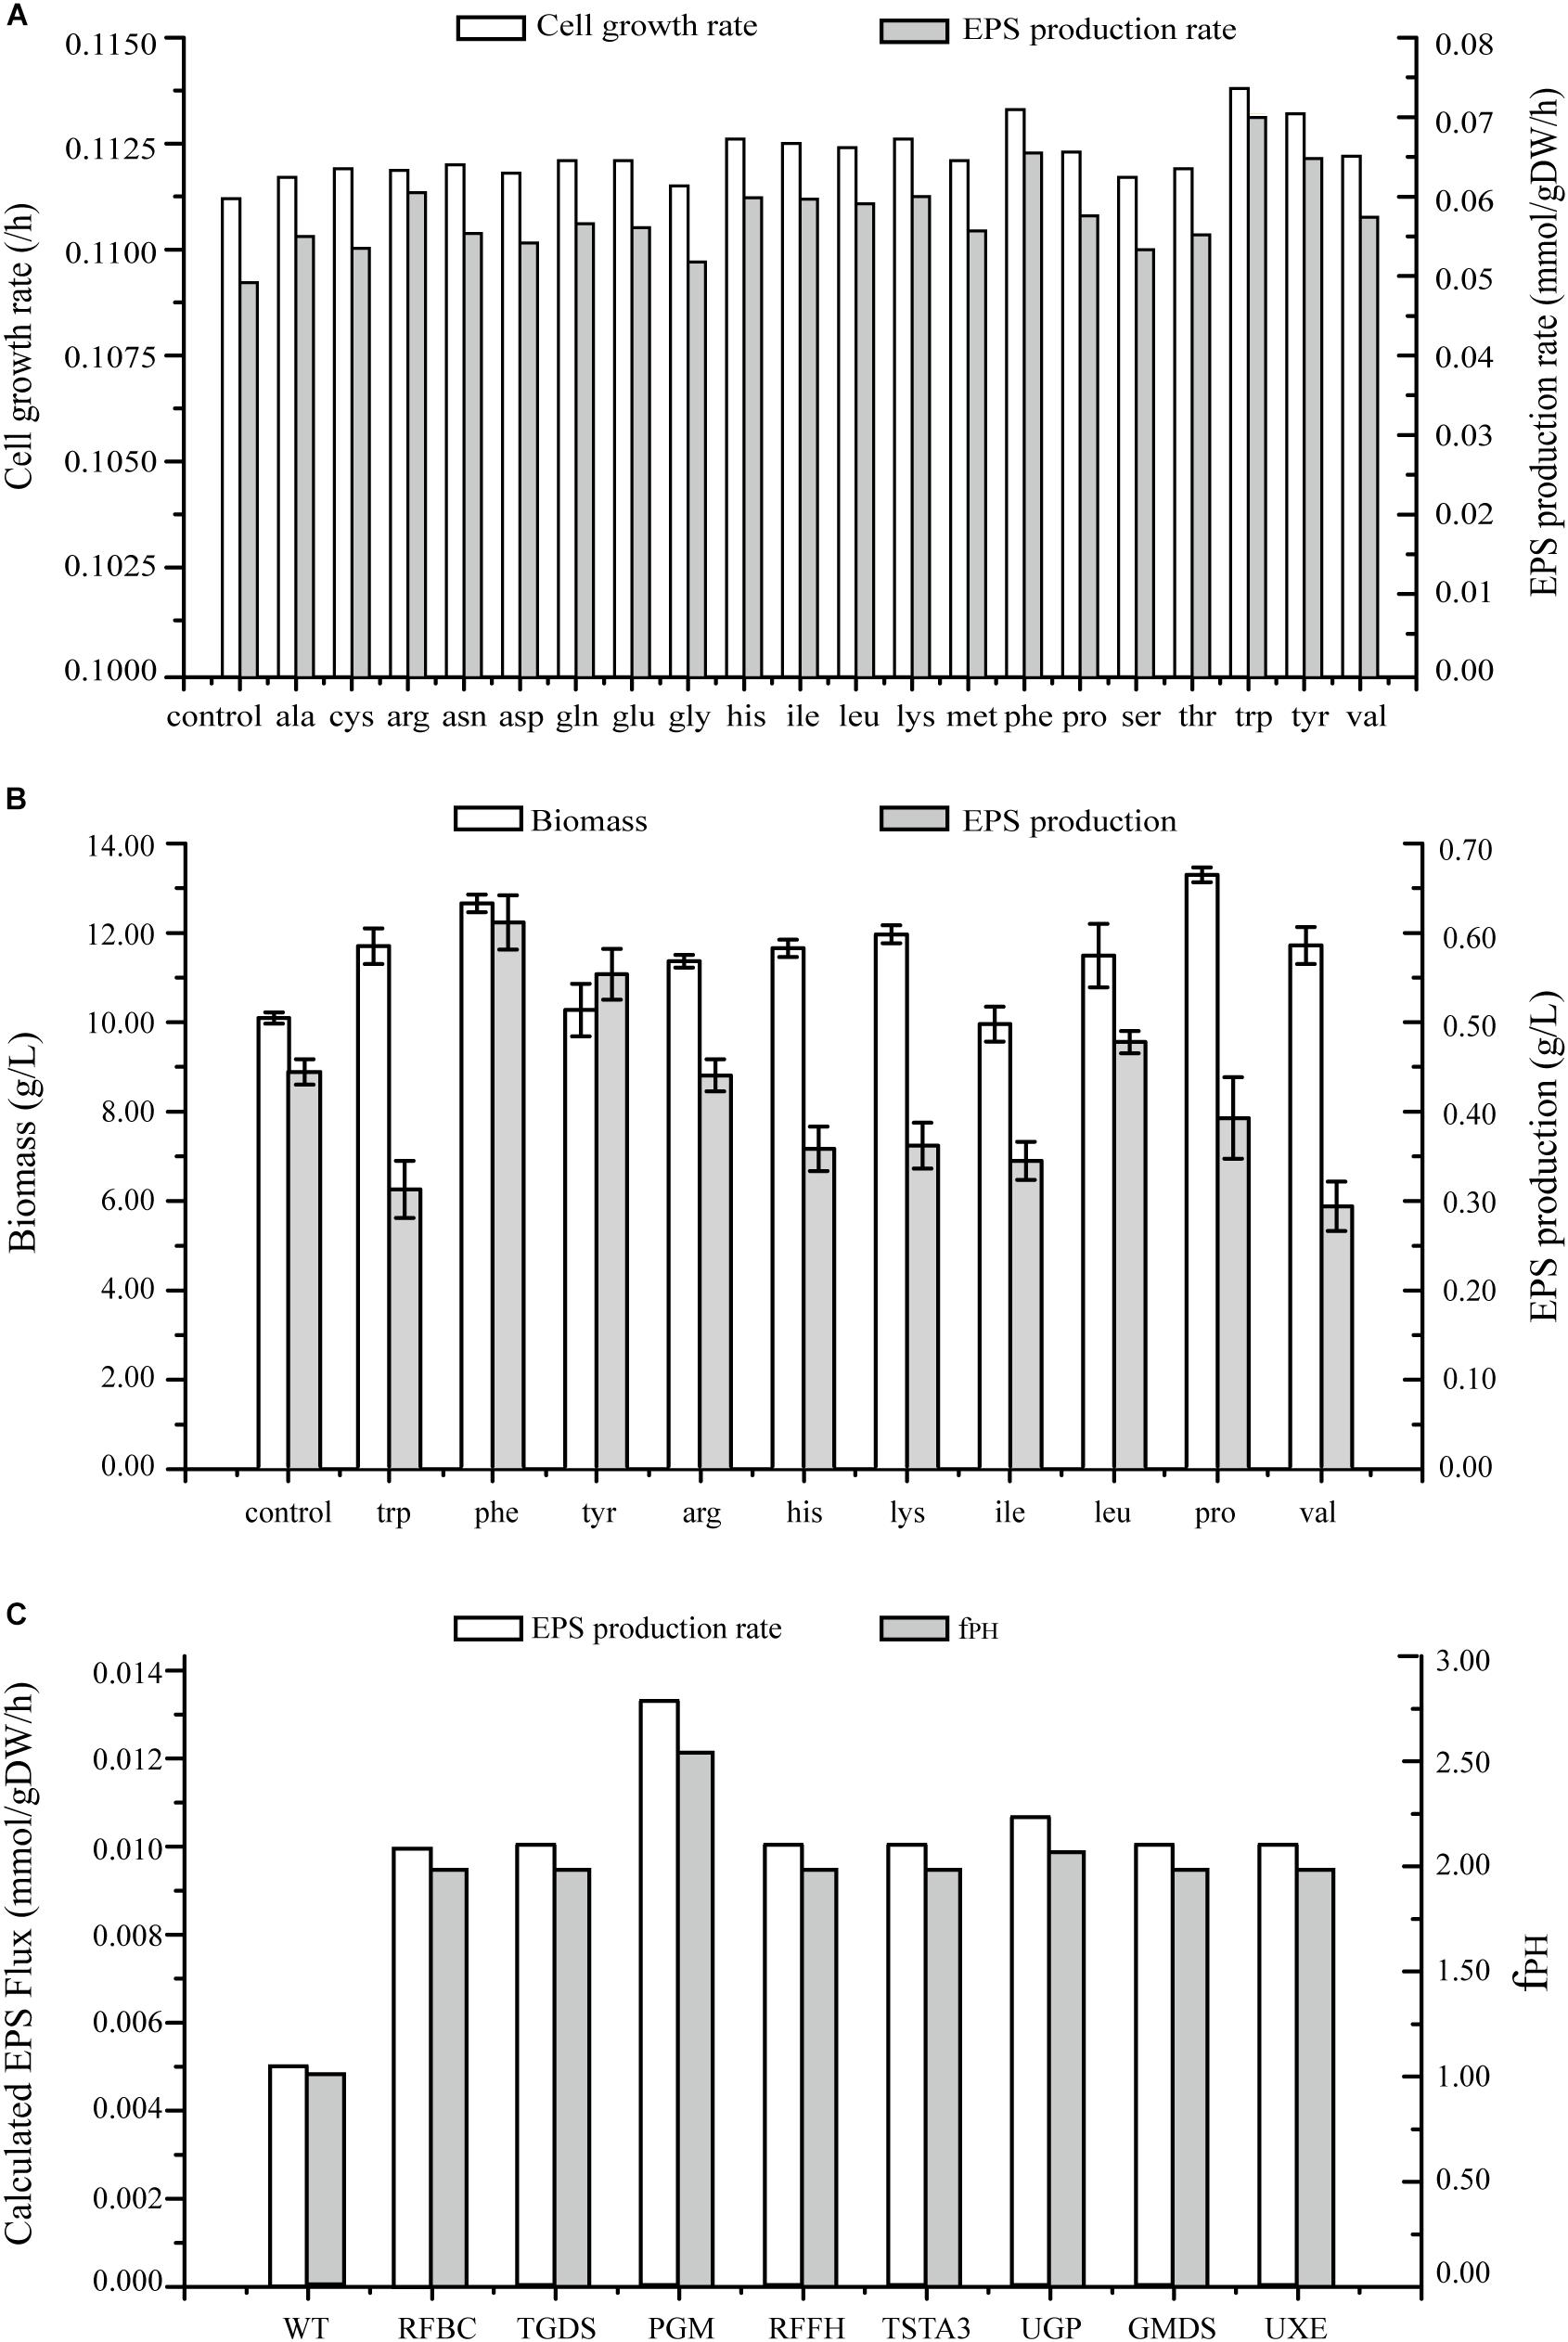
Figure 7. Predicted EPS production rates in G. lucidum under various conditions. (A) Maximal growth rate and EPS production rate on minimal growth medium, and on minimal growth medium with one of 20 amino acids. (B) Effects on biomass and EPS production rate of separate addition of 10 amino acids. (C) Effects of single gene overexpression on EPS production rate and fPH (see Simulation, Curation, and Analysis of Model iZBM1060). RFBC, dTDP-4-dehydro-6-deoxy-D-glucose 3,5-epimerase; TGDS, dTDP-glucose 4,6-hydro-lyase; PGM, glucose phosphomutase; RFFH, dTDP-glucose pyrophosphorylase; TSTA3, GDP-fucose synthase; UGP, UDP-glucose pyrophosphorylase; GMDS, GDP-mannose 4,6-hydro-lyase; UXE, UDP-arabinose 4-epimerase.
Biochemical Engineering Strategies
Effects of addition of amino acids on cell growth and EPS production were simulated, and both these parameters were found to be enhanced (Figure 7A). EPS production was increased > 15% by addition of 10 separate amino acids in simulation results. Especially, the increase was greatest for tryptophan (41.85%), followed by phenylalanine (32.80%) and tyrosine (31.39%).
The wet experiment results indicated that EPS production was greatly increased by addition of phenylalanine (38.00%) or tyrosine (25.00%) and no enhancement occurred when tryptophan or the other amino acids were applied in EPS production (Figure 7B). Addition of phenylalanine is clearly effective in enhancing EPS production. Polysaccharide yields can be further improved by adjustment of quantity and timing of amino acid addition in future studies.
Genetic Engineering Strategies
In several recent studies, expression levels of EPS biosynthetic genes have been manipulated in order to increase EPS production. However, less is known regarding overexpression of target genes for this purpose. On the basis of GSMM, we simulated gene overexpression to guide metabolic engineering for enhancement of EPS production, using MOMA to reevaluate the fluxes and obtain an overexpression algorithm. Eight key enzymes were identified as potential targets for EPS production; i.e., overexpression of PGM gene (EC: 5.4.2.2, GL24280-R1), UGP gene (EC: 2.7.7.9, GL25739-R1), TSTA3 gene (EC: 1.1.1.271, GL21002-R1), GMDS gene (EC: 4.2.1.47, GL20928-R1), UXE gene (EC: 5.1.3.5), RFBC gene (EC: 5.1.3.13), TGDS gene (EC: 4.2.1.46), and RFFH gene (EC: 2.7.7.24) notably enhanced EPS production (Figure 7C and Supplementary Table S5).
PGM catalyzed conversion of glucose-6-P to glucose-1-P; each of these compounds is an important intermediate in EPS biosynthetic pathway. Overexpression of PGM gene increased EPS production from 0.005 mmol/gDW/h in wild-type (WT) to 0.0133 mmol/gDW/h. Thus, increased PGM transcription level was directly correlated with increased EPS production. PGM was also implicated as the key enzyme for EPS biosynthesis in a previous study: maximal EPS production in a PGM gene-overexpressing strain was 1.76 g/L – 44.3% higher than in WT (Xu et al., 2015). Overexpression of UGP gene in silico caused an increase of EPS production rate to 0.0106 mmol/gDW/h. UGP is directly involved in synthesis of UDP-glucose, and EPSs contain a high proportion of glucose. UDP-glucose plays a key role in EPS production as a synthetic precursor. Li et al. (2015) also demonstrated an effect of UGP on EPS synthesis.
UXE catalyzes interconversion of two EPS synthesis precursors: UDP-arabinose and UDP-xylose. When glucose is used as carbon source, UXE plays an essential role in production of UDP-arabinose. TSTA3 and GMDS are involved in synthesis of GDP-fucose. RFBC, TGDS, and RFFH participate in synthesis of dTDP-rhamnose.
Results of the analysis described above indicate that EPS production can be effectively improved by overexpression of genes for eight key enzymes. Previous studies have demonstrated the usefulness of PGM and UGP genes in this regard. Future studies will focus on overexpression of the other six genes for improvement of EPS production.
Conclusion
A GSMM for Ganoderma lucidum (lingzhi mushroom) is presented here for the first time. The GSMM (termed model iZBM1060) is focused on EPSs, and contains 1404 reactions, 1202 metabolites, and 1060 genes. The model was validated and shown to accurately simulate cell growth and EPS production under various conditions. The nucleoside sugar (EPS precursor) biosynthetic pathway in the model was elucidated completely. Essential genes for cell growth and EPS synthesis, and genes for eight key EPS production enzymes, were analyzed. Two strategies for improvement of EPS production, based on model iZBM1060, were proposed: (i) addition of phenylalanine; (ii) overexpression of the eight key enzyme genes. PGM and UGP genes have previously been shown to be useful targets for enhancement of EPS production, and future studies will focus on overexpression of the other six genes for this purpose. Model iZBM1060 provides a useful platform for regulating EPS production in terms of system metabolic engineering for G. lucidum, as well as a guide for future metabolic pathway construction of other high value-added edible/ medicinal mushroom species.
Author Contributions
ZM and ZD designed the experiments. ZM, WD, QW, and MX performed the experiments. ZM, CY, GL, FW, GS, ZD, LL, and ZX conceived the project, analyzed the data, and wrote the paper.
Funding
This study was supported by the National Natural Science Foundation of China (No. 31271918), the China Postdoctoral Science Foundation (2015M571691) and the Qing Lan Project.
Conflict of Interest Statement
The authors declare that the research was conducted in the absence of any commercial or financial relationships that could be construed as a potential conflict of interest.
Acknowledgments
The authors are grateful to S. Anderson for English editing of the manuscript.
Supplementary Material
The Supplementary Material for this article can be found online at: https://www.frontiersin.org/articles/10.3389/fmicb.2018.03076/full#supplementary-material
Abbreviations
Ac, acetate; Acal, acetaldehyde; Accoa, acetyl-CoA; Akg, alpha-2-oxoglutarate; Aol, D-arabinitol; Ara, arabinose; Ara1p, beta-arabinose-1-P; Cellob, cellobiose; Cit, citrate; D6pgc, 6-P-gluconate; D6pgl, 6-O-P-glucono-1,5-lactone; dTDP-Glc, dTDP-alpha-glucose; dTDP-Oglc, dTDP-4-oxo-6-deoxy-glucose; dTDP-Rmn, dTDP-4-dehydro-beta-rhamnose; E4p, erythrose-4-P; Eth, ethanol; Fdp, fructose-1,6-bisphosphate; Fru, fructose; Fuc, fucose; Fuc1p, fucose-1-P; Ful, fuculose; Fulp, fuculose-1-P; Fum, fumarate; G, glycerate; Ga3p, glyceraldehyde-3-P; Gal1p, alpha-galactose-1-P; GDP-Ddm, GDP-4-dehydro-6-deoxy-mannose; GDP-Fuc, GDP-fucose; GDP-Man, GDP-mannose; Gl, glycerol; Gl3p; sn-glycerol-3-P; Glac, galactose; Glx, glyoxylate; Glyal, glyceraldehyde; Glyn, glycerone; Icit, isocitrate; Kdr, 2-dehydro-3-deoxy-rhamnonate; Lact, lactose; Laol, L-arabinitol; Lxul, L-xylulose; Mal, malate; Man, mannose; Man1p, mannose-1-P; Man6p, mannose-6-P; Meli, melibiose; Mlt, maltose; Oaa, oxaloacetate; 13Pdg, 1,3-bisphosph-glycerate; 2pg, 2-P-glycerate; 3pg, 3-P-glycerate; Pep, phosphoenolpyruvate; Pyr, pyruvate; R5P, ribose-5-P; Rl, ribulose; Rl5p, ribulose-5-P; Rmf, rhamnofuranose; Rml, rhamnono-1,4-lactone; Rmn, rhamnose; Rmna, rhamnonate; S7p, sedoheptulose-7-P; Suc, sucrose; Succ, succinate; Succoa, succinyl-CoA; T3p2, glycerone-P; Tre, trehalose; UDP-Ara, UDP-arabinose; UDP-Ga, UDP-glucuronate; UDP-Glac, UDP-alpha-galactose; UDP-Glc, UDP-glucose; UDP-Xyl, UDP-xylose; Xol, xylitol; Xul, D-xylulose; Xul5p, xylulose-5-P; Xyl, xylose.
References
Andersen, M. R., Nielsen, M. L., and Nielsen, J. (2008). Metabolic model integration of the bibliome, genome, metabolome and reactome of Aspergillus niger. Mol. Syst. Biol. 4:178. doi: 10.1038/msb.2008.12
Babitskaya, V. G., Shcherba, V. V., Puchkova, T. A., and Smirnov, D. A. (2005). Polysaccharides of Ganoderma lucidum factors affecting their production. Appl. Biochem. Microbiol. 41, 169–173. doi: 10.1007/s10438-005-0029-1
Boghigian, B. A., Armando, J., Salas, D., and Pfeifer, B. A. (2012). Computational identification of gene over-expression targets for metabolic engineering of taxadiene production. Appl. Microbiol. Biotechnol. 93, 2063–2073. doi: 10.1007/s00253-011-3725-1
Caspi, R., Foerster, H., Fulcher, C. A., Kaipa, P., Krummenacker, M., Latendresse, M., et al. (2008). The MetaCyc database of metabolic pathways and enzymes and the BioCyc collection of Pathway/Genome databases. Nucleic Acids Res. 36, D623–D631. doi: 10.1093/nar/gkm900
Chen, S., Xu, J., Liu, C., Zhu, Y., Nelson, D. R., Zhou, S., et al. (2012). Genome sequence of the model medicinal mushroom Ganoderma lucidum. Nat. Commun. 3:913. doi: 10.1038/ncomms1923
Dubois, M., Gilles, K. A., Hamilton, J. K., and Rebers, P. A. (1951). A colorimetric method for the determination of sugars. Nature 168, 167–167. doi: 10.1038/168167a0
Dubois, M., Gilles, K. A., Hamilton, J. K., Rebers, P. A., and Smith, F. (1956). Colorimetric method for determination of sugars and related substances. Anal. Chem. 28, 350–356. doi: 10.1021/ac60111a017
Ferreira, I. C., Heleno, S. A., Reis, F. S., Stojkovic, D., Queiroz, M. J., Vasconcelos, M. H., et al. (2015). Chemical features of Ganoderma polysaccharides with antioxidant, antitumor and antimicrobial activities. Phytochemistry 114, 38–55. doi: 10.1016/j.phytochem.2014.10.011
Hu, X., Zhang, Y. J., Xiao, G. H., Zheng, P., Xia, Y. L., Zhang, X. Y., et al. (2013). Genome survey uncovers the secrets of sex and lifestyle in caterpillar fungus. Chin. Sci. Bull. 58, 2846–2854. doi: 10.1007/s11434-013-5929-5
Kanehisa, M., Goto, S., Furumichi, M., Tanabe, M., and Hirakawa, M. (2010). KEGG for representation and analysis of molecular networks involving diseases and drugs. Nucleic Acids Res. 38, D355–D360. doi: 10.1093/nar/gkp896
Kim, W. J., Kim, H. U., and Lee, S. Y. (2017). Current state and applications of microbial genome-scale metabolic models. Curr. Opin. Syst. Biol. 2, 10–18. doi: 10.1016/j.coisb.2017.03.001
Lakshmanan, M., Koh, G., Chung, B. K., and Lee, D. Y. (2014). Software applications for flux balance analysis. Brief. Bioinform. 15, 108–122. doi: 10.1093/bib/bbs069
Li, H. J., Zhang, D. H., Yue, T. H., Jiang, L. X., Yu, X., Zhao, P., et al. (2016). Improved polysaccharide production in a submerged culture of Ganoderma lucidum by the heterologous expression of Vitreoscilla hemoglobin gene. J. Biotechnol. 217, 132–137. doi: 10.1016/j.jbiotec.2015.11.011
Li, M. J., Chen, T. X., Gao, T., Miao, Z. G., Jiang, A. L., Shi, L., et al. (2015). UDP-glucose pyrophosphorylase influences polysaccharide synthesis, cell wall components, and hyphal branching in Ganoderma lucidum via regulation of the balance between glucose-1-phosphate and UDP-glucose. Fungal Genet. Biol. 82, 251–263. doi: 10.1016/j.fgb.2015.07.012
Liu, J., Gao, Q., Xu, N., and Liu, L. M. (2013). Genome-scale reconstruction and in silico analysis of Aspergillus terreus metabolism. Mol. Biosyst. 9, 1939–1948. doi: 10.1039/c3mb70090a
Liu, T., Zou, W., Liu, L. M., and Chen, J. (2012). A constraint-based model of Scheffersomyces stipitis for improved ethanol production. Biotechnol. Biofuels 5:11. doi: 10.1186/1754-6834-5-72
Mau, J. L., Lin, H. C., and Chen, C. C. (2001). Non-volatile components of several medicinal mushrooms. Food Res. Int. 34:521. doi: 10.1016/s0963-9969(01)00067-9
Moriya, Y., Itoh, M., Okuda, S., Yoshizawa, A. C., and Kanehisa, M. (2007). KAAS: an automatic genome annotation and pathway reconstruction server. Nucleic Acids Res. 35, W182–W185. doi: 10.1093/nar/gkm321
Park, Y. J., Baek, J. H., Lee, S., Kim, C., Rhee, H., Kim, H., et al. (2014). Whole genome and global gene expression analyses of the model mushroom Flammulina velutipes reveal a high capacity for lignocellulose degradation. PLoS One 9:e93560. doi: 10.1371/journal.pone.0093560
Peng, L., Qiao, S. K., Xu, Z. H., Guan, F., Ding, Z. Y., Gu, Z. H., et al. (2015). Effects of culture conditions on monosaccharide composition of Ganoderma lucidum exopolysaccharide and on activities of related enzymes. Carbohyd. Polym. 133, 104–109. doi: 10.1016/j.carbpol.2015.07.014
Riley, R., Salamov, A. A., Brown, D. W., Nagy, L. G., Floudas, D., Held, B. W., et al. (2014). Extensive sampling of basidiomycete genomes demonstrates inadequacy of the white-rot/brown-rot paradigm for wood decay fungi. Proc. Natl. Acad. Sci. U.S.A. 111, 9923–9928. doi: 10.1073/pnas.1400592111
Saier, M. H. Jr., Tran, C. V., and Barabote, R. D. (2006). TCDB: the transporter classification database for membrane transport protein analyses and information. Nucleic Acids Res. 34, D181–D186. doi: 10.1093/nar/gkj001
Schellenberger, J., Que, R., Fleming, R. M., Thiele, I., Orth, J. D., Feist, A. M., et al. (2011). Quantitative prediction of cellular metabolism with constraint-based models the COBRA Toolbox v2. 0. Nat. Protoc. 6, 1290–1307. doi: 10.1038/nprot.2011.308
Segre, D., Vitkup, D., and Church, G. M. (2002). Analysis of optimality in natural and perturbed metabolic networks. Proc. Natl. Acad. Sci. U.S.A. 99, 15112–15117. doi: 10.1073/pnas.232349399
Stojkovic, D. S., Barros, L., Calhelha, R. C., Glamoclija, J., Ciric, A., van Griensven, L. J., et al. (2014). A detailed comparative study between chemical and bioactive properties of Ganoderma lucidum from different origins. Int. J. Food Sci. Nutr. 65, 42–47. doi: 10.3109/09637486.2013.832173
Tang, Y. J., and Zhong, J. J. (2003). Role of oxygen supply in submerged fermentation of Ganoderma lucidum for production of Ganoderma polysaccharide and ganoderic acid. Enzyme Microb. Technol. 32, 478–484. doi: 10.1016/s0141-0229(02)00338-1
Thiele, I., and Palsson, B. O. (2010). A protocol for generating a high-quality genome-scale metabolic reconstruction. Nat. Protoc. 5, 93–121. doi: 10.1038/nprot.2009.203
UniProt, C. (2010). The Universal Protein Resource (UniProt) in 2010. Nucleic Acids Res. 38, D142–D148. doi: 10.1093/nar/gkp846
Wang, B., Ning, Q. J., Hao, T., Yu, A. L., and Sun, J. S. (2016). Reconstruction and analysis of a genome-scale metabolic model for Eriocheir sinensis eyestalks. Mol. Biosyst. 12, 246–252. doi: 10.1039/c5mb00571j
Wang, Q., Wang, F., Xu, Z. H., and Ding, Z. Y. (2017). Bioactive mushroom polysaccharides a review on monosaccharide composition, biosynthesis and regulation. Molecules 22:E955. doi: 10.3390/molecules22060955
Wei, Z. H., Liu, L., Guo, X. F., Li, Y. J., Hou, B. C., Fan, Q. L., et al. (2016). Sucrose fed-batch strategy enhanced biomass, polysaccharide, and ganoderic acids production in fermentation of Ganoderma lucidum 5.26. Bioprocess. Biosyst. Eng. 39, 37–44. doi: 10.1007/s00449-015-1480-x
Xu, J. W., Ji, S. L., Li, H. J., Zhou, J. S., Duan, Y. Q., Dang, L. Z., et al. (2015). Increased polysaccharide production and biosynthetic gene expressions in a submerged culture of Ganoderma lucidum by the overexpression of the homologous alpha-phosphoglucomutase gene. Bioprocess. Biosyst. Eng. 38, 399–405. doi: 10.1007/s00449-014-1279-1
Ye, C., Xu, N., Chen, H., Chen, Y. Q., Chen, W., and Liu, L. M. (2015). Reconstruction and analysis of a genome-scale metabolic model of the oleaginous fungus Mortierella alpina. BMC Genomics 16:799. doi: 10.1186/s12864-015-2042-y
Yu, C. S., Lin, C. J., and Hwang, J. K. (2004). Predicting subcellular localization of proteins for Gram-negative bacteria by support vector machines based on n-peptide compositions. Protein Sci. 13, 1402–1406. doi: 10.1110/ps.03479604
Keywords: Ganoderma lucidum, extracellular polysaccharide, genome-scale metabolic model, biosynthetic pathway, phenylalanine, simulation
Citation: Ma Z, Ye C, Deng W, Xu M, Wang Q, Liu G, Wang F, Liu L, Xu Z, Shi G and Ding Z (2018) Reconstruction and Analysis of a Genome-Scale Metabolic Model of Ganoderma lucidum for Improved Extracellular Polysaccharide Production. Front. Microbiol. 9:3076. doi: 10.3389/fmicb.2018.03076
Received: 17 August 2018; Accepted: 29 November 2018;
Published: 11 December 2018.
Edited by:
Hongsheng Liu, Liaoning University, ChinaReviewed by:
Aristóteles Góes-Neto, Universidade Federal de Minas Gerais, BrazilMohammad Faiz Ahmad, Jawaharlal Nehru University, India
Copyright © 2018 Ma, Ye, Deng, Xu, Wang, Liu, Wang, Liu, Xu, Shi and Ding. This is an open-access article distributed under the terms of the Creative Commons Attribution License (CC BY). The use, distribution or reproduction in other forums is permitted, provided the original author(s) and the copyright owner(s) are credited and that the original publication in this journal is cited, in accordance with accepted academic practice. No use, distribution or reproduction is permitted which does not comply with these terms.
*Correspondence: Zhongyang Ding, YmlvZGluZ0AxNjMuY29t