 Shan Wei1Penggang Bai1Yanan Liu1Mengdan Yang1Juanzhen Ma1
 Jin Hou1
 Weifeng Liu1
 Xiaoming Bao1,2
 Yu Shen1*
- 1State Key Laboratory of Microbial Technology, Microbiology and Biotechnology Institute, Shandong University, Qingdao, China
- 2Shandong Provincial Key Laboratory of Microbial Engineering, Qi Lu University of Technology, Jinan, China
The complete and efficient utilization of both glucose and xylose is necessary for the economically viable production of biofuels and chemicals using lignocellulosic feedstocks. Although recently obtained recombinant Saccharomyces cerevisiae strains metabolize xylose well when xylose is the sole carbon source in the medium (henceforth referred to as “X stage”), their xylose consumption rate is significantly reduced during the xylose-only consumption phase of glucose-xylose co-fermentation (“GX stage”). This post-glucose effect seriously decreases overall fermentation efficiency. We showed in previous work that THI2 deletion can alleviate this post-glucose effect, but the underlying mechanisms were ill-defined. In the present study, we profiled the transcriptome of a thi2Δ strain growing at the GX stage. Thi2p in GX stage cells regulates genes involved in the cell cycle, stress tolerance, and cell viability. Importantly, the regulation of Thi2p differs from a previous regulatory network that functions when glucose is the sole carbon source, which suggests that the function of Thi2p depends on the carbon source. Modeling research seeking to optimize metabolic engineering via TFs should account for this important carbon source difference. Building on our initial study, we confirmed that several identified factors did indeed increase fermentation efficiency. Specifically, overexpressing STT4, RGI2, and TFC3 increases specific xylose utilization rate of the strain by 36.9, 29.7, 42.8%, respectively, in the GX stage of anaerobic fermentation. Our study thus illustrates a promising strategy for the rational engineering of yeast for lignocellulosic ethanol production.
Introduction
The economic feasibility of producing biofuels and biochemicals via the industrial fermentation of lignocellulosic hydrolysates requires the full consumption of glucose and xylose, which are the most abundant sugars in this kind of material (Hou et al., 2017; Kwak et al., 2019; Li et al., 2019). Saccharomyces cerevisiae is a well-studied and robust cellular factory, but it cannot natively metabolize xylose. Engineering strategies have introduced the initial xylose metabolizing enzymes, the xylose isomerase (XI), or xylose reductase and xylitol dehydrogenase. Strategies have also focused on altered transporters and modified expression of genes encoding xylulokinase and non-oxidative pentose phosphate pathway (PPP) in S. cerevisiae. However, such recombinant strains based on the strategies mentioned above only show limited xylose utilization capacity. Additionally, directed evolution with xylose as the sole carbon source in the growth medium has led to some substantial improvements (Hou et al., 2017; Kwak et al., 2019; Li et al., 2019). However, in many cases, the mechanistic details remain unclear, and this lack of understanding has hindered progress for realizing advanced strategies to rationally engineer further improvements (Myers et al., 2019).
Factors, including metabolic genes and transcription factors (TFs), that control xylose utilization in S. cerevisiae have been the focus of specific research in recent decades. For example, it has been confirmed that XI has significant effects on the capacity of S. cerevisiae to metabolize xylose. Efficient xylose utilization by an evolved strain has been partially attributed to elevated expression levels of XI, which was accomplished via multiple-copy chromosomal integration of the heterogenous xylA gene (Zhou et al., 2012). The enhancement of another evolved strain was attributed to the improvement of XI activity in S. cerevisiae by upregulating the expression molecular chaperones (Hou et al., 2016a). Additionally, improved xylose utilization capacity in some other evolved strains was attributed to the reprogramming of their carbon metabolism regulatory networks, such as the MAP Kinase (MAPK) signaling pathway and Protein Kinase A (PKA) signaling pathways, and several TFs in these signaling pathways, such as Hog1p and Ira2p, have showed their effects on xylose metabolism (Sato et al., 2016; Osiro et al., 2018; Myers et al., 2019). These findings confirmed that globally modifying the gene expression state by regulate the key transcription factors could be a way to optimize the xylose metabolism in yeast.
The carbon source conditions at the start of fermentation also significantly affect xylose metabolism. The evolved strain metabolize xylose well when xylose is the sole carbon source (referred to as the X stage). However, their specific xylose consumption rate is generally lower in the xylose consumption phase after glucose depletion in glucose-xylose co-fermentation (referred to as the GX stage), although there still remains more than half of the xylose when cells enter the GX stage (Michael et al., 2016; Wei et al., 2018). That is the yeast cells do not recognize xylose in the GX stage as they do in the X stage. It is industrially attractive to alleviate this post-glucose effect because it significantly decreases xylose utilization and prolongs fermentation times. To date, there are insufficient data regarding the mechanisms of control of the post-glucose effect and limited strategies to overcome it.
In our previous work, we revealed that deletion of the TF gene THI2 improved the xylose consumption in the GX stage (Wei et al., 2018). Thi2p is a transcriptional activator of thiamine biosynthetic genes (Nosaka et al., 2005), but little information exists on how Thi2p affects carbon metabolism. Here, we demonstrated that deletion of THI2 does not affect the activity of xylose isomerase, which catalyzes the first step of xylose metabolism and significantly affects the metabolic efficiency. We then compared the specific transcriptome differences during the GX stage between the thi2Δ strain and parental strain and examined the effects of Thi2p target genes on xylose metabolism. We thusly discovered a Thi2p regulatory network that improved xylose utilization in the GX stage. In addition, we revealed that deleting THI2 or overexpressing its target genes MID2, STT4, and CDC42 decreased the proportion of dead cells present in cultures. Finally, we showed that overexpressing Thi2p target genes STT4 (Phosphatidylinositol-4-kinase), RGI2 (respiratory growth induced, function unknown), and TFC3 (subunit of RNA polymerase III transcription initiation factor complex) significantly enhanced xylose utilization in the GX stage of anaerobic fermentation, thereby illustrating a promising strategy for the rational engineering of yeast for lignocellulosic ethanol production. Moreover, our work illustrates the important point that yeast metabolic modeling, both in basic systems studies and in more applied efforts directed towards optimization and engineering, needs to account for the carbon-source-dependent regulatory functions of TFs like Thi2p.
Methods
Construction of Plasmids and Strains
All plasmids and strains used in this study are listed in Table 1. The ORFs of all genes were amplified from the genomic DNA of the S. cerevisiae strain CEN.PK 113-5D (Entian and Kotter, 2007) using the primers listed in Additional file 1: Supplementary Table S1. The fragments of ORFs were digested by restriction enzymes and ligated into plasmid pUC20. The genes in the resultant recombinant plasmids were under the control of the TEF1 promoter. The genes were overexpressed by transferring these recombinant plasmids into BSGX001.
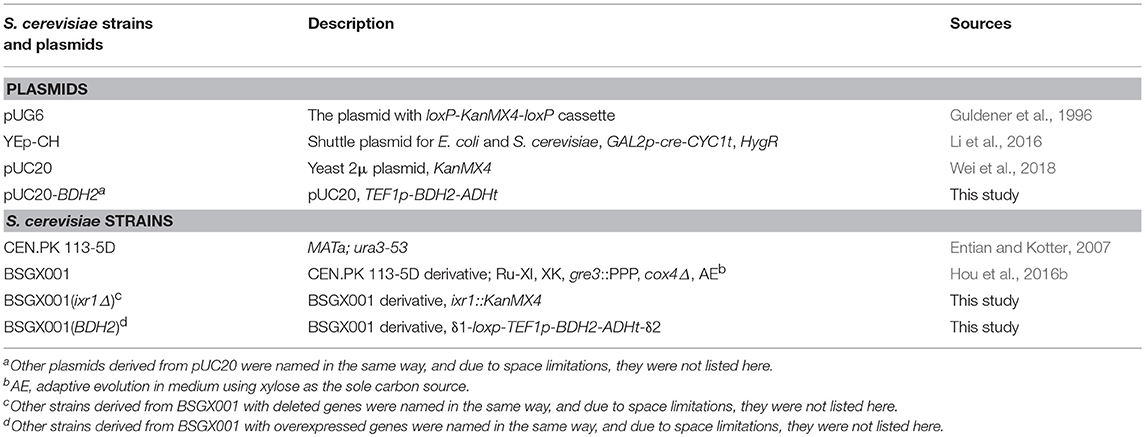
Table 1. S. cerevisiae strains and plasmids used in this study.
Gene knockout was performed by homologous recombination using a KanMX4 expression cassette, which was cloned from pUG6 (Guldener et al., 1996), to replace the target gene. The KanMX4 marker was then discarded by transferring plasmid YEp-CH into the strains and inducing the expression of Cre recombinase (Li et al., 2016).
Cultivation Conditions and Batch Fermentation
E. coli recombinant cells were cultured at 37°C in Luria–Bertani (LB) medium (5 g L−1 yeast extract, 10 g L−1 tryptone, 10 g L−1 NaCl, pH 7.0), and 100 mg L−1 ampicillin was added for the selection of transformants. Yeast cells were cultivated at 30 °C in SC-Ura medium containing 1.7 g L−1 yeast nitrogen base, 5 g L−1 (NH4)2SO4, 0.77 g L−1 CSM-Ura (Sunrise Science Products, USA) and 20 g L−1 glucose as the carbon source.
Fermentation was performed in shake flasks or 1 L bioreactors according to the experimental requirements. The fermentation medium was comprised of 1.7 g L−1 yeast nitrogen base, 5 g L−1 (NH4)2SO4, 20 g L−1 glucose, and 20 g L−1 xylose. Overnight cultures of a single colony were transferred into a 250 mL shake flask containing 50–60 mL fresh SC-Ura medium supplied with 20 g L−1 glucose and an initial biomass of 0.23 g L−1 dry cell weight (DCW) (OD600 of 1) and cultured at 30 °C and 200 rpm for another 12–16 h. The cells were then collected and washed three times with sterile water and inoculated into the fermentation medium. Fermentation in shake flasks was performed at 30°C and 200 rpm. The initial biomass was 0.575 g L−1 DCW. The anaerobic fermentation in bioreactors was performed with an initial biomass of 0.23 g L−1 DCW at 30°C and pH 5.5, with 0.1 vvm nitrogen and a stirring speed of 200 rpm for ~ 30 h. The pH was maintained by automatically pumping 5 mol L−1 NaOH and 5 mol L−1 H3PO4. All fermentations were carried out in triplicate.
Quantitative PCR (qPCR) Analysis
qPCR data were analyzed according to the 2−ΔΔCT method (Livak and Schmittgen, 2001). RNA was extracted from the cells collected from the 20 h glucose-xylose co-fermentation flasks using a UNlQ-10 Column Trizol Total RNA Isolation Kit (Sangon Biotech Co., Ltd., Shanghai, China). The cDNA was obtained using a PrimeScriptTM RT reagent Kit (TaKaRa, Japan). The gene transcription levels were determined using the equation N = 2Ct(reference gene)/2Ct(target gene). ACT1 was used as the reference gene, and the t-test was applied to evaluate the differences between means.
Xylose Isomerase Activity Assay
The crude enzyme samples were prepared as previously described (Hou et al., 2016a). Yeast cells were collected at 20 h in glucose-xylose co-fermentation, then were broken by glass beads (Φ = 0.5 mm) using a FastPrep cell homogenizer (Thermo Savant, USA). The total cellular protein concentration was measured using a BCA protein assay reagent kit (Sangon Biotech Co., Ltd., Shanghai, China).
The XI activities were determined at 30°C by measuring the decrease in NADH concentration using a previously reported method (Hou et al., 2016a). Briefly, assays were performed in reaction mixtures containing 0.15 mmol L−1 NADH, 10 mmol L−1 MgCl2, and 1 U of sorbitol dehydrogenase (Sigma-Aldrich, USA) in 100 mmol L−1 Tris-HCl (pH 7.5) with appropriately diluted crude cell extracts. The reaction was initiated by adding 500 mmol L−1 xylose. One unit of XI activity was defined as the amount of crude enzyme required to produce 1 mmol xylulose per min under the assay conditions.
Transcriptome Analysis
Samples from the batch fermentation shake flasks were taken at 20 h and subjected to transcriptome analysis. The cells in each sample were collected by centrifugation at 5,000 rpm and 4°C for 5 min and then frozen in liquid nitrogen. Total RNA was extracted using a UNIQ-10 Trizol RNA Purification Kit (Sangon Biotech, China) and then fragmented. DNA was digested with DNase I, and cDNA was synthesized by using short mRNA fragments as templates. Three independent RNA extractions were assayed for each strain. The resulting sample library was sequenced using an Illumina HiSeqTM 2000 (BGI Shenzhen, China).
Raw data from transcriptional analysis and processed data for genes exhibiting significant differences between BSGX001 (thi2Δ) and BSGX001 are available in the NCBI Gene Expression Omnibus database (GEO Accession Number: GSE119333). Significant differences were indicated by p-values of 0.001 or less, and an absolute fold-change threshold of 2.0 or greater. All annotations were derived from the Saccharomyces Genome Database (SGD) (http://www.yeastgenome.org/). Cluster analysis was performed using the Gene Ontology Slim Mapper tool supplied by the SGD (http://www.yeastgenome.org).
Analysis of Metabolites and Calculation
The concentrations of glucose, xylose, glycerol, acetate, and ethanol were measured using HPLC (Shimadzu, Japan) with an Aminex HPX-87H ion exchange column (300 ×7.8 mm, Bio-Rad, Hercules, USA). The mobile phase was 5 mmol L−1 H2SO4 with a flow rate of 0.6 ml/min, and the temperature of the column oven was 45°C. The specific xylose utilization rate (rxylose) was calculated using the following equation, as previously described (Wei et al., 2018):
where r is the specific utilization during the phase from sampling point m to sampling point n; and A, B, and t are the metabolite concentration, biomass concentration, and time, respectively, at sampling points n, i, and m.
Measurement of the Proportion of Dead Cells in Culture
Yeast cells were harvested at 20, 36, and 48 h, and diluted to a suitable multiple (~ 6 ×10⁷ cells mL−1). The cells were then incubated with 0.04% trypan blue for 3–10 min; dead cells were stained by trypan, while live cells were not (Bowey-Dellinger et al., 2017). The stained cells were counted manually using a hemocytometer. Samples were subjected to independent triplicate tests, each with more than 500 cells counted. For statistical analysis, the unpaired, two-tailed t-test was performed. Data with p ≤ 0.05 were considered significantly different.
Results
Increased Xylose Utilization of the THI2 Deletion Strain Is Not Related to Xylose Isomerase Activity
Xylose isomerase activity in recombinant yeast seriously affects the capacity of S. cerevisiae to utilize xylose (van Maris et al., 2007; Zhou et al., 2012; Hou et al., 2016a). The transcription level of xylA and XI activity of the thi2Δ strain and its control BSGX001 (Hou et al., 2016b) were detected to determine whether deletion of THI2 enhanced xylose utilization through increasing the xylA gene expression or directly improving the XI activity. The results showed that the transcriptional level of xylA in THI2 deletion strain is 54.2% of that in parent strain and the p-value is 0.147, which change is not significant. The xylose isomerase in THI2 deletion strain is 83.6% of parent strain (p-value is 0.048). These results suggested that neither the transcription level of xylA nor XI activity increased in the thi2Δ strain compared to BSGX001 in the GX stage (Figure 1), that is deletion of THI2 did not increase XI activity of strain.
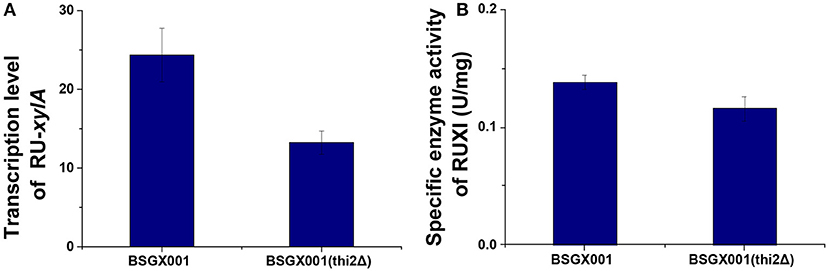
Figure 1. The transcription level of the Ru-xylA gene relative to reference gene ACT1 (A), and the specific activity of XI (B) of the THI2 deletion strain. The error bars indicate the standard deviation of independent experiments performed in triplicate.
The Transcriptional Profile of the THI2 Deletion Strain Suggested Engineering Strategies for Enhanced Xylose Utilization in S. cerevisiae
Transcriptional Profile of the THI2 Deletion Strain
To investigate how THI2 deletion improved the xylose utilization in the GX stage, we compared the transcriptome of THI2 deletion strain BSGX001(thi2Δ) and its parent strain BSGX001 in the GX stage. The samples of both strains were taken at 2 h after glucose depletion (20 h) in glucose-xylose co-fermentation. At this time point, ~17–18 g L−1 xylose remained in the medium. The transcriptome analysis results (Table 2) revealed that 93 and 16 genes were significantly up- and downregulated, respectively, in the THI2 deletion strain during the GX stage. The Gene Ontology (GO) cluster result showed that within the Molecular Functions category, the upregulated genes were primarily clustered (cluster frequency ≥ 10%) under the GO terms hydrolase activity and DNA binding; the downregulated genes were primarily clustered under the GO terms DNA binding, transferase activity and ligase activity; within the Biological Processes category, upregulated genes did not cluster to specific GO term, while the downregulated genes clustered to GO terms RNA polymerase II promoter, cellular response to DNA damage stimulus, vitamin metabolic process, and DNA repair.
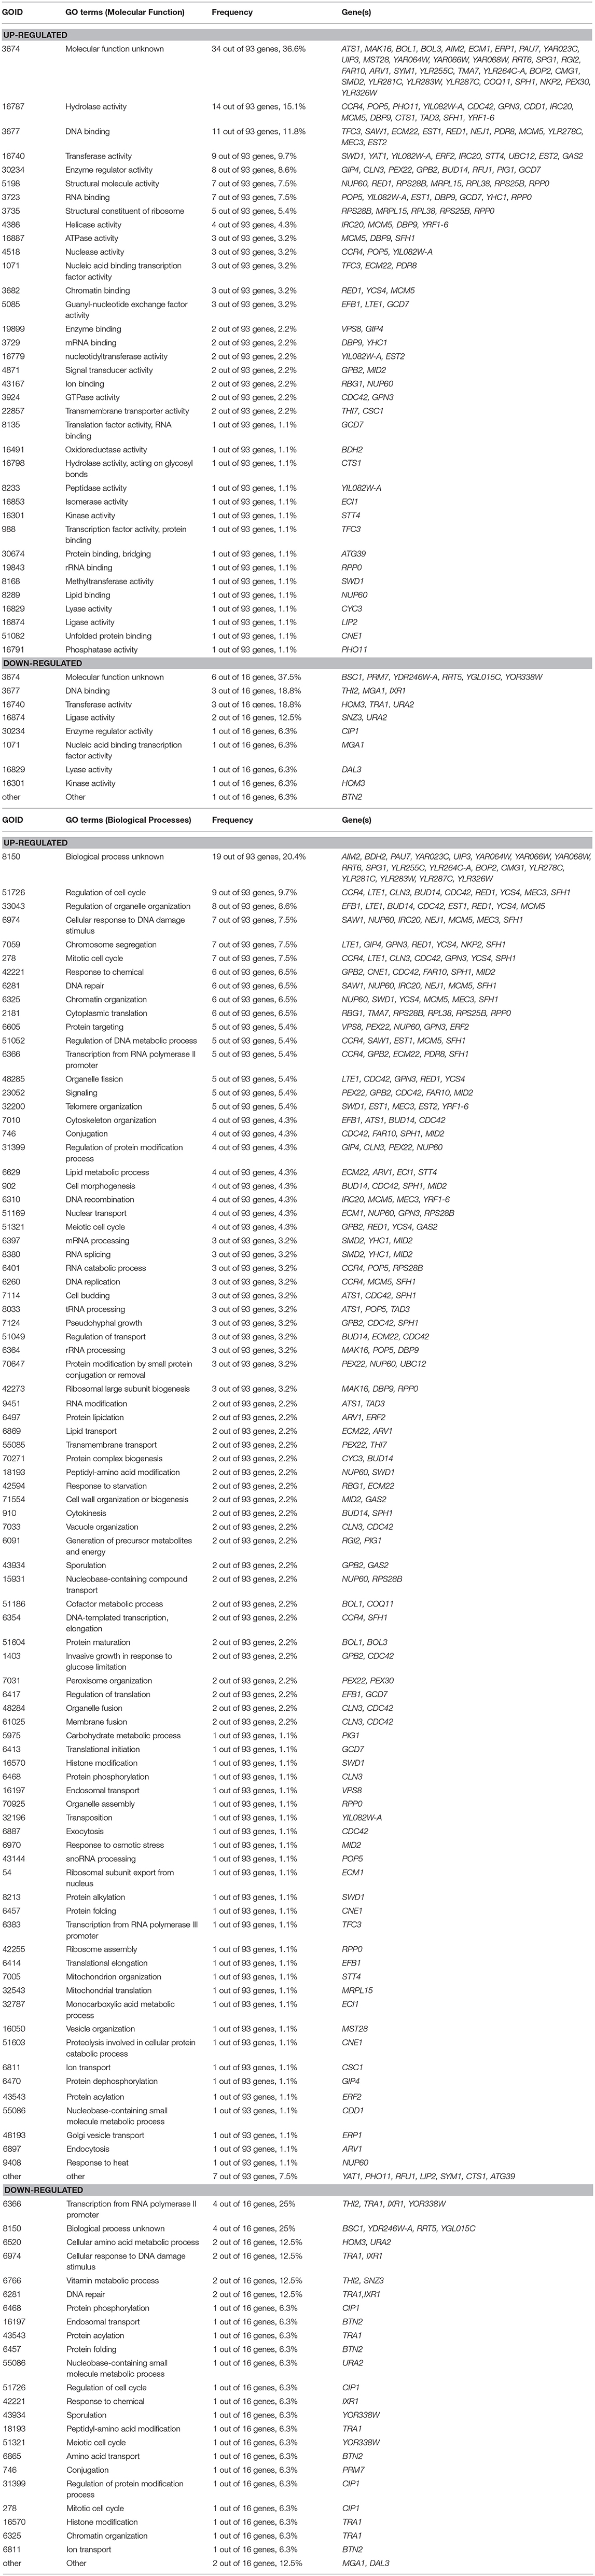
Table 2. Gene cluster analysis of transcriptome difference of BSGX001 (thi2Δ) vs. BSGX001 at the GX stage in the aspect of Molecular Function and Biological Processes.
The Effect of Differentially Expressed Genes (DEGs) on Xylose Utilization
According to the significant DEGs and previously reported factors that related to the xylose metabolism of S. cerevisiae (Salusjarvi et al., 2008; Cheng et al., 2018; Wei et al., 2018), 32 upregulated genes involved in ribosomal biosynthesis, signal transducer, generation of precursor metabolites and energy, starvation response, ATPase or GTPase activity, oxidoreductase activity, cofactor metabolic process, lipid metabolic process, transmembrane transporter activity, and protein modification, and 12 downregulated genes, were chosen for follow-up investigations.
The up- and down-regulated genes were overexpressed and deleted, respectively, in strain BSGX001. The effect was then evaluated by determining the xylose-specific consumption rate of recombinant strains in shake flask fermentations at the GX stage. The results showed that all mutants had no significant effect on glucose metabolism. Overexpressing the cell wall integrity (CWI)-related genes MID2, STT4, and CDC42 increased the rxylose of the strain by 45.9, 49.2, and 13.1%, respectively. Overexpressing stress response genes ECM22, CSC1, and BDH2 increased the rxylose of the strain by 11.5, 13.1, and 26.2%, respectively. Overexpressing GPN3 (encoding a putative GTPase) and TFC3 (encoding a subunit of the RNA polymerase III transcription initiation factor complex) increased the rxylose of the strain by 13.1 and 42.6%, respectively. Furthermore, overexpressing the function unknown genes BOP2 and RGI2 increased the rxylose of the strain by 11.5 and 41.0%, respectively. Deleting CIP1, IXR1, YDR246W-A, and YGLO15C increased the rxylose of the strain by 26.2%, 36.1, 16.4, and 14.8%, respectively (Table 3). These results suggested that deleting THI2 enhanced xylose utilization through regulating these genes (Figure 2).
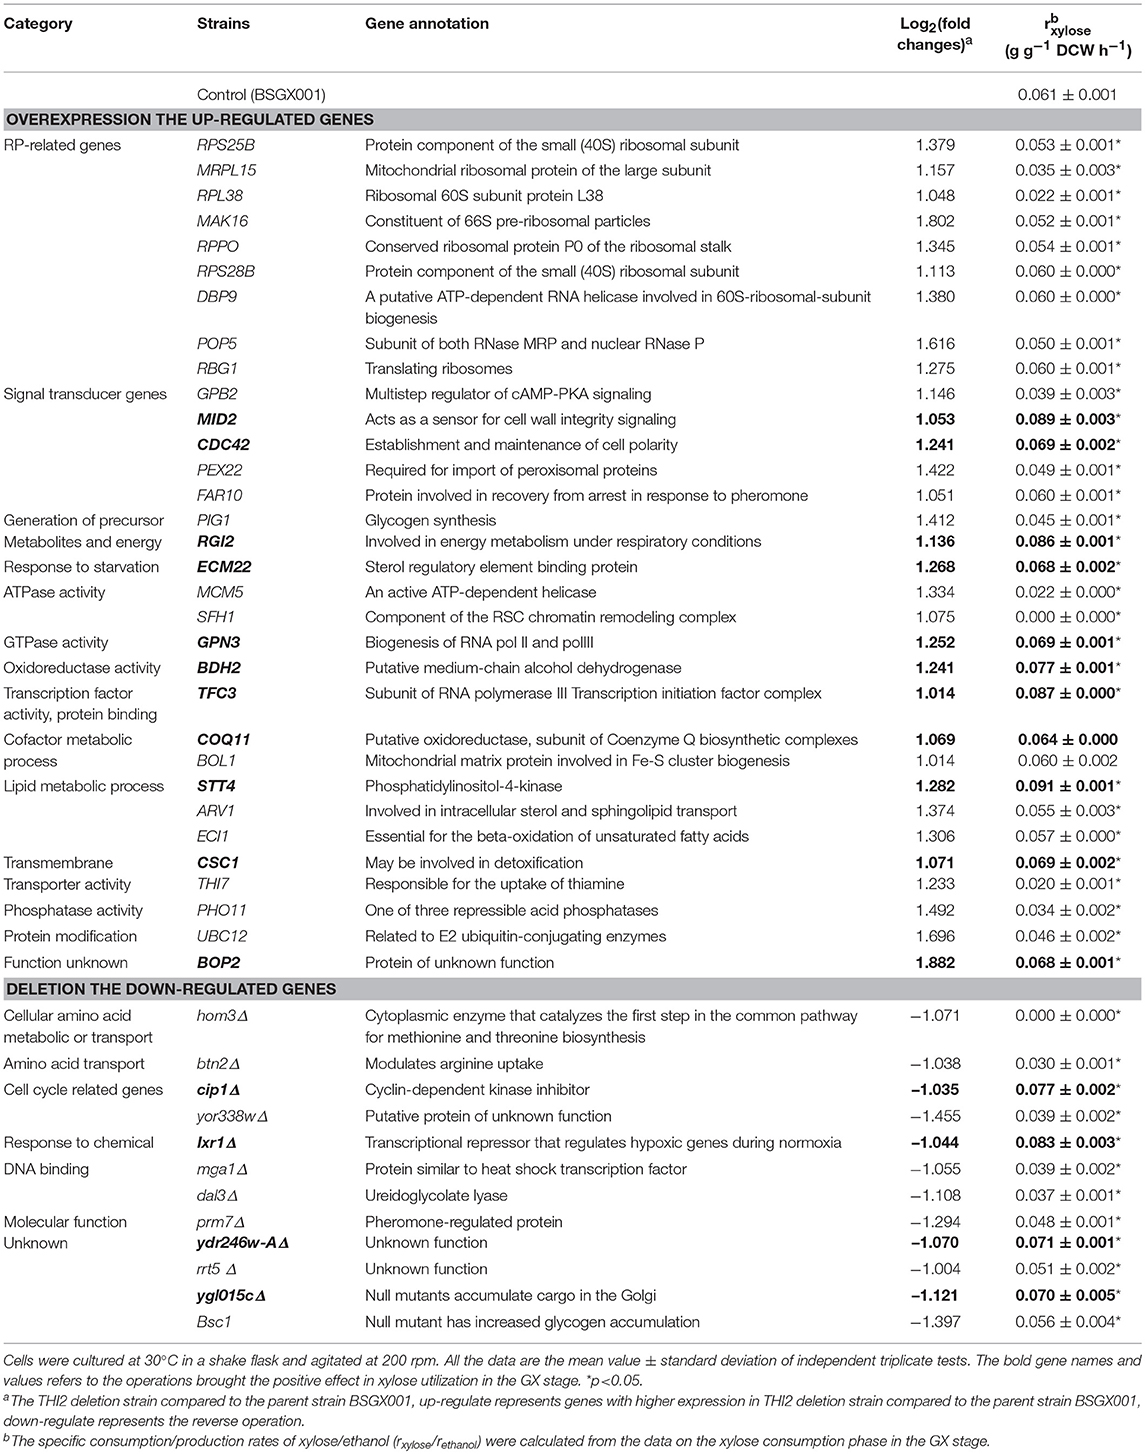
Table 3. Genes regulated by Thi2p in GX stage and their effects on xylose utilization.
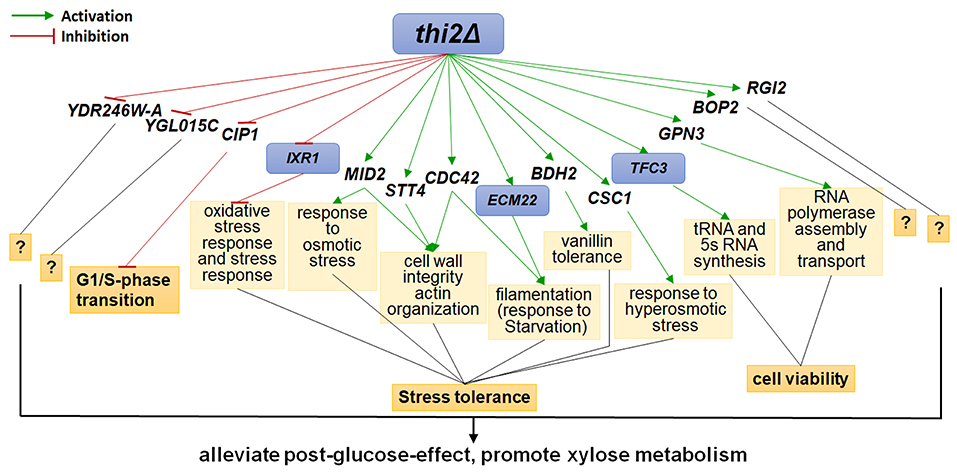
Figure 2. Regulatory Network of Thi2p promoting xylose utilization in the GX stage. Green and red lines represent activation function and inhibition function, respectively; black lines represent unknown function. Genes with purple background frame encode transcription factors.
Overexpressing Cell Wall Integrity Related Genes MID2, STT4, and CDC42 Decreased the Proportion of Dead Cells in the Culture
Among the genes that positively enhanced xylose utilization, the genes MID2, STT4, and CDC42 belong to the CWI pathway, which may protect cells from environmental conditions that otherwise induced death (Mishra et al., 2017). We determined the proportion of dead cells in the culture of strains overexpressing these genes, as well as THI2 deletion strain, and their parent strain BSGX001. Samples were taken at 20, 36, and 48 h, respectively.
The results (Figure 3) provided information regarding three aspects of xylose utilization. First, in the phase that xylose was rapidly consumed (BSGX001, xylose fermentation, 20 h), the proportion of dead cells in the culture was low (<10%). After xylose was depleted (BSGX001, xylose fermentation, 36 and 48 h), the proportion of dead cells increased with time. The changes in nutritional condition apparently induced cell death. Second, the proportion of dead cells in the GX stage (BSGX001, glucose-xylose co-fermentation, 20, 36, 48 h) was much higher than after xylose was depleted (BSGX001, xylose fermentation, 36 and 48 h), which suggested that cell death was more significantly induced by glucose depletion than by xylose depletion. Third, overexpressing MID2, STT4, and CDC42 or deleting THI2 decreased the proportion of dead cells in the cultures. The decrease at all timepoints was significant (p-value < 0.05). Overexpression of MID2, STT4, and CDC42 or deleting THI2 enhanced xylose metabolism in the GX stage, in part, because overexpression of these genes promoted cell survival and continued metabolism.
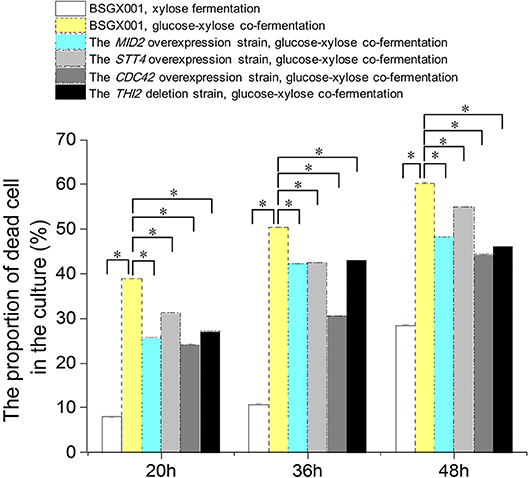
Figure 3. The proportion of dead cell in the culture. Cells were cultured at 30°C in a shake flask and agitated at 200 rpm. In xylose fermentation, xylose was depleted at about 30 h. In glucose-xylose co-fermentation, glucose was depleted before 20 h, while xylose was not depleted before 48 h. Samples were taken at 20, 36, and 48 h respectively. All data are the mean ± standard deviation of independent tests performed in triplicate. *p < 0.05.  , BSGX001, xylose fermentation;
  , BSGX001, glucose-xylose co-fermentation;
  , the MID2 overexpression strain, glucose-xylose co-fermentation;
  , the STT4 overexpression strain, glucose-xylose co-fermentation;
  , the CDC42 overexpression strain, glucose-xylose co-fermentation;
  , the THI2 deletion strain, glucose-xylose co-fermentation.
Overexpressing STT4, RGI2, or TFC3 Enhanced Xylose Utilization in the GX Stage Under Anaerobic Conditions
The level of available oxygen has an impact on the xylose fermentation characteristics (Salusjarvi et al., 2008; Souto-Maior et al., 2009). The xylose utilization of strains overexpressing STT4, RGI2, TFC3, and MID2, or deleting IXR1, which showed the highest positive effect on xylose utilization in shake flask fermentations, were further evaluated in bioreactors under anaerobic conditions. Their glucose-xylose co-fermentation characteristics are shown in Figure 4 and Table 4. Overexpressing STT4 and RGI2 increased the specific consumption rate of xylose (rxylose) of the strain by 36.9 and 29.7% in the GX stage, respectively. Although the specific production rate of ethanol (rethanol) and the ethanol yields (Yethanol) did not increase, the fermentation time was shortened (Figures 4A,B). Overexpressing TFC3 increased the rxylose and rethanol by 42.8 and 32.5%, respectively, and this also shortened the fermentation time (Figure 4C). However, overexpression of MID2 or deletion of IXR1 did not yield positive effects on xylose utilization under anaerobic conditions, which indicated that oxygen levels played an important role in the strain utilization of xylose.
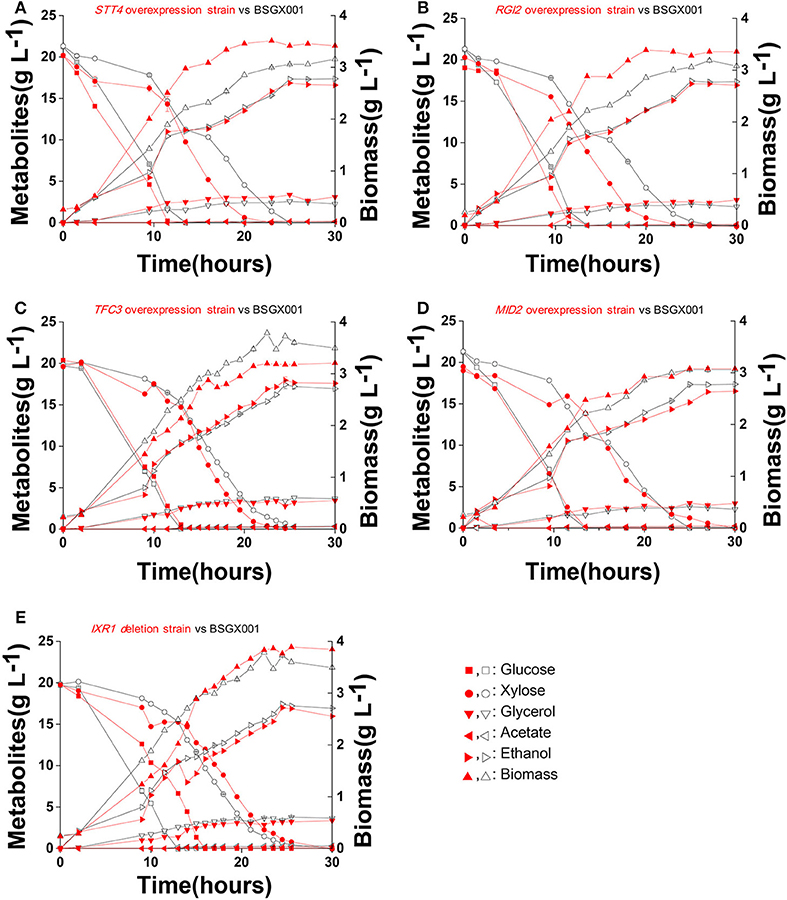
Figure 4. Fermentation characteristics of strains overexpressing STT4, RGI2, TFC3, and MID2 or deleting IXR1 under anaerobic conditions. Cells were cultured in bioreactors at 30 °C, pH 5.5 with 0.1 vvm nitrogen and stirring at 200 rpm. (A) STT4 overexpression strain vs. BSGX001. (B) RGI2 overexpression strain vs. BSGX001. (C) TFC3 overexpression strain vs. BSGX001. (D) MID2 overexpression strain vs. BSGX001. (E) IXR1 deletion strain vs. BSGX001. Symbols: ■, glucose; ∙, xylose; ▾, glycerol; ◂, acetate; ▸, ethanol; ▴, biomass. The red solid symbols are the test strains; the black hollow symbols are the control strain BSGX001. All the data represent the mean value of independent triplicate tests.
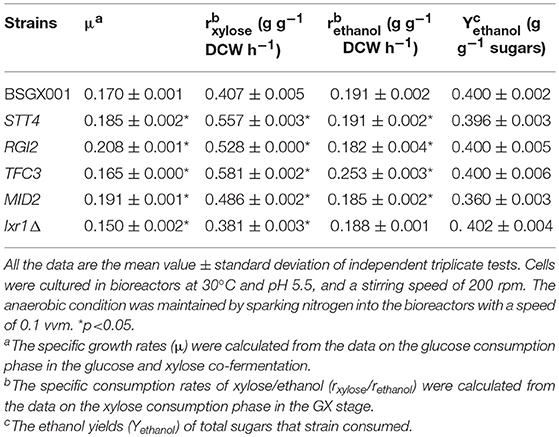
Table 4. The characteristics of anaerobic fermentation of strains overexpressing STT4, RGI2, TFC3, MID2, and deleting IXR1.
Discussion
Despite the large amount of xylose present in many feedstocks that are commonly used in fermentation cultures in bio-industrial manufacturing, our basic understanding of xylose utilization by S. cerevisiae is limited. This lack of understanding has hindered rationally informed strategies for further improving recombinant S. cerevisiae strains to efficiently utilize this abundant carbon source. Understanding the regulatory networks controlling xylose metabolism will almost certainly inform and encourage rational engineering work focused on fully utilizing the mixed sugars in lignocellulosic hydrolysates. In the present study, we investigated the functional significance of how THI2 deletion promotes xylose utilization. We found that THI2 positively affected xylose utilization by downregulating the cell cycle-related gene CIP1 and the stress response-related gene IXR1; by upregulating the stress response-related genes MID2, STT4, CDC42, ECM22, BDH2, and CSC1; and by upregulating the cell viability-related genes GPN3 and TFC3. These results reconfirm the findings of several previous studies that have shown xylose utilization is related to stress responses, and expression of stress-resistant genes affects the xylose metabolism in engineered S. cerevisiae (Cheng et al., 2018; Cunha et al., 2018).
Furthermore, we found that deletion of THI2 increased xylose metabolism in the GX stage by regulating genes involved in the cell cycle, stress tolerance, and cell viability. Notably, these regulatory targets of Thi2p in the GX stage were apparently very different from its targets when cells are cultured in glucose (e.g., eponymous thiamine biosynthetic genes and some ribosomal protein genes) (Hu et al., 2007). A comparison of these results suggests that the function of Thi2p depends on the carbon source available, a phenomenon that has been observed for some other yeast TFs (Bergenholm et al., 2018). Further modeling investigations that are directed towards optimization and engineering through disruption of TFs, such as transcriptome engineering (Michael et al., 2016), should not ignore this important difference.
In addition, our work demonstrated that overexpression of STT4, RGI2, and TFC3 increased xylose consumption rates in both aerobic and anaerobic fermentation. Specifically, these genetically modified strains increased the rxylose and shorted the overall fermentation time, a finding which has significance for production practices focused on improving economic efficiency. Additionally, we found that although overexpression of MID2 or deletion of IXR1 increased xylose consumption in aerobic fermentation, this effect was not seen in anaerobic fermentation. These results are not simply due to respiration, since the respiratory chain of our strains was blocked via deletion of COX4. The work of Myers et al. (2019) clearly showed large transcriptional changes to S. cerevisiae as it enters anaerobiosis in glucose or xylose. Future work resolving the apparent discrepancies between their transcriptome work and our findings for specific genetically manipulated strains will almost certainly reveal clues to deepen our understanding of how oxygen availability, beyond its role in respiration, impacts xylose metabolism in yeast and other organisms. Moreover, the stricter controlled pH condition in bioreactors than in shake flasks could also be a reason.
In summary, xylose has long been considered to be only a semi-fermentable carbon source for S. cerevisiae (Salusjarvi et al., 2008; Souto-Maior et al., 2009), and the post-glucose effect is obviously involved in shifting between carbon sources. However, this phenomenon has not been fully appreciated or understood to date. In this context, our molecular investigation of the global impacts of altering the regulatory networks controlling xylose utilization during the GX stage significantly advance our basic understanding of the mechanisms underlying such carbon source shift. Our results provide an initial proof-of-concept demonstration for new strategies to control and overcome inefficiencies for the exploitation of xylose as a carbon source in industrial biotechnology.
Data Availability
The raw data from transcriptional analysis and processed data of genes with significant differences between the thi2Δ strain and the parent strain in the GX stage are presented in the NCBI Gene Expression Omnibus database (GEO accession number: GSE119333).
Author Contributions
YS and XB conceived the original research plan. SW, PB, YL, MY, and JM designed and performed the experiments. SW, YS, XB, and JH analyzed the data. SW, YS, WL, and XB wrote and revised the manuscript. All authors read and approved the final manuscript.
Funding
This work was supported by the National Key Research and Development Program of China (2018YFB1501702, 2018YFB1501401), the National Natural Science Foundation of China (No.31470166, No.31770046, and No.31870063), the Major Program of Shandong Province Natural Science Foundation (No. ZR2018ZB0209), and the Key Research and Development project of Shandong Province (2017CXGC1105).
Conflict of Interest Statement
The authors declare that the research was conducted in the absence of any commercial or financial relationships that could be construed as a potential conflict of interest.
Acknowledgments
The authors thank Dr. Chengjia Zhang from State Key Laboratory of Microbial Technology for assistance in the bioreactor experiments.
Supplementary Material
The Supplementary Material for this article can be found online at: https://www.frontiersin.org/articles/10.3389/fmicb.2019.01649/full#supplementary-material
Abbreviations
CWI, cell wall integrity; DCW, dry cell weight; GEO, Gene Expression Omnibus database; GO, Gene Ontology; LB, Luria-Bertani; PPP, pentose phosphate pathway; qPCR, Quantitative Polymerase Chain Reaction; SC, synthetic complete drop-out; SC-Ura, synthetic complete drop-out uracil; TFs, transcription factors; XI, xylose isomerase.
References
Bergenholm, D., Liu, G., Holland, P., and Nielsen, J. (2018). Reconstruction of a global transcriptional regulatory network for control of lipid metabolism in yeast by using chromatin immunoprecipitation with lambda exonuclease digestion. mSystems 3:e00215–17. doi: 10.1128/mSystems.00215-17
Bowey-Dellinger, K., Dixon, L., Ackerman, K., Vigueira, C., Suh, Y. K., Lyda, T., et al. (2017). Introducing mammalian cell culture and cell viability techniques in the undergraduate biology laboratory. J. Microbiol. Biol. Educ. 18:18.2.38. doi: 10.1128/jmbe.v18i2.1264
Cheng, C., Tang, R. Q., Xiong, L., Hector, R. E., Bai, F. W., and Zhao, X. Q. (2018). Association of improved oxidative stress tolerance and alleviation of glucose repression with superior xylose-utilization capability by a natural isolate of Saccharomyces cerevisiae. Biotechnol. Biofuels 11:28. doi: 10.1186/s13068-018-1018-y
Cunha, J. T., Costa, C. E., Ferraz, L., Romani, A., Johansson, B., Sa-Correia, I., et al. (2018). HAA1 and PRS3 overexpression boosts yeast tolerance towards acetic acid improving xylose or glucose consumption: unravelling the underlying mechanisms. Appl. Microbiol. Biotechnol. 102, 4589–4600. doi: 10.1007/s00253-018-8955-z
Entian, K. D., and Kotter, P. (2007). Yeast genetic strain and plasmid collections. Methods Microbiol. 36, 629–666. doi: 10.1016/S0580-9517(06)36025-4
Guldener, U., Heck, S., Fielder, T., Beinhauer, J., and Hegemann, J. H. (1996). A new efficient gene disruption cassette for repeated use in budding yeast. Nucleic Acids Res. 24, 2519–2524. doi: 10.1093/nar/24.13.2519
Hou, J., Jiao, C., Peng, B., Shen, Y., and Bao, X. (2016a). Mutation of a regulator Ask10p improves xylose isomerase activity through up-regulation of molecular chaperones in Saccharomyces cerevisiae. Metab. Eng. 38, 241–250. doi: 10.1016/j.ymben.2016.08.001
Hou, J., Qiu, C., Shen, Y., Li, H., and Bao, X. (2017). Engineering of Saccharomyces cerevisiae for the efficient co-utilization of glucose and xylose. FEMS Yeast Res. 17:fox024. doi: 10.1093/femsyr/fox034
Hou, J., Shen, Y., Jiao, C., Ge, R., Zhang, X., and Bao, X. (2016b). Characterization and evolution of xylose isomerase screened from the bovine rumen metagenome in Saccharomyces cerevisiae. J. Biosci. Bioeng. 121, 160–165. doi: 10.1016/j.jbiosc.2015.05.014
Hu, Z., Killion, P. J., and Iyer, V. R. (2007). Genetic reconstruction of a functional transcriptional regulatory network. Nat. Genet. 39, 683–687. doi: 10.1038/ng2012
Kwak, S., Jo, J. H., Yun, E. J., Jin, Y. S., and Seo, J. H. (2019). Production of biofuels and chemicals from xylose using native and engineered yeast strains. Biotechnol. Adv. 37, 271–283. doi: 10.1016/j.biotechadv.2018.12.003
Li, H., Shen, Y., Wu, M., Hou, J., Jiao, C., Li, Z., et al. (2016). Engineering a wild-type diploid Saccharomyces cerevisiae strain for second-generation bioethanol production. Bioresour. Bioprocess 3:51. doi: 10.1186/s40643-016-0126-4
Li, X., Chen, Y., and Nielsen, J. (2019). Harnessing xylose pathways for biofuels production. Curr. Opin. Biotechnol. 57, 56–65. doi: 10.1016/j.copbio.2019.01.006
Livak, K. J., and Schmittgen, T. D. (2001). Analysis of relative gene expression data using real-time quantitative PCR and the 2(-Delta Delta C(T)) method. Methods 25, 402–408. doi: 10.1006/meth.2001.1262
Michael, D. G., Maier, E. J., Brown, H., Gish, S. R., Fiore, C., Brown, R. H., et al. (2016). Model-based transcriptome engineering promotes a fermentative transcriptional state in yeast. Proc. Natl. Acad. Sci. U.S.A. 113, E7428–E7437. doi: 10.1073/pnas.1603577113
Mishra, R., van Drogen, F., Dechant, R., Oh, S., Jeon, N. L., Lee, S. S., et al. (2017). Protein kinase C and calcineurin cooperatively mediate cell survival under compressive mechanical stress. Proc. Natl. Acad. Sci. U.S.A. 114, 13471–13476. doi: 10.1073/pnas.1709079114
Myers, K. S., Riley, N. M., MacGilvray, M. E., Sato, T. K., McGee, M., Heilberger, J., et al. (2019). Rewired cellular signaling coordinates sugar and hypoxic responses for anaerobic xylose fermentation in yeast. PLoS Genet. 15:e1008037. doi: 10.1371/journal.pgen.1008037
Nosaka, K., Onozuka, M., Konno, H., Kawasaki, Y., Nishimura, H., Sano, M., et al. (2005). Genetic regulation mediated by thiamin pyrophosphate-binding motif in Saccharomyces cerevisiae. Mol. Microbiol. 58, 467–479. doi: 10.1111/j.1365-2958.2005.04835.x
Osiro, K. O., Brink, D. P., Borgstrom, C., Wasserstrom, L., Carlquist, M., and Gorwa-Grauslund, M. F. (2018). Assessing the effect of d-xylose on the sugar signaling pathways of Saccharomyces cerevisiae in strains engineered for xylose transport and assimilation. FEMS Yeast Res. 18:fox096. doi: 10.1093/femsyr/fox096
Salusjarvi, L., Kankainen, M., Soliymani, R., Pitkanen, J. P., Penttila, M., and Ruohonen, L. (2008). Regulation of xylose metabolism in recombinant Saccharomyces cerevisiae. Microb. Cell Fact. 7, 18. doi: 10.1186/1475-2859-7-18
Sato, T. K., Tremaine, M., Parreiras, L. S., Hebert, A. S., Myers, K. S., Higbee, A. J., et al. (2016). Directed evolution reveals unexpected epistatic interactions that alter metabolic regulation and enable anaerobic xylose use by Saccharomyces cerevisiae. PLoS Genet. 12:e1006372. doi: 10.1371/journal.pgen.1006372
Souto-Maior, A. M., Runquist, D., and Hahn-Hagerdal, B. (2009). Crabtree-negative characteristics of recombinant xylose-utilizing Saccharomyces cerevisiae. J. Biotechnol. 143, 119–123. doi: 10.1016/j.jbiotec.2009.06.022
van Maris, A. J., Winkler, A. A., Kuyper, M., de Laat, W. T., van Dijken, J. P., and Pronk, J. T. (2007). Development of efficient xylose fermentation in Saccharomyces cerevisiae: xylose isomerase as a key component. Adv. Biochem. Eng. Biotechnol. 108, 179–204. doi: 10.1007/10_2007_057
Wei, S., Liu, Y., Wu, M., Ma, T., Bai, X., Hou, J., et al. (2018). Disruption of the transcription factors Thi2p and Nrm1p alleviates the post-glucose effect on xylose utilization in Saccharomyces cerevisiae. Biotechnol. Biofuels 11:112. doi: 10.1186/s13068-018-1112-1
Zhou, H., Cheng, J. S., Wang, B. L., Fink, G. R., and Stephanopoulos, G. (2012). Xylose isomerase overexpression along with engineering of the pentose phosphate pathway and evolutionary engineering enable rapid xylose utilization and ethanol production by Saccharomyces cerevisiae. Metab. Eng. 14, 611–622. doi: 10.1016/j.ymben.2012.07.011
Keywords: Saccharomyces cerevisiae, xylose metabolism, regulation of carbon metabolism, Thi2p, anaerobic fermentation, the post-glucose effect
Citation: Wei S, Bai P, Liu Y, Yang M, Ma J, Hou J, Liu W, Bao X and Shen Y (2019) A Thi2p Regulatory Network Controls the Post-glucose Effect of Xylose Utilization in Saccharomyces cerevisiae. Front. Microbiol. 10:1649. doi: 10.3389/fmicb.2019.01649
Received: 20 May 2019; Accepted: 03 July 2019;
Published: 17 July 2019.
Edited by:
Junbiao Dai, Shenzhen Institutes of Advanced Technology (CAS), ChinaReviewed by:
Xinqing Zhao, Shanghai Jiao Tong University, ChinaJiong Hong, University of Science and Technology of China, China
Chaoguang Tian, Tianjin Institute of Industrial Biotechnology (CAS), China
Copyright © 2019 Wei, Bai, Liu, Yang, Ma, Hou, Liu, Bao and Shen. This is an open-access article distributed under the terms of the Creative Commons Attribution License (CC BY). The use, distribution or reproduction in other forums is permitted, provided the original author(s) and the copyright owner(s) are credited and that the original publication in this journal is cited, in accordance with accepted academic practice. No use, distribution or reproduction is permitted which does not comply with these terms.
*Correspondence: Yu Shen, c2hlbnl1QHNkdS5lZHUuY24=