 Zhipeng Li
 Chunlong Mu1,3
 Junshi Shen
 Weiyun Zhu
- 1Laboratory of Gastrointestinal Microbiology, Jiangsu Key Laboratory of Gastrointestinal Nutrition and Animal Health, College of Animal Science and Technology, Nanjing Agricultural University, Nanjing, China
- 2Department of Special Animal Nutrition and Feed Science, Institute of Special Animal and Plant Sciences, Chinese Academy of Agricultural Sciences, Changchun, China
- 3National Center for International Research on Animal Gut Nutrition, Nanjing Agricultural University, Nanjing, China
The rumen bacteria in the solid, liquid, and epithelial fractions are distinct and play important roles in the degradation of urea nitrogen. However, the effects of urea on rumen bacteria from the three fractions remain unclear. In this study, 42 Hu lambs were fed a total mixed ration based on concentrate and roughage (55:45, dry matter basis) and randomly assigned to one of three experimental diets: a basal diet with no urea (UC, 0 g/kg), a basal diet supplemented with low urea levels (LU, 10 g/kg DM), and a basal diet supplemented with high urea levels (HU, 30 g/kg DM). After an 11-week feeding trial, six animals from each treatment were harvested. Rumen metabolites levels were measured, and bacteria of the rumen solid, liquid, and epithelial fractions were examined based on 16S rRNA gene sequencing. Under urea supplementation, the concentrations of ammonia and butyrate in the rumen increased, whereas the concentration of propionate decreased. The population of total protozoa was the highest in the LU treatment. Prevotella 1 was the most abundant genus in all samples. The unclassified Muribaculaceae, bacteria within the families Lachnospiraceae and Ruminococcaceae, and Christensenellaceae R7 were abundant in the solid and liquid fractions. Butyrivibrio 2 and Treponema 2 were the abundant bacteria in the epithelial fraction. Principal coordinate analysis showed separation of the solid, liquid and epithelial bacteria regardless of diet, suggesting that rumen fraction had stronger influences on the bacterial community than did urea supplementation. However, the influences on the bacterial community differed among the three fractions. In the solid and liquid fractions, Succinivibrionaceae UCG 001 and Prevotella 1 showed decreased abundance with dietary urea supplementation, whereas the abundance of Oscillospira spp. was increased. Howardella spp. and Desulfobulbus spp. were higher in the epithelial fraction of the UC and LU treatments relative to HU treatment. Comparisons of predictive function in the rumen solid, liquid, and epithelial fractions among the three treatments also revealed differences. Collectively, these results reveal the change of the rumen bacterial community to dietary urea supplementation.
Introduction
The ruminant livestock is an important contributor to the agricultural sector due to its production of meat and milk for human consumption; however, it is estimated that global meat and milk production will have to increase by more than 60% to meet the needs of the growing population (Huws et al., 2018). Moreover, ruminant livestock are a source of environmental pollution, excreting approximately 70% of ingested nitrogen (Huws et al., 2018). Therefore, the improvement of ruminant feed utilization has both economic and environmental benefits. For ruminants, the type and quality of protein feed play important roles in animal production because they affect the productivity of meat and milk (Schwab and Broderick, 2017). In addition, the availability of high-quality protein feed is challenged by land constraints. Thus, efforts aimed at increasing protein utilization efficiency will have considerable influences on ruminant livestock production.
In the rumen, microbiota degrade the feed protein into ammonia, which is used to synthesize the microbial proteins required for animal growth; they contribute up to 55% of the protein absorbed in the duodenum in lactating cattle (Schwab and Broderick, 2017; Huws et al., 2018). Therefore, the rumen microbiota are a key factor affecting protein utilization efficiency. The released ammonia in the rumen can be absorbed across the epithelium into the liver and then detoxified to urea, which is then recycled into the rumen and rapidly hydrolyzed to ammonia by ureases from ureolytic bacteria (Patra, 2015; Jin et al., 2017). Therefore, urea is not only a cost effective non-protein nitrogen (NPN) source that provides ammonia, which is obligately required by the fiber-digesting bacteria, but also acts a chemical component that can be measured to study the mechanisms underlying NPN metabolism by the rumen microbiota.
Recent studies indicate that the rumen microbial ecosystem is composed of three communities associated with different microenvironments: a solid-, a liquid-, and an epithelium-associated bacterial community (Cho et al., 2006; Sadet et al., 2007; Liu et al., 2016; De Mulder et al., 2017; Schären et al., 2017). The solid-adherent bacteria play key roles in fiber digestion (McAllister et al., 1994). The liquid-associated bacteria transmit bacteria from the solid-adherent biofilms to newly ingested feed (De Mulder et al., 2017). The epithelial community is diverse and distinct from the solid- and liquid-associated bacterial communities; it is associated with volatile fatty acid (VFA) fermentation, oxygen consumption, urea hydrolysis, and recycling of nitrogen and tissue (Cheng et al., 1979; Wallace et al., 1979). Although previous studies have revealed that dietary urea affects the rumen bacteria and methanogens of finishing bulls (Zhou et al., 2017) and metabolism in the rumen of dairy cows (Jin et al., 2018), it is unclear how urea supplementation affects the solid-, liquid-, and epithelium-associated bacterial communities. Additionally, a recent study suggested that rumen bacteria are specialized on an ecological basis with respect to nutrient utilization (Shaani et al., 2018). In addition, it has been documented that the ureolytic bacterial communities in the solid and liquid fractions of the rumen are different from the ureolytic bacterial community in the epithelial fraction (Jin et al., 2017). Furthermore, the rumen epithelial bacteria were found to remain largely unchanged in community structure when the feed was transitioned from a silage- and concentrate-based ration (total mixed ration, TMR) to pasture (Schären et al., 2017). Therefore, we hypothesize that the structure of the bacterial community in the solid, liquid and epithelial fractions in the rumen may be differently altered upon dietary supplementation with urea.
Therefore, the present study aimed to (1) examine the changes in the main fermentation parameters in rumen contents induced by exogenous urea supplementation in Hu lambs and (2) reveal the effects of urea supplementation on the bacterial communities and the predictive functions of the solid, liquid, and epithelial fractions by performing high-throughput sequencing of the 16S rRNA gene.
Materials and Methods
Experimental Design, Animals and Diets
The experiment was conducted at a Hu sheep breeding farm in Jiangsu Province, China, with a randomized complete block design. A total of 42 male Hu lambs were assigned to three blocks according to initial body weight (24.3 ± 1.7 kg). The Hu lambs in each block were fed a TMR based on concentrate and roughage [55:45, dry matter (DM) basis] and randomly assigned to one of three experimental diets (Table 1): a basal diet with no urea (UC, 0 g/kg DM), a basal diet supplemented with a low concentration of urea (LU, 10 g/kg DM), and a basal diet supplemented with a high concentration of urea (HU, 30 g/kg DM). Each dietary treatment included fourteen Hu lambs. All diets met the energy requirements for meat-producing sheep weighing 25 kg, with an assumed average daily gain (ADG) of 200 g (Ministry of Agriculture and Rural Affairs of the People’s Republic of China, 2004). The crude protein (CP) content in the diets of the UC and LU treatment groups was less than the requirement for meat-producing sheep, whereas that in the diet for the HU treatment group was more than the required amount. In our previous study, quadratic effects of urea supplementation on DM intake (DMI) and ADG were observed, and the LU treatment (corresponding to the typical inclusion level) yielded the highest DMI and ADG among the treatments (Xu et al., 2019).
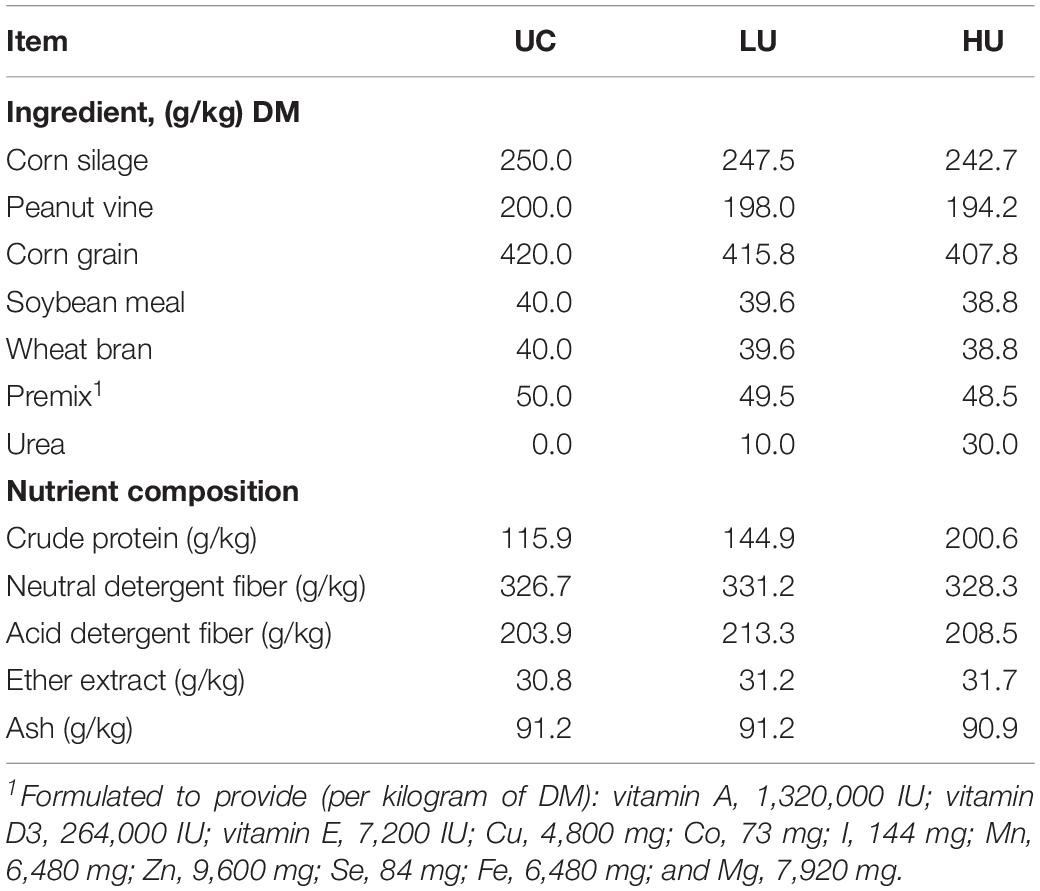
Table 1. Ingredients and chemical compositions of the experimental diets.
Every two lamb were reared in an individual, indoor pen (4 × 4 m) with wooden slatted floors, were offered a TMR twice daily (at 07:00 h and 19:00 h) and had free access to drinking water. The experiment was conducted over 11 weeks, with 1 week of adaptation followed by 10 weeks of dietary treatment. The experimental procedures and approaches in this study were approved by the Animal Care and Use Committee of Nanjing Agricultural University.
Sample Collection
At the end of the experiment, the final body weights of 6 Hu lambs from each treatment were recorded, and then, the sheep were slaughtered according to the procedures of the Animal Care and Use Committee of Nanjing Agricultural University (Protocol number: SYXK2017-0007).
The rumen content of each Hu lamb was first homogenized by hand using disposable polyethylene gloves and then mixed to reduce localized effects. To obtain the liquid and solid samples, the whole rumen contents were strained through four layers of cheesecloth. Approximately 30 ml of strained liquid and the remaining pellets, representing the solid fraction, were collected in sterilized tubes. The pH of the rumen fluid was immediately measured using a portable pH meter (Ecoscan pH 5, Eutech Instruments, Singapore). To obtain the epithelial samples, the rumen walls were rinsed with cold sterile saline solution (0.9% w/v NaCl) three times after removal of the rumen contents. Epithelial samples from an approximately 1 × 1 cm area of the rumen epithelium were obtained via scraping with a sterilized glass slide. The rumen solid, liquid, and epithelial samples were immediately frozen in liquid nitrogen and then stored at –80°C until further analysis.
Measurement of Rumen Fermentation Parameters
To measure the rumen fermentation parameters, 0.2 ml of 25% HPO3 was added to 1 ml of rumen fluid, and the VFA levels were then measured using gas chromatography (7890A, Agilent, United Kingdom) as previously described by Mao et al. (2008). Another 1 ml of rumen fluid was used to determine the concentration of NH3-N (ammonia) using a colorimetric method (Chaney and Marbach, 1962).
DNA Extraction, PCR Amplification, Library Construction and Sequencing
Microbial genomic DNA was extracted from the rumen solid, liquid, and epithelial samples according to a bead-beating method (Yu and Morrison, 2004) using a mini-bead beater (Biospec Products, Bartlesville, OK, United States). The DNA integrity and quantity were determined using 1.0% agarose gel electrophoresis and a NanoDrop ND-1000 instrument (Thermo Scientific, Wilmington, DE, United States).
To identify the rumen bacteria in the three fractions, the primers 341F (5′-CCTACGGGAGGCAGCAG-3′) and 806R (5′-GGACTACHVGGGTWTCTAAT-3′) were used to amplify the bacterial 16S rRNA gene V4 region (Human Microbiome Project Consortium, 2012). PCR was conducted in triplicate, and the products were purified using the QIAquick PCR Purification Kit (Qiagen, CA, United States). The purified amplicons were quantified using a QuantiFluor® -P fluorometer (Promega, CA, United States) and then pooled into one sample based on equimolar concentrations. Finally, the obtained amplicons were sequenced on an Illumina MiSeq platform to produce 250-bp paired-end reads.
Sequences Analysis
The paired-end sequences were first assembled into contiguous sequences (contigs) using FLASH (Magoč and Salzberg, 2011) and then used for standard quality control by applying the default parameters in QIIME 1.9.1 (Caporaso et al., 2010). Then, the retained sequences were clustered into operational taxonomic units (OTUs) using UPARSE at 97% sequence identity (Edgar, 2013). Potential chimeras were identified and removed using UCHIME (Edgar et al., 2011). The most abundant sequences within each OTU were selected as the representative sequences and applied for the taxonomic classification based on the SILVA database (version 123) (Quast et al., 2013) using the RDP classifier with a 0.80 confidence threshold (Wang et al., 2007). The representative sequences within each OTU were aligned using MUSCLE (Edgar, 2004), and the alignment was used to construct a phylogenetic tree using FastTree (Price et al., 2009). Singletons were removed, and the sequences from each sample were then subsampled to the minimum numbers to decrease the effects of sequencing depth. The Shannon and Chao1 indices were calculated using QIIME 1.9.1 (Caporaso et al., 2010). Finally, we used phylogenetic investigation of communities by reconstruction of unobserved states (PICRUSt) to predict functional profiles of rumen microbiota resulting from reference-based OTU picking against the Greengenes database (Langille et al., 2013). The predicted genes were then summarized according to Kyoto Encyclopedia of Genes and Genomes (KEGG) pathways.
Principal coordinates analysis (PCoA) was performed and group differences based on unweighted UniFrac distance, weighted UniFrac distance and Bray–Curtis dissimilarity matrix were determined to reveal the differences in the bacterial communities across the three treatments. Analysis of similarities (ANOSIM) was performed to indicate group similarity, where 0 = indistinguishable and 1 = dissimilar (Fierer et al., 2010). Adonis was employed to describe the strengths and significance of the differences among the microbial communities. For ANOSIM and Adonis analyses, the p-values were determined based on 999 permutations. The sequences from the present study have been deposited in the SRA database under accession number PRJNA541835.
Quantitative Real-Time PCR
The quantitative PCR was performed on a ABI 7300 real-time PCR System (Life Technologies, CA, United States) using SYBR Premix Ex Taq dye (TaKaRa Biotechnology, Dalian, China). The protozoal 18S rRNA primer (Sylvester et al., 2004) reported in previous study was used for the quantitative PCR. Each 20 μl reaction mixture contained 10 μl SYBR Premix Ex TaqTM (TaKaRa Biotechnology, Dalian, China), 0.4 μl of each primer (10 μM), 0.4 μl ROX Reference Dye (TaKaRa Biotechnology, Dalian, China), 6.8 μl of nuclease-free water and 2 μl of the template. Copies of 18S rRNA gene was quantified in triplicate. A standard curve was prepared by using a 10-fold serial dilutions of purified plasmid DNA containing the 18S rRNA gene sequence. The total numbers of gene copies were expressed as log10 numbers of marker loci gene copies per gram of sample.
Statistical Analysis
Statistic analyses of the rumen fermentation parameters were performed using the PROC MIXED procedure of SAS 9.4 (SAS Institute Inc., Cary, NC, United States), and differences were considered to be statistically significant when the p-values were ≤0.05. For the comparison of bacterial genera and alpha diversity indices among the three rumen fractions under the three treatments, we used the Aligned Ranking Transform in R software and then used the Wilcoxon rank-sum test to analyze the difference between groups when the interaction was significant. All p values were corrected using the Benjamini–Hochberg false discovery rate (q-value < 0.05), and p < 0.05 was considered statistically significant. Values are expressed as the mean ± standard deviation (SD) unless otherwise indicated.
Results
Rumen Fermentation Parameters of the Lambs in the Three Treatment Groups
Total VFA concentration and pH did not significantly differ among the three treatments (Table 2). The concentrations of ammonia (p < 0.01) and butyrate (p = 0.04) were increased with urea supplementation relative to the concentration under UC treatment, whereas the molar concentration of propionate was decreased (p = 0.04). In addition, the molar concentration of isovalerate in the UC and LU treatments was significantly lower than that in the HU treatment (p < 0.01).
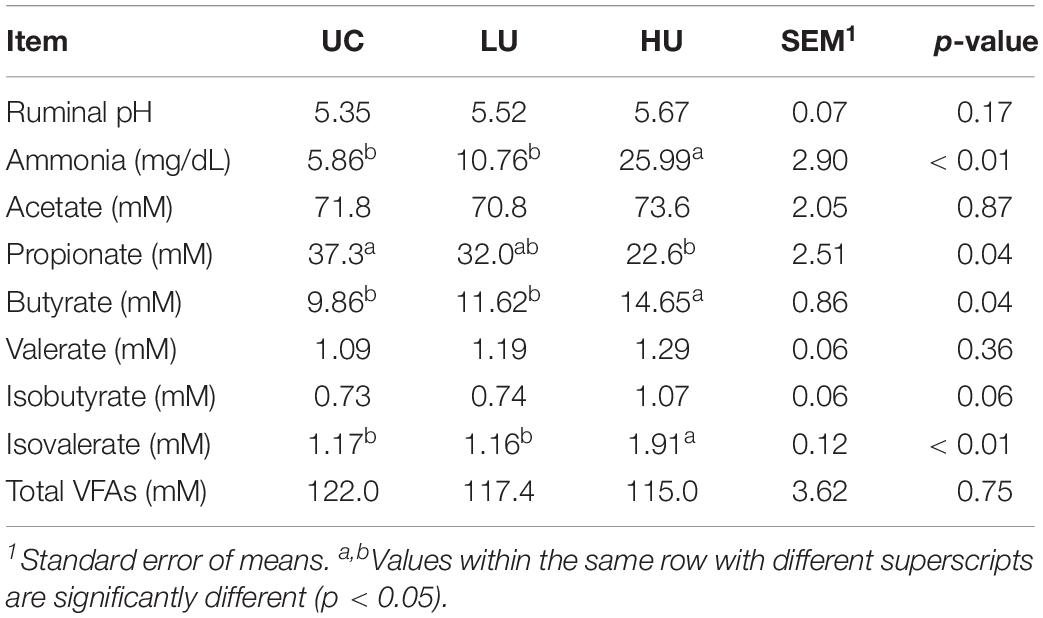
Table 2. Differences in the rumen fermentation parameters of lambs among the three treatments.
Summary of Sequence Analysis of the Bacterial 16S rRNA Gene
A total of 842,698, 744,994, and 777,235 high-quality 16S rRNA gene sequences were obtained from the solid, liquid, and epithelial samples, respectively. On average, 46,816, 41,388, and 43,179 sequences were generated for each sample from the solid, liquid and epithelial samples, respectively. After subsampling, based on 97% sequence similarity, a total of 3,636, 3,816, and 2,971 OTUs were obtained for the solid (mean = 1,748), liquid (mean = 1,734) and epithelial (mean = 1,486) samples, respectively.
The results showed that the sequencing depth covered more than 98% of the bacterial community, ranging from 97.6% to 98.9%. The number of OTUs and Chao 1 index value were significantly higher in the solid and liquid fractions than those in the epithelial faction (Table 3). In addition, the number of OTUs and the Shannon and Chao1 index values were higher in the HU treatment than in the UC or LU treatment for all three fractions (Table 3). Moreover, within the epithelial fraction, the number of OTUs and the Chao1 index value in the HU treatment were significantly higher than those in the LU treatment.
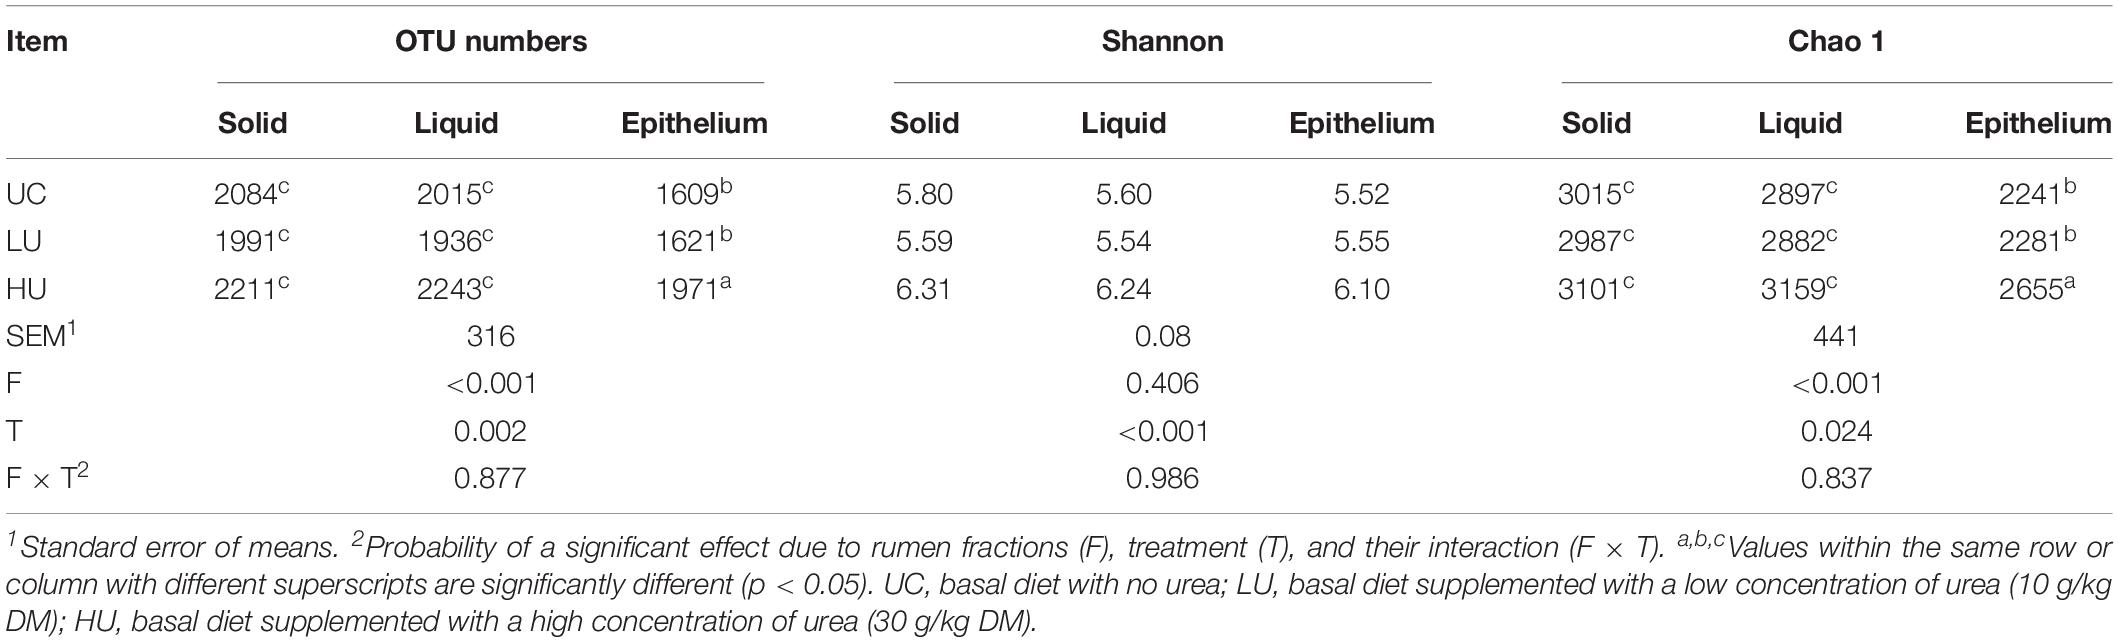
Table 3. Comparison of diversity and richness indices among the solid, liquid, and epithelial fractions under the tree treatments.
The PCoA results showed that the bacterial communities from the three fractions were separated from one another based on Bray–Curtis dissimilarity matrix (Figure 1A, ANOSIM: p = 0.001; Adonis: p = 0.001), unweighted UniFrac distance (Figure 1B, ANOSIM: p = 0.001; Adonis: p = 0.001), and weighted UniFrac distance (Figure 1C, ANOSIM: p = 0.001; Adonis: p = 0.001).
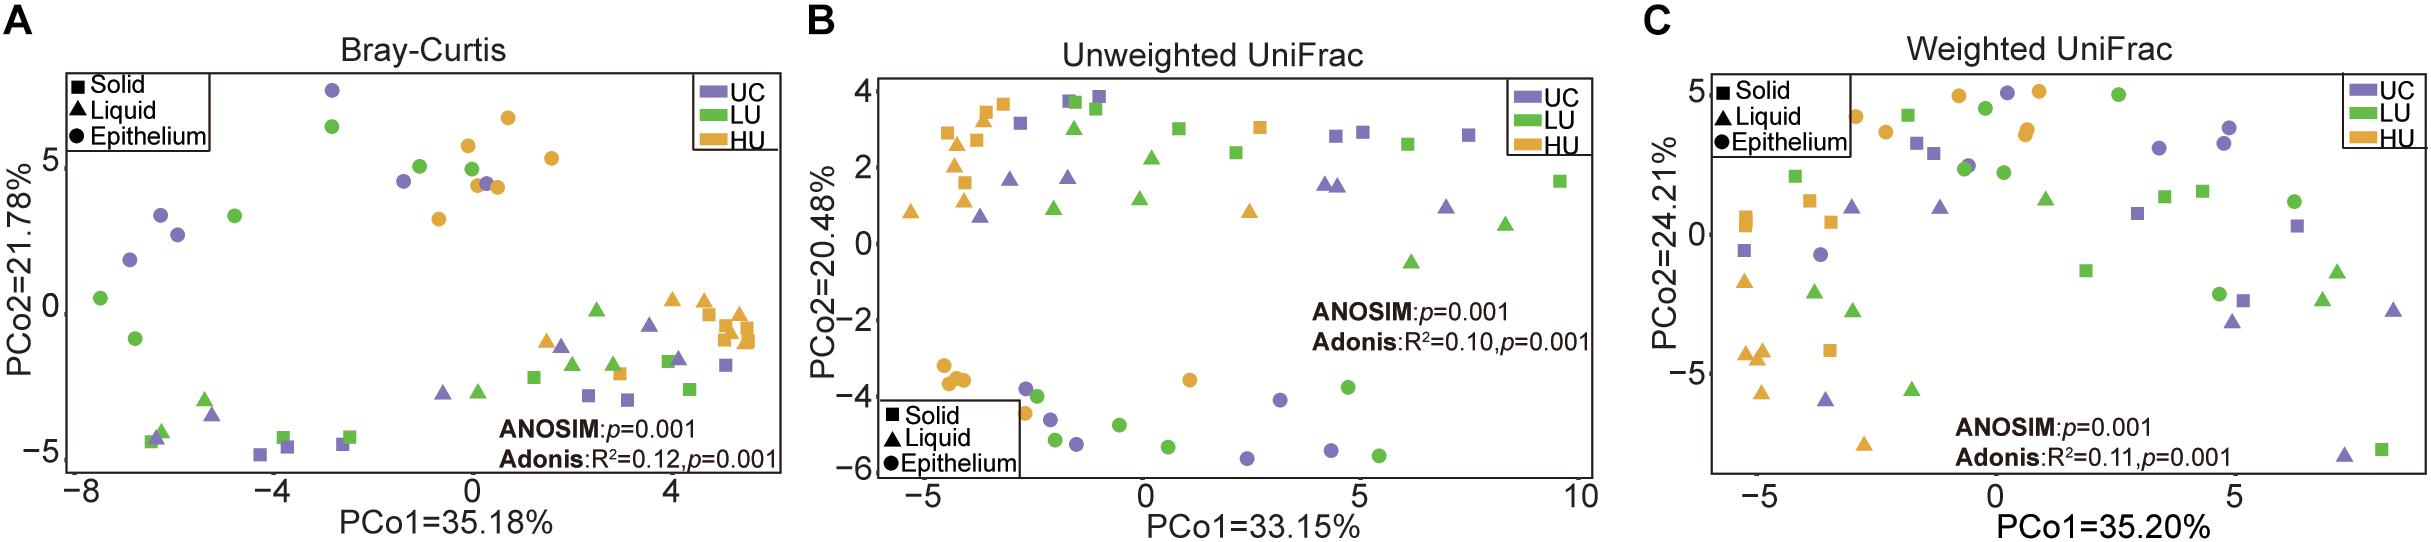
Figure 1. Principal coordinates analysis (PCoA) revealing the separation of the rumen bacteria in the three fractions from the three treatments based on Bray–Curtis dissimilarity matrix (A), unweighted UniFrac distance (B), and weighted UniFrac distance (C). UC, basal diet with no urea; LU, basal diet supplemented with a low concentration of urea (10 g/kg DM); HU, basal diet supplemented with a high concentration of urea (30 g/kg DM).
In order to reveal the difference among the three fractions, we compared the relative abundance of bacterial genus (Table 4). The prevalence of Prevotella 1, the unclassified bacteria within the family Muribaculaceae, Christensenellaceae R7, Ruminococcaceae NK4A214, Lachnospiraceae NK3A20, the unclassified bacteria within the family Lachnospiraceae, Ruminococcaceae UCG 014, and Ruminococcus 2 were higher in the rumen solid and liquid fractions than in the epithelium fraction. Whereas, the genera Treponema 2, Butyrivibrio 2, Desulfobulbus, and Campylobacter were higher in the epithelium fraction than in the solid and liquid fractions.
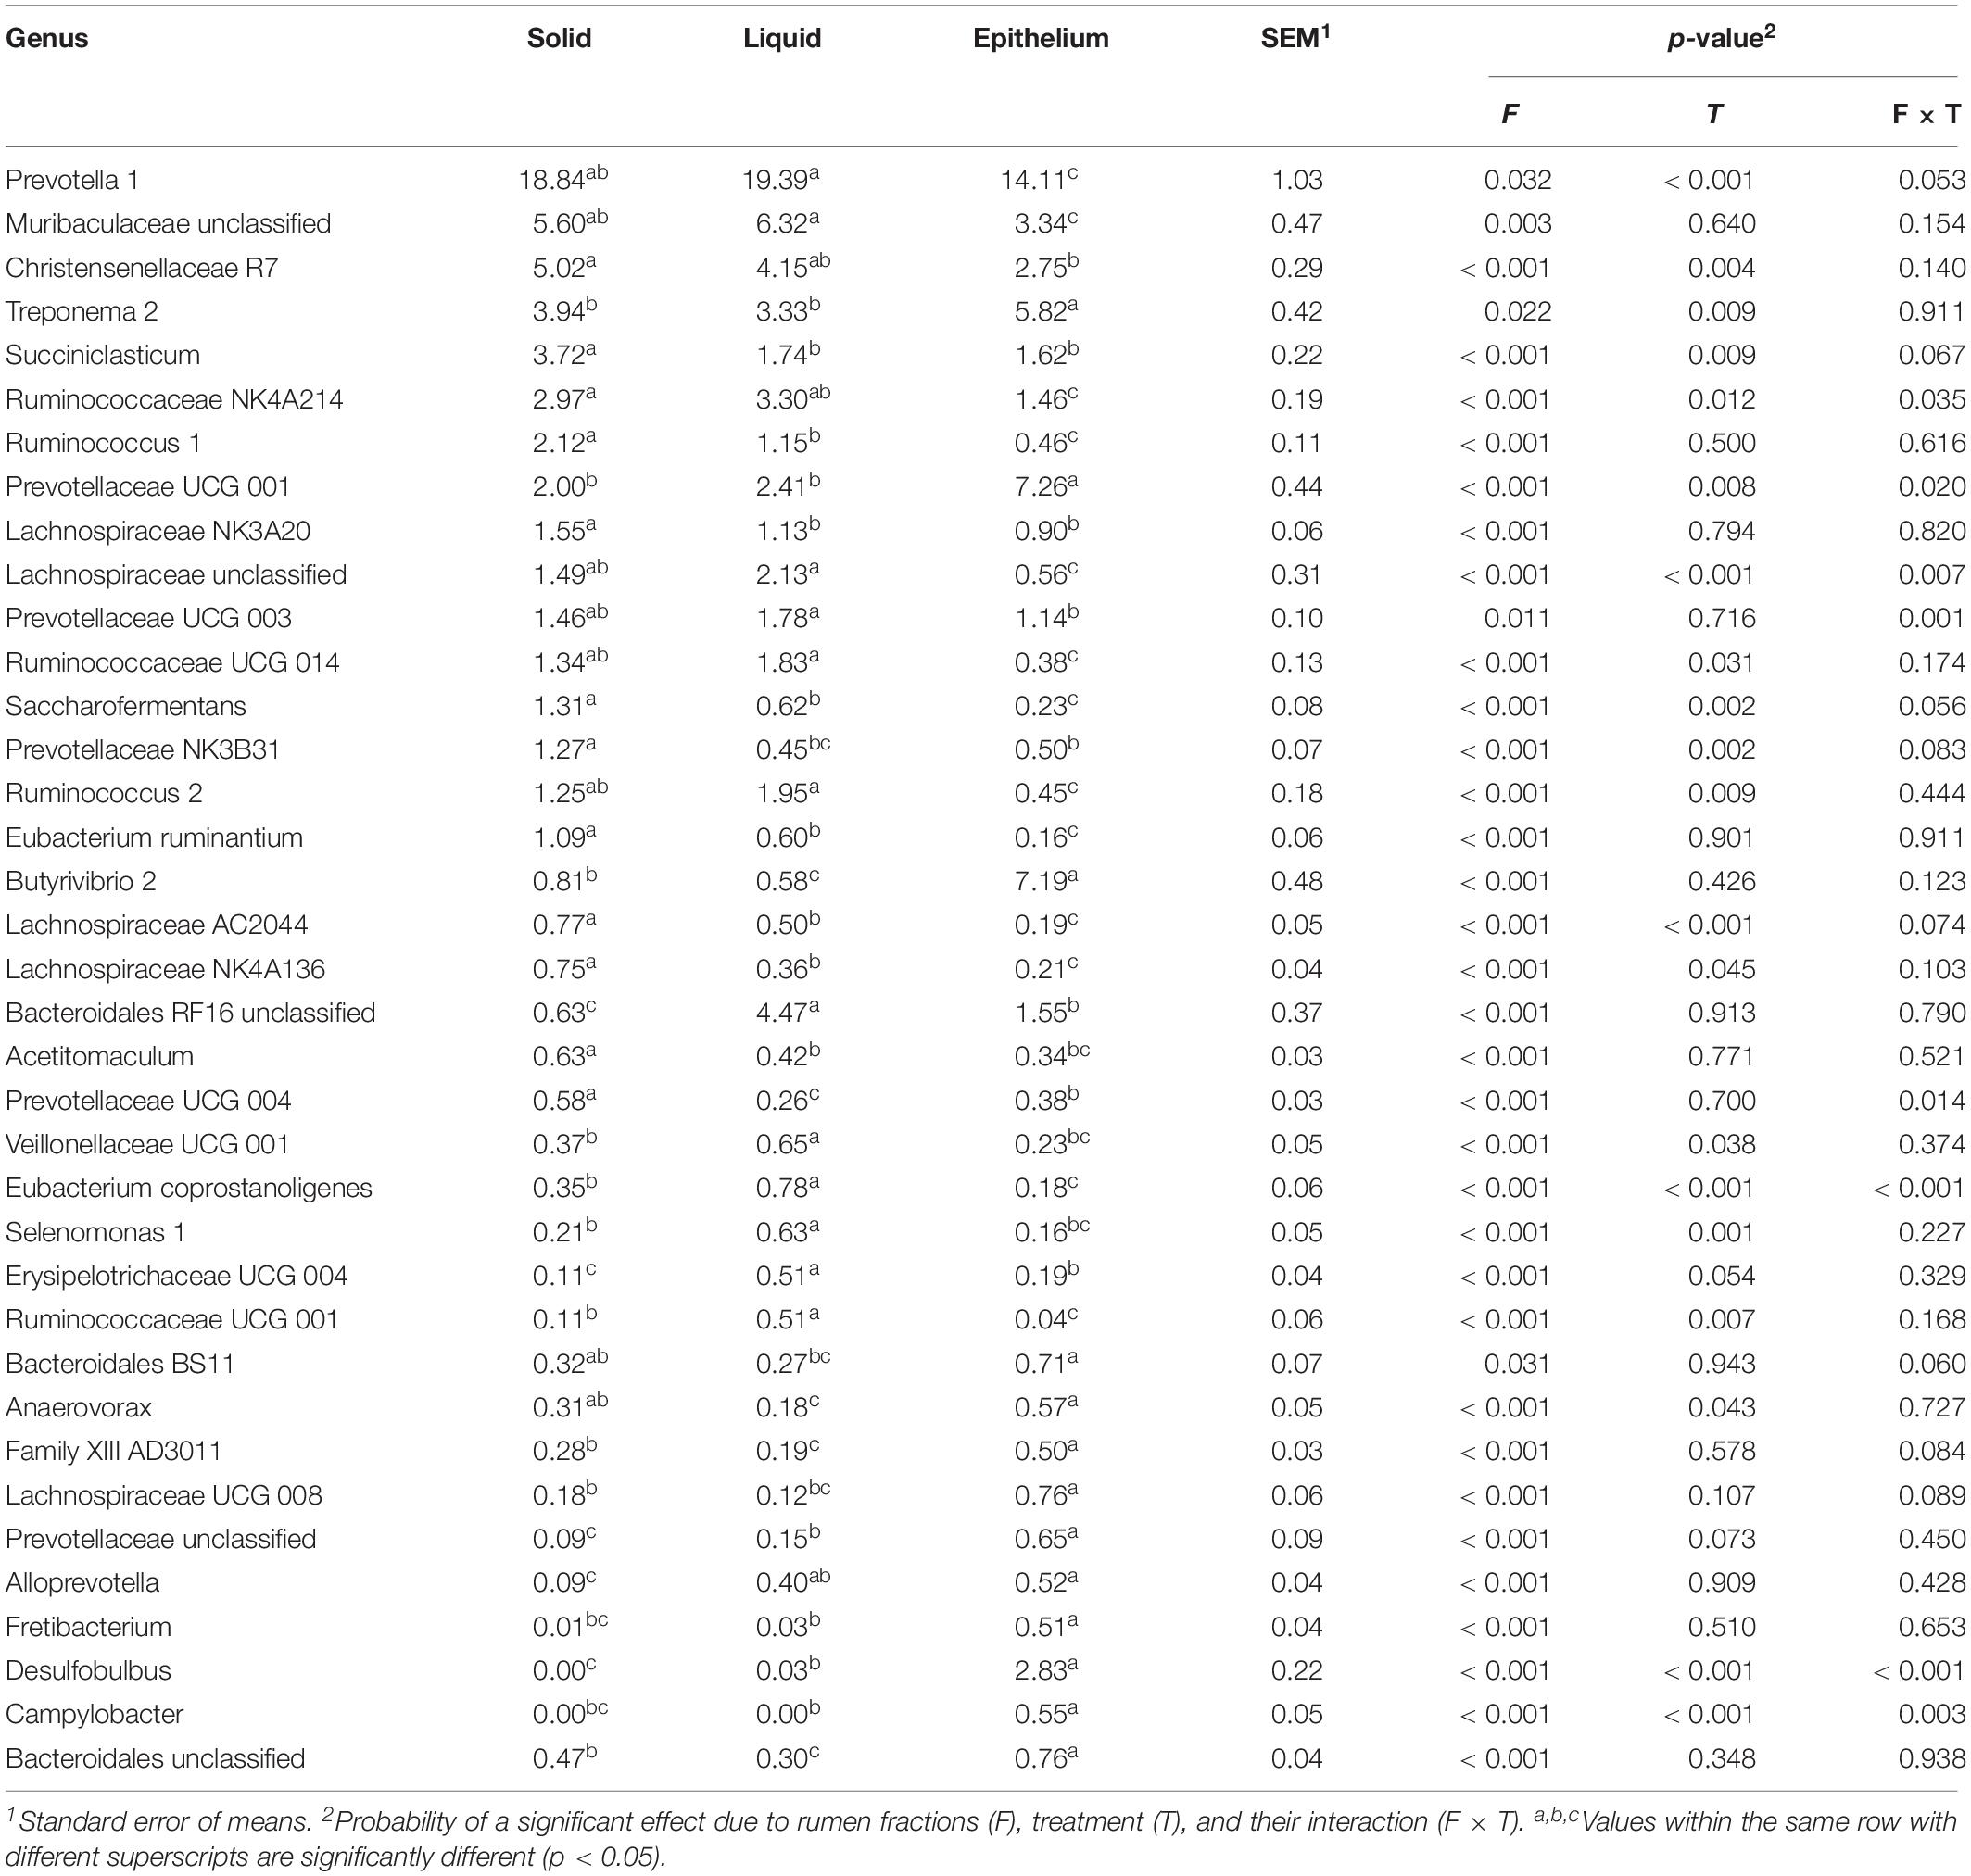
Table 4. The effect of rumen fractions on the relative abundances (%) of bacterial genus.
To assess functional profiles of rumen microbiota, we applied PICRUSt to predict the potential functions and compared the difference among the three fractions (Table 5). At KEGG level 2, the relative abundance of amino acid metabolism, carbohydrate metabolism, replication and repair, and translation pathways were significantly higher in the rumen solid and liquid fractions than in the rumen epithelial fraction. However, the pathways of energy metabolism, cell motility, and signal transduction accounted for higher abundance in rumen epithelial fraction than in the rumen solid and liquid fractions. In addition, because rumen microbiota are clearly separated among the three fractions, thus we compared the bacterial community composition and potential function in the rumen solid, liquid, and epithelial fractions, respectively.
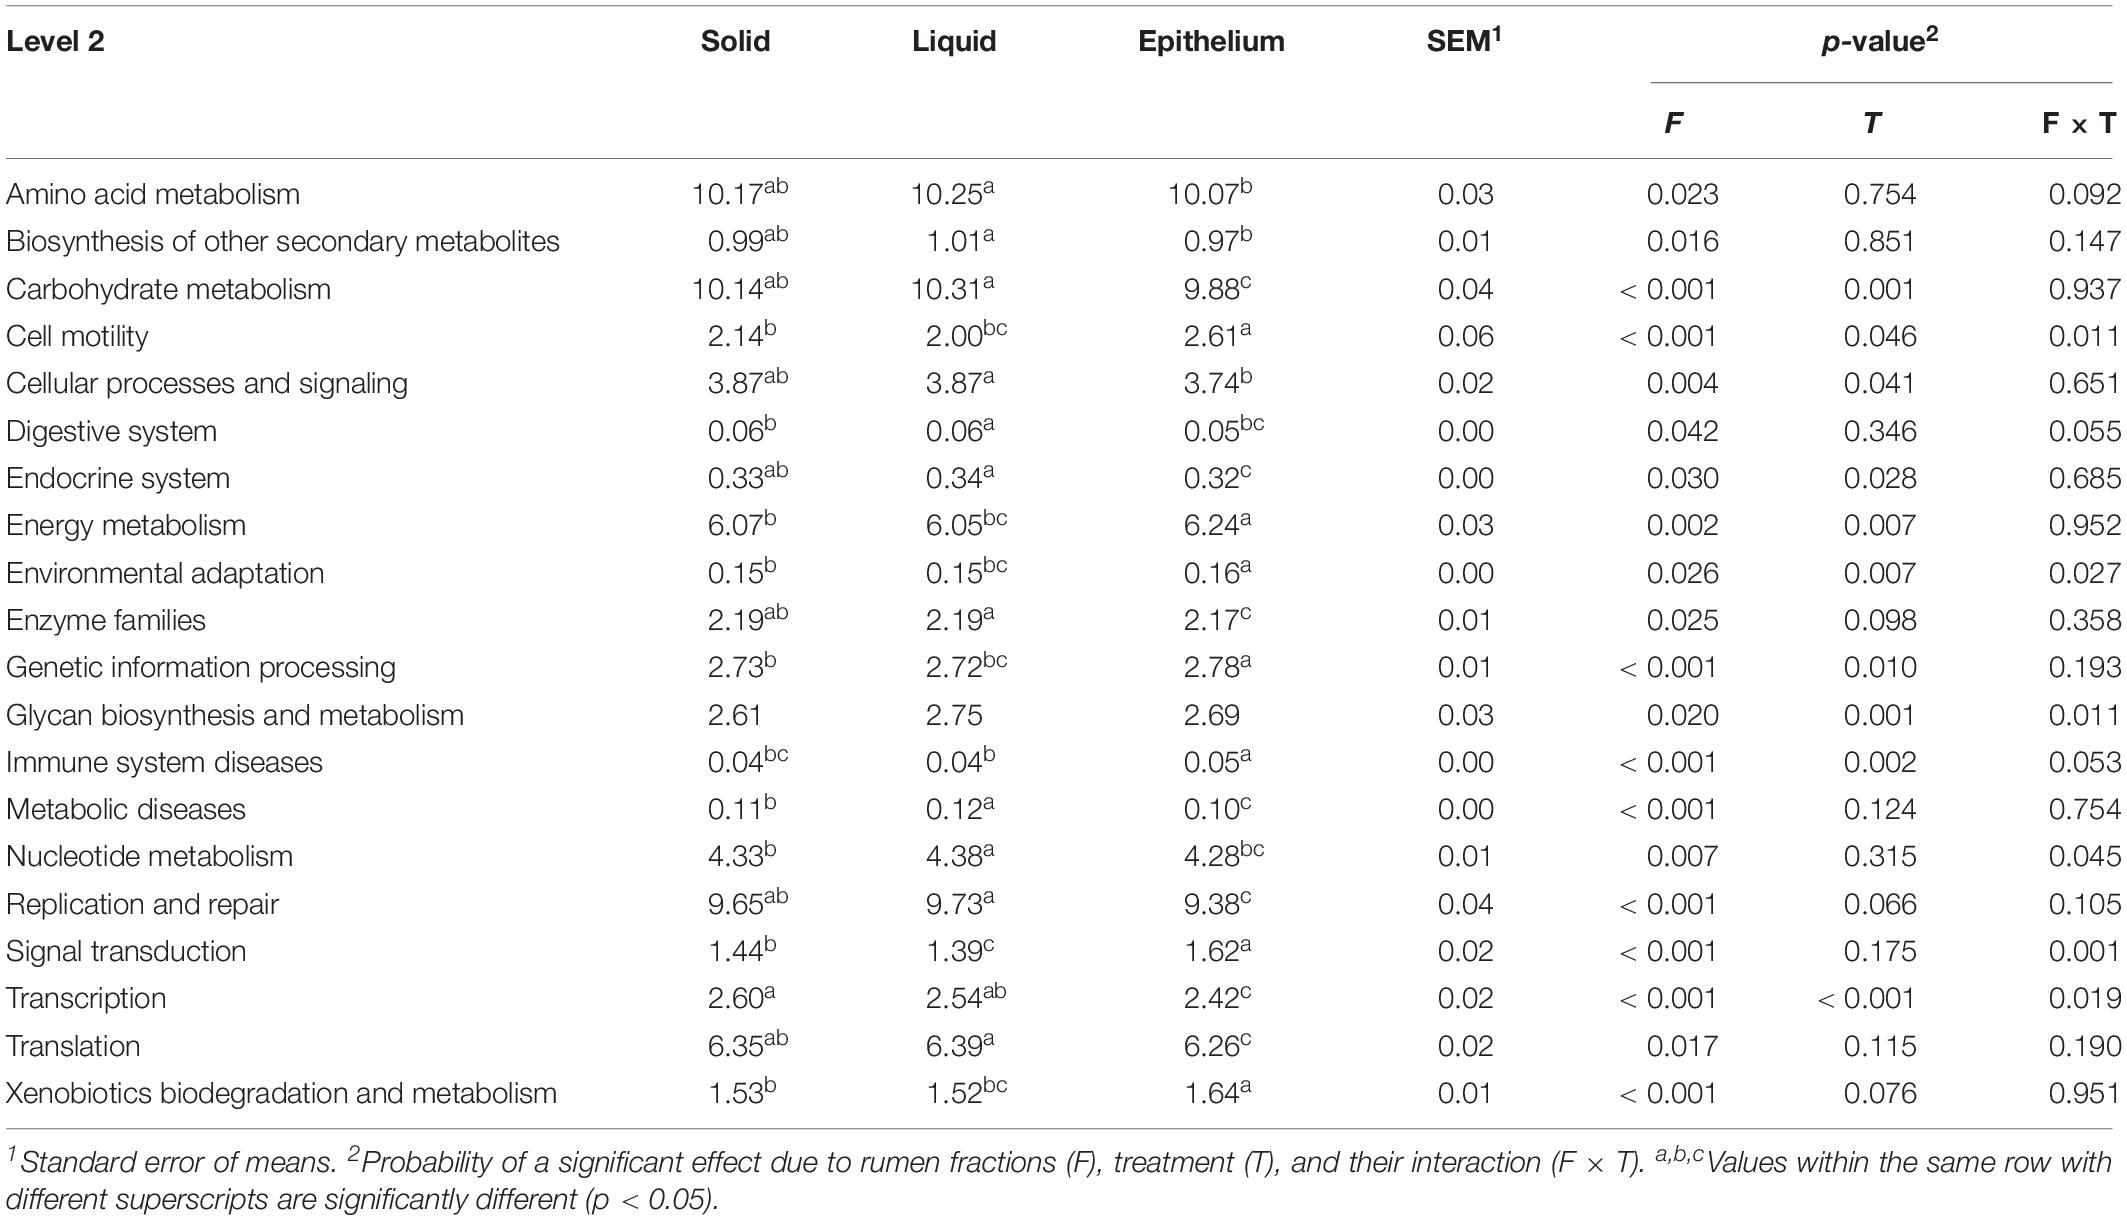
Table 5. The effect of fractions on the predictive function (%) of rumen microbiota.
Bacterial Community and Potential Function in the Solid Fraction Under the Three Treatments
A total of 18, 16, and 17 phyla were identified in the rumen solid fraction in the UC, LU, and HU treatment groups, respectively (Figure 2A). The phylum Bacteroidetes predominated the rumen solid fraction of the UC (40.0 ± 4.0%) and LU (43.2 ± 10.2%) treatments, followed by the phylum Firmicutes (UC = 34.7 ± 8.4%, LU = 29.8 ± 6.9%). However, in the HU treatment, Firmicutes (41.5 ± 4.7%) was the most abundant phylum in the solid fraction, followed by the phylum Bacteroidetes (37.7 ± 3.9%). Proteobacteria was the third most abundant phylum in the rumen solid fraction regardless of diet (UC = 16.9 ± 9.9%, LU = 17.8 ± 10.9%, HU = 9.3 ± 6.9%).
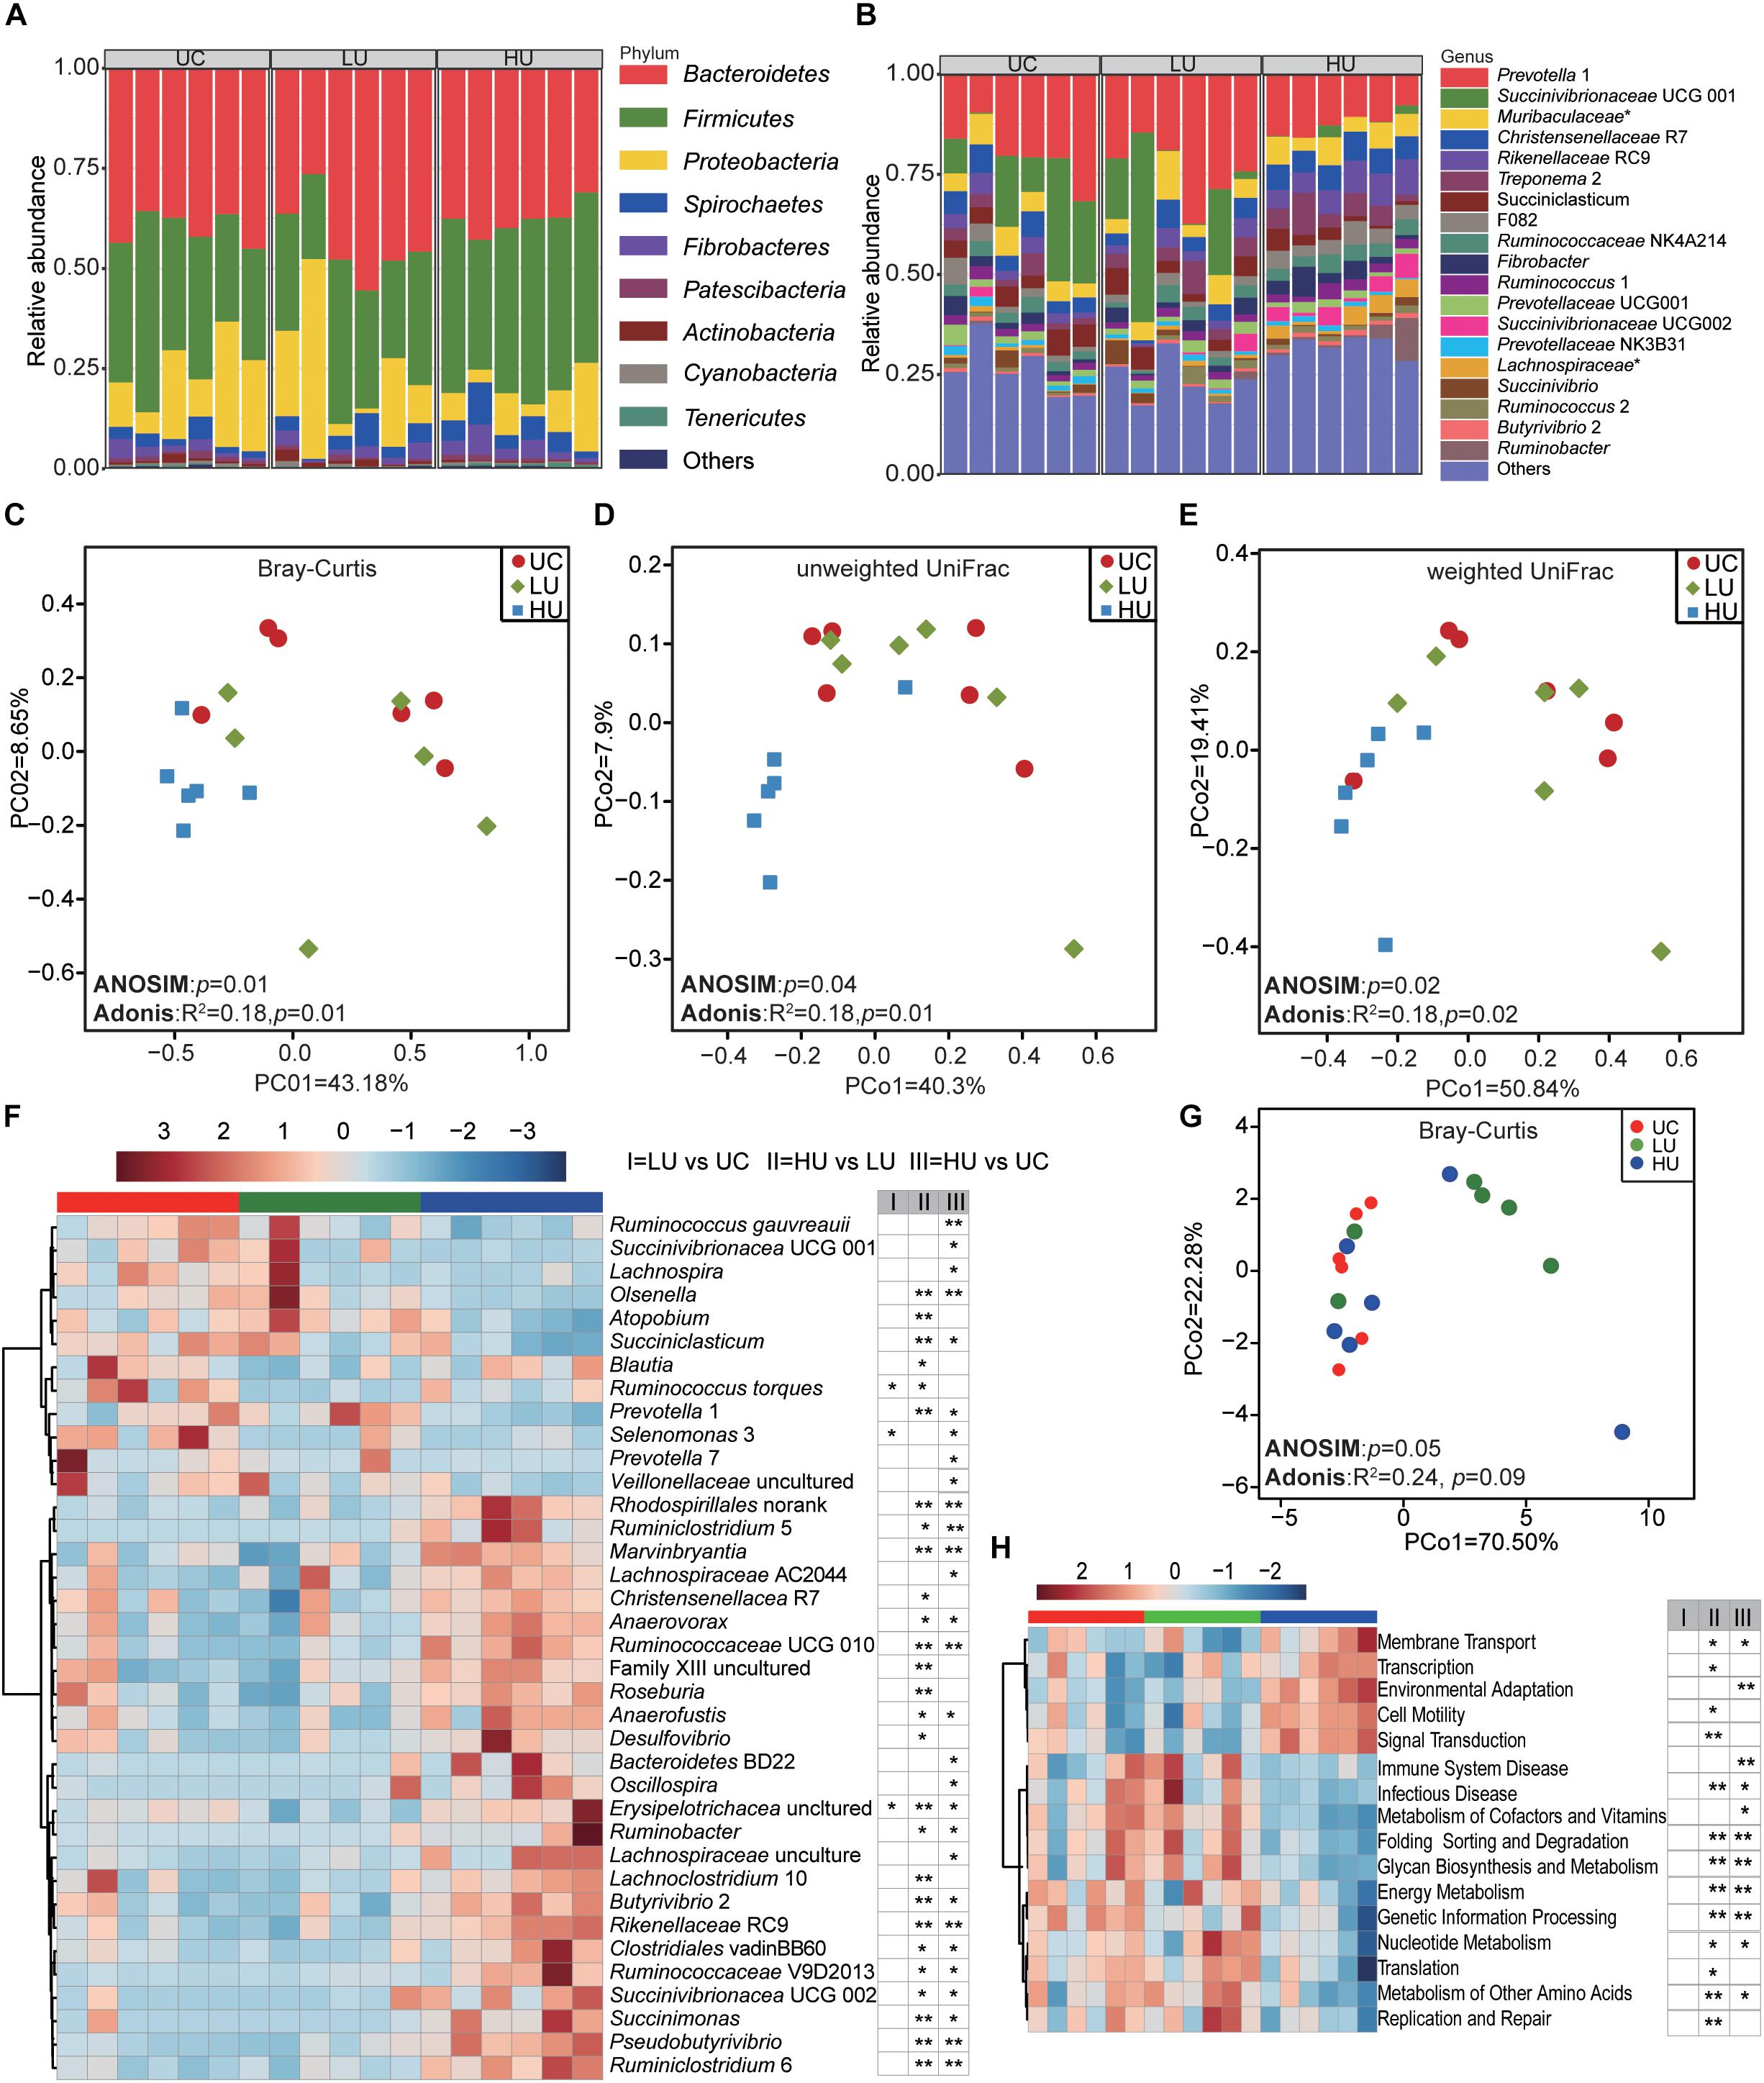
Figure 2. Bacterial community compositions and potential function in the rumen solid fractions under the three treatments. Bacterial compositions in the rumen solid fractions of the UC, LU, and HU treatments at the phylum (A) and genus (B) levels. PCoA revealing the separation of the microbial communities in the rumen solid fractions among the three treatments based on Bray–Curtis dissimilarity matrix (C), unweighted UniFrac distance (D) and weighted UniFrac distance (E). Heatmap (F) showing significant differences of bacterial genera in the solid fractions among the UC, LU, and HU treatments. PCoA (G) plot revealing differences in predicted microbial functions based on Bray–Curtis dissimilarity matrix. Heatmap (H) revealing the differences of the predictive function profiles at KEGG level 2 in the rumen solid fractions among the three treatments. * p < 0.05, ** p < 0.01. UC, basal diet with no urea; LU, basal diet supplemented with a low concentration of urea (10 g/kg DM); HU, basal diet supplemented with a high concentration of urea (30 g/kg DM).
A total of 190, 195, and 211 bacterial genera were identified in the UC, LU, and HU treatments, respectively (Figure 2B). In the UC and LU treatments, Prevotella 1 (UC = 19.9 ± 7.2%, LU = 24.1 ± 8.0%) was the most abundant genus in the rumen solid fraction, followed by Succinivibrionaceae UCG 001 (UC = 14.5 ± 10.6%, LU = 14.4 ± 9.1%) and the unclassified bacterium within the family Muribaculaceae (UC = 5.4 ± 1.6%, LU = 5.8 ± 3.3%); together, these taxa accounted for approximately 40% of the overall bacterial composition. In the HU treatment, the genus Prevotella 1 (12.4 ± 3.0%) was predominant in the rumen solid fraction, followed by Rikenellaceae RC9 (6.8 ± 1.8%), Christensenellaceae R7 (6.2 ± 0.6%), the unclassified bacterium within the family Muribaculaceae (5.5 ± 1.7%), and Treponema 2 (5.2 ± 2.9%); together, these taxa accounted for more than 36% of the overall bacterial composition.
The PCoA plots showed that the composition of bacterial community differed significantly among the three treatments based on Bray–Curtis dissimilarity matrix (Figure 2C, ANOSIM: p = 0.01; Adonis: p = 0.01), unweighted UniFrac distance (Figure 2D, ANOSIM: p = 0.04; Adonis: p = 0.01) and weighted UniFrac distance (Figure 2E, ANOSIM: p = 0.02; Adonis: p = 0.02). Moreover, comparison of group distances across the three treatments showed that the bacterial community differed significantly between the LU and HU treatments (Supplementary Figure S1).
We then applied the non-parametric Wilcoxon rank-sum test to conduct pair-wise comparisons among the three treatments. The result showed that a total of 37 bacterial genera were significantly different between one or more pairs of treatments (Figure 2F and Supplementary Table S1). The relative abundances of Ruminococcus gauvreauii, Ruminococcus gauvreauii, Succinivibrionaceae UCG 001, and Selenomonas 3 were significantly higher in the UC treatment than in the LU or HU treatment. The relative abundances of the genera Prevotella 1, Atopobium, and Olsenella were significantly higher in the LU treatment than in the UC or HU treatment, whereas the relative abundance of Christensenellaceae R7 was lower in the LU treatment than in the other treatments. The relative abundances of Rikenellaceae RC9, Ruminobacter spp., Succinivibrionaceae UCG 002, Anaerofustis spp., Ruminococcaceae UCG 010, Succinimonas spp., Butyrivibrio 2, Pseudobutyrivibrio spp., Ruminococcaceae V9D2013, Roseburia spp., Desulfovibrio spp., Ruminiclostridium 6, Marvinbryantia spp., Anaerovorax spp., Ruminiclostridium 5, and Lachnospiraceae AC2044 were significantly increased in the HU treatment relative to the corresponding abundances in the UC or LU treatment. However, the relative abundances of Succiniclasticum spp., Lachnospira spp., Prevotella 7, and the unclassified bacteria within the family Veillonellaceae were significantly lower in the HU treatment than in the UC or LU treatments.
The PCoA result of all KOs based on Bray-Curtis dissimilarity matrix showed that the functional profiles in the rumen solid fraction of the HU treatment tended to separate the UC and LU treatments (Figure 2G, ANOSIM: p = 0.05; Adonis: p = 0.09). Comparison of KEGG pathways at level 2 among the three treatments indicated that energy metabolism, genetic information processing and metabolism of cofactors and vitamins pathways were higher in the UC and HU treatments than those in the LU treatment, while replication and repair and translation pathways were higher in the LU treatment (Figure 2H). At KEGG level 3, a total of 81 pathways were significantly different (Supplementary Table S2). For example, the pathways of alanine, aspartate and glutamate metabolism, amino acid related enzymes, and purine metabolism were higher in the LU treatment than those in the UC and HU treatments. On the contrary, transporters pathway was lower in the HU treatment relative to that in the UC or LU treatment.
Bacterial Community and Potential Function in the Liquid Fraction Under the Three Treatments
A total of 16, 17, and 18 phyla were identified in the rumen liquid fractions from the UC, LU, and HU treatments, respectively (Figure 3A). Bacteroidetes (UC = 49.9 ± 10.8%, LU = 46.3 ± 9.0%, HU = 42.6 ± 5.0%) was the most abundant phylum in the three treatments, followed by the phyla Firmicutes (UC = 25.7 ± 6.6%, LU = 27.8 ± 10.2%, HU = 41.2 ± 7.6%) and Proteobacteria (UC = 16.8 ± 9.1%, LU = 17.9 ± 12.8%, HU = 4.7 ± 4.0%).
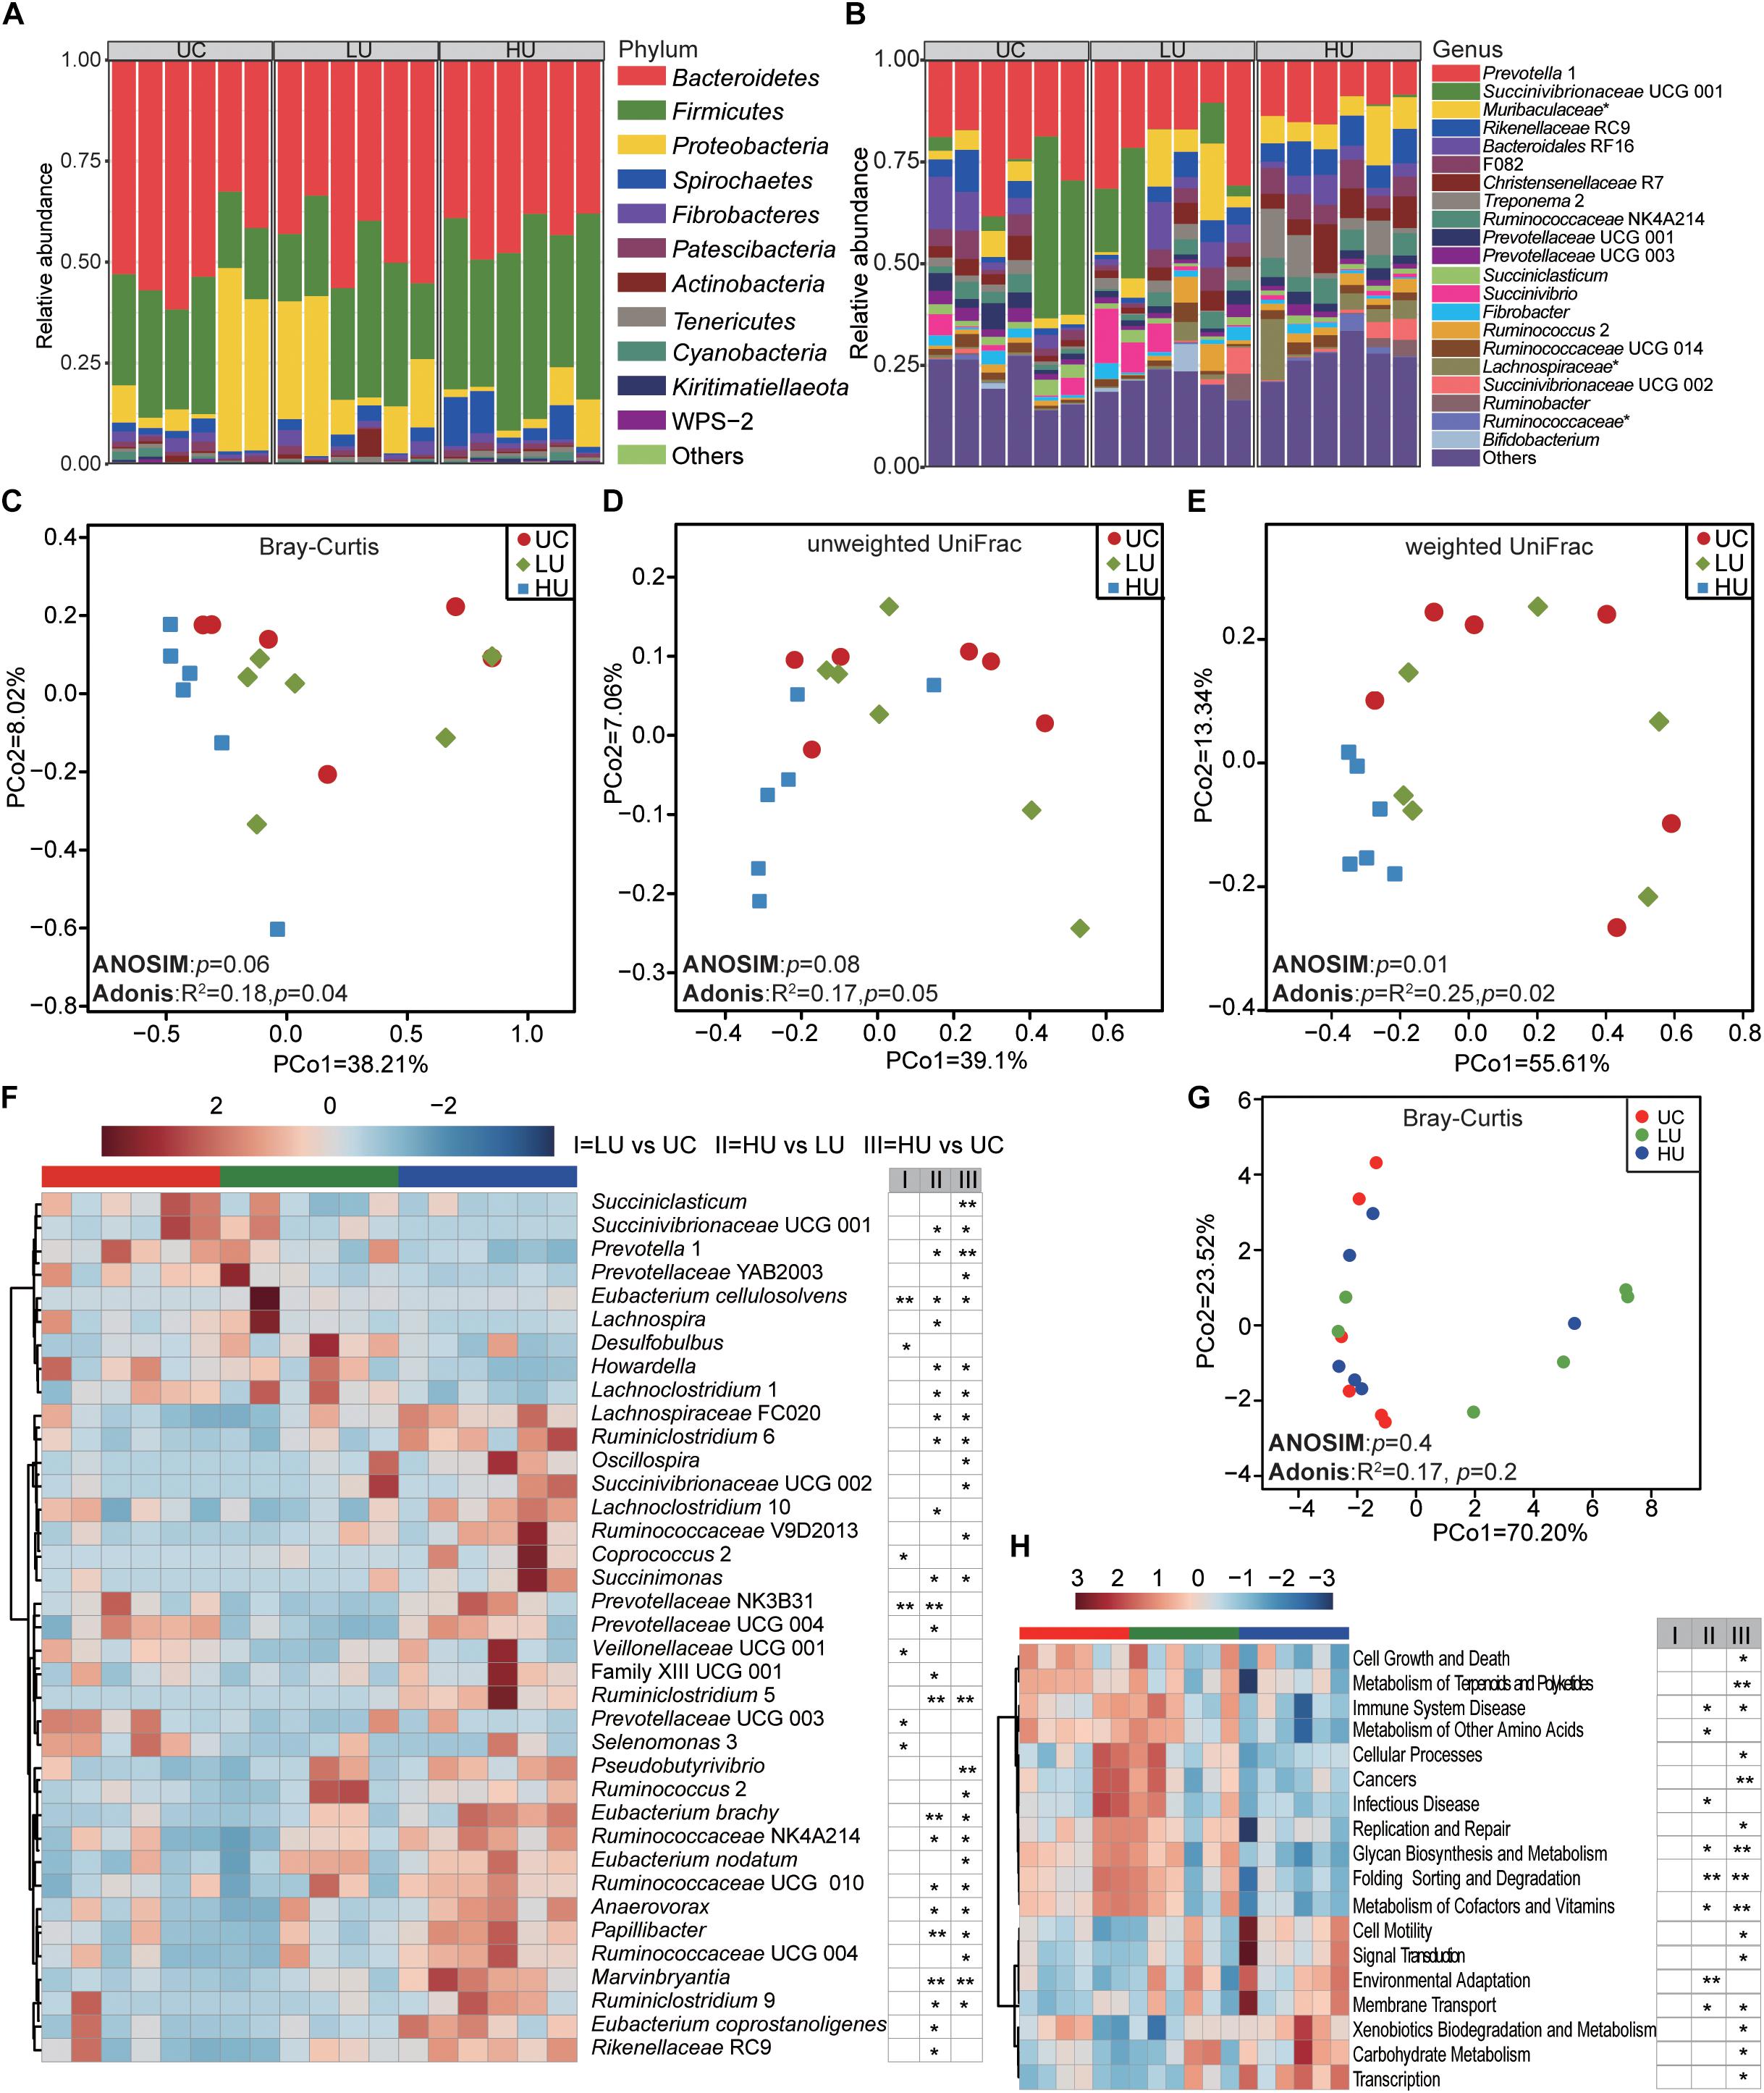
Figure 3. Bacterial community compositions and potential function in the rumen liquid fractions under the three treatments. Box plots showing the bacterial community compositions in the rumen liquid fractions of the UC, LU, and HU treatments at the phylum (A) and genus (B) levels. PCoA based on Bray–Curtis dissimilarity matrix (C), unweighted UniFrac distance (D), and weighted UniFrac distance (E). Heatmap (F) showing differential taxa in the liquid fractions among the three treatments. PCoA (G) plot revealing differences in predicted microbial functions based on Bray–Curtis dissimilarity matrix. Heatmap (H) revealing the differences of the predictive function profiles at KEGG level 2 in the rumen solid fractions among the three treatments. * p < 0.05, ** p < 0.01. UC, basal diet with no urea; LU, basal diet supplemented with a low concentration of urea (10 g/kg DM); HU, basal diet supplemented with a high concentration of urea (30 g/kg DM).
A total of 182, 183, and 183 bacterial genera were identified in the rumen liquid samples from the UC, LU, and HU treatments, respectively (Figure 3B). Prevotella 1 was the most abundant genus across the three treatments (UC = 24.5 ± 8.2%, LU = 21.4 ± 8.4%, HU = 12.1 ± 3.2%). In the UC and LU treatments, Bacteroidales RF16 (UC = 5.3 ± 4.2%, LU = 4.5 ± 3.0%) and Succinivibrionaceae UCG 001 (UC = 14.0 ± 9.2%, LU = 10.0 ± 8.2%) were abundant in the rumen liquid fractions. In the HU treatment, Rikenellaceae RC9 (6.8 ± 1.6%), Christensenellaceae R7 (6.3 ± 3.4%), and the unclassified bacterium within the family Muribaculaceae (7.4 ± 3.7%) also exhibited high prevalence.
The PCoA results showed that the bacterial community in the rumen liquid differed significantly among the three treatments based on weighted UniFrac distance (Figure 3E, ANOSIM: p = 0.01; Adonis: p = 0.02). However, the differences were not significant based on Bray-Curtis dissimilarity matrix (Figure 3C, ANOSIM: p = 0.06; Adonis: p = 0.04) or unweighted UniFrac distance (Figure 3D, ANOSIM: p = 0.08; Adonis: p = 0.05). Moreover, the group distances between LU and HU were significantly different (Supplementary Figure S2).
The relative abundances of Succinivibrionaceae UCG 001, Prevotella 1, Succiniclasticum spp., Howardella spp., Selenomonas 3, and Prevotellaceae UCG 003 were significantly higher in the UC treatment than in the LU or HU treatment (Figure 3F and Supplementary Table S3). The relative abundances of Eubacterium cellulosolvens, Lachnospira spp., Desulfobulbus spp., and Lachnoclostridium 1 in the LU treatment were significantly greater than the corresponding abundances in the UC or HU treatment. The relative abundances of Rikenellaceae RC9, Ruminococcaceae NK4A214, Eubacterium nodatum, Eubacterium coprostanoligenes, Eubacterium brachy, Ruminococcaceae UCG 010, Prevotellaceae NK3B31, Lachnospiraceae FCS020, Marvinbryantia spp., Papillibacter spp., Succinimonas spp., Pseudobutyrivibrio spp., Ruminococcaceae V9D2013, Ruminiclostridium 6, Anaerovorax spp., Oscillospira spp., Succinivibrionaceae UCG 002, Lachnoclostridium 10, Ruminococcus 2, Coprococcus 2, Ruminiclostridium 5, and Ruminiclostridium 9 were increased significantly in the HU treatment relative to those in the UC or LU treatment (Figure 3F and Supplementary Table S3).
PCoA of all KOs based on Bray-Curtis dissimilarity matrix showed that the functional profiles in the rumen liquid fraction were not significantly different among the three treatments (Figure 3G, ANOSIM: p = 0.4; Adonis: p = 0.2). However, the relative abundance of carbohydrate metabolism, and metabolism of other amino acids pathways increased with the supplementation of urea in diet, while metabolism of cofactors and vitamins pathway decreased (Figure 3H). At KEGG level 3, a total of 92 pathways were significantly different among the three treatments (Supplementary Table S4). For instance, the pathways of methane metabolism, protein digestion and absorption, and protein kinases decreased with urea supplementation in diet, while the pathways of pyruvate metabolism, valine, leucine and isoleucine degradation, and butanoate (butyrate) metabolism increased (Supplementary Table S4).
Bacterial Community and Potential Function in the Epithelial Fraction Under the Three Treatments
A total of 22, 19, and 21 phyla were identified in the rumen epithelial fractions from the UC, LU, and HU treatments, respectively (Figure 4A). The phylum Bacteroidetes (UC = 42.5 ± 3.4%, LU = 41.1 ± 7.9%, HU = 46.2 ± 2.2%) was abundant in the rumen epithelial fraction of Hu lambs, followed by the phyla Firmicutes (UC = 27.4 ± 3.0%, LU = 26.0 ± 7.2%, HU = 26.3 ± 5.2%) and Proteobacteria (UC = 18.7 ± 7.3%, LU = 22.1 ± 10.7%, HU = 12.2 ± 5.9%). In addition, the phylum Spirochaetes accounted for approximately 5% of the rumen epithelial fraction of each of the three treatments (UC = 5.2 ± 3.2%, LU = 5.0 ± 2.4%, HU = 8.2 ± 2.5%).
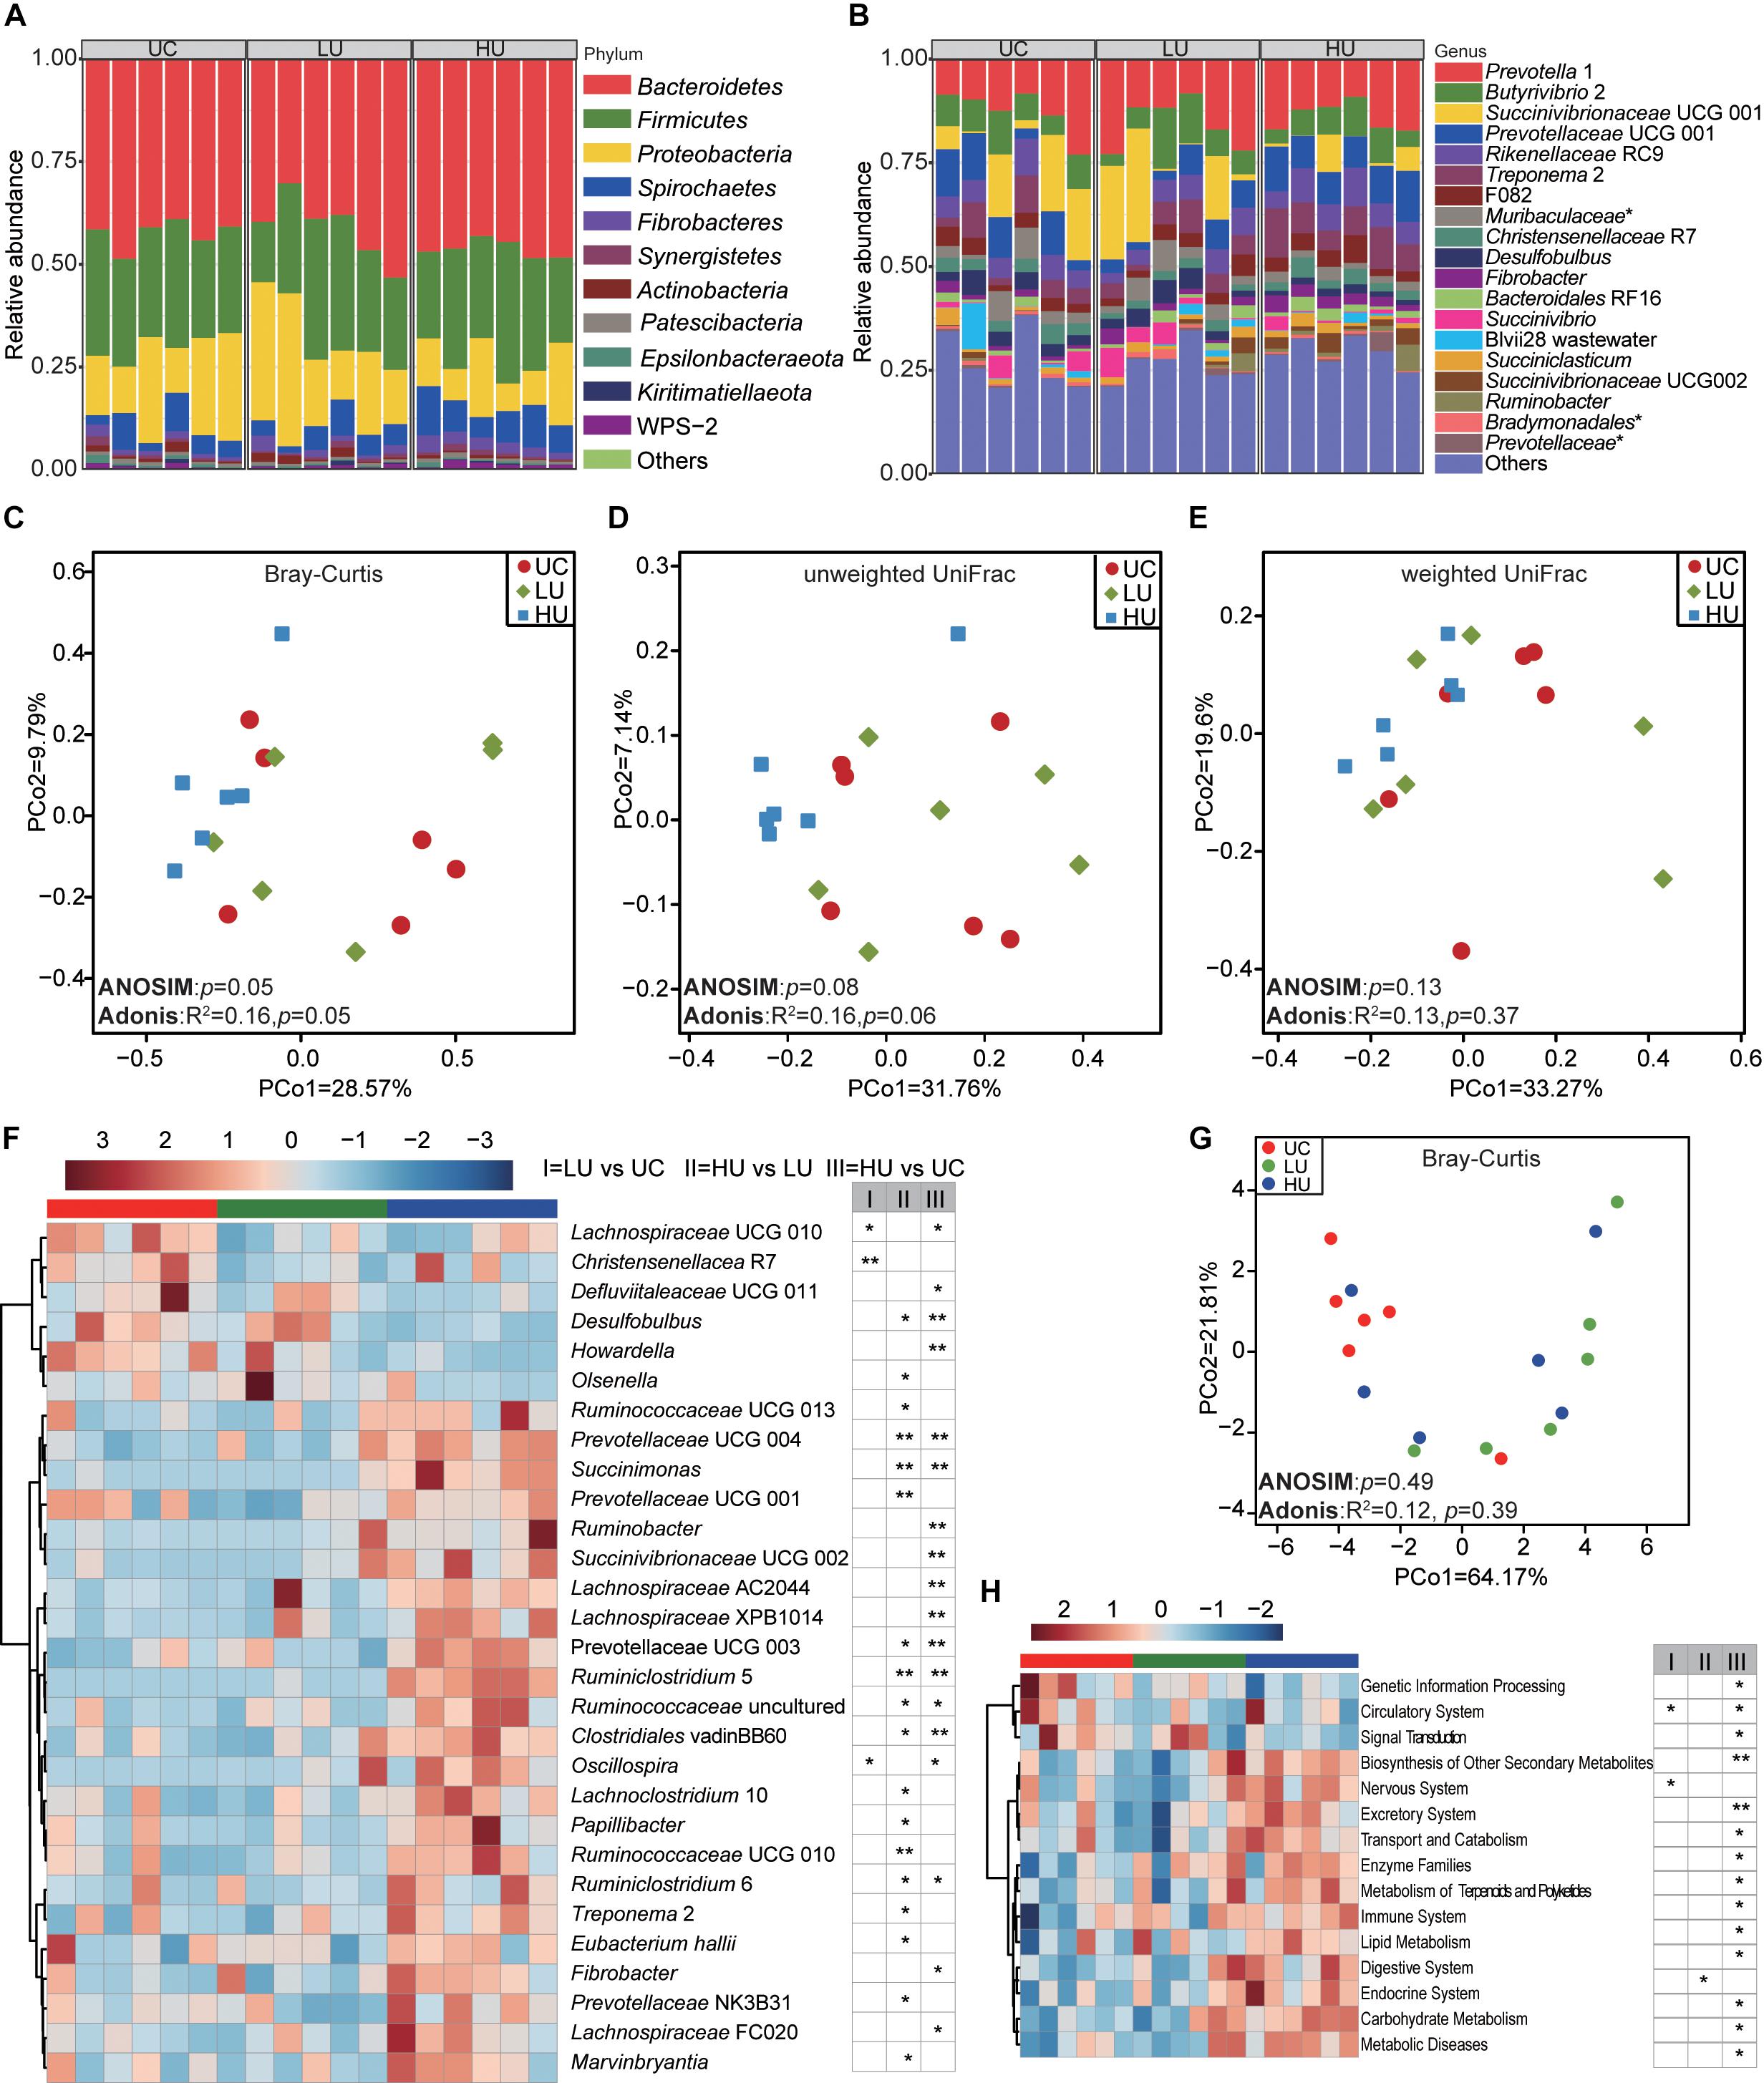
Figure 4. Bacterial community compositions and potential function in the rumen epithelial fractions under the three treatments. The bacterial community compositions in the rumen epithelial fractions of the UC, LU and HU treatments at the phylum (A) and genus (B) levels. Comparison of the bacterial communities of epithelial fractions based on Bray–Curtis dissimilarity matrix (C), unweighted UniFrac distance (D) and weighted UniFrac distance (E). Heatmap (F) showing differential taxa in the epithelium fractions among the three treatments. PCoA (G) plot revealing differences in predicted microbial functions based on Bray–Curtis dissimilarity matrix. Heatmap (H) revealing the differences of the predictive function profiles at KEGG level 2 in the rumen solid fractions among the three treatments. * p < 0.05, ** p < 0.01. UC, basal diet with no urea; LU, basal diet supplemented with a low concentration of urea (10 g/kg DM); HU, basal diet supplemented with a high concentration of urea (30 g/kg DM).
A total of 255, 244, and 256 bacterial genera were identified in the UC, LU, and HU treatments, respectively (Figure 4B). Prevotella 1 accounted for the highest proportion in all three treatments (UC = 12.6 ± 5.5%, LU = 15.6 ± 6.0%, HU = 13.9 ± 3.4%), followed by Succinivibrionaceae UCG 001 (UC = 9.7 ± 7.9%, LU = 11.2 ± 9.1%, HU = 2.7 ± 1.7%), Butyrivibrio 2 (UC = 7.5 ± 1.9%, LU = 7.8 ± 4.5%, HU = 6.4 ± 2.4%), Rikenellaceae RC9 (UC = 5.7 ± 1.6%, LU = 5.0 ± 1.6%, HU = 6.5 ± 1.9%), Prevotellaceae UCG 001 (UC = 8.0 ± 4.3%, LU = 4.7 ± 2.6%, HU = 9.2 ± 1.9%), and Treponema 2 (UC = 4.9 ± 3.1%, LU = 4.7 ± 2.2%, HU = 7.9 ± 2.5%).
The PCoA, ANOSIM and Adonis results indicated that the bacterial community in the rumen epithelium was not distinguishable among the three treatments based on Bray–Curtis dissimilarity matrix (Figure 4C, ANOSIM: p = 0.05; Adonis: p = 0.05), unweighted UniFrac distance (Figure 4D, ANOSIM: p = 0.08; Adonis: p = 0.06) and weighted UniFrac distance (Figure 4E, ANOSIM: p = 0.13; Adonis: p = 0.37); this result was supported by the comparison of group distances (Supplementary Figure S3).
The comparison of bacterial genera among the three treatments showed that the relative abundances of Desulfobulbus spp., Howardella spp., Christensenellaceae R7, and Lachnospiraceae UCG 010 were significantly higher in the UC treatment than in the LU or HU treatment (Figure 4F and Supplementary Table S5). The relative abundance of Olsenella spp. was significantly greater in the LU treatment than in the UC or HU treatment, whereas that of Marvinbryantia spp. was significantly lower in the LU treatment than in the UC or HU treatment (Figure 4F and Supplementary Table S5). The relative abundances of Prevotellaceae UCG 001, Succinivibrionaceae UCG 002, Ruminobacter spp., Prevotellaceae UCG 003, Succinimonas spp., Prevotellaceae NK3B31, Ruminococcaceae UCG 010, Ruminococcaceae UCG 013, Prevotellaceae UCG 004, Lachnospiraceae XPB1014, Lachnospiraceae UCG 010, Papillibacter spp., Oscillospira spp., Treponema 2, Fibrobacter spp., Ruminiclostridium 5, and Ruminiclostridium 6 were higher in the HU treatment than in the UC and LU treatments (Figure 4F and Supplementary Table S5).
PCoA result of all KOs showed that the microbial function in the rumen epithelial fraction from the HU treatment tended to differ from the UC and LU treatments, although the difference was not significant (Figure 4G, ANOSIM: p = 0.49; Adonis: p = 0.39). At KEGG level 2, the relative abundance of biosynthesis of other secondary metabolites pathway increased with the supplementation of urea in diet, while carbohydrate metabolism pathway decreased (Figure 4H). At KEGG level 3, a total of 54 pathways were significantly different in the rumen liquid fraction among the three treatments (Supplementary Table S6). The pathways of phenylalanine, tyrosine and tryptophan biosynthesis, and D-arginine and D-ornithine metabolism decreased from UC to HU treatments, while cysteine and methionine metabolism pathway increased (Supplementary Table S6).
Quantification of Protozoal Density
No interaction (p = 0.82) between fractions and treatments was detected with respect to the absolute abundance of total protozoa (Table 6). The population of protozoa in the LU treatment was higher than that in the UC and HU treatments (p < 0.01). Moreover, the liquid fraction had a higher (p < 0.01) protozoal population than that in the solid and epithelial fractions regardless of diet.
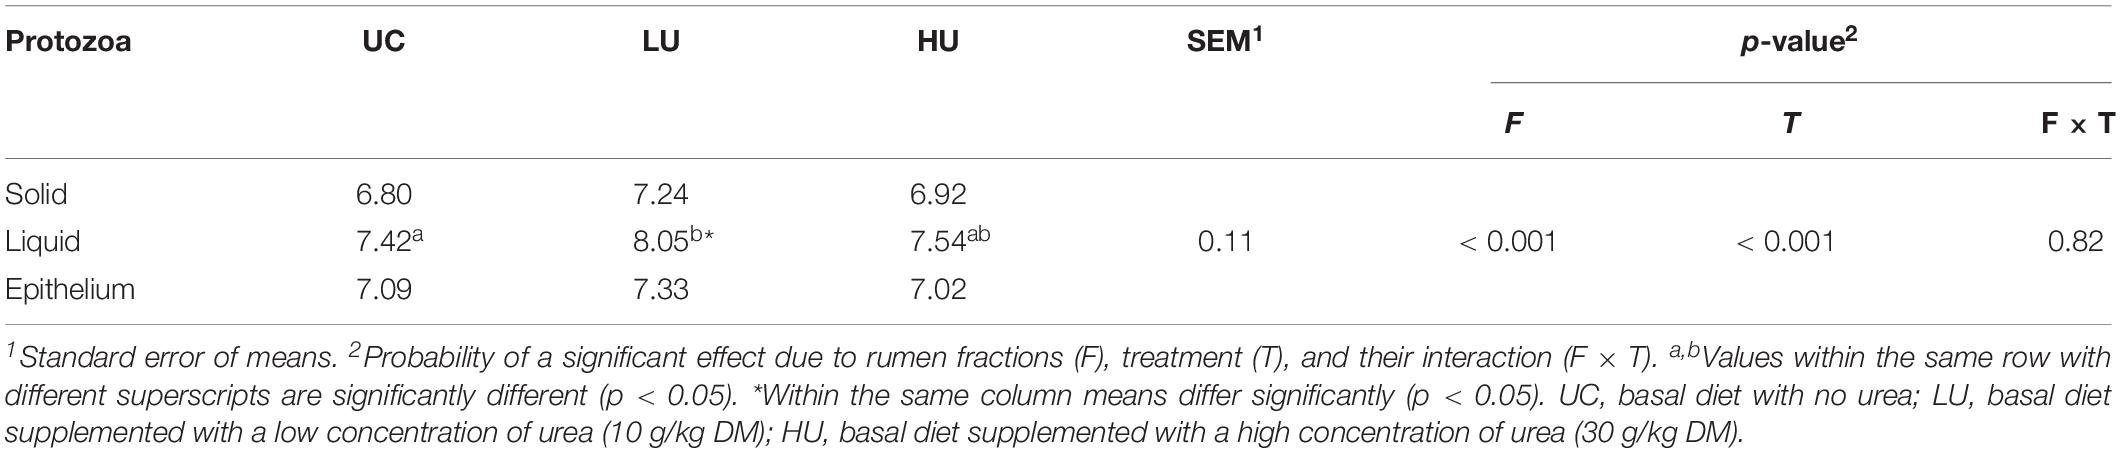
Table 6. Population of total protozoa in the rumen solid, liquid, and epithelium fractions among the three treatments (log10 copy number of 18S RNA gene per gram of sample).
Discussion
Differences in the Rumen Fermentation Parameters Among the Three Treatments
In the present study, the ammonia level in the rumen was increased with urea supplementation (Table 2), which is consistent with previous results (Spanghero et al., 2018). This result can be attributed to diverse ureolytic bacteria that do not limit the conversion of urea to ammonia (Cook, 1976; Jin et al., 2017), and the increased number of rumen protozoa in the LU treatment in comparison with UC treatment (Table 6). Rumen protozoa play an important role in the bacterial protein breakdown (Williams and Coleman, 1992), and the protozoal elimination results in a decrease in rumen ammonia based on a meta-analysis (Newbold et al., 2015). Previous study reported that the maximum concentration of microbial protein in the rumen was associated with an ammonia concentration of 8.8 mg/dL (Hume et al., 1970), which is comparable to that the concentration in the LU treatment (10.76 mg/dL). The present result is also consistent with the finding that DMI and ADG were highest in the LU treatment among different treatments (Xu et al., 2019). However, the concentration of ammonia in the rumen significantly increased from 5.86 mg/dL in the UC treatment to 25.99 mg/dL in the HU treatment (Table 2). Rumen ammonia can be absorbed via simple diffusion and via potassium channels and some transport proteins (Abdoun et al., 2006). Ruminants may display signs and symptoms of ammonia toxicity when the ammonia concentration in the rumen is above 100 mg/dL (Owens and Bergen, 1983). Moreover, the molar concentration of total VFA did not significantly differ among the three treatments, which is consistent with previous findings in beef steers administered slow-release urea (Taylor-Edwards et al., 2009). Together, these findings suggest urea supplementation affected the ammonia metabolism in rumen.
The molar concentrations of butyrate and isovalerate were higher in the HU treatment than in the UC and LU treatments (Table 2). Similarly, Meng et al. (2000) and Spanghero et al. (2018) documented that butyrate production increased during in vitro rumen fermentation. Moreover, Jin et al. (2018) found that valine, leucine, and isoleucine metabolism were enhanced in the rumen of dairy cattle fed urea. Previous studies have suggested that isovalerate is derived from branched-chain amino acids, such as valine and isoleucine (Allison, 1978). Interestingly, the pathways of butyrate metabolism, and valine leucine and isoleucine degradation were also higher in the rumen liquid of HU treatment than in the UC and LU treatments (Supplementary Table S4). These results suggest that the metabolism of butyrate and branched-chain amino acids is affected by urea supplementation.
Differences in Bacterial Community Structure Among the Solid, Liquid, and Epithelial Fractions
To understand the changes in rumen metabolism, we examined the rumen microbiota in the solid, liquid and epithelial fractions. The phyla Bacteroidetes, Firmicutes, and Proteobacteria were abundant bacteria in the Hu lamb rumen regardless of diet or fraction (Figures 2A, 3A, 4A), which is consistent with previous findings on the global rumen microbiota (Henderson et al., 2015) and indicates the existence of a core rumen microbiota. In addition, we found that Prevotella was the most abundant genus in the three fractions (Figures 2B, 3B, 4B). This result is consistent with findings regarding the rumen solid and liquid fractions of dairy cattle fed ryegrass or white clover (Bowen et al., 2018) and a TMR (forage:concentrate = 70:30, forage = prewilted grass and maize silage) (De Mulder et al., 2017) and the rumen contents and epithelium of dairy cattle fed a TMR (forage:concentrate = 55:45, forage = corn silage and corn stover) (Liu et al., 2016). Prevotella represents one of the most abundant genera in the rumen; this genus exhibits genetic and metabolic diversity (Bekele et al., 2010) and plays roles in carbohydrate utilization (Dehority, 1966; Cotta, 1992; Gardner et al., 1995; Kabel et al., 2011), nitrogen metabolism (Kim et al., 2017), and fiber degradation (Mayorga et al., 2016). The results of these study suggest the importance of Prevotella spp. in the rumen microbial community. However, in contrast to our findings, Schären et al. (2017) found that the family Lachnospiraceae was predominant in the rumen epithelium of German Holsteins fed a TMR (35% corn silage, 35% grass silage, 30% concentrate). This discrepancy may be attributed to differences in dietary composition (Henderson et al., 2015) and sample collection approaches (Li et al., 2009).
At the genus level, the present study found that the unclassified bacteria within the families Muribaculaceae and Lachnospiraceae, Christensenellaceae R7, Ruminococcaceae NK4A214, Lachnospiraceae NK3A20, Ruminococcaceae UCG 014, and Ruminococcus 2 were abundant in the solid and liquid fractions (Table 4). These bacteria have also been observed in the solid and liquid fractions of dairy cattle (De Mulder et al., 2017; Schären et al., 2017) and yak (Ren et al., 2019). The bacteria within the family Muribaculaceae encode enzymes that degrade plant glycans (hemicellulose and pectin) and host-derived glycans; they also exhibit specificity in nitrogen utilization and harbor a specific urease (Ormerod et al., 2016; Lagkouvardos et al., 2019). Members of the Christensenellaceae family contain enzymes, such as α-arabinosidase, β-galactosidase, and β-glucosidase (Perea et al., 2017). Ruminococcaceae is an important group of microorganisms playing roles in degradation of cellulose and fermentation of plant fibers in rumen (Flint et al., 2008; Biddle et al., 2013). Consistently, the carbohydrate metabolism pathway is also higher in the rumen solid and liquid fractions than in the epithelial fraction (Table 5). These observations are consistent with the prevalence of these microorganisms in the solid and liquid fractions and suggest the role in fiber degradation.
The relative abundances of Butyrivibrio 2 and Treponema 2 were high in the epithelial fraction (Figures 2B, 3B, 4B and Table 4). Treponema spp. are commonly distributed in the gastrointestinal tract of ruminants, encode a wide variety of carbohydrate-active enzymes (Rosewarne et al., 2012) and act synergistically with cellulolytic bacteria to degrade cellulose and pectin to produce acetate (Liu et al., 2015). In addition, many bacteria of the genus Butyrivibrio produce butyrate and degrade plant fibers, such as xylans (Cotta and Forster, 2006). Acetate can accelerate rumen epithelial cell proliferation (Sakata and Tamate, 1979), and butyrate concentration is positively associated with both the absorptive surface area of the ruminal epithelium and the level of VFA oxidation in the ketogenesis pathway (Niwińska et al., 2017). Together, these results suggest a possible role for fraction specification in the determination of microbial composition.
Changes in the Rumen Bacteria With Urea Supplementation
The PCoA and ANOSIM analyses showed significant effects of urea on the solid- associated bacterial community (Figures 2C–E, p ≤ 0.04), but only limited effects on the liquid-associated bacterial community (Figures 3C–E, Bray–Curtis: p = 0.06; unweighted UniFrac, p = 0.08, weighted UniFrac, p = 0.01); furthermore, the effects on the epithelium associated bacterial community were not significant (Figures 4C–E, p ≥ 0.05). Moreover, the Adonis results based on Bray-Curtis dissimilarity matrix (Figures 2C, 3C) and/or weighted Unifrac metric distance (Figures 2E, 3E), which takes bacterial abundances into account, revealed stronger discrimination in the solid- and liquid-associated bacterial communities than that based on unweighted UniFrac metric distance (Figures 2D, 3D), although the significance of the ANOSIM analysis is not strong (e.g., p > 0.001) because of type I error (La Rosa et al., 2012), indicating that differences in community structure (rather than community membership) distinguish among the three treatments. These results suggest that urea supplementation in the diet may differentially influence the bacteria relative abundance in the three fractions. Previous studies have demonstrated that the solid microenvironment is dominated by cellulolytic bacteria that participate in fiber degradation (Schären et al., 2017) and that rumen cellulolytic bacteria use ammonia as their sole nitrogen source (Wang and Tan, 2013). These observations may explain the significant alteration of the solid fraction by urea supplementation.
The bacteria attached to the rumen epithelium were not significantly affected by urea addition, supporting previous studies showing that the epithelial bacteria remained stable through dietary changes (Cho et al., 2006; Sadet et al., 2007). In contrast, Petri et al. (2013) and Schären et al. (2017) revealed that the rumen epithelial bacteria of dairy cattle were significantly altered during the transition from a forage diet to a high-concentrate diet (Petri et al., 2013) or a silage- and concentrate-based diet to pasture (Schären et al., 2017). In this study, the concentration of ammonia with urea supplementation differed significantly from that with the basal diet alone, but the molar concentration of total VFA did not, in contrast to the results of Schären et al. (2017). Moreover, the epithelium-attached bacteria is involved in urea hydrolysis (Costerton et al., 1979). Thus, these differences among studies in rumen fermentation parameters might explain the study differences in the response of epithelial bacteria to urea supplementation.
In light of the different effects of urea observed among the solid, liquid, and epithelial bacteria, we compared the bacterial genera among the three fractions. In all three fractions, the relative abundance of the phylum Proteobacteria was lower in the HU treatments than in the UC and LU treatments. This finding is consistent with previous research on the rumen microbiota of finishing bulls fed urea (Zhou et al., 2017). Members of the phylum Proteobacteria participate in glycine, serine, threonine and nitrogen metabolism, as revealed by a metaproteomics approach (Hart et al., 2018). Similarly, the pathway of glycine, serine and threonine metabolism is also decreased in the solid and liquid fractions (Supplementary Tables S2, S4). Therefore, these results indicate that the metabolism of glycine, serine and threonine is affected when urea is supplied into diet.
At the genus level, Succinivibrionaceae UCG 002 (similar to Gilliamella spp. based on the BLAST analysis, with 85% sequence identity) and Ruminiclostridium 5 were significantly increased in the three fractions with dietary urea supplementation (Figures 2F, 3F, 4F and Supplementary Tables S1, S3, S5). The Gilliamella phylotypes are the core bacteria in the gut of bees, and can degrade pectin, which is a compound of the pollen cell wall, and utilize mannose, arabinose, xylose, or rhamnose (Zheng et al., 2016; Praet et al., 2017). The members of Ruminiclostridium spp. can use cellulose, xylan, and/or cellobiose as substrates, primarily to generate acetate, ethanol and lactate (Yutin and Galperin, 2013). In rumen fermentation, the rates of degradation of highly processed grains and the hydrolysis of urea must be balanced for efficient utilization by rumen microorganisms. Interestingly, the result showed that the carbohydrate metabolism pathway also increased with dietary urea supplementation (Figures 2H, 3H). Thus, the relative increase of Succinivibrionaceae UCG 002 and Ruminiclostridium 5 in all fractions under urea supplementation is likely to relate with the increased amount of ammonia.
In the solid and liquid fractions, the relative abundance of Oscillospira spp. significantly increased with dietary urea supplementation (Figures 2F, 3F and Supplementary Tables S1, S3). Oscillospira is an enigmatic and anaerobic bacteria from Clostridial cluster IV that is an important butyrate producers and is associated with gut health (Gophna et al., 2017). The increase in abundance of this genus was in accordance with the increased molar concentration of butyrate (Table 2), and the increased abundance of butyrate metabolism pathway in the rumen liquid (Supplementary Table S4). In contrast, Succinivibrionaceae UCG 001 (similar to Vibrio spp. based on the BLAST analysis, with 85% sequence identity) and Prevotella 1 showed decreased abundance under dietary urea supplementation (Figures 2F, 3F and Supplementary Tables S1, S3). This result is consistent with previous results for finishing bulls (Zhou et al., 2017) and lambs (Ishaq et al., 2017). However, Jin et al. (2017) analyzed the ureC gene and found that the unclassified Succinivibrionaceae was enriched by urea supplementation in a RUSITEC fermenter; the difference between the present study and Jin et al. (2017) is possibly due to the study differences in the target gene (ureC vs. 16S rRNA) and approach (in vitro vs. in vivo).
In addition, the present study found that some bacteria within specific fractions were altered by urea supplementation. For instance, Howardella spp. and Desulfobulbus spp. were present at higher levels in the epithelial fraction of UC and LU treatments than in the HU treatment (Figure 4F and Supplementary Table S5). Previous studies revealed that the epithelial microbiota are possibly associated with oxygen consumption and urea digestion (Schären et al., 2017). Howardella spp. are reported to have strong ureolytic activity and to possibly play roles in urea hydrolysis (Cook et al., 2007). Desulfobulbus spp. participate in the reduction of sulfur compounds (Schären et al., 2017) and oxygen consumption (De Mulder et al., 2017), which are affected by the concentration of propionate (John Parkes and Graham Calder, 1985); these observations are consistent with the increased rumen concentration of propionate observed in the UC and LU treatments. These results indicate that the ureolytic and sulfur-reducing abilities of rumen bacteria may be affected when the nitrogen content is increased.
Conclusion
In this study, we examined the effects of urea supplementation on rumen fermentation parameters and on the solid-, liquid-, and epithelium-associated bacteria. The results showed that the concentrations of ammonia, butyrate and propionate were significantly changed with dietary urea supplementation. The solid-, liquid-, and epithelium-associated bacteria are significantly different. However, the effects of urea differed among the solid, liquid, and epithelial fractions, as evidenced by the fraction differences in bacterial taxonomic composition and the predicted function. Although the differences were observed among the different fractions, our study is also limited by the results based on the 16S rRNA gene approach due to the resolution and sensitivity. Therefore, examinations of ruminal protozoa community, rumen metagenome and epithelial transcriptome are needed to further elucidate the changes in the rumen microbiota and metabolic pathways, and the rumen epithelium that occur in response to urea supplementation.
Data Availability Statement
The datasets generated for this study can be found in the SRA database under accession number PRJNA541835.
Ethics Statement
The animal study was reviewed and approved by Animal Care and Use Committee of Nanjing Agricultural University.
Author Contributions
ZL, YX, and JS collected the samples. ZL and YX prepared the samples for analysis. ZL, CM, and JS analyzed the data. ZL, JS, and WZ wrote and reviewed the manuscript. JS and WZ designed the study. All authors approved the final manuscript as submitted.
Funding
This work was supported by the National Natural Science Foundation of China (Award No: 31402101), the Fundamental Research Funds for the Central Universities (Award No: KYZ201856), and “One Belt and One Road” Technical Cooperation Project of Jiangsu Province (Award No: BZ2018055).
Conflict of Interest
The authors declare that the research was conducted in the absence of any commercial or financial relationships that could be construed as a potential conflict of interest.
Supplementary Material
The Supplementary Material for this article can be found online at: https://www.frontiersin.org/articles/10.3389/fmicb.2020.00244/full#supplementary-material
FIGURE S1 | Box plots showing within-group similarity and between-group dissimilarity based on Bray–Curtis dissimilarity matrix in the rumen bacteria of the solid fraction under the three treatments.
FIGURE S2 | Box plots showing within-group similarity and between-group dissimilarity based on Bray–Curtis dissimilarity matrix in the rumen bacteria of the liquid fraction under the three treatments.
FIGURE S3 | Box plots showing within-group similarity and between-group dissimilarity based on Bray–Curtis dissimilarity matrix in the rumen bacteria of the epithelial fraction under the three treatments.
TABLE S1 | The relative abundance (%) of significantly different genera in the solid fraction among the three treatments.
TABLE S2 | Comparison of the predictive function in the rumen solid fraction among the three treatments.
TABLE S3 | The relative abundance (%) of significantly different genera in the liquid fraction among the three treatments.
TABLE S4 | Comparison of the predictive function in the rumen liquid fraction among the three treatments.
TABLE S5 | The relative abundance (%) of significantly different genera in the epithelial fraction among the three treatments.
TABLE S6 | Comparison of the predictive function in the rumen epithelial fraction among the three treatments.
Abbreviations
ADG, average daily gain; ANOSIM, analysis of similarities; DM, dry matter; DMI, dry matter intake; NPN, non-protein nitrogen; OTU, operational taxonomic unit; PCoA, principal coordinates analysis; PICRUSt, phylogenetic investigation of communities by reconstruction of unobserved states; SD, standard deviation; TMR, total mixed ration; VFA, volatile fatty acid.
References
Abdoun, K., Stumpff, F., and Martens, H. (2006). Ammonia and urea transport across the rumen epithelium: a review. Anim. Health Res. Rev. 7, 43–59. doi: 10.1017/s1466252307001156
Allison, M. J. (1978). Production of branched-chain volatile fatty acids by certain anaerobic bacteria. Appl. Environ. Microbiol. 35, 872–877. doi: 10.1128/aem.35.5.872-877.1978
Bekele, A. Z., Koike, S., and Kobayashi, Y. (2010). Genetic diversity and diet specificity of ruminal Prevotella revealed by 16S rRNA gene-based analysis. FEMS Microbiol. Lett. 305, 49–57. doi: 10.1111/j.1574-6968.2010.01911.x
Biddle, A., Stewart, L., Blanchard, J., and Leschine, S. (2013). Untangling the genetic basis of fibrolytic specialization by Lachnospiraceae and Ruminococcaceae in diverse gut communities. Diversity 5, 627–640. doi: 10.3390/d5030627
Bowen, J. M., McCabe, M. S., Lister, S. J., Cormican, P., and Dewhurst, R. J. (2018). Evaluation of microbial communities associated with the liquid and solid phases of the rumen of cattle offered a diet of perennial ryegrass or white clover. Front. Microbiol. 9:2389. doi: 10.3389/fmicb.2018.02389
Caporaso, J. G., Kuczynski, J., Stombaugh, J., Bittinger, K., Bushman, F. D., Costello, E. K., et al. (2010). QIIME allows analysis of high-throughput community sequencing data. Nat. Methods 7, 335–336. doi: 10.1038/Nmeth.F.303
Chaney, A. L., and Marbach, E. P. (1962). Modified reagents for determination of urea and ammonia. Clin. Chem. 8, 130–132. doi: 10.1093/clinchem/8.2.130
Cheng, K. J., McCowan, R. P., and Costerton, J. W. (1979). Adherent epithelial bacteria in ruminants and their roles in digestive tract function. Am. J. Clin. Nutr. 32, 139–148. doi: 10.1093/ajcn/32.1.139
Cho, S. J., Cho, K. M., Shin, E. C., Lim, W. J., Hong, S. Y., Choi, B. R., et al. (2006). 16S rDNA analysis of bacterial diversity in three fractions of cow rumen. J. Microbiol. Biotechnol. 16, 92–101.
Cook, A. R. (1976). Urease activity in the rumen of sheep and the isolation of ureolytic bacteria. J. Gen. Microbiol. 92, 32–48. doi: 10.1099/00221287-92-1-32
Cook, A. R., Riley, P. W., Murdoch, H., Evans, P. N., and McDonald, I. R. (2007). Howardella ureilytica gen. nov., sp. nov., a Gram-positive, coccoid-shaped bacterium from a sheep rumen. Int. J. Syst. Evol. Microbiol. 57, 2940–2945. doi: 10.1099/ijs.0.64819-0
Costerton, J. W., McCowan, R. P., and Cheng, K. J. (1979). Adherent epithelial bacteria in ruminants and their roles in digestive tract function. Am. J. Clin. Nutr. 32, 139–148. doi: 10.1093/ajcn/32.1.139
Cotta, M. (1992). Interaction of ruminal bacteria in the production and utilization of maltooligosaccharides from starch. Appl. Environ. Microbiol. 58, 48–54. doi: 10.1128/aem.58.1.48-54.1992
Cotta, M., and Forster, R. (2006). “The family Lachnospiraceae, including the genera Butyrivibrio, Lachnospira and Roseburia,” in The Prokaryotes, eds M. Dworkin, S. Falkow, E. Rosenberg, K.-H. Schleifer, and E. Stackebrandt, (New York, NY: Springer), 1002–1021. doi: 10.1007/0-387-30744-3_35
De Mulder, T., Goossens, K., Peiren, N., Vandaele, L., Haegeman, A., De Tender, C., et al. (2017). Exploring the methanogen and bacterial communities of rumen environments: solid adherent, fluid and epimural. FEMS Microbiol. Ecol. 93:fiw251. doi: 10.1093/femsec/fiw251
Dehority, B. A. (1966). Characterization of several bovine rumen bacteria isolated with a xylan medium. J. Bacteriol. 91, 1724–1729. doi: 10.1128/jb.91.5.1724-1729.1966
Edgar, R. C. (2004). MUSCLE: multiple sequence alignment with high accuracy and high throughput. Nucleic Acids Res. 32, 1792–1797. doi: 10.1093/nar/gkh340
Edgar, R. C. (2013). UPARSE: highly accurate OTU sequences from microbial amplicon reads. Nat. Methods 10, 996–998. doi: 10.1038/nmeth.2604
Edgar, R. C., Haas, B. J., Clemente, J. C., Quince, C., and Knight, R. (2011). UCHIME improves sensitivity and speed of chimera detection. Bioinformatics 27, 2194–2200. doi: 10.1093/bioinformatics/btr381
Fierer, N., Lauber, C. L., Zhou, N., McDonald, D., Costello, E. K., and Knight, R. (2010). Forensic identification using skin bacterial communities. Proc. Natl. Acad. Sci. U.S.A. 107, 6477–6481. doi: 10.1073/pnas.1000162107
Flint, H. J., Bayer, E. A., Rincon, M. T., Lamed, R., and White, B. A. (2008). Polysaccharide utilization by gut bacteria: potential for new insights from genomic analysis. Nat. Rev. Microbiol. 6, 121–131. doi: 10.1038/nrmicro1817
Gardner, R. G., Wells, J. E., Russell, J. B., and Wilson, D. B. (1995). The cellular location of Prevotella ruminicola beta-1,4-D-endoglucanase and its occurrence in other strains of ruminal bacteria. Appl. Environ. Microbiol. 61, 3288–3292. doi: 10.1128/aem.61.9.3288-3292.1995
Gophna, U., Konikoff, T., and Nielsen, H. B. (2017). Oscillospira and related bacteria – from metagenomic species to metabolic features. Environ. Microbiol. 19, 835–841. doi: 10.1111/1462-2920.13658
Hart, E. H., Creevey, C. J., Hitch, T., and Kingston-Smith, A. H. (2018). Meta-proteomics of rumen microbiota indicates niche compartmentalisation and functional dominance in a limited number of metabolic pathways between abundant bacteria. Sci. Rep. 8:10504. doi: 10.1038/s41598-018-28827-7
Henderson, G., Cox, F., Ganesh, S., Jonker, A., Young, W., and Janssen, P. H. (2015). Rumen microbial community composition varies with diet and host, but a core microbiome is found across a wide geographical range. Sci. Rep. 5:14567. doi: 10.1038/srep14567
Human Microbiome Project Consortium, (2012). Structure, function and diversity of the healthy human microbiome. Nature 486, 207–214. doi: 10.1038/nature11234
Hume, I., Moir, R., and Somers, M. (1970). Synthesis of microbial protein in the rumen. I. Influence of the level of nitrogen intake. Aust. J. Agric. Res. 21, 283–296.
Huws, S. A., Creevey, C. J., Oyama, L. B., Mizrahi, I., Denman, S. E., Popova, M., et al. (2018). Addressing global ruminant agricultural challenges through understanding the rumen microbiome: past, present, and future. Front. Microbiol. 9:2161. doi: 10.3389/fmicb.2018.02161
Ishaq, S. L., Yeoman, C. J., and Whitney, T. R. (2017). Ground Juniperus pinchotii and urea in supplements fed to Rambouillet ewe lambs Part 2: ewe lamb rumen microbial communities1. J. Anim. Sci. 95, 4587–4599. doi: 10.2527/jas2017.1731
Jin, D., Zhao, S., Zheng, N., Bu, D., Beckers, Y., Denman, S. E., et al. (2017). Differences in ureolytic bacterial composition between the rumen digesta and rumen wall based on ureC gene classification. Front. Microbiol. 8:385. doi: 10.3389/fmicb.2017.00385
Jin, D., Zhao, S. G., Zheng, N., Bu, D. P., Beckers, Y., and Wang, J. Q. (2018). Urea nitrogen induces changes in rumen microbial and host metabolic profiles in dairy cows. Livest. Sci. 210, 104–110. doi: 10.1016/j.livsci.2018.02.011
John Parkes, R., and Graham Calder, A. (1985). The cellular fatty acids of three strains of Desulfobulbus, a propionate-utilising sulphate-reducing bacterium. FEMS Microbiol. Lett. 31, 361–363. doi: 10.1016/0378-1097(85)90032-1
Kabel, M. A., Yeoman, C. J., Han, Y., Dodd, D., Abbas, C. A., de Bont, J. A., et al. (2011). Biochemical characterization and relative expression levels of multiple carbohydrate esterases of the xylanolytic rumen bacterium Prevotella ruminicola 23 grown on an ester-enriched substrate. Appl. Environ. Microbiol. 77, 5671–5681. doi: 10.1128/AEM.05321-11
Kim, J. N., Méndez-García, C., Geier, R. R., Iakiviak, M., Chang, J., Cann, I., et al. (2017). Metabolic networks for nitrogen utilization in Prevotella ruminicola 23. Sci. Rep. 7:7851. doi: 10.1038/s41598-017-08463-3
La Rosa, P. S., Brooks, J. P., Deych, E., Boone, E. L., Edwards, D. J., Wang, Q., et al. (2012). Hypothesis testing and power calculations for taxonomic-based human microbiome data. PLoS One 7:e52078. doi: 10.1371/journal.pone.0052078
Lagkouvardos, I., Lesker, T. R., Hitch, T. C. A., Gálvez, E. J. C., Smit, N., Neuhaus, K., et al. (2019). Sequence and cultivation study of Muribaculaceae reveals novel species, host preference, and functional potential of this yet undescribed family. Microbiome 7:28. doi: 10.1186/s40168-019-0637-2
Langille, M. G. I., Zaneveld, J., Caporaso, J. G., McDonald, D., Knights, D., Reyes, J. A., et al. (2013). Predictive functional profiling of microbial communities using 16S rRNA marker gene sequences. Nat. Biotechnol. 31, 814–821. doi: 10.1038/nbt.2676
Li, M., Penner, G. B., Hernandez-Sanabria, E., Oba, M., and Guan, L. L. (2009). Effects of sampling location and time, and host animal on assessment of bacterial diversity and fermentation parameters in the bovine rumen. J. Appl. Microbiol. 107, 1924–1934. doi: 10.1111/j.1365-2672.2009.04376.x
Liu, J., Pu, Y.-Y., Xie, Q., Wang, J. K., and Liu, J. X. (2015). Pectin induces an in vitro rumen microbial population shift attributed to the pectinolytic Treponema group. Curr. Microbiol. 70, 67–74. doi: 10.1007/s00284-014-0672-y
Liu, J. H., Zhang, M. L., Zhang, R. Y., Zhu, W. Y., and Mao, S. Y. (2016). Comparative studies of the composition of bacterial microbiota associated with the ruminal content, ruminal epithelium and in the faeces of lactating dairy cows. Microb. Biotechnol. 9, 257–268. doi: 10.1111/1751-7915.12345
Magoč, T., and Salzberg, S. L. (2011). FLASH: fast length adjustment of short reads to improve genome assemblies. Bioinformatics 27, 2957–2963. doi: 10.1093/bioinformatics/btr507
Mao, S. Y., Zhang, G., and Zhu, W. Y. (2008). Effect of disodium fumarate on ruminal metabolism and rumen bacterial communities as revealed by denaturing gradient gel electrophoresis analysis of 16S ribosomal DNA. Anim. Feed Sci. Technol. 140, 293–306. doi: 10.1016/j.anifeedsci.2007.04.001
Mayorga, O. L., Kingston-Smith, A. H., Kim, E. J., Allison, G. G., Wilkinson, T. J., Hegarty, M. J., et al. (2016). Temporal metagenomic and metabolomic characterization of fresh perennial ryegrass degradation by rumen bacteria. Front. Microbiol. 7:1854. doi: 10.3389/fmicb.2016.01854
McAllister, T. A., Bae, H. D., Jones, G. A., and Cheng, K. J. (1994). Microbial attachment and feed digestion in the rumen. J. Anim. Sci. 72, 3004–3018. doi: 10.2527/1994.72113004x
Meng, Q. X., Xia, Z. G., and Kerley, M. S. (2000). The requirement of ruminal degradable protein for non-structural carbohydrate-fermenting microbes and its reaction with cilution rate in continuous culture. Asian Australas. J. Anim. Sci. 13, 1399–1406. doi: 10.5713/ajas.2000.1399
Ministry of Agriculture, and Rural Affairs of the People’s Republic of China, (2004). Feeding Standards of Meat-Producing Sheep and Goats (NY/T 816-2004). Beijing: China Agriculture Press.
Newbold, C. J., de la Fuente, G., Belanche, A., Ramos-Morales, E., and McEwan, N. (2015). The role of ciliate protozoa in the rumen. Front. Microbiol. 6:1313. doi: 10.3389/fmicb.2015.01313
Niwińska, B., Hanczakowska, E., Arciszewski, M. B., and Klebaniuk, R. (2017). Review: exogenous butyrate: implications for the functional development of ruminal epithelium and calf performance. Animal 11, 1522–1530. doi: 10.1017/S1751731117000167
Ormerod, K. L., Wood, D. L. A., Lachner, N., Gellatly, S. L., Daly, J. N., Parsons, J. D., et al. (2016). Genomic characterization of the uncultured Bacteroidales family S24-7 inhabiting the guts of homeothermic animals. Microbiome 4:36. doi: 10.1186/s40168-016-0181-2
Owens, F. N., and Bergen, W. G. (1983). Nitrogen metabolism of ruminant animals: historical perspective, current understanding and future implications. J. Anim. Sci. 57(Suppl._2), 498–518.
Patra, A. K. (2015). “Urea/Ammonia metabolism in the rumen and toxicity in ruminants,” in Rumen Microbiology: from Evolution to Revolution, eds A. K. Puniya, R. Singh, and D. N. Kamra, (New Delhi: Springer India), 329–341. doi: 10.1007/978-81-322-2401-3_22
Perea, K., Perz, K., Olivo, S. K., Williams, A., Lachman, M., Ishaq, S. L., et al. (2017). Feed efficiency phenotypes in lambs involve changes in ruminal, colonic, and small-intestine-located microbiota. J. Anim. Sci. 95, 2585–2592. doi: 10.2527/jas2016.1222
Petri, R. M., Schwaiger, T., Penner, G. B., Beauchemin, K. A., Forster, R. J., McKinnon, J. J., et al. (2013). Changes in the rumen epimural bacterial diversity of beef cattle as affected by diet and induced ruminal acidosis. Appl. Environ. Microbiol. 79, 3744–3755. doi: 10.1128/aem.03983-12
Praet, J., Cnockaert, M., Meeus, I., Smagghe, G., and Vandamme, P. (2017). Gilliamella intestini sp. nov., Gilliamella bombicola sp. nov., Gilliamella bombi sp. nov. and Gilliamella mensalis sp. nov.: four novel Gilliamella species isolated from the bumblebee gut. Syst. Appl. Microbiol. 40, 199–204. doi: 10.1016/j.syapm.2017.03.003
Price, M. N., Dehal, P. S., and Arkin, A. P. (2009). FastTree: computing large minimum evolution trees with profiles instead of a distance matrix. Mol. Biol. Evol. 26, 1641–1650. doi: 10.1093/molbev/msp077
Quast, C., Pruesse, E., Yilmaz, P., Gerken, J., Schweer, T., Yarza, P., et al. (2013). The SILVA ribosomal RNA gene database project: improved data processing and web-based tools. Nucleic Acids Res. 41, D590–D596. doi: 10.1093/nar/gks1219
Ren, Q., Si, H., Yan, X., Liu, C., Ding, L., Long, R., et al. (2019). Bacterial communities in the solid, liquid, dorsal, and ventral epithelium fractions of yak (Bos grunniens) rumen. Microbiologyopen doi: 10.1002/mbo3.963 [Epub ahead of print].
Rosewarne, C. P., Cheung, J. L., Smith, W. J. M., Evans, P. N., Tomkins, N. W., Denman, S. E., et al. (2012). Draft genome sequence of Treponema sp strain JC4, a novel spirochete isolated from the bovine rumen. J. Bacteriol. 194, 4130–4130. doi: 10.1128/Jb.00754-12
Sadet, S., Martin, C., Meunier, B., and Morgavi, D. P. (2007). PCR-DGGE analysis reveals a distinct diversity in the bacterial population attached to the rumen epithelium. Animal 1, 939–944. doi: 10.1017/S1751731107000304
Sakata, T., and Tamate, H. (1979). Rumen epithelium cell proliferation accelerated by propionate and acetate. J. Dairy Sci. 62, 49–52. doi: 10.3168/jds.S0022-0302(79)83200-2
Schären, M., Kiri, K., Riede, S., Gardener, M., Meyer, U., Hummel, J., et al. (2017). Alterations in the rumen liquid-, particle- and epithelium-associated mcrobiota of dairy cows during the transition from a silage- and concentrate-based ration to pasture in spring. Front. Microbiol. 8:744. doi: 10.3389/fmicb.2017.00744
Schwab, C. G., and Broderick, G. A. (2017). A 100-year review: protein and amino acid nutrition in dairy cows. J. Dairy Sci. 100, 10094–10112. doi: 10.3168/jds.2017-13320
Shaani, Y., Zehavi, T., Eyal, S., Miron, J., and Mizrahi, I. (2018). Microbiome niche modification drives diurnal rumen community assembly, overpowering individual variability and diet effects. ISME J. 12, 2446–2457. doi: 10.1038/s41396-018-0203-0
Spanghero, M., Nikulina, A., and Mason, F. (2018). Use of an in vitro gas production procedure to evaluate rumen slow-release urea products. Anim. Feed Sci. Technol. 237, 19–26. doi: 10.1016/j.anifeedsci.2017.12.017
Sylvester, J. T., Karnati, S. K. R., Yu, Z., Morrison, M., and Firkins, J. L. (2004). Development of an assay to quantify rumen ciliate protozoal biomass in cows using real-time PCR. J. Nutr. 134, 3378–3384. doi: 10.1093/jn/134.12.3378
Taylor-Edwards, C. C., Hibbard, G., Kitts, S. E., McLeod, K. R., Axe, D. E., Vanzant, E. S., et al. (2009). Effects of slow-release urea on ruminal digesta characteristics and growth performance in beef steers. J. Anim. Sci. 87, 200–208. doi: 10.2527/jas.2008-0912
Wallace, R. J., Cheng, K. J., Dinsdale, D., and ØRskov, E. R. (1979). An independent microbial flora of the epithelium and its role in the ecomicrobiology of the rumen. Nature 279, 424–426. doi: 10.1038/279424a0
Wang, P., and Tan, Z. (2013). Ammonia assimilation in rumen bacteria: a review. Anim. Biotechnol. 24, 107–128. doi: 10.1080/10495398.2012.756402
Wang, Q., Garrity, G. M., Tiedje, J. M., and Cole, J. R. (2007). Naïve bayesian classifier for rapid assignment of rRNA sequences into the new bacterial taxonomy. Appl. Environ. Microbiol. 73, 5261–5267. doi: 10.1128/aem.00062-07
Xu, Y., Li, Z., Moraes, L. E., Shen, J., Yu, Z., and Zhu, W. (2019). Effects of incremental urea supplementation on rumen fermentation, nutrient digestion, plasma metabolites, and growth performance in fattening lambs. Animals 9:E652. doi: 10.3390/ani9090652
Yu, Z., and Morrison, M. (2004). Improved extraction of PCR-quality community DNA from digesta and fecal samples. Biotechniques 36, 808–812. doi: 10.2144/04365st04
Yutin, N., and Galperin, M. Y. (2013). A genomic update on clostridial phylogeny: gram-negative spore formers and other misplaced clostridia. Environ. Microbiol. 15, 2631–2641. doi: 10.1111/1462-2920.12173
Zheng, H., Nishida, A., Kwong, W. K., Koch, H., Engel, P., Steele, M. I., et al. (2016). Metabolism of toxic sugars by strains of the bee gut symbiont Gilliamella apicola. mBio 7:e01326-16. doi: 10.1128/mBio.01326-16
Keywords: urea, rumen bacerial community, different microenvironment, epithelium, fermentation parameter
Citation: Li Z, Mu C, Xu Y, Shen J and Zhu W (2020) Changes in the Solid-, Liquid-, and Epithelium-Associated Bacterial Communities in the Rumen of Hu Lambs in Response to Dietary Urea Supplementation. Front. Microbiol. 11:244. doi: 10.3389/fmicb.2020.00244
Received: 11 October 2019; Accepted: 31 January 2020;
Published: 21 February 2020.
Edited by:
Charles James Newbold, Scotland’s Rural College, United KingdomReviewed by:
Timothy John Snelling, Harper Adams University, United KingdomGabriel De La Fuente, Universitat de Lleida, Spain
Copyright © 2020 Li, Mu, Xu, Shen and Zhu. This is an open-access article distributed under the terms of the Creative Commons Attribution License (CC BY). The use, distribution or reproduction in other forums is permitted, provided the original author(s) and the copyright owner(s) are credited and that the original publication in this journal is cited, in accordance with accepted academic practice. No use, distribution or reproduction is permitted which does not comply with these terms.
*Correspondence: Junshi Shen, c2hlbmp1bnNoaUBuamF1LmVkdS5jbg==