 Chenying Wang1
 Xidong Ren
- 1State Key Laboratory of Biobased Material and Green Papermaking, Qilu University of Technology, Shandong Academy of Sciences, Jinan, China
- 2Shandong Provincial Key Laboratory of Microbial Engineering, Department of Bioengineering, Qilu University of Technology, Shandong Academy of Sciences, Jinan, China
- 3Process Development Department, IntellectiveBio Co., Ltd., Suzhou, China
Streptomyces albulus has commercially been used for the production of ε-poly-L-lysine (ε-PL), a natural food preservative, where acid stress is inevitably encountered in the biosynthesis process. To elucidate the acid tolerance response (ATR), a comparative physiology and transcriptomic analysis of S. albulus M-Z18 at different environmental pH (5.0, 4.0, and 3.0) was carried out. In response to acid stress, cell envelope regulated the membrane fatty acid composition and chain length to reduce damage. Moreover, intracellular pH homeostasis was maintained by increasing H+-ATPase activity and intracellular ATP and amino acid (mainly arginine, glutamate, aspartate and lysine) concentrations. Transcriptional analysis based on RNA-sequencing indicated that acid stress aroused global changes and the differentially expressed genes involved in transcriptional regulation, stress-response protein, transporter, cell envelope, secondary metabolite biosynthesis, DNA and RNA metabolism and ribosome subunit. Consequently, the ATR of S. albulus was preliminarily proposed. Notably, it is indicated that the biosynthesis of ε-PL is also a response mechanism for S. albulus to combat acid stress. These results provide new insights into the ATR of S. albulus and will contribute to the production of ε-PL via adaptive evolution or metabolic engineering.
Introduction
ε-Poly-L-lysine (ε-PL) is a homopolymer of 25-35 L-lysine residues with amide linkage between ε-amino and α-carboxyl groups (Shima and Sakai, 1977). It is biodegradable, water-soluble, heat-stable and exhibits widely antimicrobial spectra, including yeast, fungi, Gram-positive and Gram-negative bacteria, as well as antiphage activity. Moreover, ε-PL also shows excellent behavior in high safety. Therefore, ε-PL has been widely used as a natural food preservative in many countries, including Japan, Korea and the United States as well as China (Ren et al., 2015).
To date, commercial ε-PL production is mainly based on microbial fermentation by Streptomyces albulus which belongs to actinomycetes. As is known, actinomycetes is Gram-positive and the optimum pH for growth is neutral or alkalescent. However, the producing bacteria face acid stress in the biosynthesis of ε-PL: environmental pH spontaneously decreased from initial 6.8 to 3.0 during fermentation, while ε-PL production could only be detected when pH was below 5.0 and the maximum synthesis rate was obtained at about pH 4.0; moreover, the cells still retained a certain level of metabolic activity even at pH 3.0 (Kahar et al., 2001; Ren et al., 2015). Generally, it is believed that an acidic environment can lead to the decrease of intracellular pH (pHi), inactivation of acid-sensitive enzymes in the glycolytic pathway and structural damage of the cell membrane, intracellular macromolecules such as DNA and proteins, and thereby causing cell death (Cotter and Hill, 2003; Lund et al., 2014). Therefore, the ε-PL-producing strains exhibit acid tolerance, and it is very important to study the acid tolerance response (ATR) of the S. albulus.
In response to acid stress, the Gram-positive bacteria, e.g., Lactobacillus and Bacillus, employ a combination of constitutive and inducible strategies to counter the acidic environment, including alkalization of external environment, alterations in cell envelope, maintenance of pHi, expression of transcriptional regulators and production of general shock proteins and chaperones (Broadbent et al., 2010; Senouci-Rezkallah et al., 2011; Wu et al., 2012a; Lund et al., 2014; Ter Beek et al., 2015). Nevertheless, despite of the previous work on Gram-positive bacteria, the ATR of S. albulus has not been studied so far. In the present work, a comparative study on the physiological and transcriptional responses of S. albulus M-Z18, a ε-PL-producing strain, at different environmental pH for ε-PL biosynthesis (the highest pH 5.0, the optimum pH 4.0 and the lowest pH 3.0) was conducted to elucidate the ATR of S. albulus in the biosynthesis of ε-PL. To our knowledge, this is the first attempt to disclose the ATR of S. albulus.
Materials and Methods
Microorganism and Inoculum Preparation
Streptomyces albulus M-Z18 was used throughout this study, which was a mutagenesis from S. albulus Z-18 (CGMCC 10479). Agar slant medium, used to maintain the strain, composed of (g/L): glucose, 10; yeast extract, 5; beef extract, 5; MgSO4⋅7H2O, 0.5; K2HPO4⋅3H2O, 1; and agar 20, along with pH 7.0 before sterilization. Seed culture medium (M3G), contained (g/L): glucose, 50; yeast extract, 5; (NH4)2SO4, 10; KH2PO4, 1.36; K2HPO4⋅3H2O, 0.8; MgSO4⋅7H2O, 0.5; ZnSO4⋅7H2O, 0.04; FeSO4⋅7H2O, 0.03. Fermentation medium containing (g/L): glycerol, 60; (NH4)2SO4, 5; beef extract, 10; KH2PO4, 4; MgSO4⋅7H2O 0.8; FeSO4⋅7H2O, 0.05. Initial pH values of the above two media were adjusted to 6.8 with 2 M NaOH and/or 1 M H2SO4. All the media were sterilized in an autoclave for 20 min at 121°C. In each case, glucose was autoclaved separately. The slants were inoculated and incubated at 30°C for 7 days to obtain a heavy sporulated growth. After that time, spores were used for seed-culture inoculation (in a concentration of about 2 × 10⁵ spores/mL). The seed culture was grown in a 500 mL Erlenmeyer flask containing 80 mL of liquid medium and incubated at 30°C on a rotary shaker (200 r/min) for 24 h.
Batch Fermentation
A 5-L fermenter (BIOTECH-5BG, BaoXing Bio-Engineering Equipment, China) with a 3.5-L working volume and two Rushton turbines (Φ = 6 cm) was employed for batch fermentation in this study. Before the inoculation, temperature, aeration rate and agitation speed were maintained at 30°C, 0.5 vvm and 200 rpm, respectively, and initial pH was controlled at 6.8 via manual addition of ammonia water (12.5%, w/v). Approximately 300 mL of seed culture was used as the inoculum. Dissolved oxygen (DO) was set above 30% of air saturation, which was controlled by manually adjusting agitation speed from 200 to 800 rpm and aeration rate with a range of 0.5-2.5 vvm. During the fermentation process, pH and DO were respectively monitored online by pH and DO electrodes (K8S-225 and InPro6800, Mettler Toledo, Switzerland). To investigate the ATR of S. albulus M-Z18, pH was respectively maintained at 5.0, 4.0 and 3.0 by ammonia water (12.5%, w/v) when it spontaneously dropped from initial 6.8 to the set values, and then the cells were harvested at 27 h (Figure 1A). At this time, it was about 12 hours since pH spontaneously dropped to 4.0, which was in accordance with the acidic-shock time in our previous study (Ren et al., 2015).
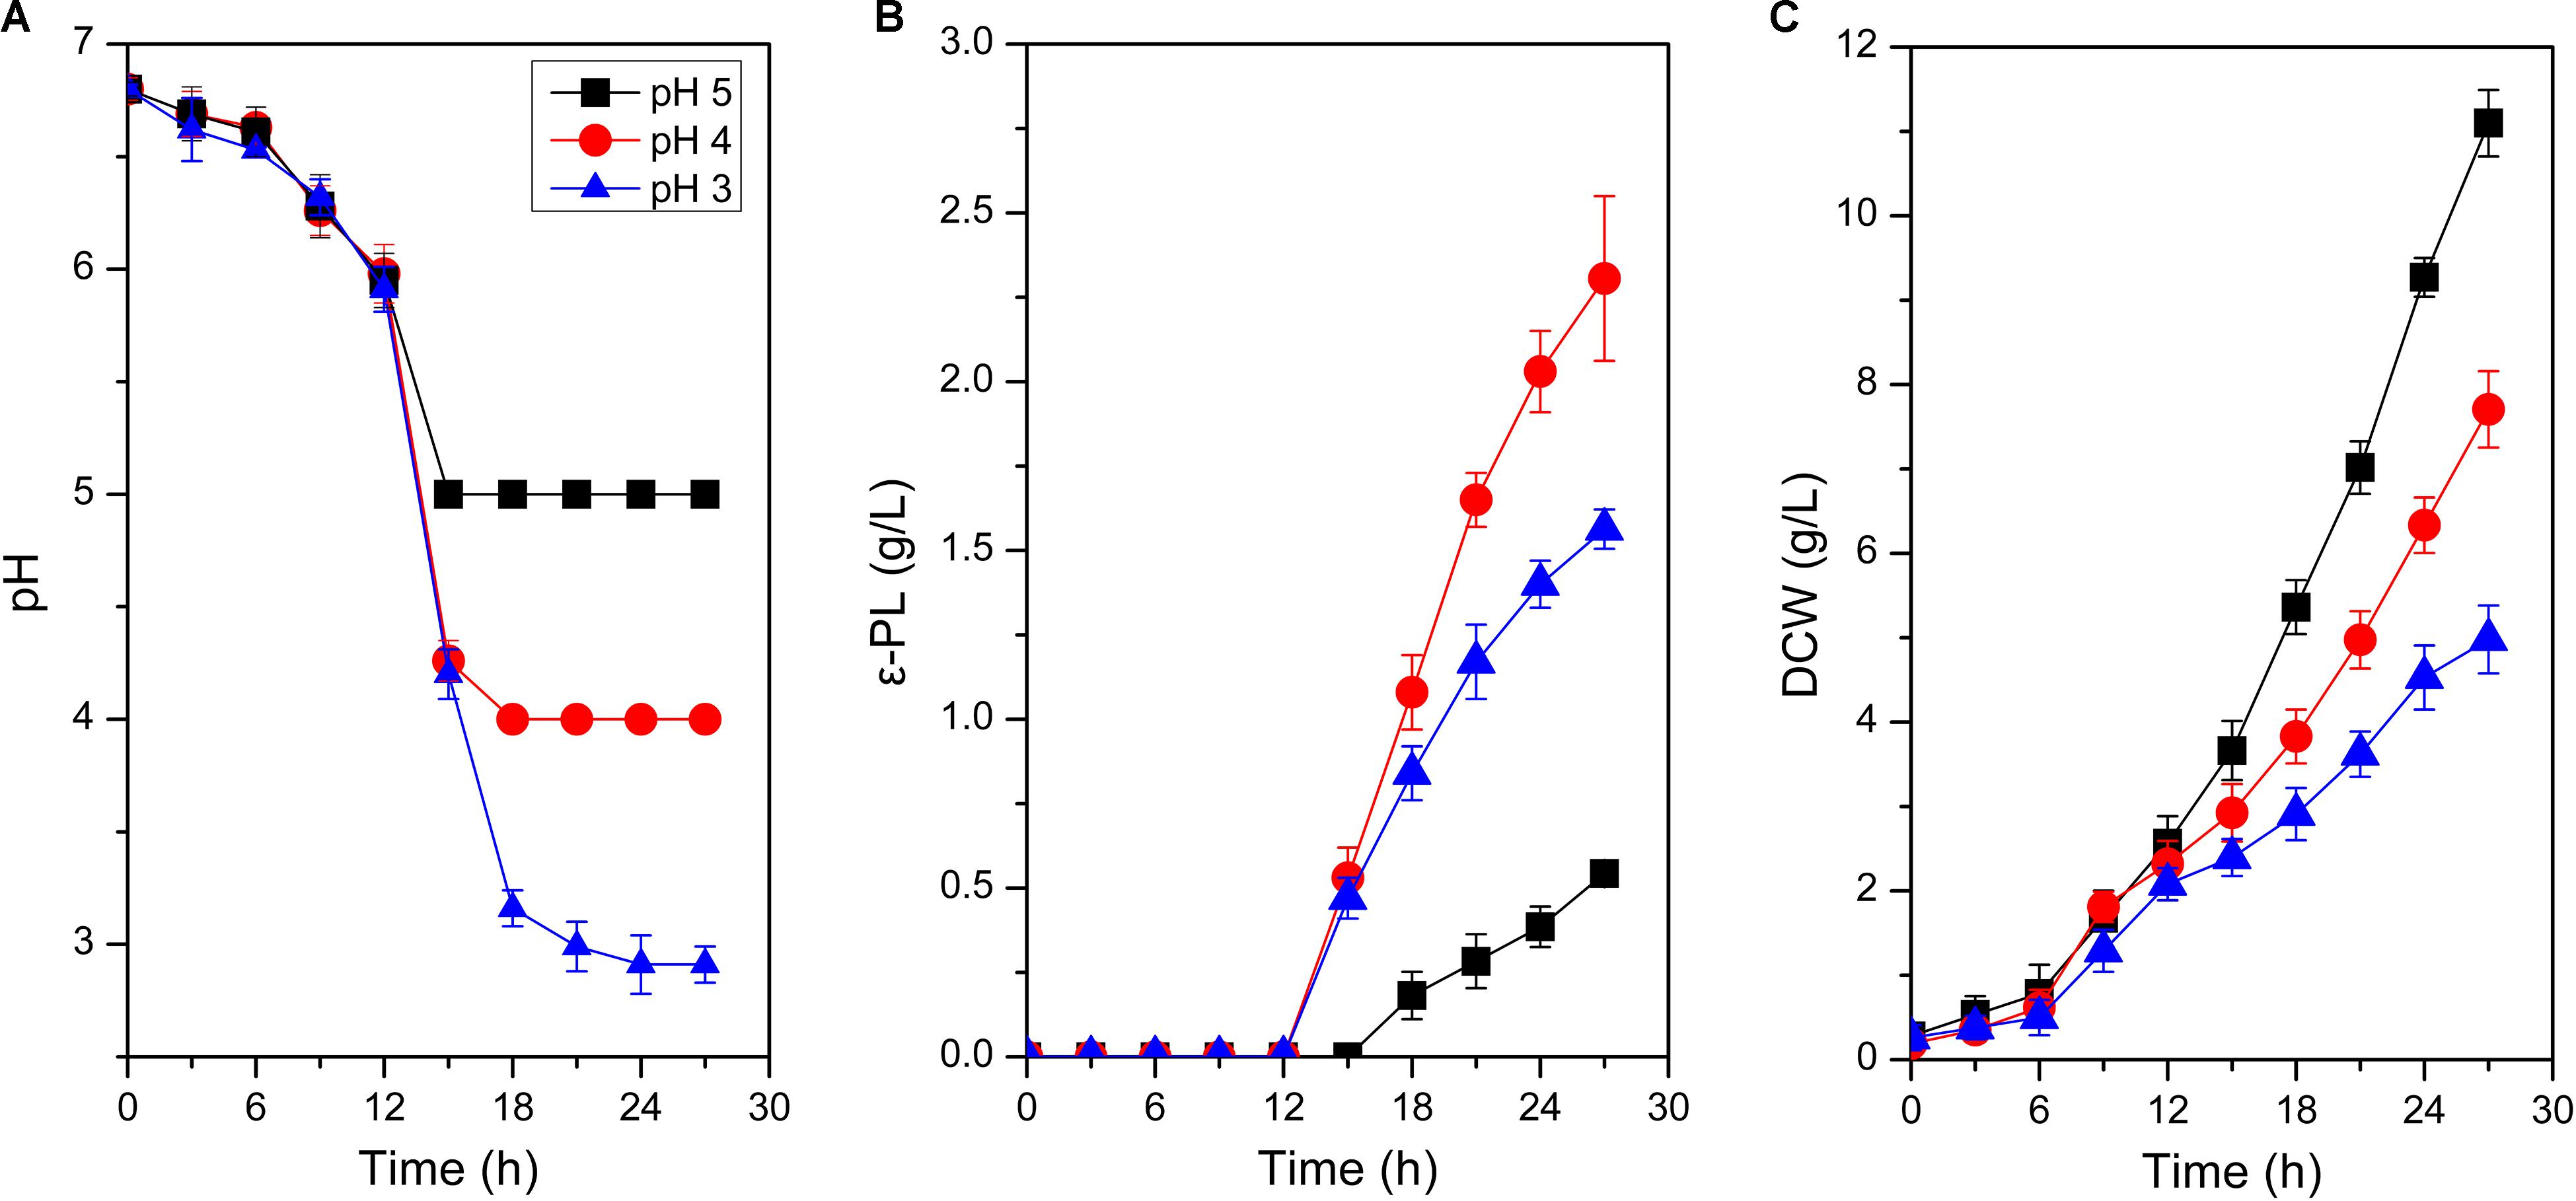
Figure 1. Time profiles of pH change (A), ε-PL production (B), and cell growth (C) in batch fermentations by S. albulus M-Z18 at different environmental pH (pH 5.0, 4.0, and 3.0). Error bars indicate the standard deviations from three parallel samples.
Measurement of Dry Cell Weights and ε-PL Concentration
Ten milliliters of culture broth was subjected to centrifugation at 4,500 × g for 10 min, and then the precipitate was used to measure the dry cell weights (DCW) of the culture. The supernatant was used to determine the ε-PL concentration according to the procedure described by Itzhaki (1972).
Scanning Electron Microscopy
Scanning electron microscopy (SEM) was used to observe the mycelia of S. albulus M-Z18 according to Shimada et al. (1993) with slight modification. Briefly, mycelia were first harvested by centrifugation at 4,500 × g for 10 min and washed twice with 0.1 M phosphate buffer (pH 7.0). After fixation with glutaraldehyde (2.5%, v/v) at 4oC for 4 h, the mycelia were washed thrice with the same phosphate buffer and then dehydrated with gradient ethanol solutions. Finally, the cells were freeze-dried and observed under a SEM (Quanta 200, FEI, United States).
Observation of Cell Membrane Integrity
To observe the integrity of cell membrane, the LIVE/DEAD Bac-Light Bacterial Viability Kit L-13152 (Invitrogen detection technologies, United States) containing two nucleic acid staining dyes, propidium iodide (PI) and SYTO 9, was used. The SYTO9 is a green fluorescent stain which enters all the cells, those with intact membranes as well as those with damaged ones. In contrast, PI only penetrates dead cells with damaged membranes. However, PI has a higher affinity for nucleic acids and displaces SYTO 9 in dead cells. Therefore, in the presence of both stains, bacteria with intact cell membranes appear to fluorescent green, whereas bacteria with damaged membranes appear red (Rioseras et al., 2014). Biomass samples drawn from the bioreactor were centrifuged, washed twice and re-suspended with saline (0.9% NaCl) to about 105-106 pellets per mL. The two stains were prepared and mixed together (1:1, v/v) as recommended by the manufacturer. Equal volume (20 μL) of the stain mixture and culture samples was mixed on a clean slide and left in the dark for at least 10 min (Singh et al., 2013). Then, the sample covered with a cover slip, analyzed under a Leica confocal laser-scanning microscope (TCS-SP8, Leica Microsystems, Germany), was sequentially excited at wavelengths of 488 nm and 568 nm and observed at emission wavelengths of 530 nm (green) and 630 nm (red), respectively. A significant number of images were analyzed in a minimum of three independent culture analyses.
Fatty Acids Extraction and Analysis
The extraction of fatty acids from cells and the subsequent determination were operated according to Sasser (1990). Mycelia collected by centrifugation (4,500 × g at 4oC for 10 min) were washed twice with saline (0.9% NaCl), and then sequentially processed by saponification, methylation, extraction and base wash. The top organic phase was used for GC-MS (TSQ Quantum XLS, Thermo Fisher Scientific, United States) determination.
Measurement of Intracellular pH, H+-ATPase and ATP
Intracellular pH (pHi) was measured using 2’,7’-bis-(2-carboxyethyl)-5(and 6)-carboxyfluorescein acetoxymethyl ester (BCECF AM) as the fluorescent probe. The biomass sample grown at different pH values (3.0, 4.0 and 5.0) were harvest by centrifugation (4,500 × g at 4oC for 10 min) and washed thrice with 0.1 M phosphate buffer (pH 7.0). The wet mycelia were re-suspended with the same buffer and disrupted by ultrasonic (650 w, 2s/2s) in an ice bath. After removal of the unbroken mycelia by centrifugation (600 × g at 4oC for 4 min), the remaining hyphal fragments were used to determine the pHi. Incubation of cells with BCECF AM, calibration and determination of pHi were done following the procedure described by Breeuwer et al. (1996).
The H+-ATPase activity was measured with the H+-ATPase assay kit (GENMED, China) following manufacturer’s protocol. The activity of the H+-ATPase was expressed in nanomoles of the NADH oxidized per minute per milligram protein.
Intracellular ATP was determined as described by Wu et al. (2012a). In brief, biomass sample extracted from the fermenter was immediately quenched by liquid nitrogen. Then, 0.6 M HClO4 was added in duplicate and both supernatants collected by centrifugation (12,000 × g at 4oC for 10 min) were blended. The mixture was adjusted to pH 7.0 with 1 M KOH and filtrated by a 0.22 μm membrane for HPLC determination.
Intracellular Amino Acids Determination
Two milliliters of biomass sample were harvested by centrifugation at 4,500 × g for 10 min, washed thrice with ultrapure water. The cells were re-suspended with 1 mL of 10% trichloroacetic acid at 37oC for 10 min, and then boiled for 15 min. Cell debris were discarded by centrifugation (12,000 × g at 4oC for 10 min), and the supernatant was analyzed by HPLC according to the method of Fountoulakis and Lahm (1998).
mRNA Sequencing and Transcriptome Analysis
For transcriptome analyses, 10 mL samples were separately withdrawn from three independent batch fermentations (biological replicates) at 27 h. These samples were immediately mixed together and quenched with liquid nitrogen for total RNA extraction. Total RNA was extracted using a RiboPureTM-Yeast Kit (Life technologies, United States). Further processing with DNase I (NEB, United States) was made to digest DNA and rRNA was also removed by Ribo-ZeroTM Magnetic Kit (Epicentre, United States) to reduce sequencing interference. The mRNA was interrupted to short fragments and reverse-transcribed into single-stranded cDNA. A double-stranded cDNA was synthesized in a double-stranded synthetic reaction system, which was sequentially purified with Agencourt RNAClean XP Kit (Beckman Coulter, United States), end repaired, d(A) added and ligated to Illumina sequencing adaptors. After that, suitable fragments were selected and PCR amplification was carry out. Finally, the constructed cDNA library was sequenced using Illumina HiSeqTM 2000. The sequencing raw reads were filtered to discard adapters, unknown or low quality bases and clean reads were obtained.
These filtered clean reads were mapped to the complete genome of S. albulus ZPM (NCBI accession no. NZ_CP006871) with the employment of SOAPaligner/SOAP2. Differentially expressed genes (DEGs) with transcription differences more than 2-folds (p-values < 0.001, FDR < 0.001) under two comparison groups (pH 5.0 vs pH 4.0, pH 4.0 vs pH 3.0) were screened out, respectively.
Quantitative Reverse Transcription-PCR (qRT-PCR) Validation
To ensure the reliability of RNA-sequencing data, 7 DEGs (mprA, pepD, sigE, hrdD, pls, pld and htpX) related to signal transduction, ε-PL synthesis and degradation, and stress response were verified by qRT-PCR. Total RNA was obtained as section 2.9. cDNA was synthesized using AMV First Strand cDNA Synthesis Kit (Sangon Biotech, China). The qRT-PCR was conducted in a ABI Stepone plus Real-time PCR instrument (Applied Biosystems, United States) and performed using a SG Fast qPCR Master Mix (High Rox) (Bio Basic, Canada) with a 20 μL system: 10 μL SybrGreen qPCR Master Mix (2X), 0.4 μL PCR forward primer (10 μM), 0.4 μL PCR reverse primer (10 μM), 7.2 μL ddH2O and 2 μL cDNA template. The parameters were: pre-incubation at 95oC for 3 min and 40 cycles of amplification step (melt at 95oC for 5 s, anneal 60oC for 10 s and extend at 72oC for 15 s). The 16S rDNA was used as endogenous reference gene. The qRT-PCR primers were designed using Primer Premier 5.0 (Supplementary Table S1). All experiments were repeated with at least three biological replicates.
Statistical Analysis
To check the reproducibility, the experiments were carried out at least triplicate. The statistical significance of the data was determined by SPSS Statistics 20 (IBM, United States) using analysis of a one-way analysis of variance (ANOVA) followed by Tukey’s honestly significant difference (HSD) post hoc test (p ≤ 0.05).
Data Availability Statement
RNA-seq data of S. albulus M-Z18 at different environmental pH values (pH 5.0, 4.0 and 3.0) were deposited at Sequence Read Archive (SRA) of National Center for Biotechnology Information (NCBI) under the accessions of SAMN14996498, SAMN14996497 and SAMN14996496, respectively.
Results and Discussion
Physiological Analysis
Growth Performance and ε-PL Production of S. albulus M-Z18 at Different Environmental pH
As shown in Figure 1, environmental pH could significantly affect cell growth and ε-PL production. Biomass gradually decreased when pH declined from 5.0 to 3.0. With the decline of environmental pH, DCW decreased from the maximum of 11.10 ± 0.39 g/L at pH 5.0 to the minimum of 4.98 ± 0.40 g/L at pH 3.0, with 55.14% decrease (Figure 1C). However, the influence of environmental pH on ε-PL production was much different from that of cell growth (Figure 1B). When pH was set at 4.0, ε-PL production reached the maximum of 2.31 ± 0.24 g/L, while the minimum ε-PL production of 0.54 ± 0.03 g/L was achieved at pH 5.0. These phenomena were in accordance with those observed in other ε-PL-producing strains (Kahar et al., 2001; Shih and Shen, 2006). To exemplify, Kahar et al. (2001) found that ε-PL production at pH 3.0, 4.0, 5.0, and 6.0 was 0.6, 8.2, 0.4, and 0.0 g/L, respectively. Likewise, cell growth was suppressed with the decrease of environmental pH. It could be concluded that environmental pH shows identical impact on cell growth and ε-PL production in the overall ε-PL-producing strains. Notably, ε-PL production by the unit biomass increased with the decline of environmental pH. The Yε –PL/DCW (the mass ratio of ε-PL to DCW) at pH 5.0, 4.0 and 3.0 was 0.05, 0.30, and 0.31 g/g DCW, respectively. Therefore, analyses on the response mechanisms of S. albulus M-Z18 to acid stress could not only enrich the content of ATR in Gram-positive bacteria but disclose why ε-PL production was promoted by acid stress.
Effects of Environmental pH on the Cell Envelope of S. albulus M-Z18
Bacterial cell envelope, consist of cell wall and cell membranes, is an essential defensive barrier against various environmental stresses (Tran et al., 2019). Cell wall is the first barrier to contact with outside, which plays an important role against the adverse environment. Therefore, the effect of environmental pH on cell wall was first carried out. As shown in Figure 2, mycelia retained an intact and regular shape at different environmental pH (5.0, 4.0 and 3.0), indicating the integrity of cell wall structure and function. Consequently, it could provide the prerequisite for cell to maintain normal physiological metabolism under acid stress. Notably, when environmental pH was set at 4.0, vesicular protuberances emerged on mycelium surfaces. It is hypothesized that the vesicular protuberances might be related to the synthesis or secretion of secondary metabolites by S. albulus.
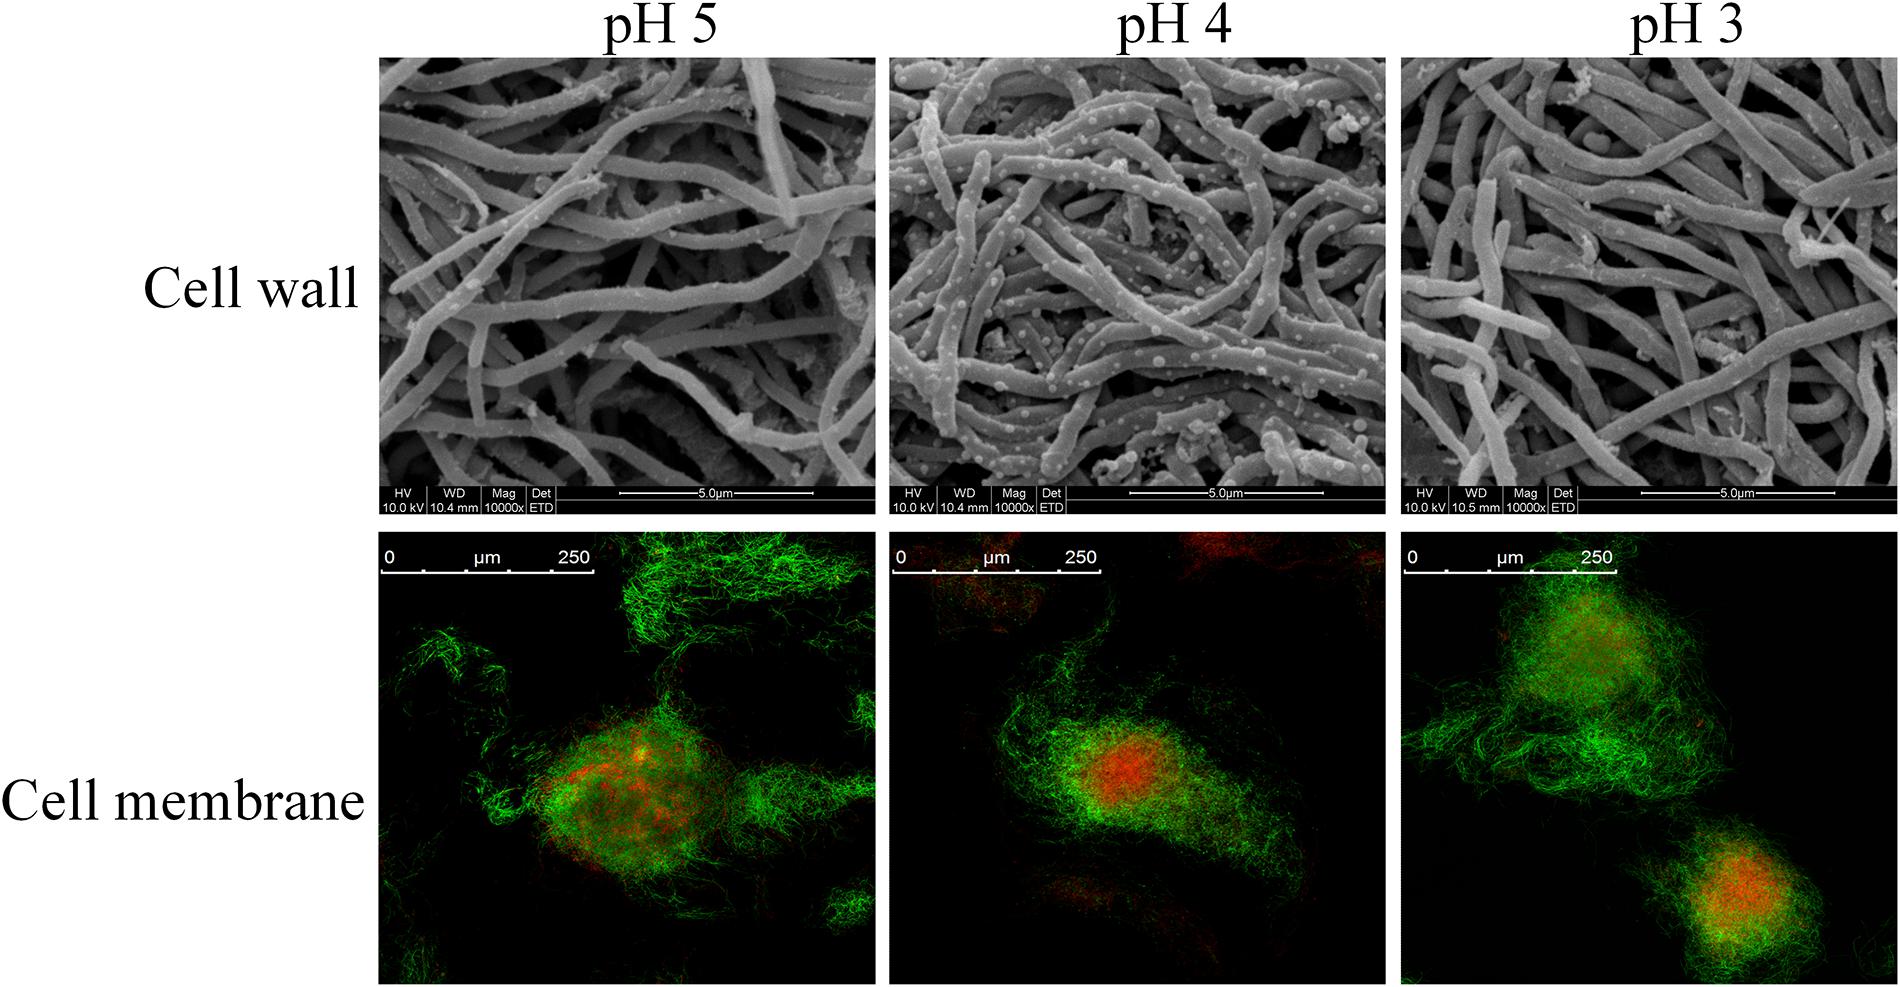
Figure 2. Scanning electron microscope and confocal laser scanning microscope stained by SYTO9 and PI of S. albulus M-Z18 in batch fermentations at different environmental pH (pH 5.0, 4.0, and 3.0). Samples were collected at 27 h.
While cell wall shows little effect on permselectivity, the semipermeable cell membrane becomes the foremost barrier for cell to separate from outside. Cell membrane plays important roles in substance transport, energy metabolism, cellular growth and maintenance of a constant intracellular environment (Denich et al., 2003; Zhang and Rock, 2008). Structure integrity is the prerequisite for the function of cell membrane. Therefore, SYTO 9 and PI were first employed to observe the membrane integrity of S. albulus M-Z18 at different environmental pH. Figure 2 shows that the integrity of cell membrane scarcely changed with the decrease of environmental pH. This indicated that cell membrane maintained healthy structure and function even surrounded by acidic environment, which provided protection for the physiological function of cells. In addition, mycelia with red fluorescence, i.e., dead cells loss of membrane permeability, were found inside all of the pellets obtained at different environmental pH (5.0, 4.0, and 3.0). Cell death from the inside of pellets was a programmed process of mycelium differentiation in the submerged culture of Streptomyces, which was the prerequisite for the production of secondary metabolites (Manteca et al., 2008). Moreover, ε-PL production was found in the above three conditions, indicating that ε-PL production may also be caused by mycelium differentiation.
The regulation of membrane fatty acid composition is also an important approach for cells to combat acid stress (Denich et al., 2003). Moreover, the modulation of unsaturated and saturated fatty acid ratio (U/S ratio) and fatty acid chain-length could directly influence the liquidity and stability of the cell membrane (Russell, 1984). Figure 3 shows the alterations of saturated and unsaturated fatty acids distributions in the membrane of S. albulus M-Z18 under acid stress. It is observed that the membrane fatty acids of S. albulus M-Z18 mainly contained saturated fatty acids of myristic acid (C14:0), pentadecane acid (C15:0), palmitic acid (C16:0) and heneicosanoic acid (C21:0) and unsaturated fatty acids of myristoleic acid (C14:1), oleic acid (C18:1) and cyclopropane fatty acid (CFA). With the decrease of environmental pH, the contents of saturated fatty acids (C14:0, C15:0 and C21:0) decreased (Figure 3A), while the contents of unsaturated fatty acids (C14:1 and CFA) increased (Figure 3B). Notably, the most significant increase was found in the content of C14:1, which increased from the minimum of 9.01 ± 0.06% at pH 5.0 to the maximum of 15.41 ± 2.70% at pH 3.0, with 71.03% increase (Figure 3B). Besides, the increase of CFA could compact the cell membrane structure and prevent the invasion of harmful substances (Yin et al., 2019). Likewise, membrane CFA content was also found to be a major factor in the acid resistance of Escherichia coli (Chang and Cronan, 1999). As a result, the U/S ratio was increased when environmental pH declined from 5.0 to 3.0 (Figure 3C). The increased proportion of unsaturated fatty acids with a concomitant decrease in the proportion of saturated fatty acids in its membrane to combat acid stress was also reported in other bacteria (Fozo and Quivey, 2004; Wu et al., 2012b; Xu et al., 2020). Besides, the membrane fatty acid chain-length was reduced under acid stress (Figure 3C). In addition to fatty acid distribution, alteration of fatty acid chain-length is another important approach used by cells to increase survival in acidic environment (Guerzoni et al., 2001; Wu et al., 2012b). It was reported that shorter-chain fatty acids are hard to span the membrane bilayer and cannot form hydrophobic interactions with other lipids and proteins, resulting in increased fluidity of the cell membrane (Cao-Hoang et al., 2008). Consequently, substance transport and energy metabolism on the cell membrane was facilitated, which would guarantee the normal function of cells under acid stress. However, the decrease of fatty acid chain-length would reduce the stability of cell membrane, and thereby cell death was more easily happened in acidic environment.
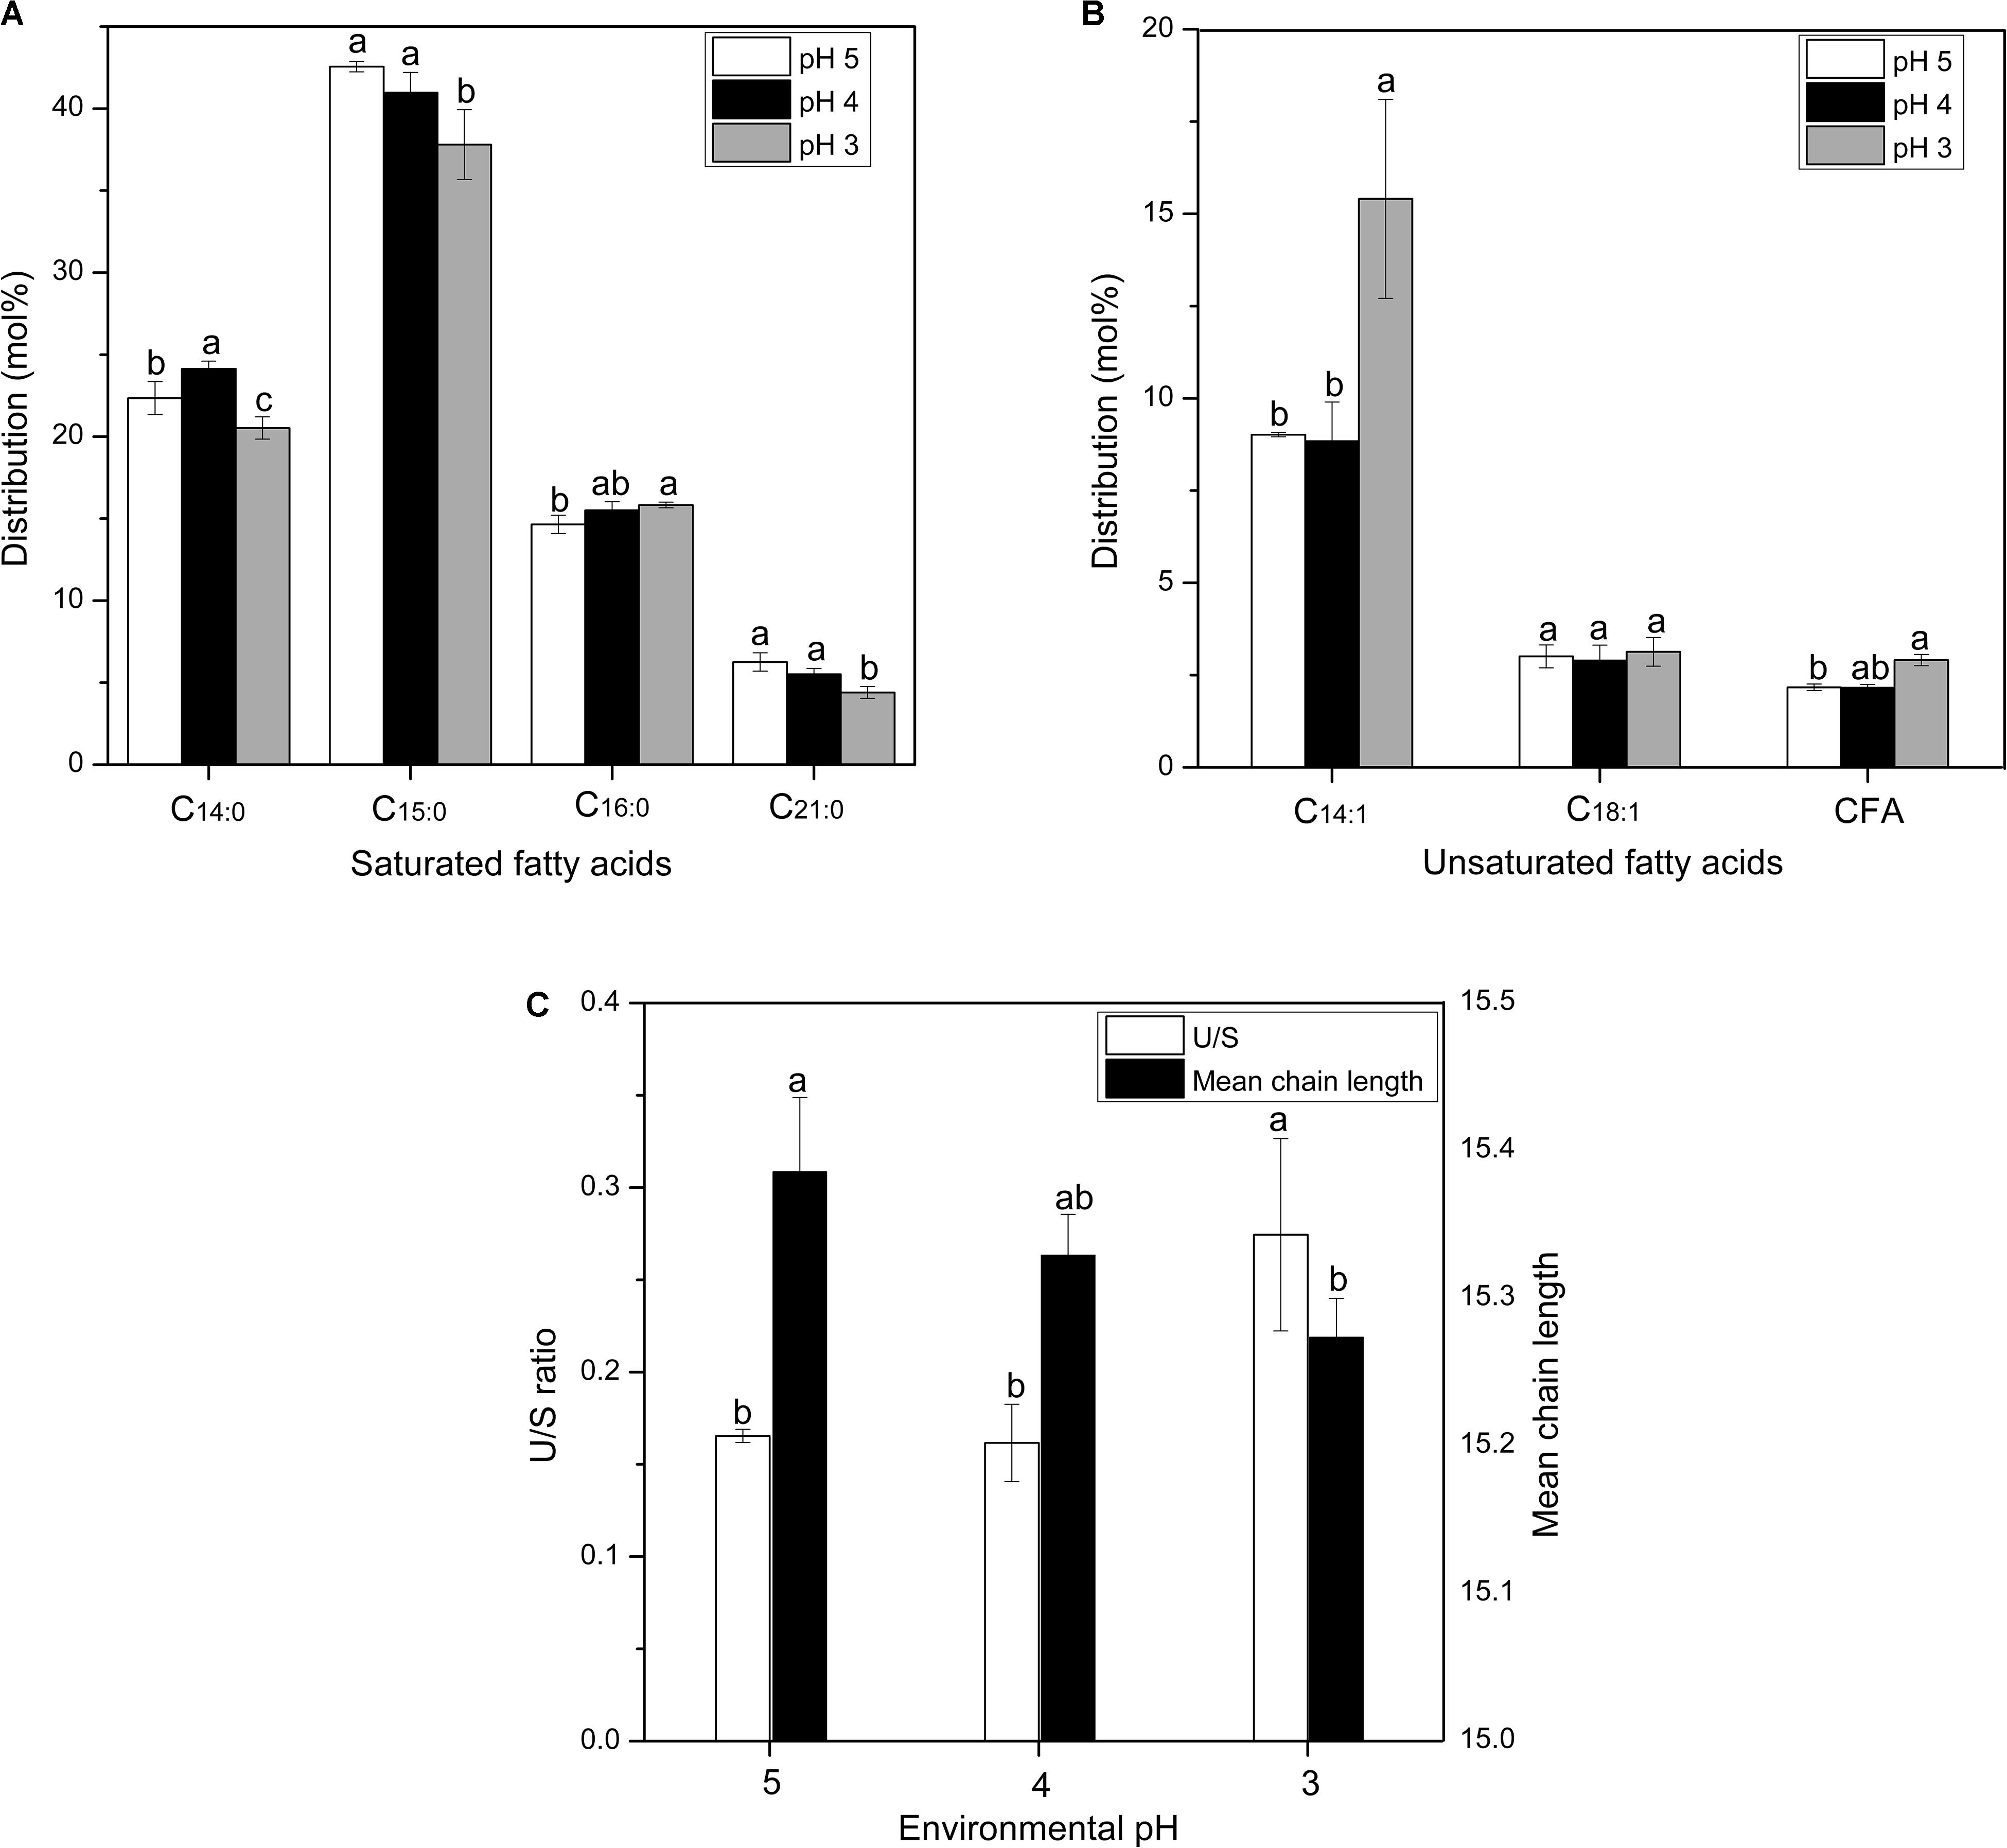
Figure 3. Changes in the distributions of membrane saturated fatty acid (A) and unsaturated fatty acid (B), U/S ratio and mean chain length (C) of S. albulus M-Z18 in batch fermentations at different environmental pH (pH 5.0, 4.0, and 3.0). Samples were collected at 27 h. Statistical significance is denoted by different letter for the same indicator.
Effects of Environmental pH on pHi, H+-ATPase Activity and Intracellular ATP Concentration
The pHi plays an important role in the growth and metabolism of cells, and it can affect the uptake of nutrients, protein synthesis, glycolysis and synthesis of nucleic acids (Hutkins and Nannen, 1993; O’Sullivan and Condon, 1997). When suffered with acid stress, the pHi of cells should maintain homeostasis, otherwise, protein and DNA damages would take place and finally lead to cell death (Budin-Verneuil et al., 2005). As the decline of environmental pH, the pHi of cells slightly decreased, but still maintained at about 7.7 (Figure 4A). Cells of S. albulus M-Z18 seemed to have the ability to stabilize pHi, which is essential for the survival of cells during acid stress. Corvini et al. (2000) also used BCECF AM as a fluorescent probe to determine pHi, after image analysis by fluorescence microscopy, the pHi of S. pristinaespiralis was disclosed ranging from 6.3 to 8.7. Although the methods used were different, but the resulting pHi values were consistent with this study. In addition, Yamanaka et al. (2008) reported that ε-PL synthetase (Pls) is a membrane enzyme and the maximum activity of purified Pls occurred at an optimum pH of 8.5. In vitro, the enzyme activity was significantly inhibited with the decline of pH from 8.5, and the activity decreased to about 20% of relative activity at pH 6.8. However, the optimum environmental pH for ε-PL synthesis is about 4.0 (Kahar et al., 2001; Ren et al., 2015). Thus, there is a certain contradiction. In the present study, we found that even the environmental pH dropped to 4.0 or 3.0, the mycelia could still maintain pHi at about 7.7. Therefore, the Pls could maintain about 65% of relative activity in the process of ε-PL biosynthesis according to the study by Yamanaka et al. (2008).
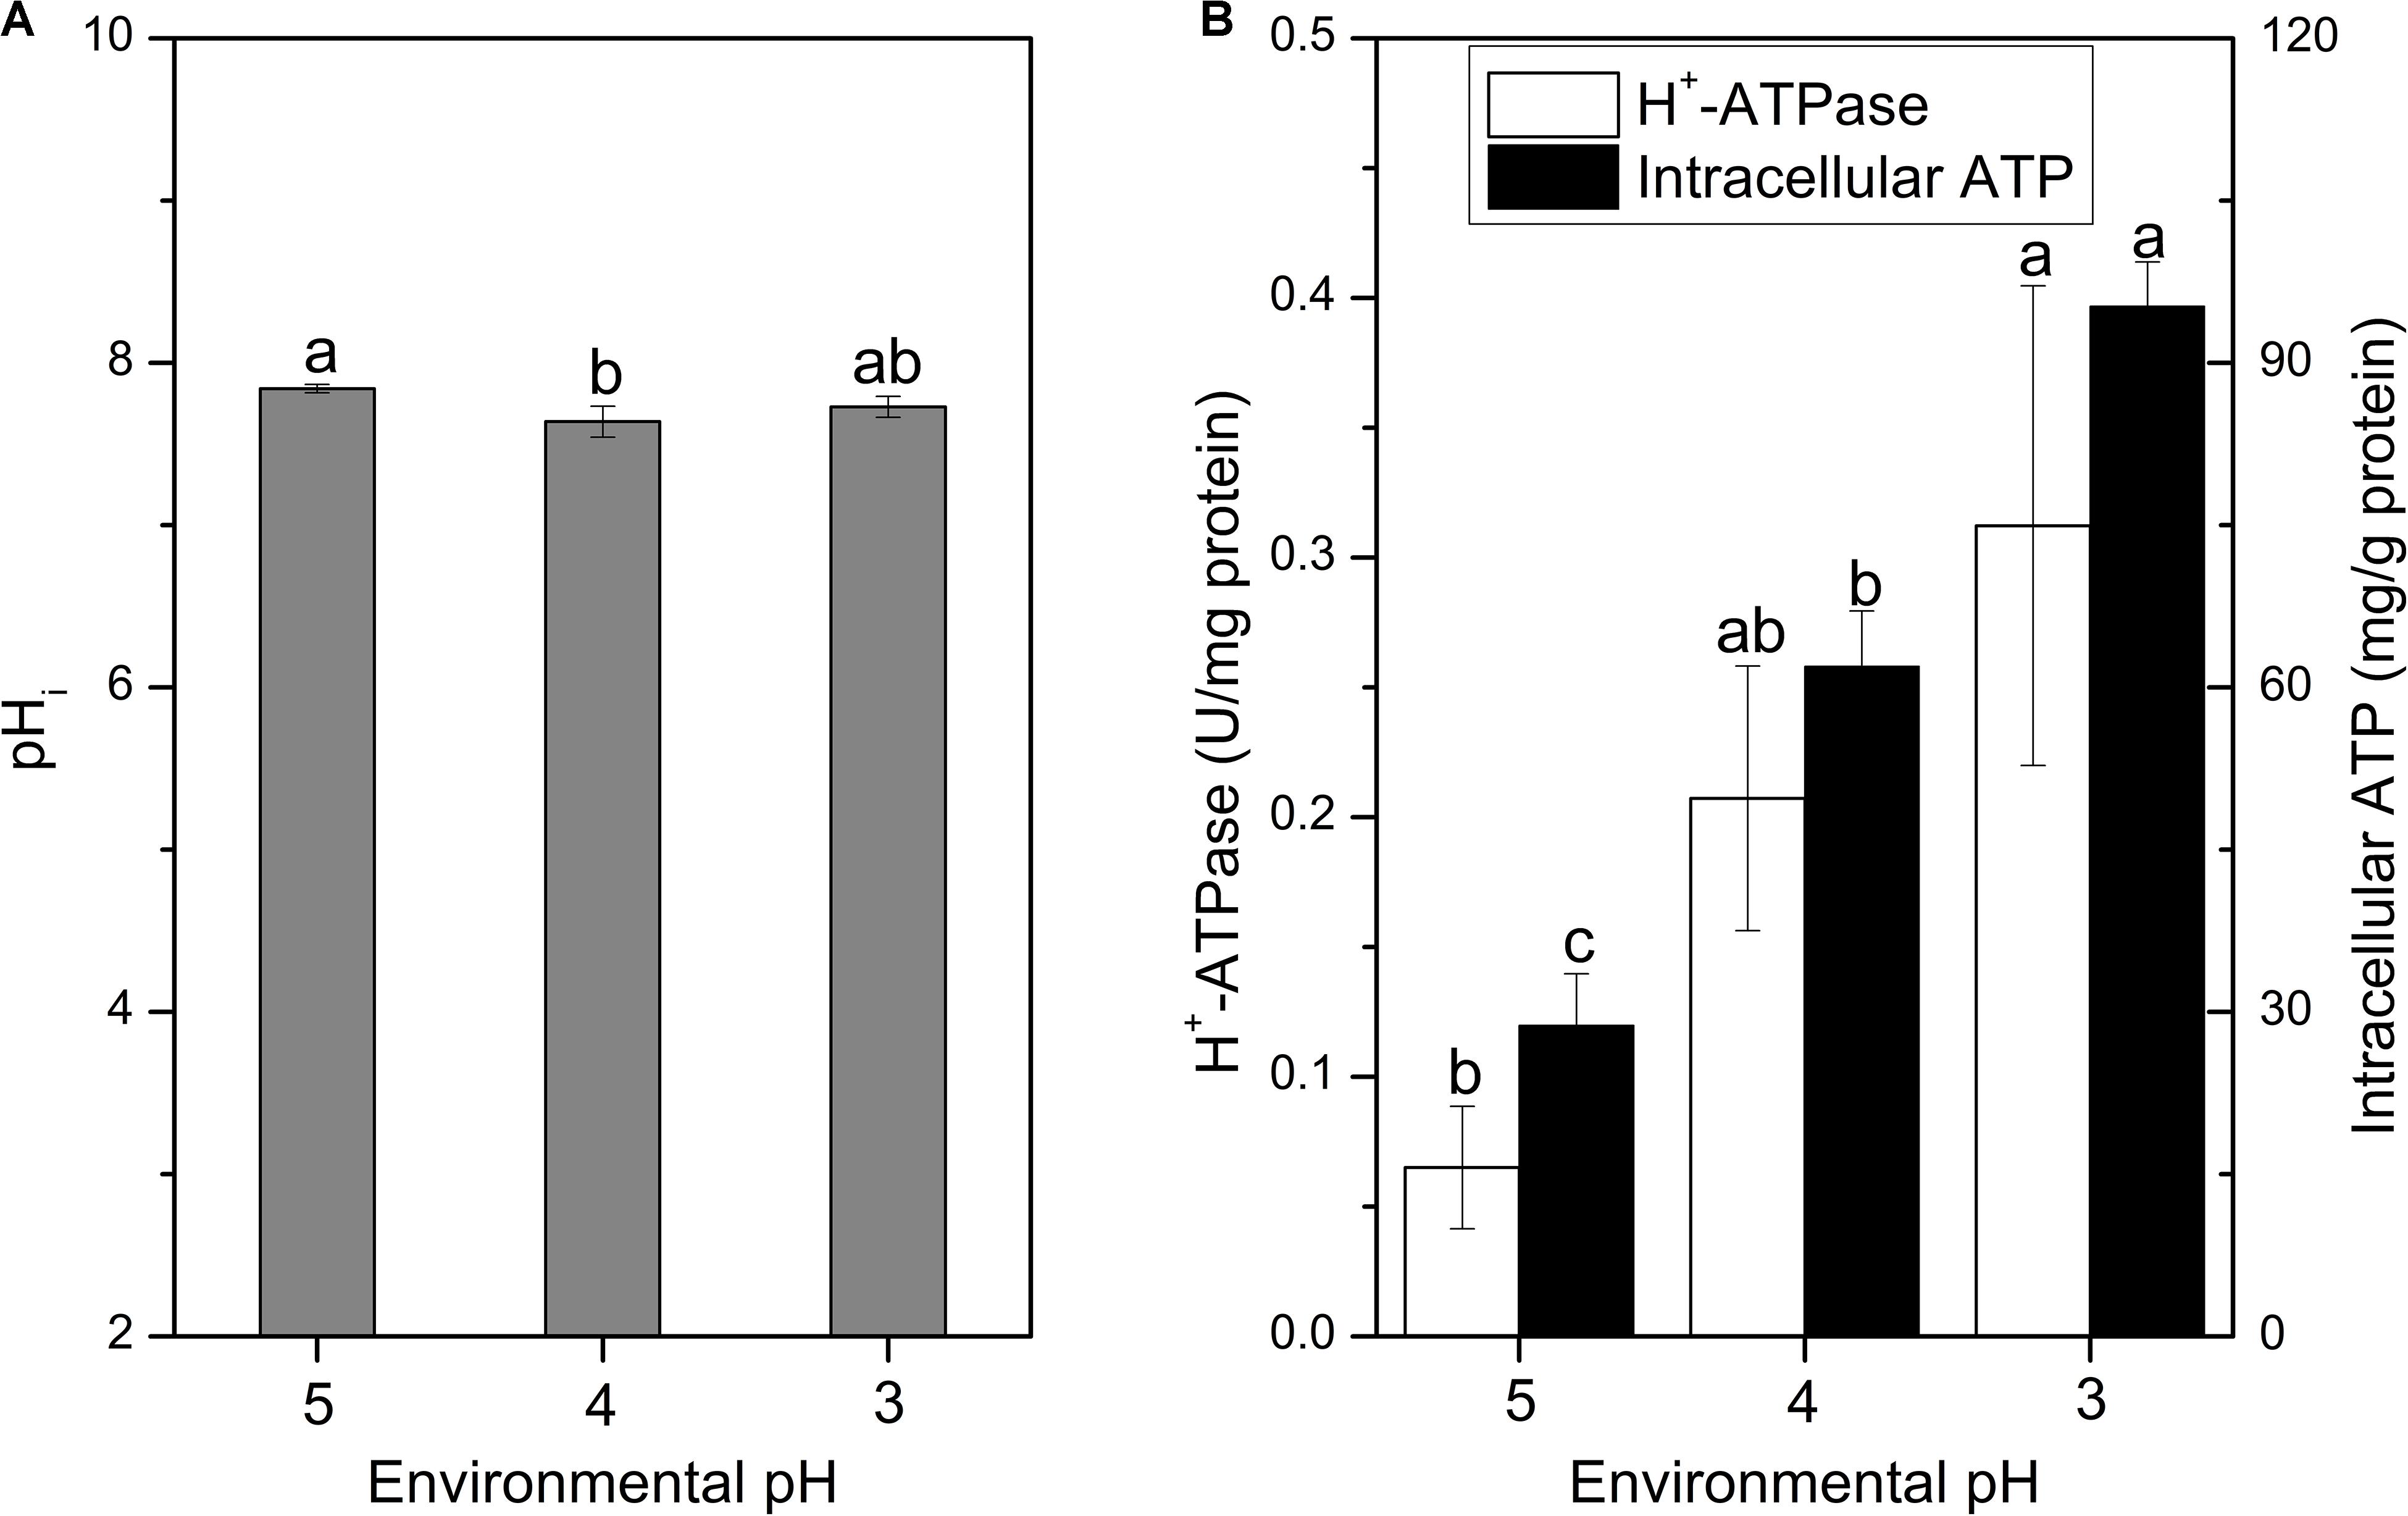
Figure 4. Changes in pHi (A), H+-ATPase and intracellular ATP concentration (B) of S. albulus M-Z18 in batch fermentations at different environmental pH (pH 5.0, 4.0, and 3.0). Samples were collected at 27 h. Statistical significance is denoted by different letter for the same indicator.
It is reported that pHi homeostasis can be influenced by many factors, while the proton-translocating H+-ATPase plays the most important role; Meanwhile, the function of H+-ATPase requires ATP to provide energy to pump intracellular proton (Cotter and Hill, 2003; Lund et al., 2014). Figure 4B shows that the H+-ATPase activity and intracellular ATP concentration gradually increased with the decrease of environmental pH. Therefore, the mycelia maintained higher H+-ATPase activity and intracellular ATP concentration under lower environmental pH, so that the intracellular proton could be effectively pumped out of the cell to maintain the pHi stable. Similarly, Lactobacillus plantarum could produce more ATP through glycolysis to enhance oxidative tolerance (Zhai et al., 2020). However, the increase of intracellular ATP concentration in S. albulus M-Z18 was not caused by the acceleration of ATP synthesis rate, but because the inhibition of cell growth by lower environmental pH reduced the consumption of intracellular ATP, resulting in its accumulation in cells (Yamanaka et al., 2010). Besides, Yamanaka et al. (2010) also demonstrated that the action of Pls requires a large amount of ATP to provide energy, while the lower environmental pH can lead to the accumulation of intracellular ATP, which provides sufficient energy for the activity of Pls.
Effects of Environmental pH on Intracellular Free Amino Acid Concentration
Amino acids play important roles in the microbial resistance to acid stress, including regulation of pHi, generation of metabolic energy and redox power (Fernández and Zúñiga, 2006; Lund et al., 2014). As shown in Figure 5, only the concentrations of arginine, glutamate, aspartate, lysine, serine and glycine showed increasing trends with the decrease of environmental pH. Figure 5A shows that arginine accounts for the highest proportion of the intracellular free amino acids. In fact, the arginine deaminase (ADI) system is considered to be an important factor to protect microbial cells against acidic environment (Senouci-Rezkallah et al., 2011; Wu et al., 2018). Besides, aspartate can be converted into arginine to participate in the ADI system, accompanied by the formation of NH3 (Fernández and Zúñiga, 2006). Moreover, aspartate can also form alanine to consume the intracellular proton. Likewise, aspartate was also found to enhance the resistance of bacteria to acidic environment in studies by Wu et al. (2012a) and Guan et al. (2013).
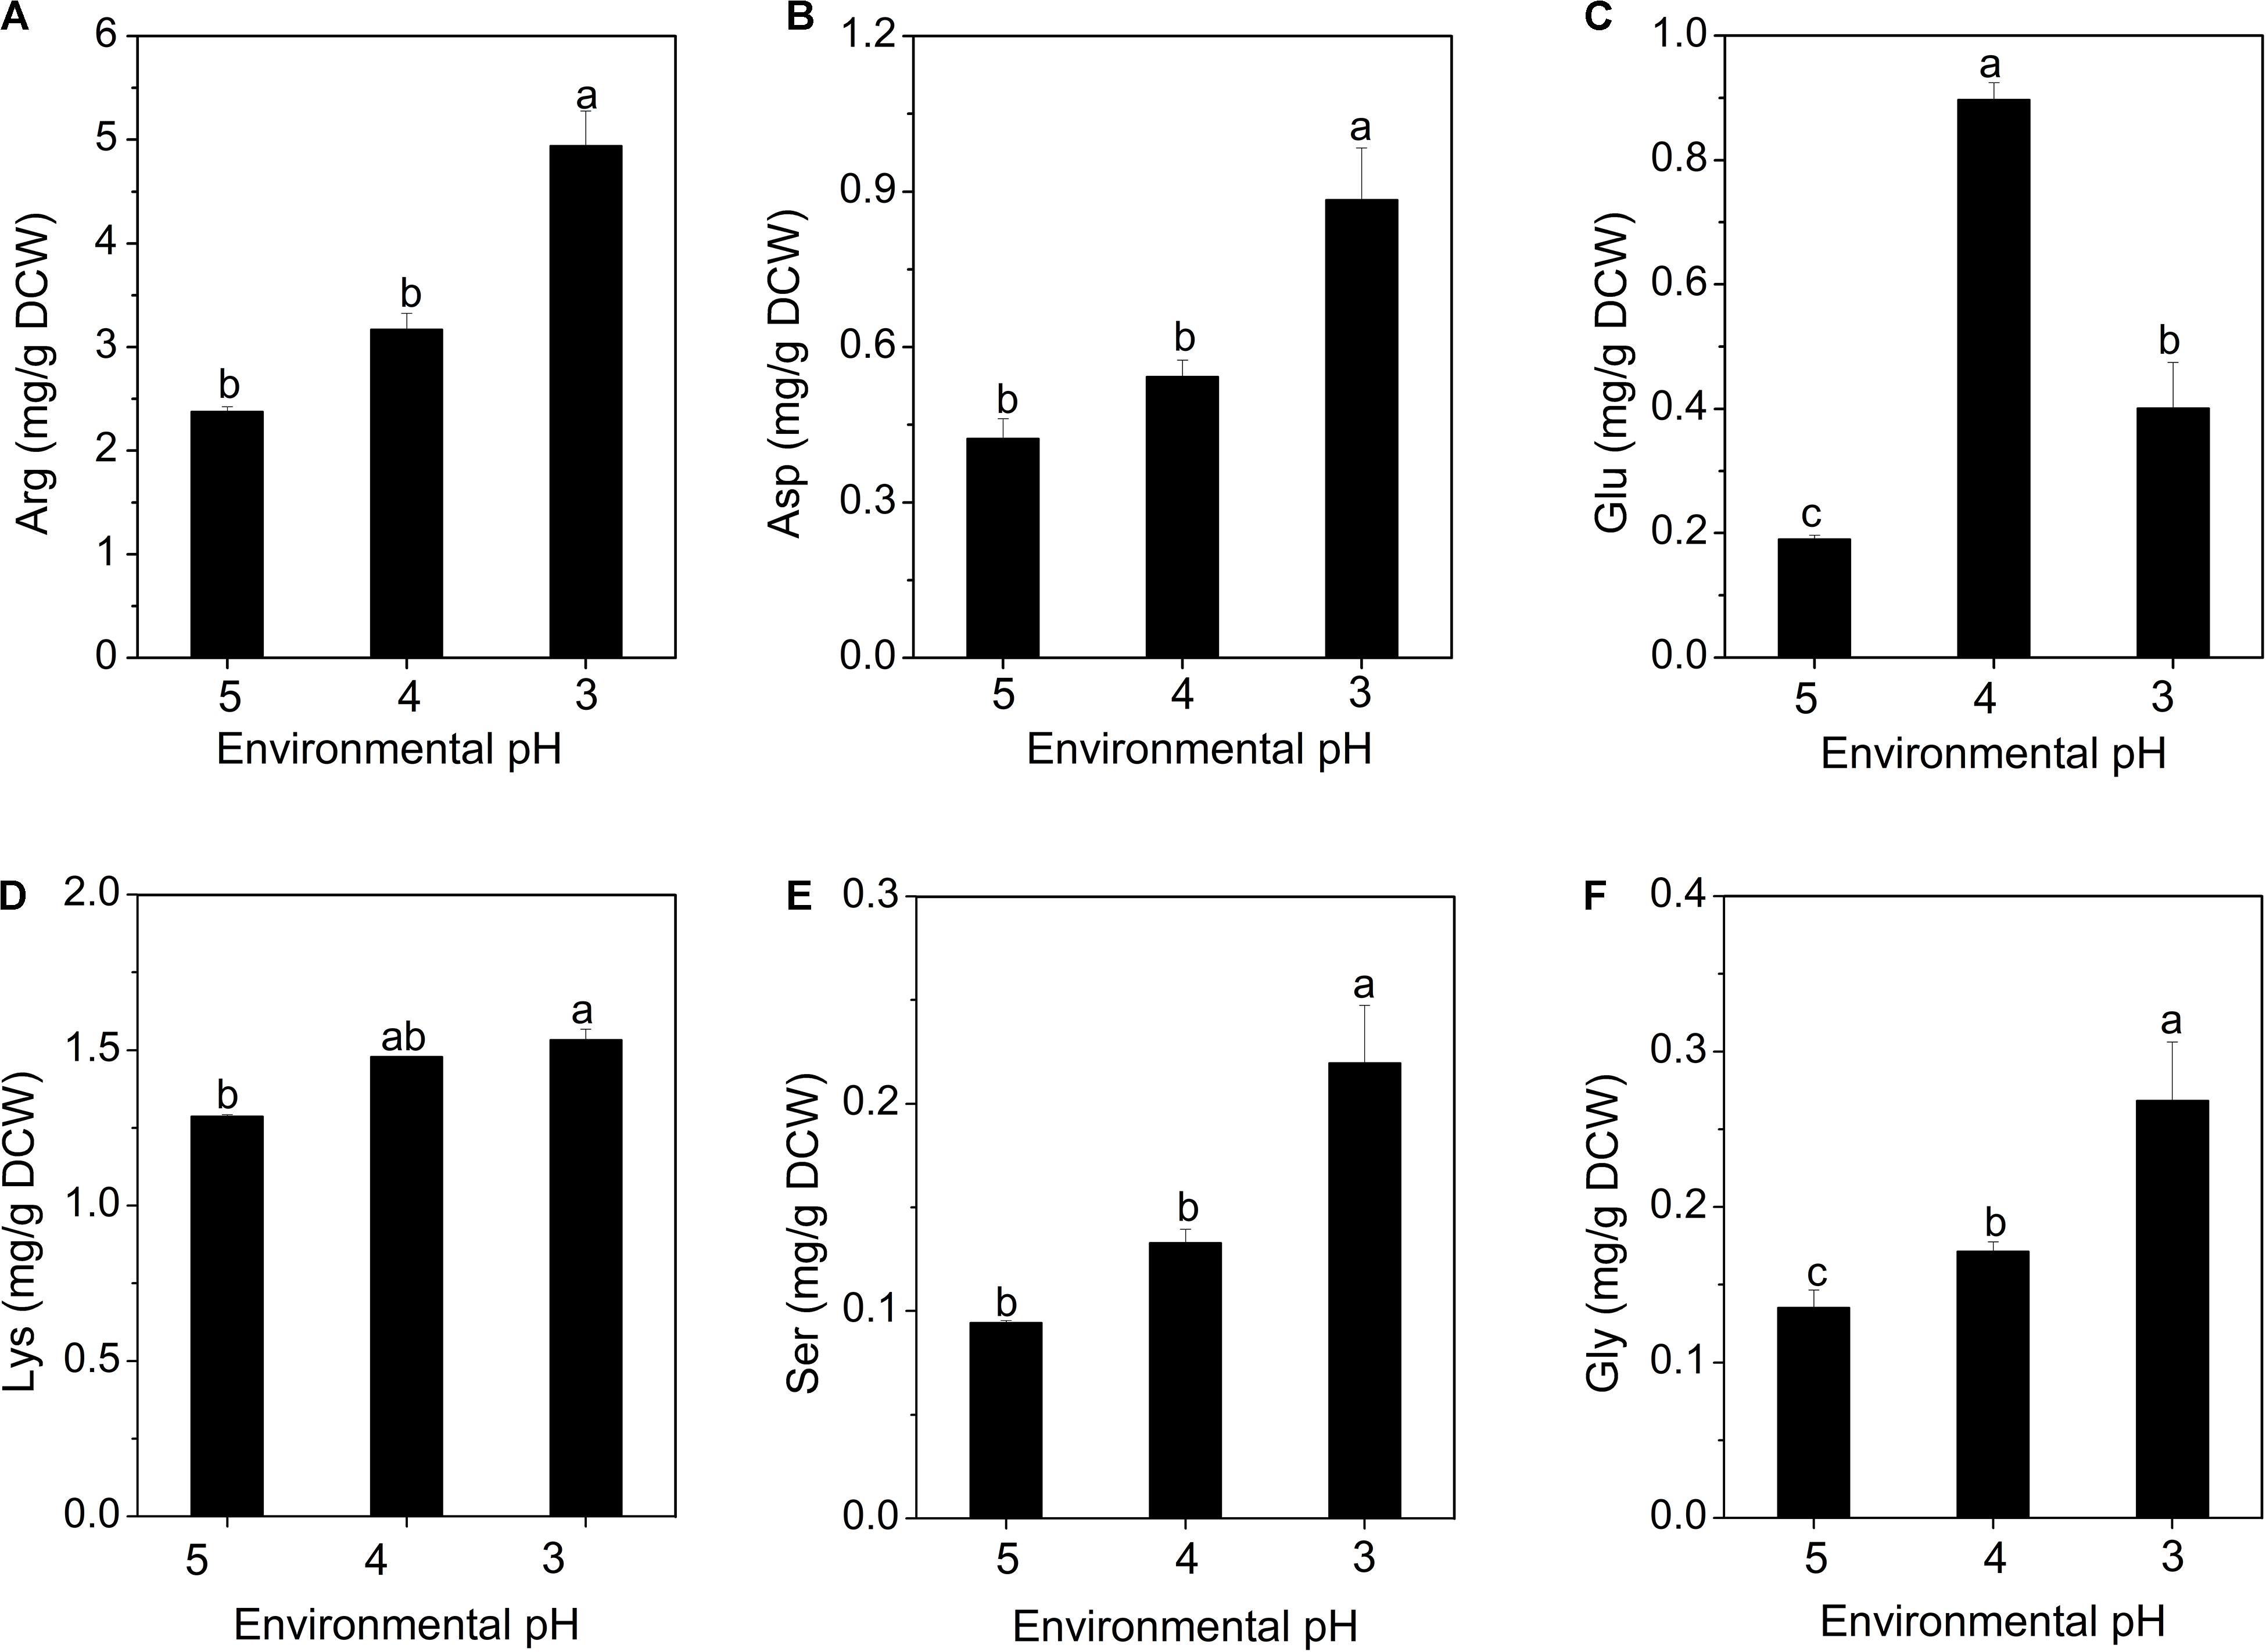
Figure 5. Changes in intracellular amino acid concentrations of S. albulus M-Z18 in batch fermentations at different environmental pH (pH 5.0, 4.0, and 3.0). Arginine (A), aspartate (B), glutamate (C), lysine (D), serine (E), and glycine (F). Samples were collected at 27 h. Statistical significance is denoted by different letter for the same indicator.
It has been reported that amino acid decarboxylase functions to maintain pHi by consuming intracellular protons as part of the decarboxylation reaction (Cotter and Hill, 2003; Lund et al., 2014). When the microorganism faces acidic environment, extracellular glutamate is transported to intracellular cytoplasm through a specific transporter, and converted into γ-aminobutyrate (GABA) and CO2 by glutamate decarboxylase (GAD), while consuming intracellular proton, subsequently, the synthesized GABA is released extracellularly by the antiporter. This process effectively reduces the concentration of intracellular proton and slows the acidification of the cytoplasm. Besides, GABA is less acidic than glutamate, this process also leads to the alkalization of environmental pH (Biase and Pennacchietti, 2012). The glutamate content increased when pH declined to 4.0. As the acid stress level increased to pH 3.0, it dropped sharply, because glutamate was rapidly consumed to combat the extreme acid stress (Figure 5C). The GAD system has also been found to play a vital role in resisting the acidic environment in many different bacteria (Cotter et al., 2001; Senouci-Rezkallah et al., 2011; Biase and Pennacchietti, 2012; Lund et al., 2014). Many studies have shown that lysine can also consume intracellular proton by the action of lysine decarboxylase, maintain pHi stability and enhance cell resistance to acid stress (Rhee et al., 2002; Senouci-Rezkallah et al., 2011). This study first reported that the acid resistance mechanism of S. albulus may be related to the accumulation of intracellular serine and glycine (Figures 5E,F), which may be also the action of decarboxylase. Besides, the accumulation of intracellular aspartate, glutamate and lysine is also beneficial for the biosynthesis of ε-PL, because lysine is a precursor of ε-PL, aspartate is a precursor of lysine, while glutamate provides an amino group for the biosynthesis of lysine (Yamanaka et al., 2008; Takehara et al., 2010).
Transcriptional Analysis
Screening and Cluster Analysis of the ATR Genes
To further disclose the global changes of S. albulus M-Z18 at transcriptional level under acid stress, a comprehensive RNA-sequencing analysis was employed. To explore the ATR genes, i.e., genes synchronously up-regulated or down-regulated with the decrease of environmental pH, we further examined the intersection of DEGs in the two comparison groups (pH 5.0 vs. pH 4.0, pH 4.0 vs. pH 3.0). The results showed that there were 350 shared DEGs, including 157 (44.86%) synchronously up-regulated genes and 121 (34.57%) synchronously down-regulated genes (Supplementary Material 2). In the ATR genes, there were 97 genes with clear functional annotations were selected, of which 33 (34.02%) were associate with transcriptional regulation, 11 (11.34%) were associated with stress-response protein, 16 (16.49%) were associated with transporter, 10 (10.31%) were associated with cell envelope, 15 (15.46%) were associated with secondary metabolite biosynthesis, 6 (6.19%) were associated with DNA and RNA metabolism, and 6 (6.19%) were associated with ribosome subunit (Supplementary Figure S1). Within the ATR genes, those assigned to transcriptional regulation, transporter and secondary metabolite biosynthesis were in majority, indicating that S. albulus M-Z18 mainly responded to acid stress through transcriptional regulation, substance transport and secondary metabolite biosynthesis.
Transcriptional Regulation
Bacteria mainly employ two kinds of signal transduction system to sense and respond to environmental stresses: two-component system (TCS) and extracytoplasmic function (ECF) σ factor. The two systems are functionally similar because they usually regulate gene expression by a membrane protein (a sensor kinase or an anti-σ factor) as a pressure sensor and a transcription factor (a response regulator or an σ factor) (Hutchings et al., 2004; Capra and Laub, 2012; Mascher, 2013).
As shown in Table 1, 17 TCS and 6σ factor genes were found to respond to acid stress, of which mprA/B, pepD, mtrA/B, sigE, and hrdD were identified and significantly up-regulated (except MAGL000280). The genes mprA/B, mtrA/B, and pepD encode the TCSs of MprAB and MtrAB and an HtrA-like serine protease PepD, respectively. The hrdD and sigE severally encode σ factor HrdD and an ECF σ factor SigE. Moreover, two genes (MAGL005109 and MAGL004663) were annotated as PepD, three genes (MAGL007600, MAGL004990, and MAGL000280) were annotated as MtrA, and 5 genes (MAGL005608, MAGL004993, MAGL004675, MAGL004383, and MAGL008145) were annotated as SigE.
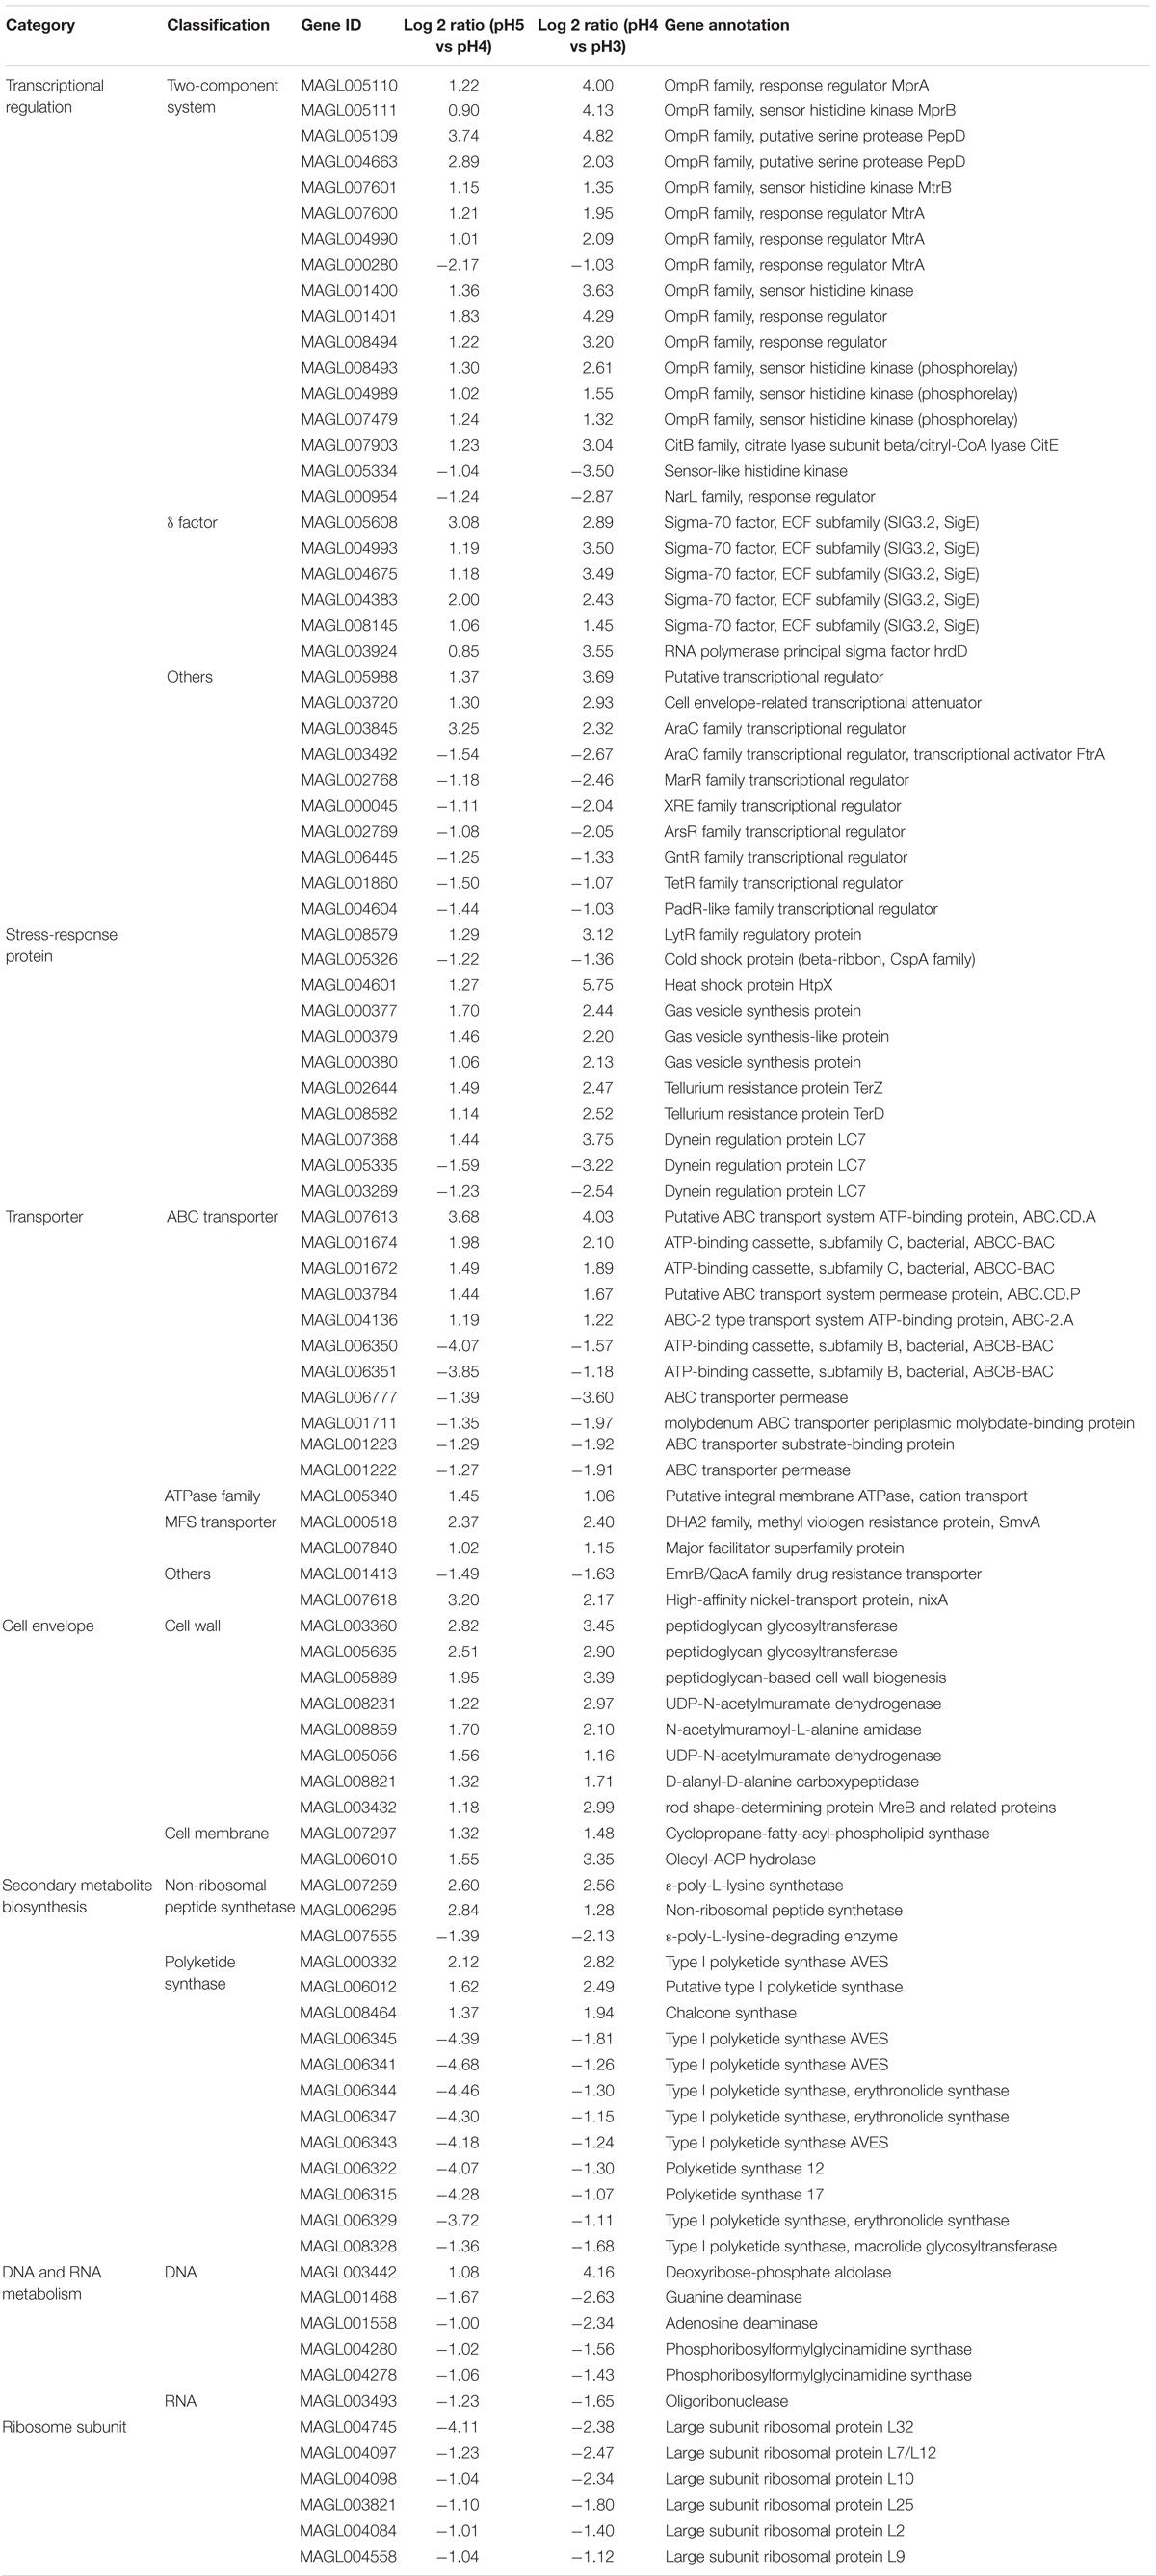
Table 1. Identification and classification of ATR genes of S. albulus M-Z18.
In Streptomyces species, SigE is a key regulator of the cell envelope stress response, which activated a complex regulatory network. The sigE gene locates in a four-gene operon, sigE cseA cseB cseC, with cseA encoding a lipoprotein CseA (negative regulator), cseB encoding a response regulator CseB and cseC encoding a membrane-anchored sensor kinase CseC. The transcription of SigE is not regulated by an anti-σ factor but completely controlled by the TCS, CseBC. Moreover, > 90% of transcription terminates directly downstream of the sigE gene (Tran et al., 2019). Therefore, the transcription levels of cseB and cseC show no significant difference in most instances. HrdD was reported to show the most sensitive response to pH changes, and the transcription of hrdD increased under acidic pH shock (Kim et al., 2008). In addition, Wang et al. (2015) proved that HrdD can specifically bind to the promoter of the pls (Pls gene), so it might regulate the transcription of pls and initiate the biosynthesis of ε-PL. Besides, SigE identifies the promoter of hrdD and regulates the transcription of hrdD (Paget et al., 1999). Therefore, it is deduced that SigE could regulate the transcription of pls through HrdD.
The function of MprAB and PepD was scarcely reported in Streptomyces species. In Mycobacterium species, MprAB and PepD together constitute a signal transduction system and mprA/B locates immediately upstream of pepD (White et al., 2010). MprAB positively regulates the expression of pepD and sigE to respond to membrane stress. Besides, the transcription of pepD is regulated by SigE and the deletion of pepD or mprA/B upregulated the expression of sigE (He et al., 2006; Pang et al., 2007; White et al., 2010). However, there were some differences between both species, e.g., the pepD (MAGL005109) was located immediately upstream of mprA (MAGL005110) and mprB (MAGL005111) in S. albulus M-Z18, the transcription of sigE is completely controlled by the CseBC and the SigE regulon does not include pepD in Streptomyces (Tran et al., 2019). Notably, Pan L. et al. (2019) proved that the signal transduction system of MprAB and PepD in S. albulus can regulate the transcription of pls.
The other TCS MtrAB is highly conserved in actinobacteria and plays pleiotropic roles in cell cycle progression, morphology, antibiotic resistance, secondary metabolite production, osmoprotection and substance transport (Som et al., 2017; Zhang et al., 2017; Pan Q. et al., 2019). Besides, 10 transcriptional regulators were also identified, which were mainly from AraC, MarR, XRE, ArsR, GntR, TetR, and PadR-like families. However, the specific functions of these genes on the ATR of S. albulus M-Z18 were not clear in this study.
Stress-Response Protein
As summarized in Table 1, 11 genes were expressed as stress-response proteins. LytR family protein is predicted to be involved in cell wall teichoic acid deposition, which is controlled by SigE (Tran et al., 2019). The gene (lytR, MAGL008579) of LytR family regulatory protein was up-regulated under acid stress to stabilize cell wall. The cold shock protein of CspA family can be expressed at low temperature. As a chaperone of RNA, it can prevent mRNA from forming a stable secondary structure at low temperature, ensuring the transcription and translation of genes at low temperature (Jiang et al., 1996). However, the transcription of cspA (MAGL005326) was down-regulated with the decline of environmental pH in this study, which could facilitate mRNA to form a stable secondary structure to prevent degrading. Therefore, when the environmental pH returned to the normal range, these mRNAs can resume function. HtpX is a protein degradation enzyme located on the cell membrane, which plays an important role in the quality control of integral membrane proteins (Sakoh et al., 2005). Kim et al. (2008) found that the expression of gas vesicle synthesis protein can be up-regulated by acidic pH shock in S. coelicolor. Likewise, the three genes (MAGL000377, MAGL000379, and MAGL000380) of gas vesicle synthesis protein were also found to be up-regulated under acid stress, which may be related to the ATR of Streptomyces.
Transporter
In response to acid stress, 16 ATR genes associated with transporter were detected (Table 1). Eleven genes were annotated as ATP-binding cassette (ABC) transporters, 1 membrane ATPase gene, 2 major facilitator superfamily (MFS) transporter genes and another 2 genes were annotated as EmrB/QacA family drug resistance transporter and high-affinity nickel-transport protein, respectively. The ABC transporter is composed of importer and exporter, which is responsible for the intake of nutrients and secretion of intracellular substances (mainly secondary metabolites). Besides, ABC transporters belong to the primary active transporters, they can consume ATP to transport small and large molecules (Davidson and Maloney, 2007). Among the ATR genes of transporter, the ABC transporter genes account for the most, in which 5 genes were up-regulated. Taken together, the ABC transporters of S. albulus M-Z18 could response to acid stress by uptake of nutrients such as amino acids and excretion of secondary metabolites, e.g., ε-PL. Notably, the gene (MAGL005340) of membrane ATPase functioned to transport cation was found to be up-regulated. It is reported that cation influx through membrane cation ATPase was an important factor in adaptation to weak-acid stress by food spoilage yeasts (Macpherson et al., 2005). Therefore, we speculated that this cation ATPase may play the same role in S. albulus M-Z18.
Cell Envelope
Acid stress significantly affected the transcription of cell envelope genes (Table 1). Seven genes (MAGL003360, MAGL005635, MAGL005889, MAGL008231, MAGL008859, MAGL005056, and MAGL008821) related to peptidoglycan synthesis were all up-regulated. The gene MAGL003432 encoding MreB was also up-regulated. In the rod-shaped bacteria like E. coli and B. subtilis, MreB acts to direct peptidoglycan biosynthesis in the lateral wall (Errington, 2015). Unlike the rod-shaped bacteria, Streptomyces hyphal growth at the tip does not require MreB but is directed by a polarisome complex involving DivIVA, Scy and FilP (Bush et al., 2015). However, the MreB directs to thicken the spore wall, which makes Streptomyces spores resistant to detrimental environmental conditions (Kleinschnitz et al., 2011). Besides, the gene mreB is also a target of SigE (Tran et al., 2019). Thus, SigE might regulate MreB to direct cell wall thickening through peptidoglycan biosynthesis, when Streptomyces suffered acid stress. Besides, the ATR genes (cfa, MAGL007297 and olah, MAGL006010) of cyclopropane-fatty-acyl-phospholipid synthase (EC 2.1.1.79) and oleoyl-ACP hydrolase (EC 3.1.2.14) were all up-regulated, which would facilitate the biosynthesis of CFA and C18:1 to enhance the ATR of the cells.
Secondary Metabolite Biosynthesis
In actinomycetes, the synthesis of secondary metabolites is catalyzed by a variety of enzyme systems, the most important of which are polyketide synthase (PKS) and non-ribosomal peptide synthase (NRPS). Table 1 lists that the transcription of two NRPS genes was up-regulated by acid stress, one of which was the Pls gene (MAGL007259), while majority of the PKS genes (9 out of 12) were down-regulated by acid stress. It is indicated that acid stress could inhibit the expression of PKS, so that more metabolism flowed to the synthesis of ε-PL. Besides, the transcription of ε-degrading enzyme (Pld) gene (pld) was down-regulated. The Pld of S. albulus locates on cell membrane. In vitro, the activity of Pld is significantly inhibited by the decline of pH from 7.0 (Kito et al., 2002). In this study, we found that the transcription of pld was also inhibited by the decline of environmental pH.
DNA, RNA Metabolism and Ribosome Subunit
With acid stress, the ATR gene (MAGL003442) for DNA synthesis was up-regulated and those for DNA degradation (MAGL001468, MAGL001558, MAGL004280, and MAGL004278) were down-regulated. Similarly, oligoribonuclease gene (MAGL003493) was down-regulated, which will cooperate with the down-regulated CspA gene (cspA, MAGL005326) to inhibit the degradation of RNA (Table 1). These will ensure the stability of DNA and RNA under acid stress.
Besides, 6 ATR genes encoding large subunit ribosomal protein were all down-regulated (Table 1), indicating that the biosynthesis of ribosome was inhibited. The inhibition of ribosome synthesis will reduce the synthesis of intracellular protein, which restrains bacterial growth and decreases the consumption of intracellular ATP. It is in agreement with the accumulation of intracellular ATP under acid stress (Figure 4B).
Validation of RNA-Sequencing Using qRT-PCR
To verify the reliability of RNA-sequencing, qRT-PCR analyses of 7 DEGs (mprA, pepD, sigE, hrdD, pls, pld, and htpX) were performed. It is indicated that the transcription levels of 6 genes, including mprA, pepD, sigE, hrdD, pls, and htpX, were up-regulated, and that of pld was down-regulated (Figure 6), which were consistent with the results of RNA-sequencing.
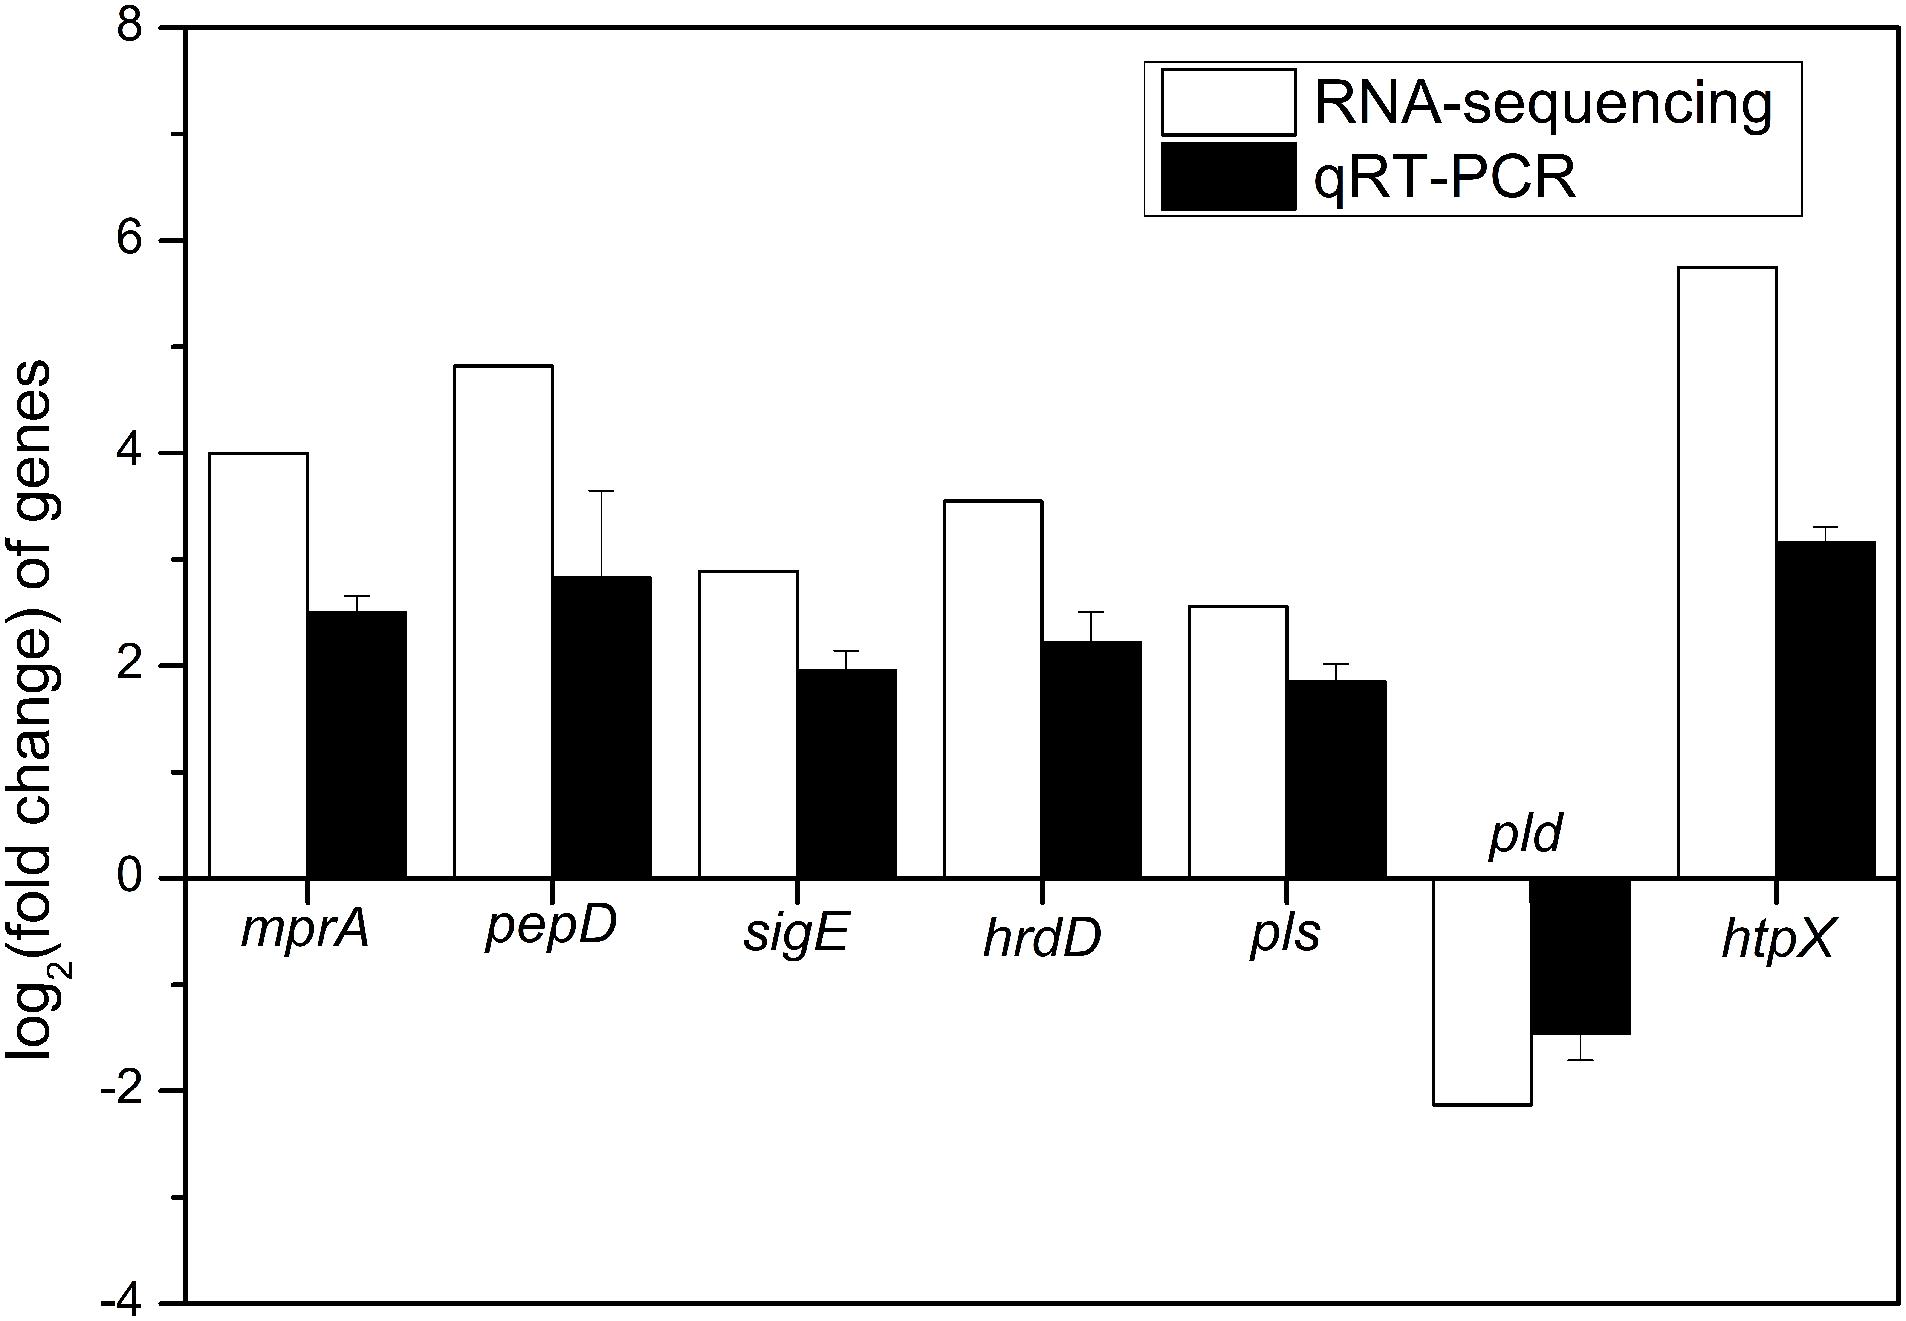
Figure 6. Quantitative RT-PCR validation of 7 DEGs (mprA, pepD, sigE, hrdD, pls, pld, and htpX) identified by RNA-sequencing in the comparison of batch fermentations by S. albulus M-Z18 at pH 4.0 vs. pH 3.0.
Conclusion
Based on the above results, the ATR of S. albulus was preliminarily proposed (Figure 7). To combat the spontaneous acid stress in the biosynthesis of ε-PL, S. albulus has developed pleietrepie response mechanisms. When S. albulus faced acid stress, signals originated in the cell envelope, the CseBC TCS was activated, resulting the up-regulation of sigE. The SigE was employed by core RNA polymerase to transcribe its regulon, including lytR (wall teichoic acid deposition) and mreB (cell wall thickening through directing peptidoglycan biosynthesis), which helped to maintain the cell wall stability. Meanwhile, the cell membrane maintained proper physiological functions through the up-regulation of related genes to increase U/S ratios, the decrease of fatty acid chain-length and the up-regulation of htpX to degrade or detach the mismatched proteins on cell membranes. Besides, the pHi was maintained homeostasis at about 7.7: the increased intracellular amino acids, especially arginine, glutamate, aspartate and lysine, could consume more proton, generate more NH3 and ATP; the transcription of ribosome large subunits was down-regulated, which affects the synthesis of proteins, thus inhibiting cell growth and leading to the accumulation of intracellular ATP; the improved H+-ATPase activity expelled protons at the expense of consuming ATP. All of these helped to alleviate cytoplasmic acidification under acid stress. The synthesis of DNA was promoted and the degradation of DNA and RNA was suppressed, while the down-regulation of cspA could make it easier for RNA to form stable secondary structure to prevent degradation. In addition, the up-regulated hrdD under the control of SigE and the activated MprAB and PepD signal transduction system together resulted in the up-regulation of pls, along with the accumulated intracellular ATP, glutamate, aspartate, lysine and the suitable pHi, the production of ε-PL was eventually promoted. Moreover, the transcription of pld was also down-regulated by acid stress. Considering that ε-PL is an alkaline polymer, the synthesis of ε-PL is also deduced to be the response of S. albulus to acid stress.
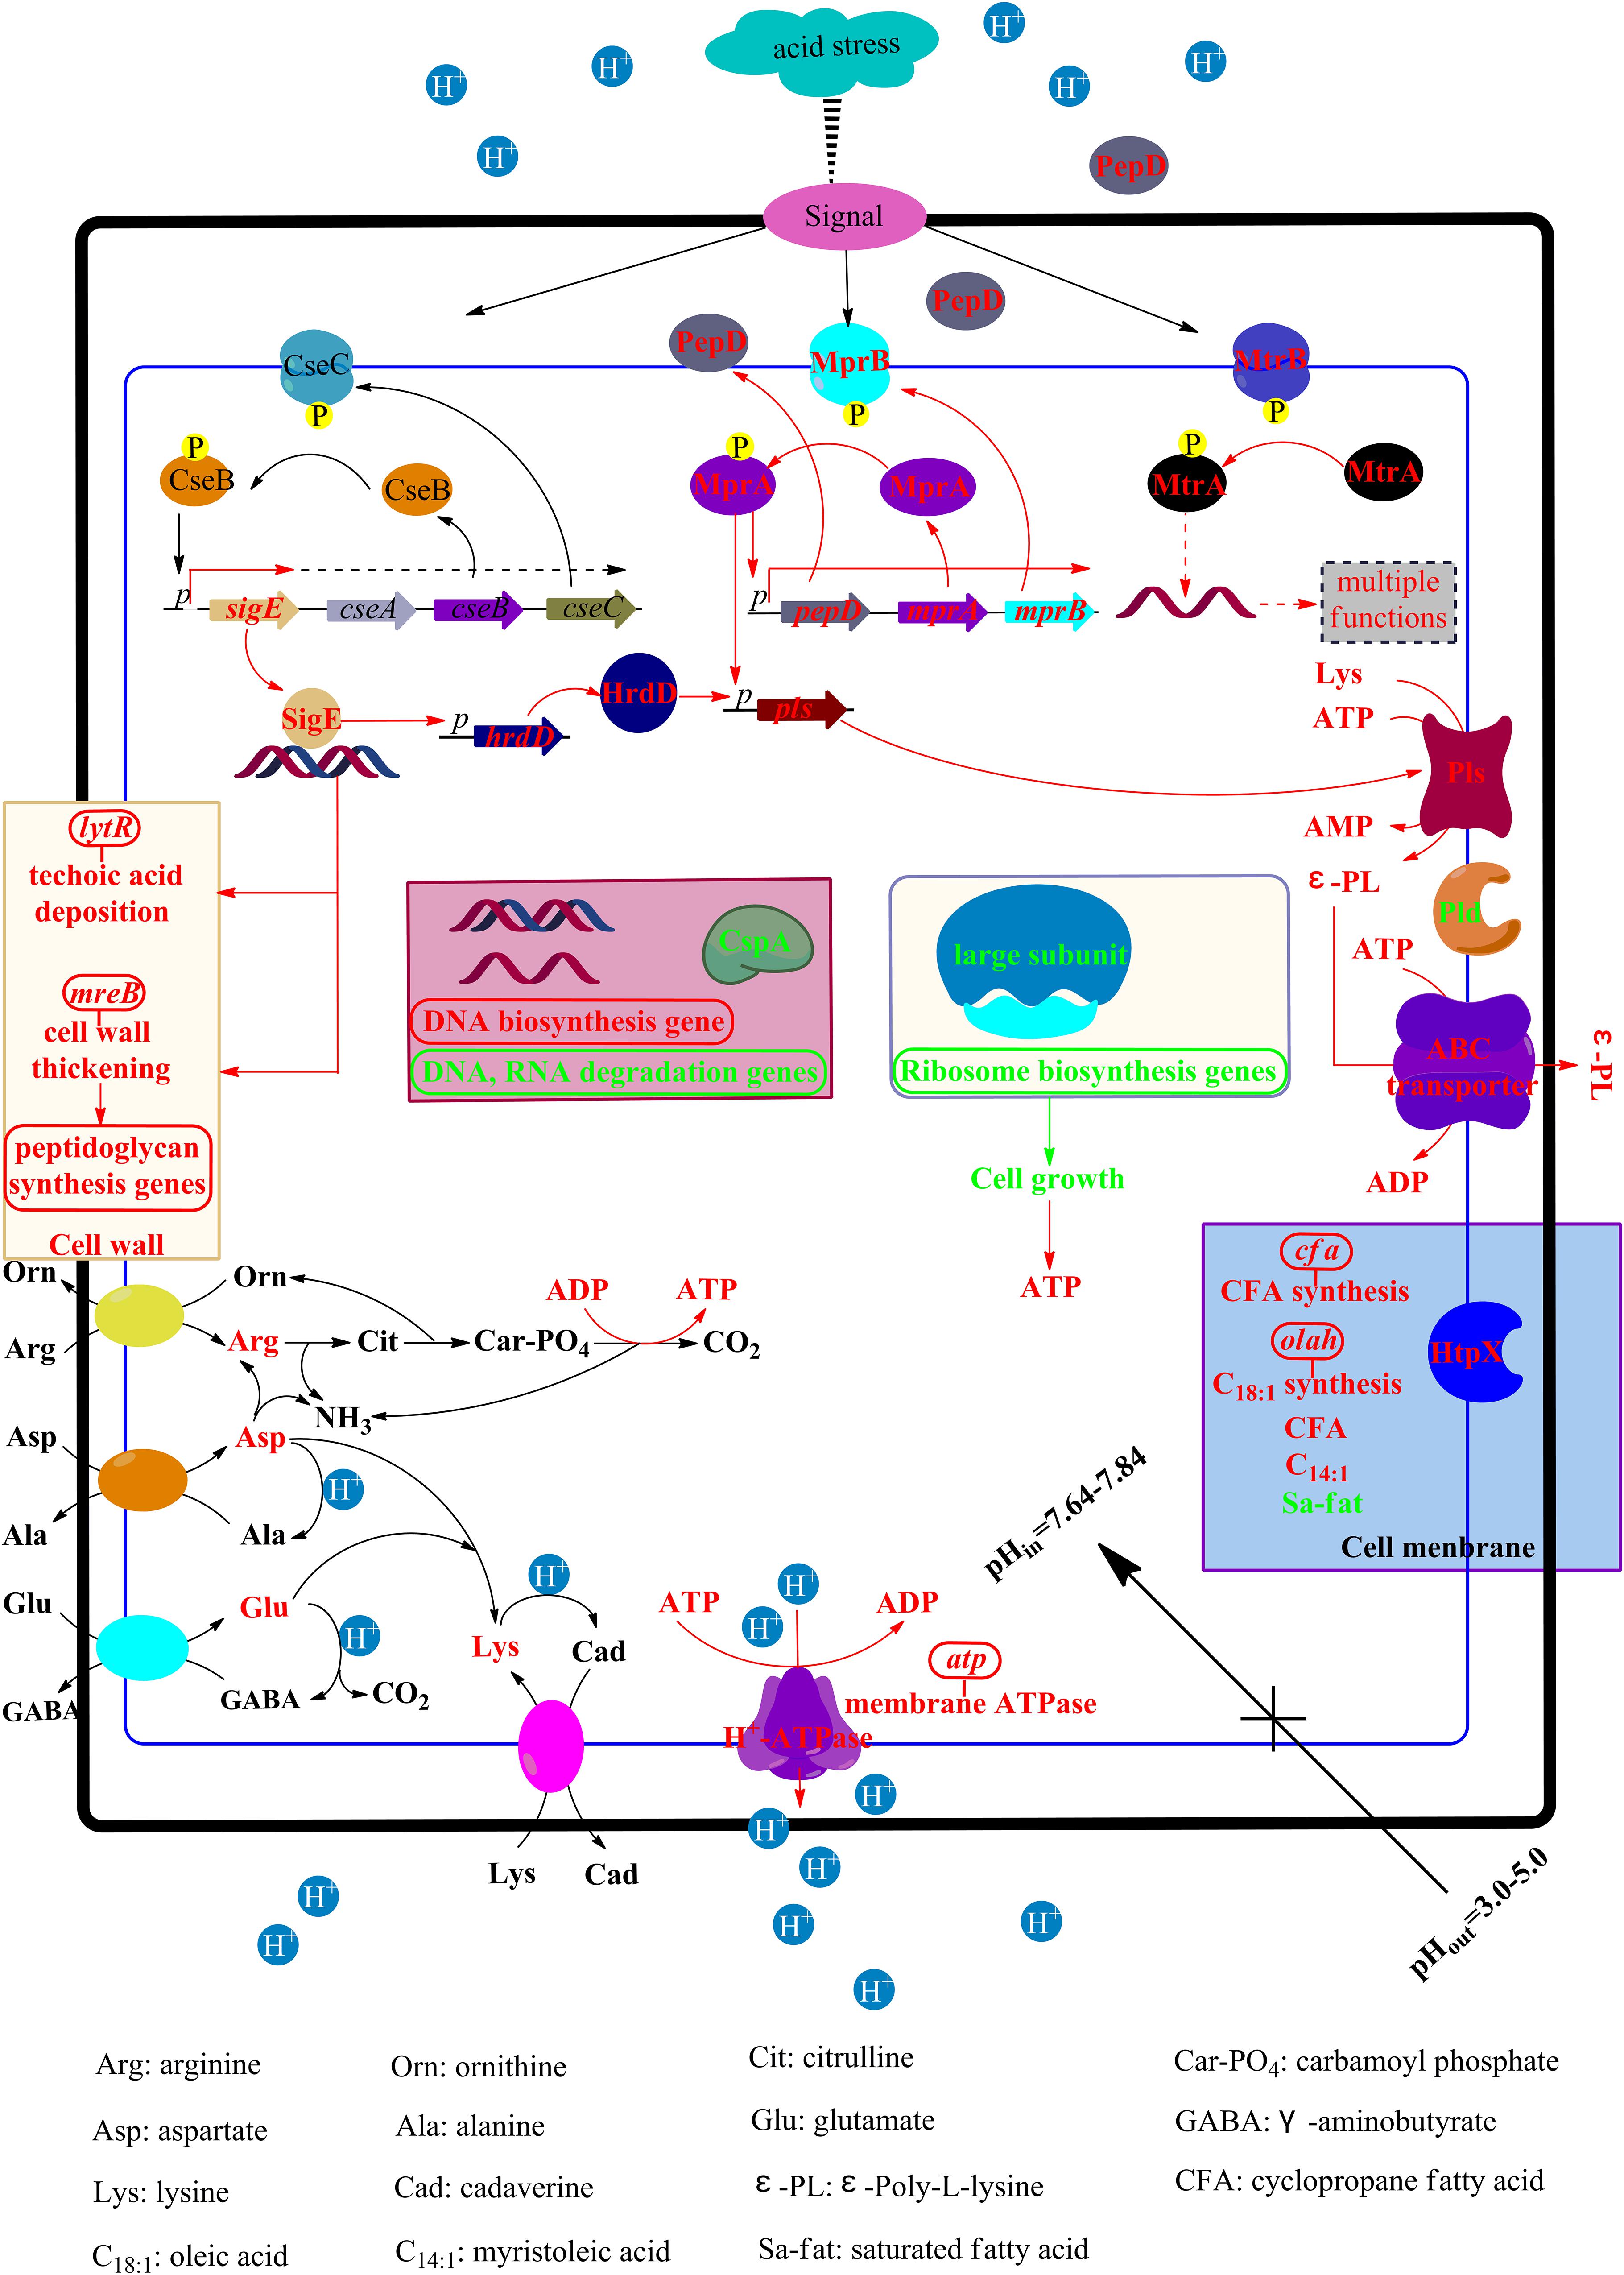
Figure 7. The physiological and transcriptional response mechanisms of S. albulus to spontaneous acid stress in the biosynthesis of ε-PL. Red represents up-regulation or increase, green represents down-regulation or decrease.
Data Availability Statement
RNA-seq data of S. albulus M-Z18 at different environmental pH values (pH 5.0, 4.0 and 3.0) were deposited at Sequence Read Archive (SRA) of National Center for Biotechnology Information (NCBI) under the accessions of SAMN14996498, SAMN14996497, and SAMN14996496, respectively.
Author Contributions
CW and XR conceived and designed the experiments, and wrote the manuscript. CW, CY, and LW performed the experiments. CW, XR, and JW analyzed the data. XZ and XL edited and polished the manuscript. All authors contributed to the article and approved the submitted version.
Funding
This work was financially supported by the National Natural Science Foundation of China (31701585) and the Key Research & Development Plan of Shandong Province (2018YYSP018).
Conflict of Interest
XZ was employed by IntellectiveBio Co., Ltd.
The remaining authors declare that the research was conducted in the absence of any commercial or financial relationships that could be construed as a potential conflict of interest.
Supplementary Material
The Supplementary Material for this article can be found online at: https://www.frontiersin.org/articles/10.3389/fmicb.2020.01379/full#supplementary-material
References
Biase, D. D., and Pennacchietti, E. (2012). Glutamate decarboxylase-dependent acid resistance in orally acquired bacteria: function, distribution and biomedical implications of the gadBC operon. Mol. Microbiol. 86, 770–786. doi: 10.1111/mmi.12020
Breeuwer, P., Drocourt, J. L., Frank, M. R., and Abee, T. (1996). A novel method for continuous determination of the intracellular pH in bacteria with the internally conjugated fluorescent probe 5 (and 6-)-carboxyfluorescein succinimidyl ester. Appl. Environ. Microbiol. 62, 178–183. doi: 10.1128/aem.62.1.178-183.1996
Broadbent, J. R., Larsen, R. L., Deibel, V., and Steele, J. L. (2010). Physiological and transcriptional response of Lactobacillus casei ATCC 334 to acid stress. J. Bacteriol. 192, 2445–2458. doi: 10.1128/JB.01618-09
Budin-Verneuil, A., Pichereau, V., Auffray, Y., Ehrlich, D., and Maguin, E. (2005). Proteomic characterization of the acid tolerance response in Lactococcus lactis MG1363. Proteomics 5, 4794–4807. doi: 10.1002/pmic.200401327
Bush, M. J., Tschowri, N., Schlimpert, S., Flärdh, K., and Buttner, M. J. (2015). c-di-GMP signalling and the regulation of developmental transitions in streptomycetes. Nat. Rev. Microbiol. 13, 749–760. doi: 10.1038/nrmicro3546
Cao-Hoang, L., Marechal, P. A., Le-̂Thanh, M., Gervais, P., and Wache’, Y. (2008). Fluorescent probes to evaluate the physiological state and activity of microbial biocatalysts: a guide for prokaryotic and eukaryotic investigation. Biotechnol. J. 3, 890–903. doi: 10.1002/biot.200700206
Capra, E. J., and Laub, M. T. (2012). Evolution of two-component signal transduction systems. Annu. Rev. Microbiol. 66, 325–347. doi: 10.1146/annurev-micro-092611-150039
Chang, Y. Y., and Cronan, J. E. (1999). Membrane cyclopropane fatty acid content is a major factor in acid resistance of Escherichia coli. Mol. Microbiol. 33, 249–259. doi: 10.1046/j.1365-2958.1999.01456.x
Corvini, P. F. X., Gautier, H., Rondags, E., Vivier, H., Goergen, J. L., and Germain, P. (2000). Intracellular pH determination of pristinamycin-producing Streptomyces pristinaespiralis by image analysis. Microbiology 146, 2671–2678. doi: 10.1099/00221287-146-10-2671
Cotter, P. D., Gahan, C. G., and Hill, C. (2001). A glutamate decarboxylase system protects Listeria monocytogenes in gastric fluid. Mol. Microbiol. 40, 465–475. doi: 10.1046/j.1365-2958.2001.02398.x
Cotter, P. D., and Hill, C. (2003). Surviving the acid test: responses of gram-positive bacteria to low pH. Microbiol. Mol. Biol. Rev. 67, 429–453. doi: 10.1128/mmbr.67.3.429-453.2003
Davidson, A. L., and Maloney, P. C. (2007). ABC transporters: how small machines do a big job. Trends Microbiol. 15, 448–455. doi: 10.1016/j.tim.2007.09.005
Denich, T. J., Beaudette, L. A., Lee, H., and Trevors, J. T. (2003). Effect of selected environmental and physico-chemical factors on bacterial cytoplasmic membranes. J. Microbiol. Meth. 52, 149–182. doi: 10.1016/S0167-7012(02)00155-0
Errington, J. (2015). Bacterial morphogenesis and the enigmatic MreB helix. Nat. Rev. Microbiol. 13, 241–248. doi: 10.1038/nrmicro3398
Fernández, M., and Zúñiga, M. (2006). Amino acid catabolic pathways of lactic acid bacteria. Crit. Rev. Microbiol. 32, 155–183. doi: 10.1080/10408410600880643
Fountoulakis, M., and Lahm, H. W. (1998). Hydrolysis and amino acid composition analysis of proteins. J. Chromatogr. A 826, 109–134. doi: 10.1016/S0021-9673(98)00721-3
Fozo, E. M., and Quivey, R. G. Jr. (2004). The fabM gene product of Streptococcus mutans is responsible for the synthesis of monounsaturated fatty acids and is necessary for survival at low pH. J. Bacteriol. 186, 4152–4158. doi: 10.1128/JB.186.13.4152-4158.2004
Guan, N., Liu, L., Shin, H. D., Chen, R. R., Zhang, J., Li, J., et al. (2013). Systems-level understanding of how Propionibacterium acidipropionici respond to propionic acid stress at the microenvironment levels: mechanism and application. J. Biotechnol. 167, 56–63. doi: 10.1016/j.jbiotec.2013.06.008
Guerzoni, M. E., Lanciotti, R., and Cocconcelli, P. S. (2001). Alteration in cellular fatty acid composition as a response to salt, acid, oxidative and thermal stresses in Lactobacillus helveticus. Microbiology 147, 2255–2264. doi: 10.1099/00221287-147-8-2255
He, H., Hovey, R., Kane, J., Singh, V., and Zahrt, T. C. (2006). MprAB is a stress-responsive two-component system that directly regulates expression of sigma factors SigB and SigE in Mycobacterium tuberculosis. J. Bacteriol. 188, 2134–2143. doi: 10.1128/JB.188.6.2134-2143.2006
Hutchings, M. I., Hoskisson, P. A., Chandra, G., and Buttner, M. J. (2004). Sensing and responding to diverse extracellular signals? Analysis of the sensor kinases and response regulators of Streptomyces coelicolor A3(2). Microbiology 150, 2795–2806. doi: 10.1099/mic.0.27181-0
Hutkins, R. W., and Nannen, N. L. (1993). pH homeostasis in lactic acid bacteria. J. Dairy Sci. 76, 2354–2365. doi: 10.3168/jds.S0022-0302(93)77573-6
Itzhaki, R. (1972). Colorimetric method for estimating polylysine and poly-arginine. Anal. Biochem. 50, 569–574. doi: 10.1016/0003-2697(72)90067-X
Jiang, W., Fang, L., and Inouye, M. (1996). Complete growth inhibition of Escherichia coli by ribosome trapping with truncated cspA mRNA at low temperature. Genes Cells 1, 965–976. doi: 10.1046/j.1365-2443.1996.d01-219.x
Kahar, P., Iwata, T., Hiraki, J., Park, E. Y., and Okabe, M. (2001). Enhancement of ε-polylysine production by Streptomyces albulus strain 410 using pH control. J. Biosci. Bioeng. 91, 190–194. doi: 10.1016/S1389-1723(01)80064-5
Kim, Y. J., Moon, M. H., Song, J. Y., Smith, C. P., Hong, S. K., and Chang, Y. K. (2008). Acidic pH shock induces the expressions of a wide range of stress-response genes. BMC Genomics 9:604. doi: 10.1186/1471-2164-9-604
Kito, M., Takimoto, R., Yoshida, T., and Nagasawa, T. (2002). Purification and characterization of an ε-poly-L-lysine-degrading enzyme from an ε-poly-L-lysine-producing strain of Streptomyces albulus. Arch. Microbiol. 178, 325–330. doi: 10.1007/s00203-002-0459-6
Kleinschnitz, E. M., Heichlinger, A., Schirner, K., Winkler, J., Latus, A., Maldener, I., et al. (2011). Proteins encoded by the mre gene cluster in Streptomyces coelicolor A3(2) cooperate in spore wall synthesis. Mol. Microbiol. 79, 1367–1379. doi: 10.1111/j.1365-2958.2010.07529.x
Lund, P., Tramonti, A., and Biase, D. D. (2014). Coping with low pH: molecular strategies in neutralophilic bacteria. FEMS Microbiol. Rev. 38, 1091–1125. doi: 10.1111/1574-6976.12076
Macpherson, N., Shabala, L., Rooney, H., Jarman, M. G., and Davies, J. M. (2005). Plasma membrane H+ and K+ transporters are involved in the weak-acid preservative response of disparate food spoilage yeasts. Microbiology 151, 1995–2003. doi: 10.1099/mic.0.27502-0
Manteca, A., Alvarez, R., Salazar, N., Yagüe, P., and Sanchez, J. (2008). Mycelium differentiation and antibiotic production in submerged cultures of Streptomyces coelicolor. Appl. Environ. Microbiol. 74, 3877–3886. doi: 10.1128/AEM.02715-07
Mascher, T. (2013). Signaling diversity and evolution of extracytoplasmic function (ECF) sigma factors. Curr. Opin. Microbiol. 16, 148–155. doi: 10.1016/j.mib.2013.02.001
O’Sullivan, E., and Condon, S. (1997). Intracellular pH is a major factor in the induction of tolerance to acid and other stresses in Lactococcus lactis. Appl. Environ. Microb. 63, 4210–4215. doi: 10.1128/aem.63.11.4210-4215.1997
Paget, M. S., Chamberlin, L., Atrih, A., Foster, S. J., and Buttner, M. J. (1999). Evidence that the extracytoplasmic function sigma factor σE is required for normal cell wall structure in Streptomyces coelicolor A3(2). J. Bacteriol. 181, 204–211. doi: 10.1128/jb.181.1.204-211.1999
Pan, L., Chen, X., Wang, K., and Mao, Z. (2019). Understanding high ε-poly-L-lysine production by Streptomyces albulus using pH shock strategy in the level of transcriptomics. J. Ind. Microbiol. Biotechnol. 46, 1781–1792. doi: 10.1007/s10295-019-02240-z
Pan, Q., Tong, Y., Han, Y. J., and Ye, B. C. (2019). Two amino acids missing of MtrA resulted in increased erythromycin level and altered phenotypes in Saccharopolyspora erythraea. Appl. Microbiol. Biotechnol. 103, 4539–4548. doi: 10.1007/s00253-019-09825-9
Pang, X., Vu, P., Byrd, T. F., Ghanny, S., Soteropoulos, P., Mukamolova, G. V., et al. (2007). Evidence for complex interactions of stress-associated regulons in an mprAB deletion mutant of Mycobacterium tuberculosis. Microbiology 153(Pt 4), 1229–1242. doi: 10.1099/mic.0.29281-0
Ren, X. D., Chen, X. S., Zeng, X., Wang, L., Tang, L., and Mao, Z. G. (2015). Acidic pH shock induced overproduction of ε-poly-L-lysine in fed-batch fermentation by Streptomyces sp. M-Z18 from agro-industrial by-products. Bioprocess Biosyst. Eng. 38, 1113–1125. doi: 10.1007/s00449-015-1354-2
Rhee, J. E., Rhee, J. H., Ryu, P. Y., and Sang, H. C. (2002). Identification of the cadBA operon from Vibrio vulnificus and its influence on survival to acid stress. FEMS Microbiol. Lett. 208, 245–251. doi: 10.1111/j.1574-6968.2002.tb11089.x
Rioseras, B., López-García, M. T., Yagüe, P., Sánchez, J., and Manteca, Á (2014). Mycelium differentiation and development of Streptomyces coelicolor in lab-scale bioreactors: programmed cell death, differentiation, and lysis are closely linked to undecylprodigiosin and actinorhodin production. Bioresour. Technol. 151, 191–198. doi: 10.1016/j.biortech.2013.10.068
Russell, N. J. (1984). Mechanisms of thermal adaptation in bacteria: blueprints for survival. Trends Biochem. Sci. 9, 108–112. doi: 10.1016/0968-0004(84)90106-3
Sakoh, M., Ito, K., and Akiyama, Y. (2005). Proteolytic activity of HtpX, a membrane-bound and stress-controlled protease from Escherichia coli. J. Biol. Chem. 280, 33305–33310. doi: 10.1074/jbc.M506180200
Sasser, M. (1990). Identification of Bacteria by Gas Chromatography of Cellular Fatty Acids. MIDI Technical Note 101. Newark, DE: MIDI, Inc, 1–7.
Senouci-Rezkallah, K., Schmitt, P., and Jobin, M. P. (2011). Amino acids improve acid tolerance and internal pH maintenance in Bacillus cereus ATCC14579 strain. Food microbiol. 28, 364–372. doi: 10.1016/j.fm.2010.09.003
Shih, I. L., and Shen, M. H. (2006). Optimization of cell growth and poly(ε-lysine) production in batch and fed-batch cultures by Streptomyces albulus IFO 14147. Process Biochem. 41, 1644–1649. doi: 10.1016/j.procbio.2006.03.013
Shima, S., and Sakai, H. (1977). Polylysine produced by Streptomyces. Agric. Biol. Chem. 41, 1807–1809. doi: 10.1271/bbb1961.41.1807
Shimada, S., Andou, M., Naito, N., Yamada, N., Osumi, M., and Hayashi, R. (1993). Effects of hydrostatic pressure on the ultrastructure and leakage of internal substances in the yeast Saccharomyces cerevisiae. Appl. Microbiol. Biotechnol. 40, 123–131. doi: 10.1007/BF00170440
Singh, K. P., Mahendra, A. L., Jayaraj, V., Wangikar, P. P., and Jadhav, S. (2013). Distribution of live and dead cells in pellets of an actinomycete Amycolatopsis balhimycina and its correlation with balhimycin productivity. J. Ind. Microbiol. Biotechnol. 40, 235–244. doi: 10.1007/s10295-012-1215-9
Som, N. F., Heine, D., Holmes, N. A., Munnoch, J. T., Chandra, G., Seipke, R. F., et al. (2017). The conserved actinobacterial two-component system MtrAB coordinates chloramphenicol production with sporulation in Streptomyces venezuelae NRRL B-65442. Front. Microbiol. 8:1145. doi: 10.3389/fmicb.2017.01145
Takehara, M., Hibino, A., Saimura, M., and Hirohara, H. (2010). High-yield production of short chain length poly(ε-L-lysine) consisting of 5-20 residues by Streptomyces aureofaciens, and its antimicrobial activity. Biotechnol. Lett. 32, 1299–1303. doi: 10.1007/s10529-010-0294-9
Ter Beek, A., Wijman, J. G. E., Zakrzewska, A., Orij, R., Smits, G. J., and Brul, S. (2015). Comparative physiological and transcriptional analysis of weak organic acid stress in Bacillus subtilis. Food Microbiol. 45, 71–82. doi: 10.1016/j.fm.2014.02.013
Tran, N. T., Huang, X., Hong, H. J., Bush, M. J., Chandra, G., Pinto, D., et al. (2019). Defining the regulon of genes controlled by σE, a key regulator of the cell envelope stress response in Streptomyces coelicolor. Mol. Microbiol. 112, 461–481. doi: 10.1111/mmi.14250
Wang, L., Gao, C., Tang, N., Hu, S., and Wu, Q. (2015). Identification of genetic variations associated with epsilon-poly-lysine biosynthesis in Streptomyces albulus ZPM by genome sequencing. Sci. Rep. 5:9201. doi: 10.1038/srep09201
White, M. J., He, H., Penoske, R. M., Twining, S. S., and Zahrt, T. C. (2010). PepD participates in the mycobacterial stress response mediated through MprAB and SigE. J. Bacteriol. 192, 1498–1510. doi: 10.1128/JB.01167-09
Wu, C., Zhang, J., Chen, W., Wang, M., Du, G., and Chen, J. (2012a). A combined physiological and proteomic approach to reveal lactic-acid-induced alterations in Lactobacillus casei Zhang and its mutant with enhanced lactic acid tolerance. Appl. Microbiol. Biotechnol. 93, 707–722. doi: 10.1007/s00253-011-3757-6
Wu, C., Zhang, J., Wang, M., Du, G., and Chen, J. (2012b). Lactobacillus casei combats acid stress by maintaining cell membrane functionality. J. Ind. Microbiol. Biotechnol. 39, 1031–1039. doi: 10.1007/s10295-012-1104-2
Wu, H., Zhao, Y., Du, Y., Miao, S., Liu, J., Li, Y., et al. (2018). Quantitative proteomics of Lactococcus lactis F44 under cross-stress of low pH and lactate. J. Dairy Sci. 101, 6872–6884. doi: 10.3168/jds.2018-14594
Xu, Y., Zhao, Z., Tong, W., Ding, Y., Liu, B., Shi, Y., et al. (2020). An acid-tolerance response system protecting exponentially growing Escherichia coli. Nat. Commun. 11:1496. doi: 10.1038/s41467-020-15350-5
Yamanaka, K., Kito, N., Imokawa, Y., Maruyama, C., Utagawa, T., and Hamano, Y. (2010). Mechanism of ε-poly-L-lysine production and accumulation revealed by identification and analysis of an ε-poly-L-lysine-degrading enzyme. Appl. Environ. Microbiol. 76, 5669–5675. doi: 10.1128/AEM.00853-10
Yamanaka, K., Maruyama, C., Takagi, H., and Hamano, Y. (2008). ε-Poly-L-lysine dispersity is controlled by a highly unusual nonribosomal peptide synthetase. Nat. Chem. Biol. 4, 766–772. doi: 10.1038/nchembio.125
Yin, Z., Feng, S., Tong, Y., and Yang, H. (2019). Adaptive mechanism of Acidithiobacillus thiooxidans CCTCC M 2012104 under stress during bioleaching of low-grade chalcopyrite based on physiological and comparative transcriptomic analysis. J. Ind. Microbiol. Biotechnol. 46, 1643–1656. doi: 10.1007/s10295-019-02224-z
Zhai, Z., Yang, Y., Wang, H., Wang, G., Ren, F., Li, Z., et al. (2020). Global transcriptomic analysis of Lactobacillus plantarum CAUH2 in response to hydrogen peroxide stress. Food Microbiol. 87:103389. doi: 10.1016/j.fm.2019.103389
Zhang, P., Wu, L., Zhu, Y., Liu, M., Wang, Y., Cao, G., et al. (2017). Deletion of MtrA inhibits cellular development of Streptomyces coelicolor and alters expression of developmental regulatory genes. Front. Microbiol. 8:2013. doi: 10.3389/fmicb.2017.02013
Keywords: Streptomyces albulus, ε-poly-L-lysine, acid stress, acid tolerance response, RNA-sequencing
Citation: Wang C, Ren X, Yu C, Wang J, Wang L, Zhuge X and Liu X (2020) Physiological and Transcriptional Responses of Streptomyces albulus to Acid Stress in the Biosynthesis of ε-Poly-L-lysine. Front. Microbiol. 11:1379. doi: 10.3389/fmicb.2020.01379
Received: 18 March 2020; Accepted: 28 May 2020;
Published: 19 June 2020.
Edited by:
Daniela De Biase, Sapienza University of Rome, ItalyReviewed by:
Byung-Kwan Cho, Korea Advanced Institute of Science and Technology, South KoreaAna Lorena Arabolaza, Consejo Nacional de Investigaciones Científicas y Técnicas (CONICET), Argentina
Copyright © 2020 Wang, Ren, Yu, Wang, Wang, Zhuge and Liu. This is an open-access article distributed under the terms of the Creative Commons Attribution License (CC BY). The use, distribution or reproduction in other forums is permitted, provided the original author(s) and the copyright owner(s) are credited and that the original publication in this journal is cited, in accordance with accepted academic practice. No use, distribution or reproduction is permitted which does not comply with these terms.
*Correspondence: Xidong Ren, cmVueGlkb25nMTk4NkAxMjYuY29t; Xinli Liu, dmlwLmx4bEAxNjMuY29t