 Xiaofei Wang1,2,3†
 Xiaojuan Wang2,4†Tongkai Cai1,2
 Yulin Qin2,4
 Ling Li1Yuanying Jiang2*Bing Han4*
 Yongbing Cao1*
- 1Institute of Vascular Disease, Shanghai TCM-Integrated Hospital, Shanghai University of Traditional Chinese Medicine, Shanghai, China
- 2School of Pharmacy, Naval Medical University, Shanghai, China
- 3Department of Pharmacy, Mudanjiang First People’s Hospital, Mudanjiang, China
- 4Department of Pharmacy, Minhang Hospital, Fudan University, Shanghai, China
Systemic candidiasis is the fourth leading cause of healthcare-associated infections worldwide. The combination therapy based on existing antifungal agents is well-established to overcome drug resistance and restore antifungal efficacy against drug-resistant strains. In this study, a simple and sensitive liquid chromatography with tandem mass spectrometry (LC-MS/MS) method was developed to quantify the intracellular fluconazole (FLC) content in the opportunistic human fungal pathogen Candida albicans. The cell lysates were prepared by lysing C. albicans cells with Precellys homogenizers and FLC was extracted with methylene chloride. The entire extraction approach was simple, precise and reliable. The extracts were separated on a Zorbax SB-C18 column using a mobile phase of acetonitrile (solvent A) and deionized water plus 0.1% formic acid. FLC and ketoconazole (KCZ, internal standard) were monitored in positive mode using electrospray ionization source. The multiple reaction monitoring transitions (precursor to product) were monitored for FLC m/z 307.1 → 238.2 and for the internal standard KCZ m/z 531.2 → 489.1. The linear for this method were in the range from 5.0 to 1000.0 ng/mL. The precision and accuracy of the samples were relative standard deviations (RSD) < 1.0% for intra-day and RSD < 0.51% for inter-day. The overall recovery of FLC from samples was higher than 77.61%. Furthermore, this method was successfully applied and validated in 36 clinical isolated strains. Taken together, we established a highly accurate, efficient, and reproducible method for quantifying the intracellular content of FLC in C. albicans.
Introduction
Candida albicans (C. albicans) is one of the most common commensal fungal species located in the gastrointestinal and reproductive tracts of healthy individuals, causing both mucosal and systemic infections in immunocompromised individuals (Brown et al., 2012; de Oliveira Santos et al., 2018; Quindós et al., 2018). Systemic candidiasis is a serious healthcare-associated infection in Europe and US, and associated with high mortality rates (40%) among hospitalized patients, particularly in individuals with hematological malignancies, undergoing major surgery, cytotoxic chemotherapy, and organ transplantation (Magill et al., 2014; Bongomin et al., 2017; Pappas et al., 2018; Hou et al., 2022). Currently, fluconazole (FLC), a highly selective inhibitor of fungal cytochrome P-450 sterol C-14 alpha-demethylation, is the most widely administered antifungal for treating invasive, life-threatening fungal infections (Robbins et al., 2017; Revie et al., 2018). However, high administration frequency and long duration treatment of FLC contribute to the rising number of drug resistant C. albicans worldwide (Berkow and Lockhart, 2017; Campitelli et al., 2017; Pristov and Ghannoum, 2019). The primary mechanism of drug resistance is the reduction of intracellular accumulation of azole in C. albicans, due to reduced drug uptake or increased drug efflux (Arendrup and Patterson, 2017; Wiederhold, 2017). Therefore, the development of new therapeutic agents to restore C. albicans susceptibility to FLC is an effective strategy for the treatment of fungal infections.
The use of drug combination therapy has been successfully implemented for difficult-to-treat infections, such as malaria, tuberculosis, and AIDS (Robbins et al., 2017). Indeed, combination therapy represents an effective method to overcome the emergence of drug-resistant fungi and decrease toxicity (Zacchino et al., 2017; Ribeiro de Carvalho et al., 2018). However, many studies have shown results that range from antagonism to synergy effects due to the different concentrations of each drug combination (Johnson et al., 2004; Campitelli et al., 2017; Tome et al., 2018). The discrepancy may be caused by different measurements of intracellular drug content. In order to accurately detect the intracellular concentration, high performance liquid chromatography with tandem mass spectrometry (HPLC–MS/MS) was used to measure the intracellular FLC levels in C. albicans. At present, several fast HPLC–MS/MS methods have been validated and reported for monitoring the antifungal drug concentration in plasma or other body liquid, including FLC, itraconazole, and other antifungal agents (Van De Steene and Lambert, 2008; Tang et al., 2010; Zhang et al., 2011; Alebic-Kolbah and Modesitt, 2012; Beste et al., 2012; Zgoła-Grześkowiak and Grześkowiak, 2013; de Moraes et al., 2014; Wadsworth et al., 2017; Różalska et al., 2018; Xiang et al., 2018). Actually, quantitative analysis of FLC in C. albicans via HPLC-MS/MS has not been reported. In this study, we developed a specific, reliable and sensitive liquid chromatography with tandem mass spectrometry (LC-MS/MS) method for determining the intracellular levels of FLC in C. albicans.
Materials and methods
Strains and growth conditions
The FLC-resistant C. albicans strains NOs. 100 and 103 were obtained from Changhai hospital (MIC80 > 1,024 μg/mL). In addition, 36 clinical isolated strains of FLC-resistant or FLC-sensitive C. albicans were obtained from Tianjin University. All strains were stored with 15% glycerol at −80°C and subcultured on sabouraud dextrose agar (SDA) plates (4% dextrose, 1.8% agar, and 1% peptone) at 30°C. Exponentially growing C. albicans cells were routinely grown in yeast-peptone-dextrose (YPD) liquid medium (2% peptone, 2% dextrose, and 1% yeast extract) at 30°C in a shaking incubator overnight for the following experiments.
Chemicals and reagents
FLC and ketoconazole (KCZ) (> 99.0%) were purchased from Sigma-Aldrich (St Louis, MO, USA). Acetonitrile was liquid chromatography (LC) grade and purchased from Merck (Darmstadt, Germany). HPLC-grade formic acid was purchased from Tedia Company (Fairfield, OH, USA). Dichloromethane, sodium hydroxide and dimethyl sulfoxide were purchased from Shanghai Chemical Reagent Company (Shanghai, China). Deionized water was prepared from Milli-Q water purifying system (Millipore Corporation, Bedford, MA, USA). Methanol was purchased from Merck (Darmstadt, Germany).
Internal standards and calibration standards
FLC and KCZ were weighed and solved in methanol at a concentration of 1.00 mg/mL, respectively. Working solution of FLC (100, 10, and 1.0 μg/mL) was prepared by the dilution of the stock solution. The stock solution of KCZ and H2O were mixed to obtain working solution at a concentration of 100 μg/mL. Stock solutions were stored at −70°C and the standard solutions were prepared immediately before use.
Liquid chromatography with tandem mass spectrometry conditions
The LC-MS/MS analysis was performed using the triple quadrupole mass spectrometer (Aglient 6410A, Santa Clara, USA) in the selected reaction monitoring (SRM) mode. The columns were chromatographic column Zorbax SB-C18 column (3.5 μm, 100 mm × 2.1 mm i.d., Agilent, Palo Alto, CA). The mobile phase was composed of acetonitrile (solvent A) and 0.1% formic acid in distilled deionized water (solvent B), a 40:60 (v/v) mixture of solvent A and B. Flow rate was 0.3 mL/min; run time was 2.3 min. The column temperature was maintained at 35°C and the injection volume was 10 μL.
The LC-MS/MS conditions were as follows: electrospray ionization (ESI) in positive mode; capillary voltage, 4,000 V; vaporizer temperature, 40°C; atomization gas (nitrogen) pressure, 0.276 MPa; desolution gas (nitrogen) temperature, 350°C, flow rate, 10.0 L/min. The collision gas (high purity nitrogen) pressure was 0.1 MPa. Half width of the mass spectrum was 0.7 amu. The mass spectrometer was operated under multiple reaction monitoring (MRM) modes with collision energy of 18 eV for FLC and 40 eV for KCZ. The following MRM transitions (precursor to product) were monitored for FLC m/z 307.1 → 238.2 and for the internal standard (IS) KCZ m/z 531.2 → 489.1 (Table 1).
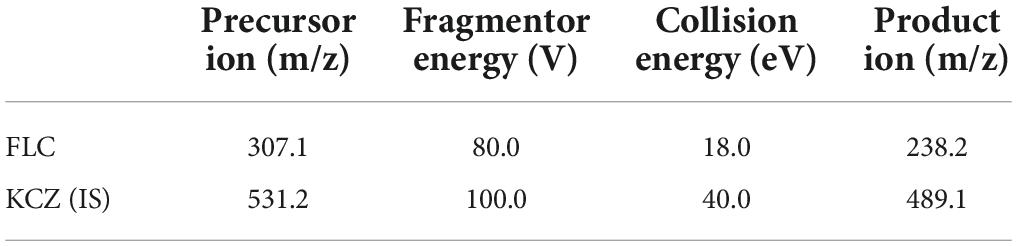
Table 1. Optimized MRM (multiple reaction monitoring) parameters for FLC and KCZ.
Sample preparation
Candida albicans lysates preparation
The logarithmic growth C. albicans was harvested and re-suspended to 5 × 10⁹ CFU/mL with YPD liquid medium. FLC stock solution (1 mg/mL) were added to the suspension. The final concentration of C. albicans was adjusted to 5 × 10⁷ CFU/mL and FLC concentration was diluted to 16 μg/mL. The mixture was incubated at 30°C with agitation at 200 rpm for 16 h. Subsequently, C. albicans cells were collected by centrifuging the suspension for 30 s at 5,000 × g. Samples were washed for four times with equivalent volume of the original culture medium and centrifuged to remove residual medium and FLC. After that, the precipitation was resuspended and centrifuged four times at 16,200 × g to remove the liquid. 500.0 mg of fungal cells were added to the Eppendorf tube together with a volume of 1.5 mL deionized water and 180.0 μL 0.5 mm glass beads, 180.0 μL 0.1 mm glass beads, 180.0 μL 1 mm ceramic bead and two 3 mm ceramic beads. All samples were crushed in a Precellys 24 biological sample homogenizer (Bertin Technologies, Montignyle-Bretonneux, France) with the following protocol: 6,500 rpm/min, 30 s, 3 times, interval of 30 s; 3 cycles, interval of 5 min. All samples were kept on ice during the circulation interval. C. albicans lysates solution was harvested after centrifugation.
Candida albicans lysates extraction
The C. albicans lysates solution (100 μL) was added into a centrifuge tube containing internal standard solution, 20.0 μL KCZ (1.0 μg/mL) and 10.0 μL NaOH (20.0 μg/mL). After vortexing for 30 s, 3.0 mL of dichloromethane (CH2Cl2) was finally added and mixed thoroughly. The liquid system was divided into two layers after 10 min centrifugation at 9,982 × g. Next, 2.4 mL of liquid was removed from the lower layer and the CH2Cl2 phase was transferred into a clean centrifuge tube and evaporated to dryness in the centrifugal thickener (35°C heat, heat time: 50 min, run time: 200 min). After that, 80 μL of mobile phase [acetonitrile: 0.1% formic acid = 40:60 (v/v)] was added to the evaporated sample tubes and vortex-mixed for 1 min. The liquid was transferred to a new 1.5 mL centrifuge tube and centrifuged at 21,000 × g for 10 min. Following, the supernatant was then transferred to the vial (containing the inner tube) for LC-MS/MS analysis.
Validation of the liquid chromatography with tandem mass spectrometry method
The validation including selectivity, matrix effect, linearity, precision, and accuracy, the limits of detection (LOD) and quantification (LOQ), extraction recovery and stability were conducted in accordance with the regulatory guidelines on bioanalytical method validation.
Selectivity
The product ions of m/z 307.1→238.2 (FLC) and m/z 531.2→489.1 (KCZ) were analyzed by full scanning, and the fragment ions were used as product ions monitored during the quantitative analysis.
Linearity
The linearity was investigated by analyzing a seven-point (5.0, 10.0, 50.0, 100.0, 200.0, 500.0, and 1,000.0 ng/mL) calibration curve of FLC in C. albicans lysate in triplicate. Calibration curve were constructed by plotting the peak area ratios of FLC/internal standard vs. the concentrations of FLC in C. albicans lysate, using weighted (1/c2) least squares linear regression. Slope, intercept, and correlation coefficient were calculated as regression parameters by using a 1/x weighed linear regression.
Precision and accuracy
Precision and accuracy were assessed in within-run (repeatability and accuracy in 1 day) and between-run conditions (intermediate precision and intermediate accuracy). Precision was calculated as relative standard deviations (RSD) in percentage, whereas accuracy was calculated as relative error (RE) in percentage, between a nominal concentration value in the calibration sample and a concentration obtained from the calibration curve. Low, medium and high concentrations of FLC (10.0, 100.0, and 500.0 ng/mL, respectively) were used to analyze intra-day precision and accuracy. Moreover, five replicates of each sample at low, medium and high concentration levels were analyzed on the same day. The assay was performed in three consecutive days to evaluate inter-day precision and accuracy.
Limit of detection and limit of quantification
LOD and LOQ were determined by spiking a decreasing concentration of the mixed stock solution into blank C. albicans lysate. The LOD was defined as the lowest concentration point at which the instrument exhibits a signal-to-noise (S/N) ratio equal to 3. The LOQ was defined as the lowest concentration reliably quantified and fulfilled the criteria of not exceeding ± 20% mean relative error (MRE) and < 20% RSD.
Extraction recovery and matrix effect
The samples were spiked with blank C. albicans lysate and prepared with FLC final concentrations of 10.0, 100.0, and 500.0 ng/mL. The extractions of the samples containing different concentrations of FLC were prepared as described in section “Candida albicans lysates extraction.” Then, the samples extractions and different concentrations of FLC standard solution were detected by LC-MS/MS. The extraction recovery rates of samples containing different concentrations of FLC were obtained by comparing the chromatographic peak areas of the same concentration of extraction sample and the FLC standard solution.
In order to develop a reliable and reproducible method, the matrix effect was also investigated. The matrix effect was evaluated by the following experiment. Triplicates of QC samples at three levels of FLC and IS were added into 100 μL C. albicans lysates and water separately, and then the spiked samples were pretreated with exactly the same procedure as described in Candida albicans lysates preparation section. Then, the samples extractions were detected by LC-MS/MS. Comparison of the chromatograms of the blank and the spiked C. albicans lysates was used to assay the selectivity of the method. The matrix effect was determined by observing the signal of the chromatogram.
Stability
Stability of FLC in extracted samples was evaluated at three concentrations (high, medium, low) in triplicate under different conditions, including three freeze (−80°C)/thaw (25°C) cycles, 1-month storage in −20°C or 6 h storage at room temperature. The post-preparative stability was also evaluated by keeping samples in mobile phase at room temperature for 24 h.
Statistical analysis
GraphPad Prism 9 was applied to analyze the statistical significance of data. At least three independent replicates were conducted for all experiments unless otherwise stated and P < 0.05 was considered statistically significant. For multiple comparisons, P-values were calculated by using one-way analysis of variance (ANOVA). For single comparison, P-values were calculated by using two-tailed Student’s t-test.
Results
Liquid chromatography with tandem mass spectrometry optimization
The suitable internal standard was selected to correct the errors that might occur in each process of sample pretreatment, and it is especially important to correct errors caused by instrument instability when mass spectrometry was used as a detector. Internal standards are usually required to have same or similar structural and physical and chemical properties as the analyte. Therefore, KCZ was chosen as the internal standard of this experiment. The structure of KCZ has a certain similarity compared with FLC. In the positive ESI mode, the analyte and IS formed predominately protonated molecular ions [M + H]+ in full scan mass spectra. Figure 1 displayed product ion spectra of [M + H]+ ions from two compounds. Two fragment ions were observed in the product ion spectra. The major fragment ions at m/z 307.1→238.2 and m/z 531.2→489.1 were chosen in the MRM acquisition for FLC and IS, respectively. Moreover, KCZ was not detected in C. albicans lysate. Hence, KCZ met the conditions as an internal standard.
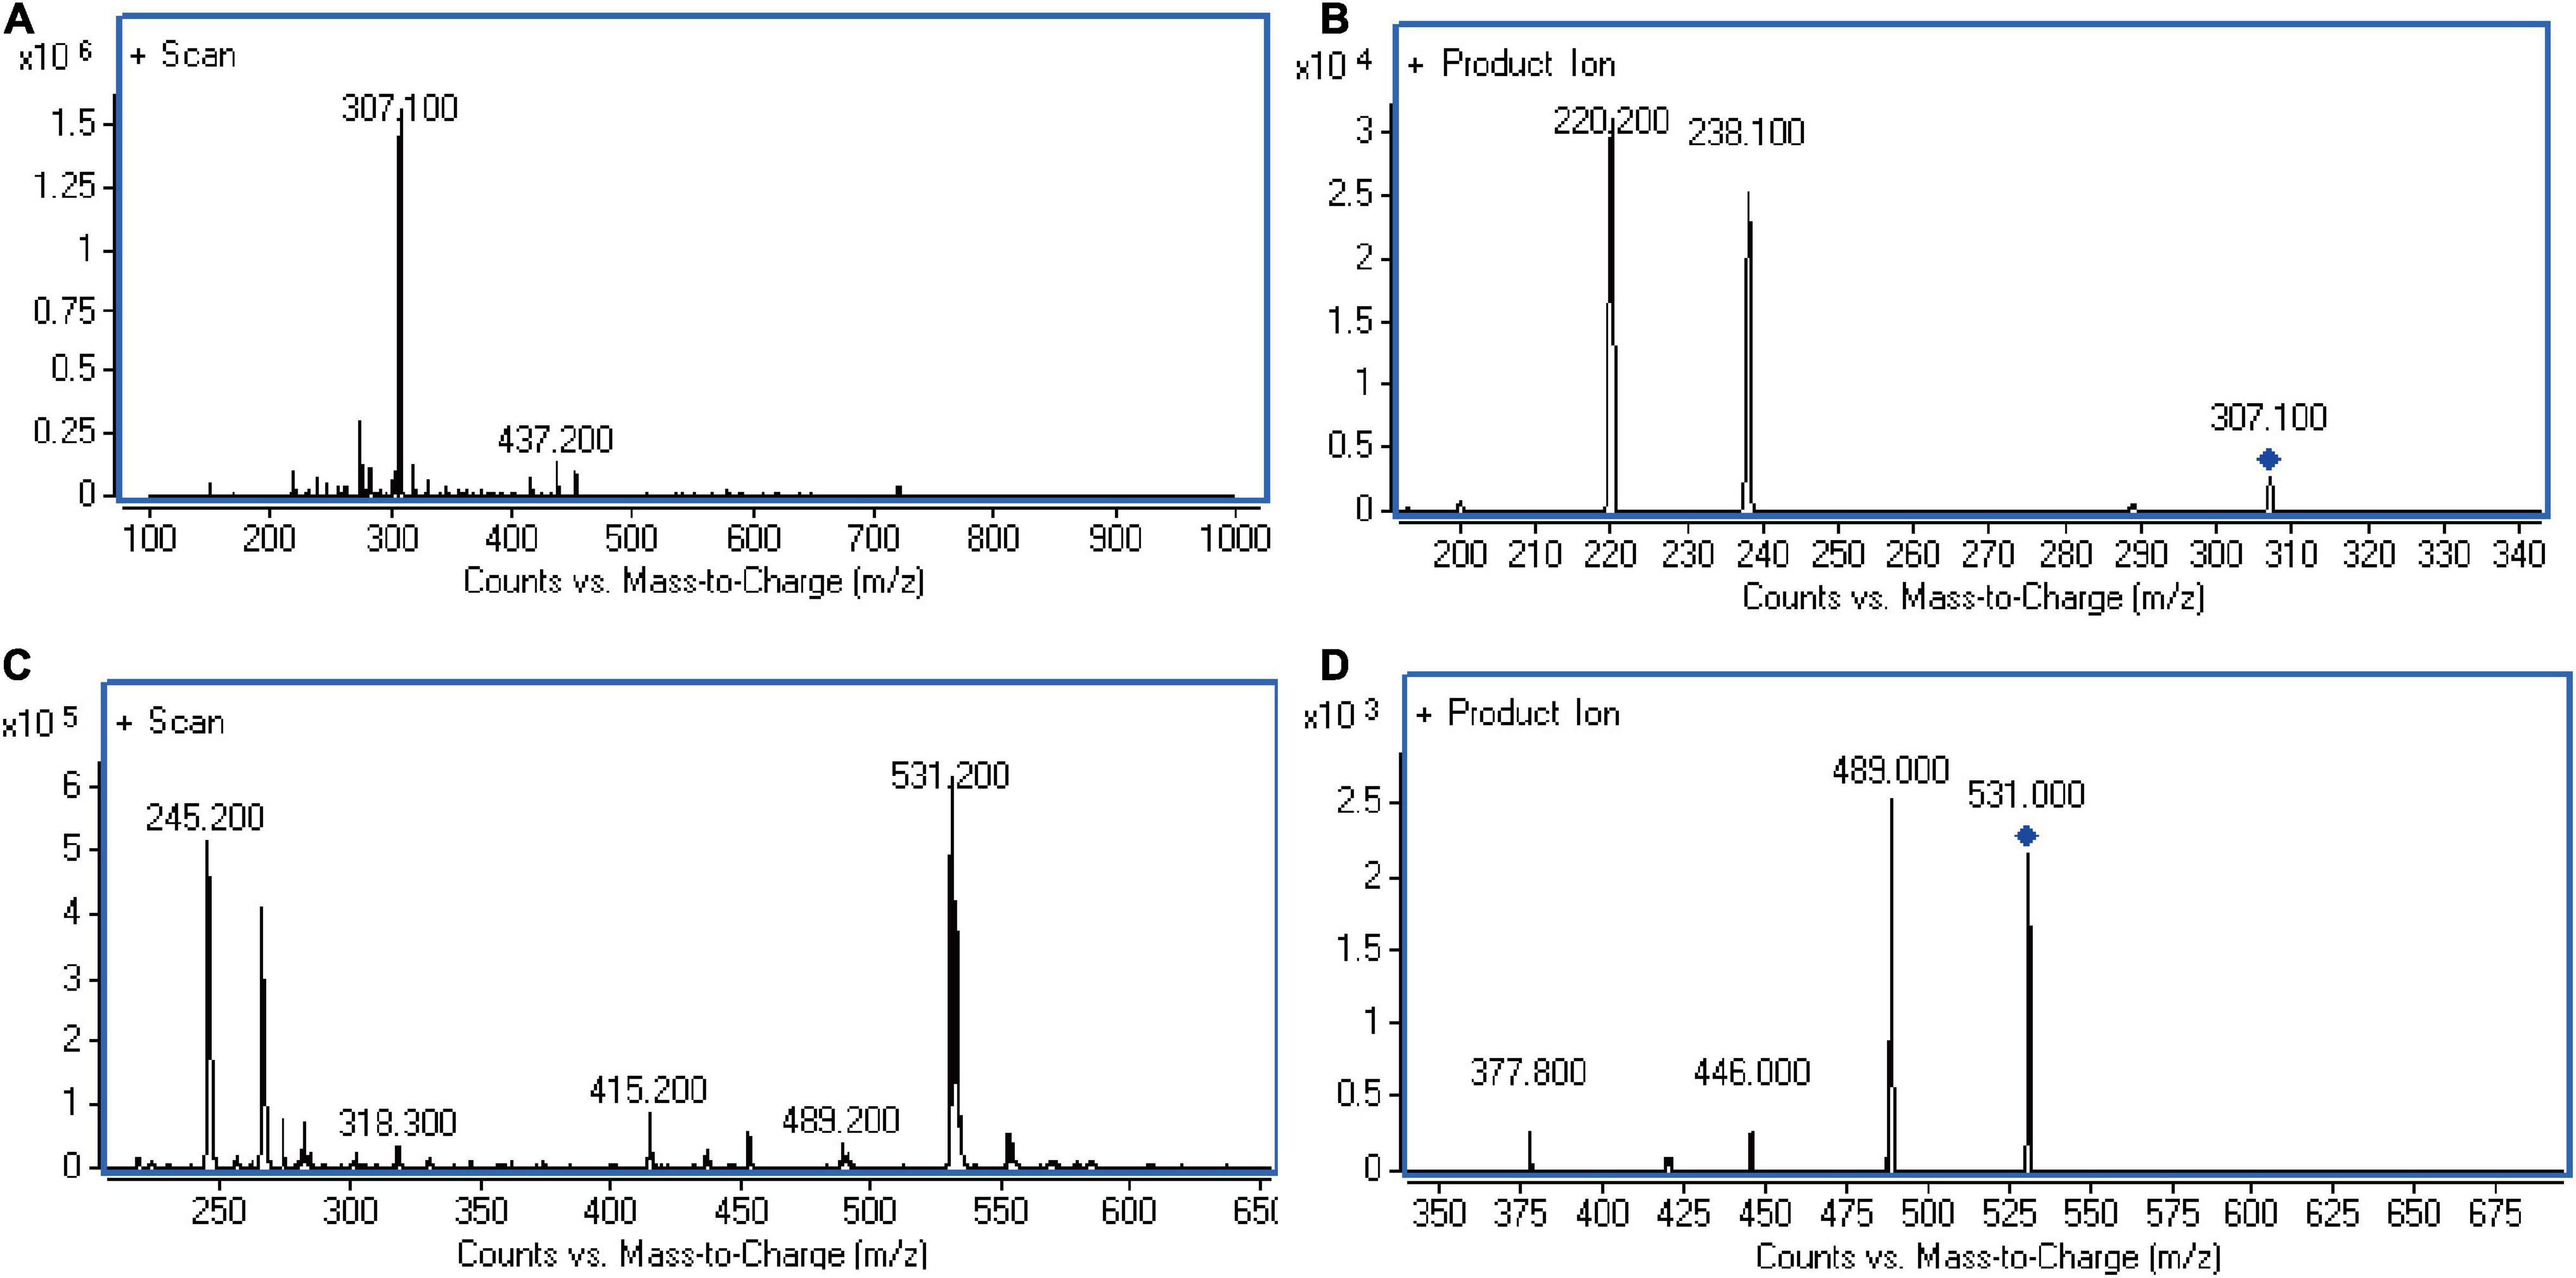
Figure 1. LC-MS/MS chromatograms. (A) Full-scan of FLC in standard solution. (B) Product ion of FLC in standard solution. (C) Full-scan of KCZ in internal standard solution. (D) Product ion of KCZ in internal standard solution. The representative results of three independent experiments are shown.
Sample preparation
In order to make the intracellular FLC fully release from C. albicans, efficient and flexible Precellys 24 biological sample homogenizer offered by Bertin technologies was used for grinding samples prior to analysis. The method could make the cell wall broken completely and conducive to the extraction and separation of FLC from the C. albicans cells. Moreover, the method was simple and efficient. At the beginning of the study, liquid-liquid extraction solvents such as methyl tertiary butyl ether, ethyl acetate or dichloromethane were investigated to process biological samples. After dissolved with the mobile phase [A phase is acetonitrile, B phase is water (containing 0.1% formic acid), A:B = 40:60 (v/v)], the liquid samples were detected by LC-MS/MS. Our results showed that the extraction recovery rate significantly increased to about 81%, and more importantly, samples obtained were clean with less impurities when dichloromethane was used with a small amount of sodium hydroxide (Table 2). Indeed, when samples were re-dissolved and liquid samples were injected after the mobile phase, ideal peak shapes with highest extraction recovery rate (∼ 81%) were observed. Therefore, liquid-liquid extraction to treat C. albicans lysate samples was used with dichloromethane and a small amount of sodium hydroxide.
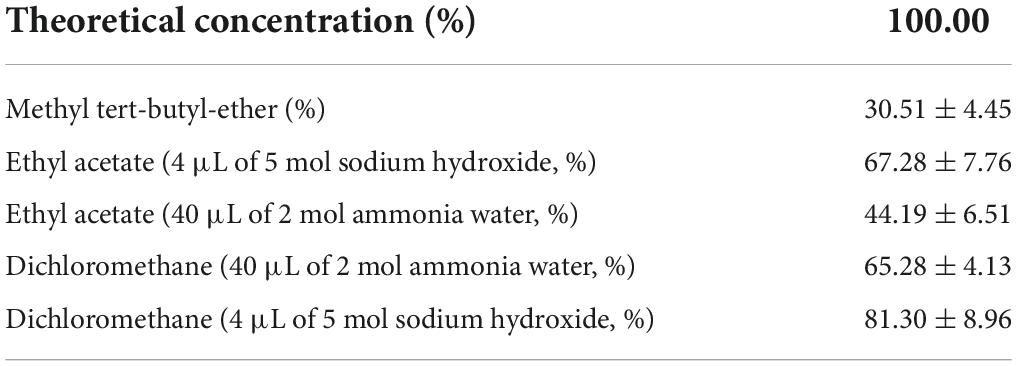
Table 2. Extract recovery of FLC (n = 3).
Validation
Selectivity
The LC–MS/MS detection has high selectivity that only ions generated from the selected precursor ions can be monitored. Comparison the chromatograms of the blank and the spiked C. albicans lysate, the retention times of the analytes and the IS has no significant interference (Figure 2). The retention time of FLC and KCZ were 1.06 and 1.49 min, respectively. The endogenous impurities in C. albicans lysates did not interfere with determination of FLC and KCZ, indicating that the method was specific for FLC analysis in C. albicans.
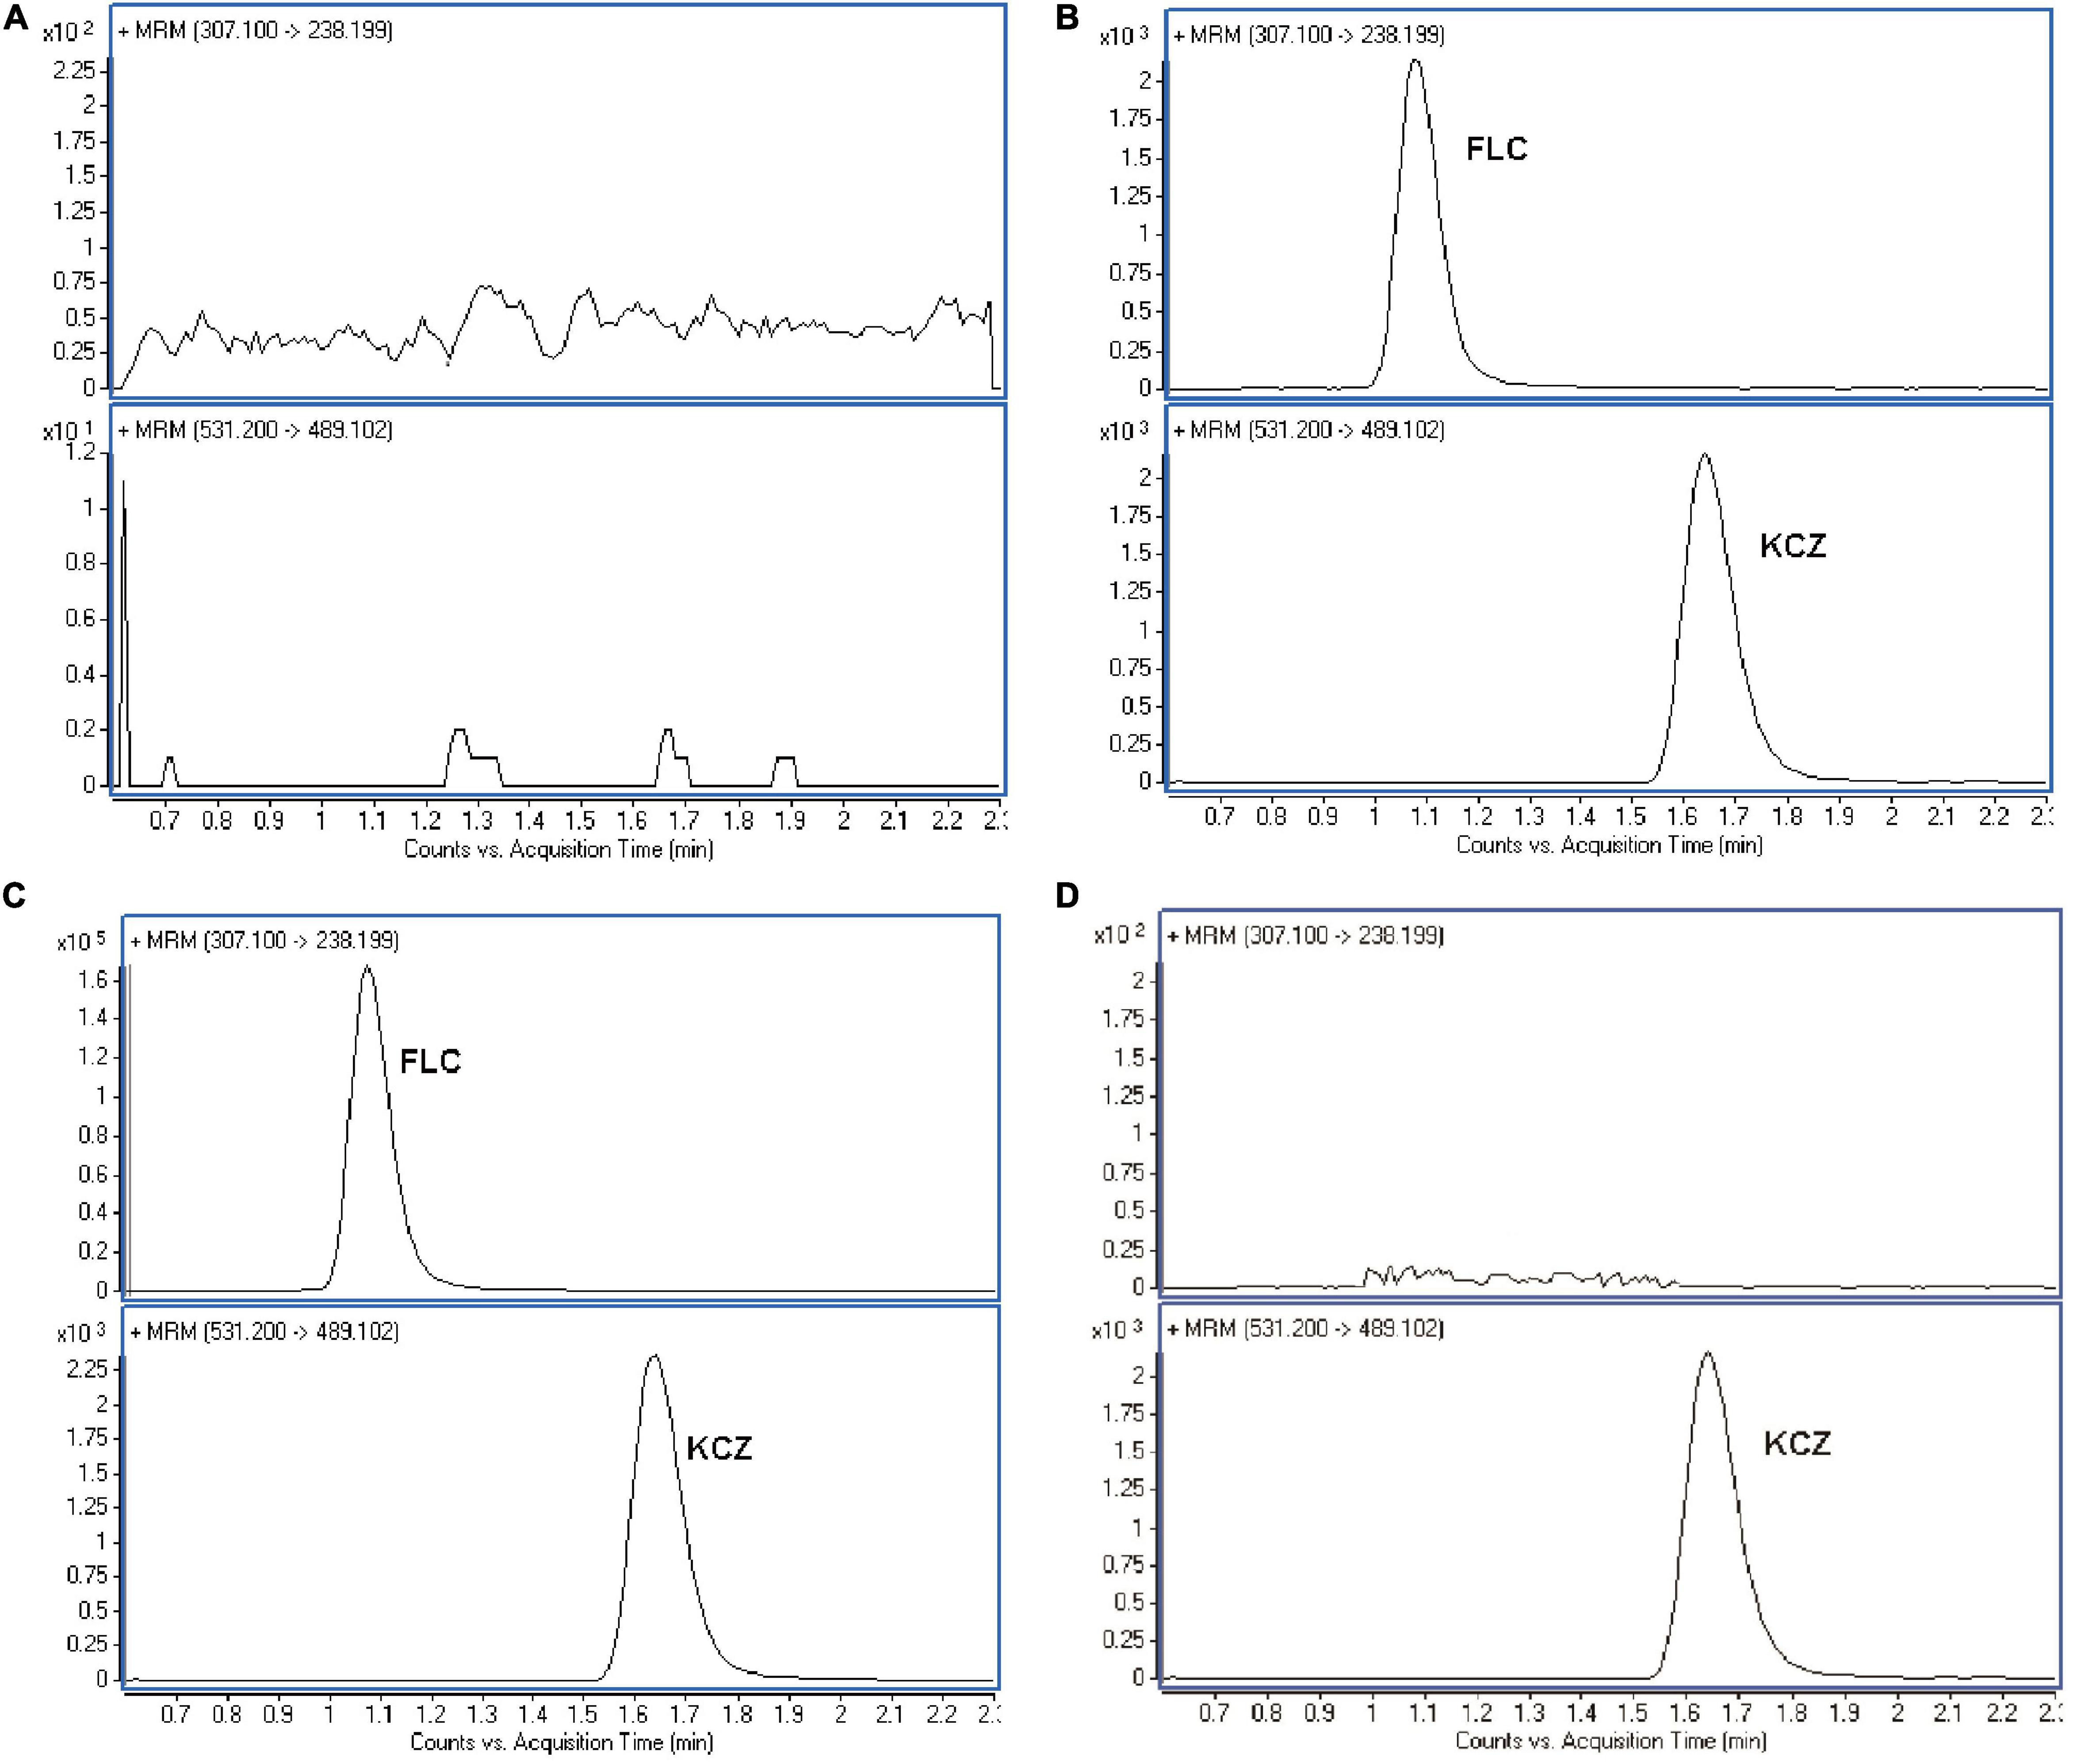
Figure 2. Representative MRM chromatograms of FLC in C. albicans lysate. (A) Blank sample. (B) Blank sample with FLC and KCZ (internal standard). (C) The testing C. albicans lysate. (D) Blank sample with KCZ (internal standard). The representative results of three independent experiments are shown.
Linearity
The calibration curves were linear ranging from 5.0 to 1000.0 ng/mL with the correlation coefficient was 0.9963. The results showed that the standard curve equation of FLC in C. albicans lysates solution was Y = 0.1742C–2.8763 (n = 5). Moreover, the LOQ was 5.0 ng/mL. The standard curve of FLC in C. albicans lysate is shown in Figure 3.
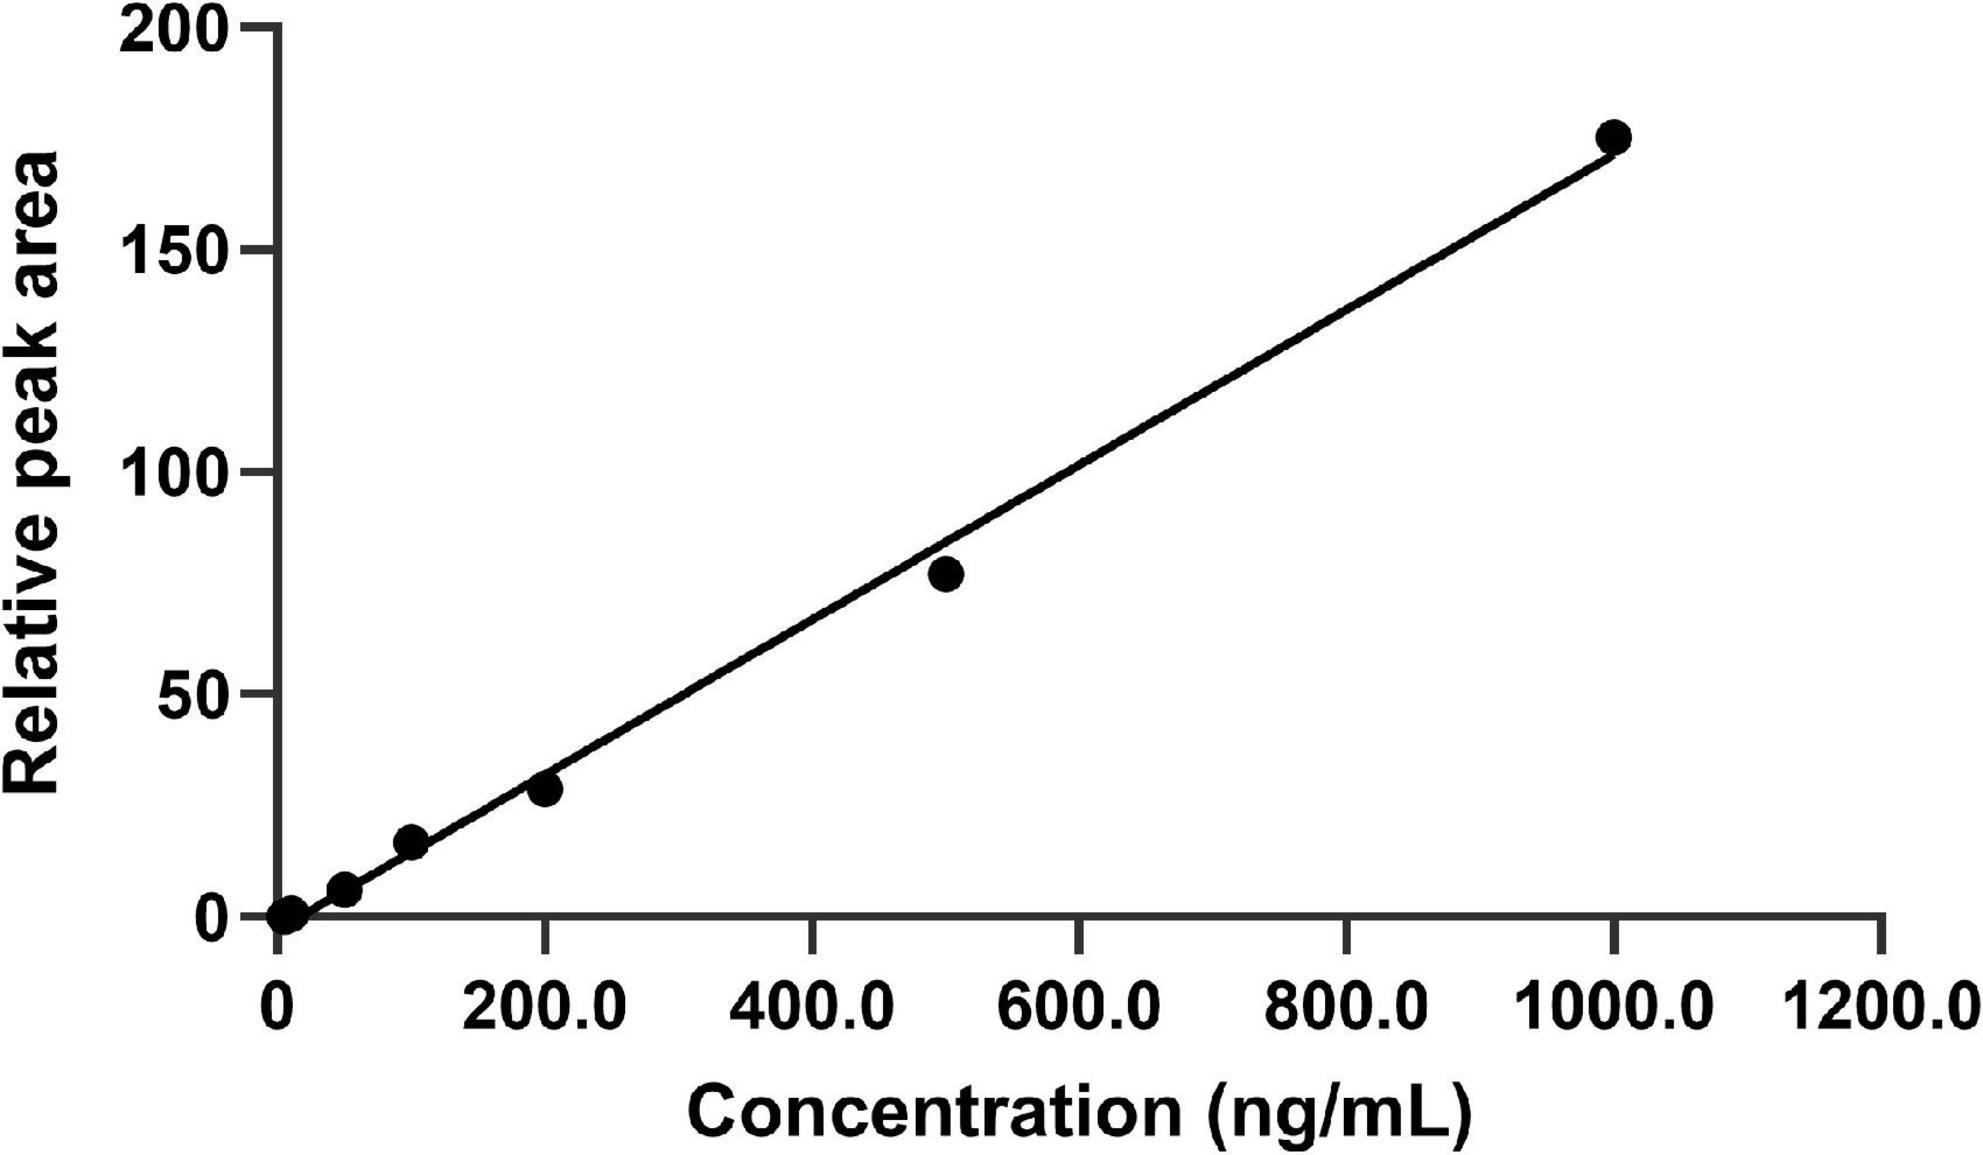
Figure 3. Plot of back-calculated concentrations of calibration standards of FLC. The standard curve equation was Y = 0.1742C–2.8763 (n = 5). The limits of detection for this method were in the range from 5.0 to 1000.0 ng/mL. The representative results of three independent experiments are shown.
Precision and accuracy
Precision and accuracy were determined by replicating the analyses of three known concentrations over the calibration curve on 3 different days. The intra-day accuracy ranged from −12.9 to 10.8%, and the precision ranged from 1.00 to 1.54% (Table 3). The inter-day accuracy and precision were −12.6 ∼11.6% and 0.51 ∼ 0.85%, respectively. The deviation of the measured concentrations from the true value was reached ± 15% of nominal (theoretical) concentrations. These results demonstrated that the method was reproducible and accurate.
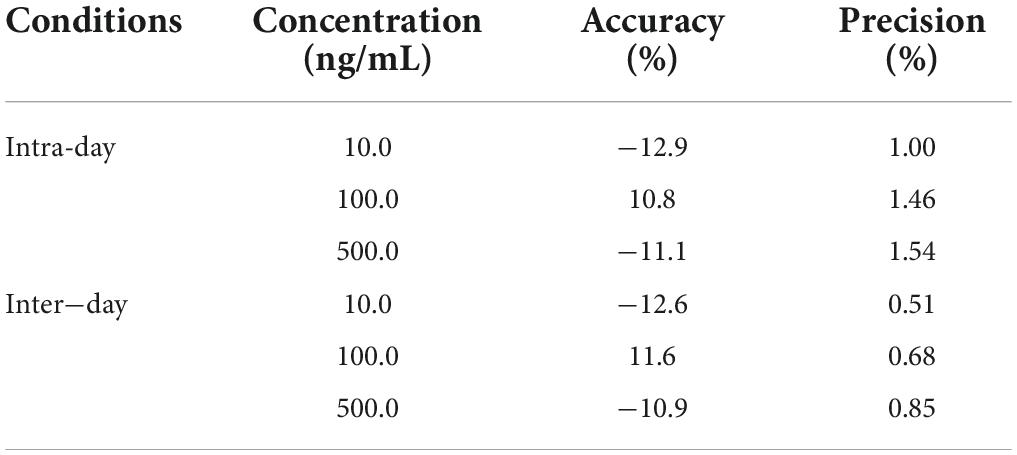
Table 3. Intra-day and inter-day assay precision and accuracy of FLC in C. albicans lysate samples (n = 5).
Extraction recovery and matrix effect
We evaluated the extraction recoveries of FLC at three different concentrations (10.0, 100.0, and 500.0 ng/mL). As shown in Table 4, the extraction relative recoveries of low, medium, and high concentrations were 87.10 ± 0.09%, 110.82 ± 1.62%, and 88.87 ± 13.64%, respectively. High extraction recoveries were observed in C. albicans lysate samples, suggesting that extraction efficiency ensured FLC stability. The results of matrix effect experiments showed that there was no significant difference between the peak areas of samples prepared from C. albicans lysate and water, indicating that no co-eluting unknown compounds had apparent effect on the ionization of analytes and IS (Figure 2).
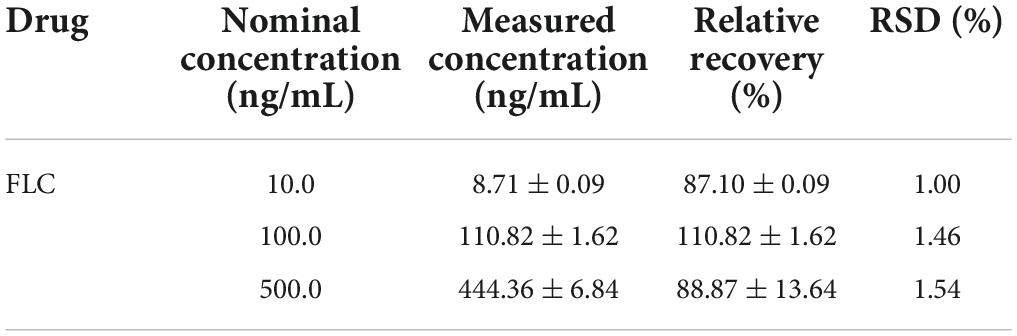
Table 4. Recovery of FLC in C. albicans lysate samples (n = 5).
Limit of detection and limit of quantification
The LOD of FLC was 0.5 ng/mL with an RSD of 2.38%. The present LC–MS/MS method offered an LOQ 5.0 ng/mL with an accuracy of −7.6% in terms of RE and a precision of 5.42% in terms of RSD (n = 5). This indicated a highly sensitive method was established.
Stability
FLC remained stable during sample preparation and storage. The stability of FLC was evaluated under various conditions and summarized in Table 5. The relative deviation of samples undergoing the three freeze (−80°C)-thawed (25°C) cycle was RSD < 2.5%, RSD < 2.1%, and RSD < 3.4% for samples in low, medium and high-quality control samples, respectively. In addition, RSD < 3.8%, RSD < 9.5%, and RSD < 6.1% was observed for samples treated in the mobile phase at room temperature for 24 h in low, medium, and high quality control samples. Moreover, the content of FLC was no significant decreased while C. albicans lysate samples has been stored at −20°C for 30 days. Relative recovery was more than 94.69% in all the quality control samples, indicating that FLC was stable in C. albicans lysate during the whole analytical process.
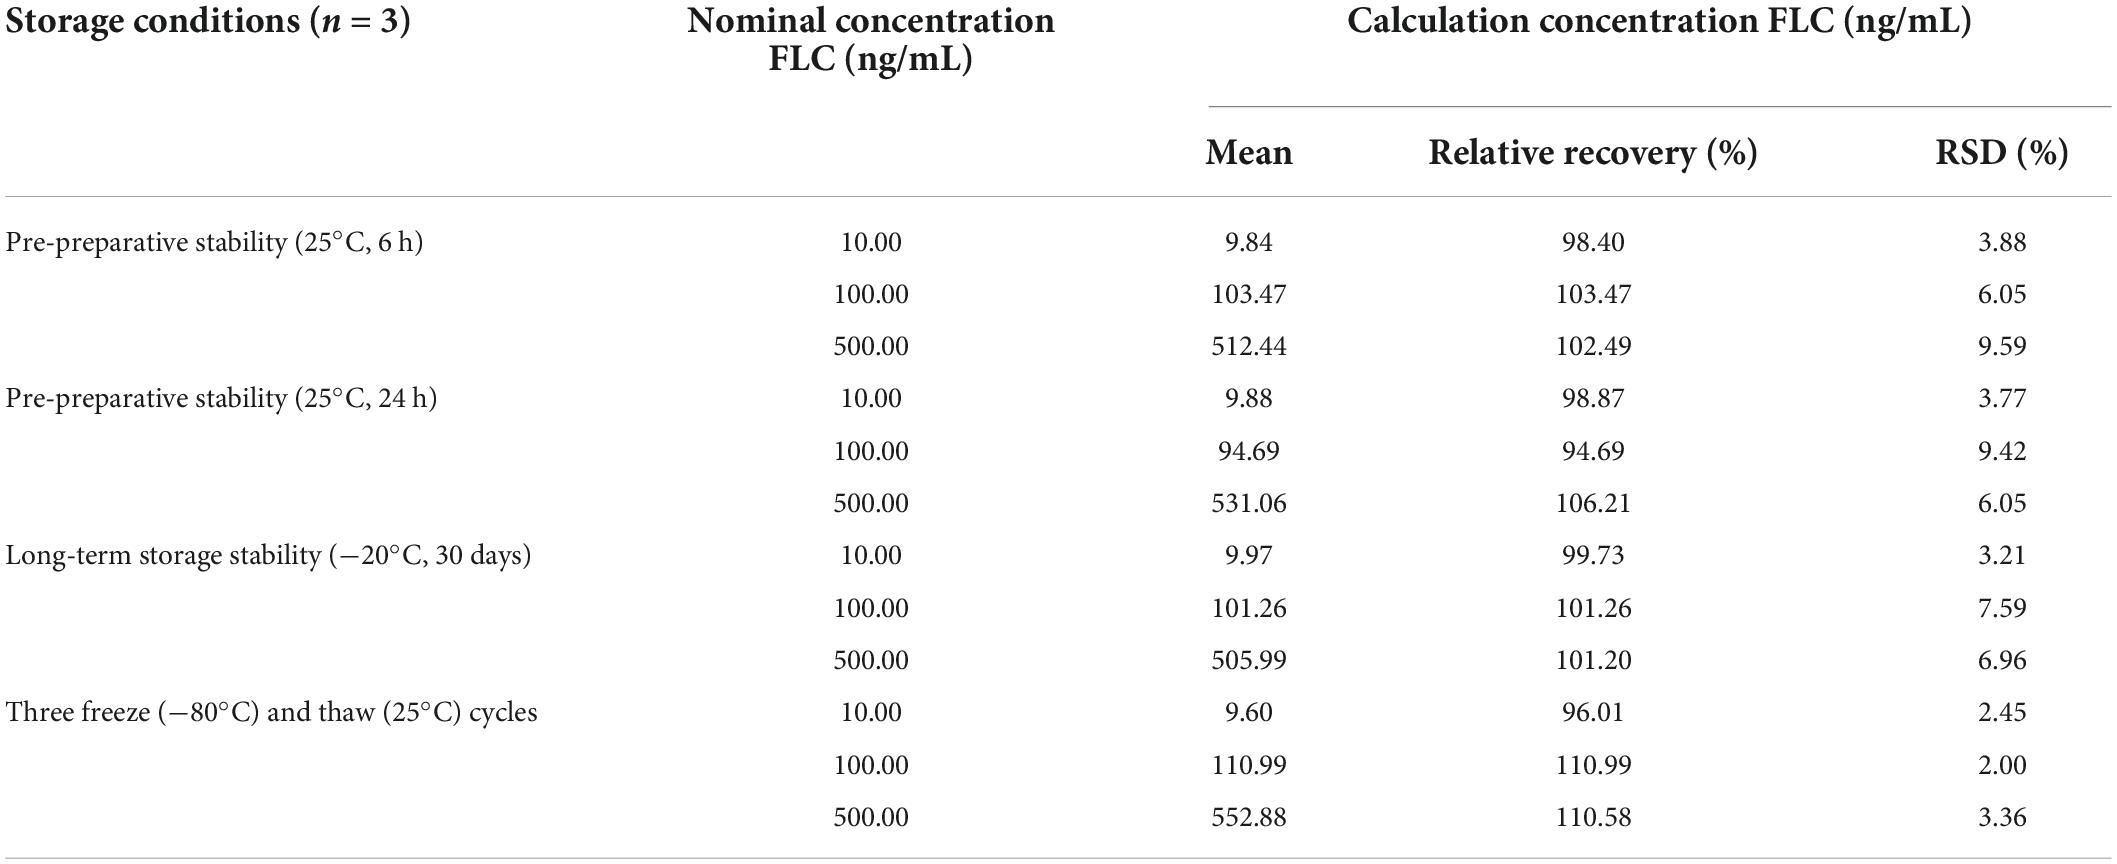
Table 5. Freeze thawing of FLC in C. albicans lysate samples (n = 3).
Application to clinical Candida albicans strains
The method validated in this study was applied to clinical isolated C. albicans strains, including FLC-sensitive and FLC-resistant strains. Figures 4A,B showed the concentrations changes in FLC-resistant strains NO. 100 and NO. 103 treated with 4 and 64 μg/mL FLC, respectively. The concentration of intracellular FLC in C. albicans were gradually increased and then decreased during the 48 h detect time, with a maximum level at 24∼36 h. Furthermore, the concentration of FLC was also measured in 36 clinical isolated C. albicans that was incubation with FLC at a concentration of 1.0 μg/mL. As shown in Figure 4C, the mean intracellular concentration of fluconazole in FLC-sensitive C. albicans strains (green columns) was significantly higher than FLC-resistant C. albicans (red columns). However, no major differences in the intracellular FLC concentration were observed between several sensitive strains (strain13, 14, and 19) and the majority of FLC-resistant strains. Although the reason for this discrepancy is unclear, it might result from the different expression of drug efflux genes in C. albicans cell wall, including CDR1, CDR2, and MDR1 (Kofla et al., 2011; Rocha et al., 2017; Dhasarathan et al., 2021; Xu et al., 2021).
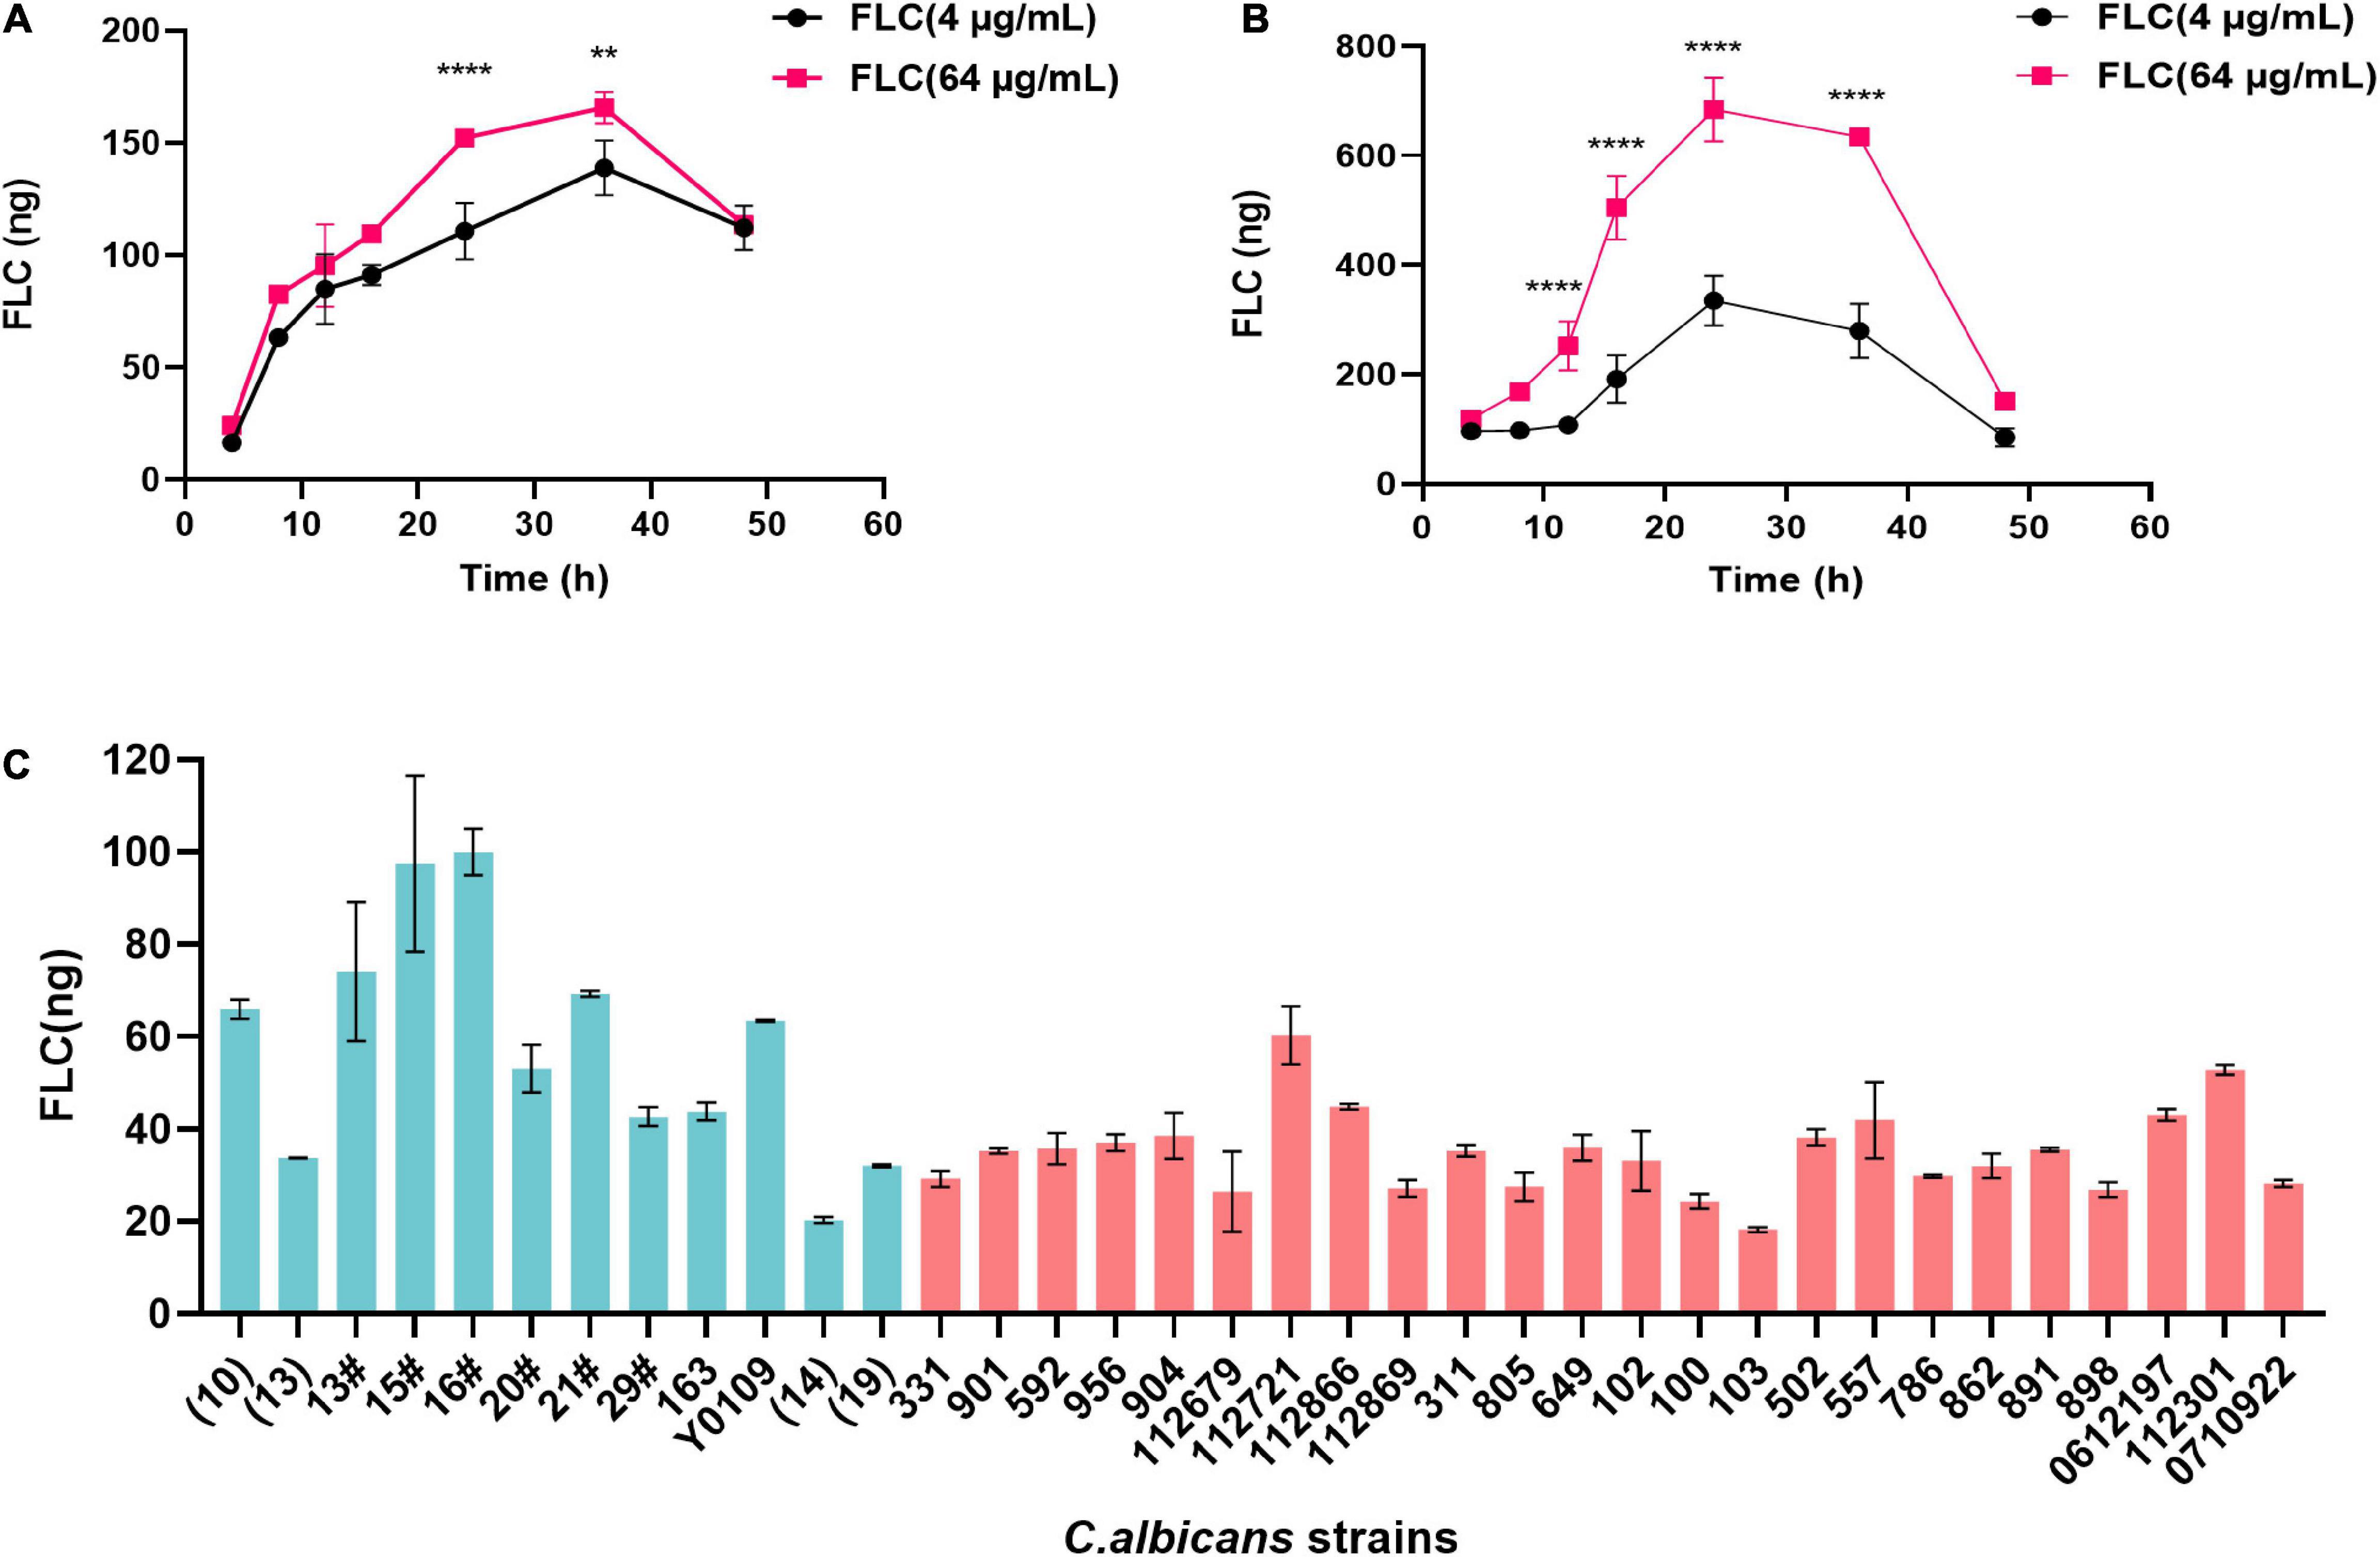
Figure 4. Intracellular levels of FLC in 500.0 mg wet C. albicans samples. (A) Levels of FLC in samples derived from NO. 103 FLC-resistant C. albicans strain at different time points. (B) Levels of FLC in samples derived from NO. 100 FLC-resistant C. albicans strain at different time points. (C) Levels of FLC in C. albicans samples after 1-h incubation with 1 μg/mL FLC. The green columns represent FLC-sensitive C. albicans strains, and the red columns represent FLC-resistant C. albicans strains. Data are mean ± SD from triplicates of one representative experiment of three. **P < 0.01, ****P < 0.0001 [(A,B), one-way analysis of variance (ANOVA)].
Discussion
The effective combination-based therapy is a feasible regimen for the majority of refractory infections disease. FLC represents one of the most commonly available antifungal drugs in clinical practice (Lu et al., 2021). Our previous research has shown that the combination of FLC and berberine (BBR) has a significant synergistic against FLC-resistant C. albicans, but the synergistic effect was not observed in FLC-sensitive C. albicans (Quan et al., 2006). To elucidate whether FLC exerts discrepant effects against C. albicans due to intracellular FLC, we performed LC-MS/MS approach to quantify the concentration of FLC in C. albicans strains. LC-MS/MS is frequently used as a detector to monitor selected ions and specific fragment ions generated by the ions. Currently, available assays for detecting intracellular FLC include bioassays, gas chromatography assays, and high-performance liquid chromatographic methods. In this study, a sensitive and convenient LC-MS/MS method for the determination of intracellular levels of FLC in C. albicans was developed and validated.
Indeed, it is well known that sample extraction plays a particular role in LC analysis, especially for small volume samples requiring purification. The conventional sample preparation approaches of C. albicans lysates for LC analysis include protein precipitation, liquid-liquid extraction or solid phase extraction (Diez et al., 2005; Beste et al., 2012). Although drug extraction rate prepared by solid phase extraction is higher and the sample is clean and automated solid phase extraction instrument can achieve rapid pretreatment of large samples, this method is rarely used because of the expensive columns. Compared to protein precipitation and solid phase extraction, liquid-liquid extraction is one of the most commonly used methods for sample pretreatment (Kim et al., 2018). Relatively pure samples can be obtained by using liquid-liquid extraction with low cost, but this method is not suitable to the low extraction rate or instability drugs.
In the present study, a simple sample preparation and extraction protocol including the use of Precellys homogenizers and methylene chloride for FLC extraction were optimized to provide adequate sensitivity, appropriate samples cleanliness, excellent recovery rate. The method was fully validated based on international guidelines and all evaluated parameters met the pre-established criteria (Zimmer, 2014). Moreover, the suitability of the method was applied to 36 clinical isolated C. albicans strains.
In order to release the intracellular FLC of C. albicans, efficient and flexible Precellys 24 biological sample homogenizer offered by Bertin technologies was applied for grinding samples prior to analysis. Moreover, the sample preparation method was further optimized by using glass beads to homogenize Candida cells. The glass beads allowed the cell wall broken completely, facilitating the extraction and isolation of FLC from C. Candida cells. The integrity of the C. albicans cell was observed under the microscope and the protein content was determined after extraction. Importantly, this extraction method based on the release of FLC from cell breakage was simple and not laborious. It can be used in routine microbiology laboratories to quantify FLC in fungi and improve experimental operation to increase the reproducibility and accuracy.
Internal standard with similar structural and physicochemical properties provides multiple advantages in HPLC-MS/MS bioanalytical process, including reduction of analysis run time, improvement of the intra-injection reproducibility, reduction of matrix and ionization effects (Bergeron et al., 2009). KCZ and FLC have the similar structural and physicochemical properties and belong to the same antifungal drug class. Our results demonstrated that using KCZ as the internal standard was feasible (Table 1). Subsequently, the characteristics of LC-MS/MS approach, including selectivity, linearity, LOD, LOQ, precision, accuracy, extraction recovery, matrix effect, and stability were validated (Tables 2–5 and Figures 1–3).
Furthermore, the established LC-MS/MS method was validated in 36 clinical isolated C. albicans strains. According to Figures 4A,B, the concentration of FLC C. albicans cells was low at the early stage therapeutic exposures. Specifically, intracellular drug concentrations were gradually increased, reaching the maximum concentration between 24 and 36 h, and then gradually decreased over time. We speculate that the changes of FLC concentration may be due to the logarithmic reproduction of C. albicans after 24 h culture, as the most active division and reproduction of C. albicans. During this stage, a large number of substances need to be absorbed from the culture medium for reproduction, and thus FLC was more efficiently untaken by C. albicans. With the rapid increase in the number of C. albicans and the continuous consumption of culture media, C. albicans become tolerant to drugs, and the efflux of intracellular drugs continues to increase, resulting in decreased content of intracellular drug after 36 h.
The intracellular content of FLC is not the same among different C. albicans strains in the same co-culture time (Figure 4C). The intracellular FLC content of a majority of sensitive C. albicans is significantly higher than that of drug-resistant C. albicans, which may be due to membrane permeability or the high expression of CDR1, CDR2, and MDR1 in FLC-resistant C. albicans strains, and the reduction of intracellular azole drug content caused by drug efflux (Kofla et al., 2011; Rocha et al., 2017; Dhasarathan et al., 2021; Xu et al., 2021). However, the results also showed that intracellular FLC content of FLC-sensitive C. albicans strains (strain 13, 14, and 19) is lower than most of FLC-resistant C. albicans strains. Mechanisms of FLC-resistance amongst C. albicans isolates are highly variable and often clade specific, the nuances of which are still being elucidated (Perea et al., 2001; Flowers et al., 2015).
To investigate whether the intracellular FLC content can be affected in the presence of other drugs which exhibits synergistic effects with FLC against FLC-resistant C. albicans 103 strain, we applied the established approach to detect the intracellular FLC content in the combination of Flos Rosae Chinensis (FRC), BBR, or other herbal extracts derived from the traditional Chinese medicine and FLC. The results showed that the effects of different drugs on intracellular concentration of FLC were diverse. Among these drugs exhibiting synergistic anti-FLC-resistant C. albicans activity with FLC, some drugs did increase the intracellular concentration of FLC at the different time points analyzed, some drugs did not affect the intracellular FLC concentration, but some drugs even decreased the intracellular concentration of FLC (data not shown). These data indicated that the mechanisms of these synergistic effects were different from each other. Given the complex and heterogeneity of resistance mechanisms, further investigations are required to explore the exact molecular mechanisms underlying these phenomena. In addition, detection of intracellular FLC content when applying our approach to a combination therapy regimen may be affected by other compounds, such as phosphorus-containing compounds can adsorb onto active sites in the sample flow path, particularly at trace levels, compromising the accuracy of the chromatography. Furthermore, some compounds are more difficult to elute from the column, such as BBR, requiring additional elution time to resolve this. However, combination drugs that affect the stability of FLC have not been encountered.
Taken together, we developed a LC-MS/MS approach, providing a highly accurate, efficient, and reproducible method for quantifying the intracellular concentration of FLC in C. albicans. However, the present study has several limitations. First, this LC-MS/MS method was applied to 36 clinical isolated C. albicans strains, more clinical isolated C. albicans strains would be needed to further investigate this relationship between intracellular drug concentration of FLC-sensitive and FLC-resistant C. albicans. Second, the combination therapy regimens can be easily implemented to treat fungal infections (Iyer et al., 2020). Our current easy-to-use detection method may further obtain data on the intracellular drug concentration to explore the underlying mechanism of synergistic antifungal therapy by increasing the intracellular drug content. Third, whether the differences of drug concentration between FLC-sensitive and FLC-resistant C. albicans is related to membrane permeability or drug efflux genes needs to be further investigated.
Data availability statement
The original contributions presented in the study are included in the article/supplementary material, further inquiries can be directed to the corresponding author/s.
Author contributions
XFW, XJW, YJ, BH, and YC conceptualized the study design. XFW, XJW, TC, and LL conducted experiments. XJW, YQ, and LL wrote the manuscript. YJ, BH, and YC supervised the study and revised the manuscript. All authors contributed to the article and approved the submitted version.
Funding
This research was supported by the National Natural Science Foundation of China (grant nos. 81872910, 81673478, 82103095, and 82104242), the Shanghai Key Basic Research Project (grant no. 19JC1414900), the Shanghai Traditional Chinese Medicine New Interdisciplinary Program and the Natural Science Foundation of Shanghai (grant no. 19ZR1451800), the Project of Shanghai Minhang District Health and Family Planning Commission (grant no. 2021MW18), and the Minhang District Healthcare System Program for Outstanding Young Medical Technical and Pharmacology Scholars (grant no. mwyjyx01).
Acknowledgments
We are grateful to Changhai Hospital (Shanghai, China) and Tianjin University (Tianjin, China) for providing C. albicans strains.
Conflict of interest
The authors declare that the research was conducted in the absence of any commercial or financial relationships that could be construed as a potential conflict of interest.
Publisher’s note
All claims expressed in this article are solely those of the authors and do not necessarily represent those of their affiliated organizations, or those of the publisher, the editors and the reviewers. Any product that may be evaluated in this article, or claim that may be made by its manufacturer, is not guaranteed or endorsed by the publisher.
References
Alebic-Kolbah, T., and Modesitt, M. S. (2012). Anidulafungin–challenges in development and validation of an LC-MS/MS bioanalytical method validated for regulated clinical studies. Anal. Bioanal. Chem. 404, 2043–2055. doi: 10.1007/s00216-012-6272-4
Arendrup, M. C., and Patterson, T. F. (2017). Multidrug-resistant Candida: Epidemiology, molecular mechanisms, and treatment. J. Infect. Dis. 216:S445–S451. doi: 10.1093/infdis/jix131
Bergeron, A., Furtado, M., and Garofolo, F. (2009). Importance of using highly pure internal standards for successful liquid chromatography/tandem mass spectrometric bioanalytical assays. Rapid Commun. Mass Spectrom. 23, 1287–1297. doi: 10.1002/rcm.4001
Berkow, E. L., and Lockhart, S. R. (2017). Fluconazole resistance in Candida species: A current perspective. Infect. Drug Resist. 10, 237–245. doi: 10.2147/idr.S118892
Beste, K. Y., Burkhardt, O., and Kaever, V. (2012). Rapid HPLC-MS/MS method for simultaneous quantitation of four routinely administered triazole antifungals in human plasma. Clin. Chim. Acta 413, 240–245. doi: 10.1016/j.cca.2011.09.042
Bongomin, F., Gago, S., Oladele, R. O., and Denning, D. W. (2017). Global and multi-national prevalence of fungal diseases-estimate precision. J. Fungi 3:57. doi: 10.3390/jof3040057
Brown, G. D., Denning, D. W., and Levitz, S. M. (2012). Tackling human fungal infections. Science 336:647. doi: 10.1126/science.1222236
Campitelli, M., Zeineddine, N., Samaha, G., and Maslak, S. (2017). Combination antifungal therapy: A review of current data. J. Clin. Med. Res. 9, 451–456. doi: 10.14740/jocmr2992w
de Moraes, F. C., Bittencourt, S. F., Perissutti, E., Frencentese, F., Arruda, A. M., Chen, L. S., et al. (2014). Quantification of dapaconazole in human plasma using high-performance liquid chromatography coupled to tandem mass spectrometry: Application to a phase I study. J. Chromatogr. B 958, 102–107. doi: 10.1016/j.jchromb.2014.01.053
de Oliveira Santos, G. C., Vasconcelos, C. C., Lopes, A. J. O., De Sousa Cartágenes, M. D. S., Filho, A., Do Nascimento, F. R. F., et al. (2018). Candida infections and therapeutic strategies: Mechanisms of action for traditional and alternative agents. Front. Microbiol. 9:1351. doi: 10.3389/fmicb.2018.01351
Dhasarathan, P., Alsalhi, M. S., Devanesan, S., Subbiah, J., Ranjitsingh, A. J. A., Binsalah, M., et al. (2021). Drug resistance in Candida albicans isolates and related changes in the structural domain of Mdr1 protein. J. Infect. Public Health 14, 1848–1853. doi: 10.1016/j.jiph.2021.11.002
Diez, L., Martenka, E., Dabrowska, A., Coulon, J., and Leroy, P. (2005). Assessment of in situ cellular glutathione labeling with naphthalene-2,3-dicarboxaldehyde using high-performance liquid chromatography. J. Chromatogr. B Anal. Technol. Biomed. Life Sci. 827, 44–50. doi: 10.1016/j.jchromb.2005.02.007
Flowers, S. A., Colón, B., Whaley, S. G., Schuler, M. A., and Rogers, P. D. (2015). Contribution of clinically derived mutations in ERG11 to azole resistance in Candida albicans. Antimicrob. Agents Chemother. 59, 450–460. doi: 10.1128/aac.03470-14
Hou, J., Deng, J., Liu, Y., Zhang, W., Wu, S., Liao, Q., et al. (2022). Epidemiology, clinical characteristics, risk factors, and outcomes of candidemia in a large tertiary teaching hospital in Western China: A retrospective 5-year study from 2016 to 2020. Antibiotics 11:788. doi: 10.3390/antibiotics11060788
Iyer, K. R., Camara, K., Daniel-Ivad, M., Trilles, R., Pimentel-Elardo, S. M., Fossen, J. L., et al. (2020). An oxindole efflux inhibitor potentiates azoles and impairs virulence in the fungal pathogen Candida auris. Nat. Commun. 11:6429. doi: 10.1038/s41467-020-20183-3
Johnson, M. D., Macdougall, C., Ostrosky-Zeichner, L., Perfect, J. R., and Rex, J. H. (2004). Combination antifungal therapy. Antimicrob. Agents Chemother. 48, 693–715. doi: 10.1128/aac.48.3.693-715.2004
Kim, C., Ryu, H. D., Chung, E. G., Kim, Y., and Lee, J. K. (2018). A review of analytical procedures for the simultaneous determination of medically important veterinary antibiotics in environmental water: Sample preparation, liquid chromatography, and mass spectrometry. J. Environ. Manag. 217, 629–645. doi: 10.1016/j.jenvman.2018.04.006
Kofla, G., Turner, V., Schulz, B., Storch, U., Froelich, D., Rognon, B., et al. (2011). Doxorubicin induces drug efflux pumps in Candida albicans. Med. Mycol. 49, 132–142. doi: 10.3109/13693786.2010.512022
Lu, H., Shrivastava, M., Whiteway, M., and Jiang, Y. (2021). Candida albicans targets that potentially synergize with fluconazole. Crit. Rev. Microbiol. 47, 323–337. doi: 10.1080/1040841x.2021.1884641
Magill, S. S., Edwards, J. R., Bamberg, W., Beldavs, Z. G., Dumyati, G., Kainer, M. A., et al. (2014). Multistate point-prevalence survey of health care-associated infections. N. Engl. J. Med. 370, 1198–1208. doi: 10.1056/NEJMoa1306801
Pappas, P. G., Lionakis, M. S., Arendrup, M. C., Ostrosky-Zeichner, L., and Kullberg, B. J. (2018). Invasive candidiasis. Nat. Rev. Dis. Primers 4:18026. doi: 10.1038/nrdp.2018.26
Perea, S., López-Ribot, J. L., Kirkpatrick, W. R., Mcatee, R. K., Santillán, R. A., Martínez, M., et al. (2001). Prevalence of molecular mechanisms of resistance to azole antifungal agents in Candida albicans strains displaying high-level fluconazole resistance isolated from human immunodeficiency virus-infected patients. Antimicrob. Agents Chemother. 45, 2676–2684. doi: 10.1128/aac.45.10.2676-2684.2001
Pristov, K. E., and Ghannoum, M. A. (2019). Resistance of Candida to azoles and echinocandins worldwide. Clin. Microbiol. Infect. 25, 792–798. doi: 10.1016/j.cmi.2019.03.028
Quan, H., Cao, Y. Y., Xu, Z., Zhao, J. X., Gao, P. H., Qin, X. F., et al. (2006). Potent in vitro synergism of fluconazole and berberine chloride against clinical isolates of Candida albicans resistant to fluconazole. Antimicrob. Agents Chemother. 50, 1096–1099. doi: 10.1128/aac.50.3.1096-1099.2006
Quindós, G., Marcos-Arias, C., San-Millán, R., Mateo, E., and Eraso, E. (2018). The continuous changes in the aetiology and epidemiology of invasive candidiasis: From familiar Candida albicans to multiresistant Candida auris. Int. Microbiol. 21, 107–119. doi: 10.1007/s10123-018-0014-1
Revie, N. M., Iyer, K. R., Robbins, N., and Cowen, L. E. (2018). Antifungal drug resistance: Evolution, mechanisms and impact. Curr. Opin. Microbiol. 45, 70–76. doi: 10.1016/j.mib.2018.02.005
Ribeiro de Carvalho, R., Chaves Silva, N., Cusinato, M., Tranches Dias, K. S., Dos Santos, M. H., Viegas Junior, C., et al. (2018). Promising synergistic activity of fluconazole with bioactive guttiferone-a and derivatives against non-albicans Candida species. J. Mycol. Med. 28, 645–650. doi: 10.1016/j.mycmed.2018.07.006
Robbins, N., Caplan, T., and Cowen, L. E. (2017). Molecular evolution of antifungal drug resistance. Annu. Rev. Microbiol. 71, 753–775. doi: 10.1146/annurev-micro-030117-020345
Rocha, M. F. G., Bandeira, S. P., De Alencar, L. P., Melo, L. M., Sales, J. A., Paiva, M. A. N., et al. (2017). Azole resistance in Candida albicans from animals: Highlights on efflux pump activity and gene overexpression. Mycoses 60, 462–468. doi: 10.1111/myc.12611
Różalska, B., Sadowska, B., Budzyńska, A., Bernat, P., and Różalska, S. (2018). Biogenic nanosilver synthesized in metarhizium robertsii waste mycelium extract - as a modulator of Candida albicans morphogenesis, membrane lipidome and biofilm. PLoS One 13:e0194254. doi: 10.1371/journal.pone.0194254
Tang, J., Wei, H., Liu, H., Ji, H., Dong, D., Zhu, D., et al. (2010). Pharmacokinetics and biodistribution of itraconazole in rats and mice following intravenous administration in a novel liposome formulation. Drug Deliv. 17, 223–230. doi: 10.3109/10717541003667822
Tome, M., Zupan, J., Tomičić, Z., Matos, T., and Raspor, P. (2018). Synergistic and antagonistic effects of immunomodulatory drugs on the action of antifungals against Candida glabrata and Saccharomyces cerevisiae. PeerJ 6:e4999. doi: 10.7717/peerj.4999
Van De Steene, J. C., and Lambert, W. E. (2008). Comparison of matrix effects in HPLC-MS/MS and UPLC-MS/MS analysis of nine basic pharmaceuticals in surface waters. J. Am. Soc. Mass Spectrom. 19, 713–718. doi: 10.1016/j.jasms.2008.01.013
Wadsworth, J. M., Milan, A. M., Anson, J., and Davison, A. S. (2017). Development of a liquid chromatography tandem mass spectrometry method for the simultaneous measurement of voriconazole, posaconazole and itraconazole. Ann. Clin. Biochem. 54, 686–695. doi: 10.1177/0004563216686378
Wiederhold, N. P. (2017). Antifungal resistance: Current trends and future strategies to combat. Infect. Drug Resist. 10, 249–259. doi: 10.2147/idr.S124918
Xiang, J., Yu, Q., Liang, M. Z., Qin, Y. P., and Nan, F. (2018). [Determination of voriconazole in human plasma and its bioequivalence by HPLC-MS/MS]. Sichuan Da Xue Xue Bao Yi Xue Ban 49, 102–106.
Xu, Y., Lu, H., Zhu, S., Li, W. Q., Jiang, Y. Y., Berman, J., et al. (2021). Multifactorial mechanisms of tolerance to ketoconazole in Candida albicans. Microbiol. Spectr. 9:e0032121. doi: 10.1128/Spectrum.00321-21
Zacchino, S. A., Butassi, E., Cordisco, E., and Svetaz, L. A. (2017). Hybrid combinations containing natural products and antimicrobial drugs that interfere with bacterial and fungal biofilms. Phytomedicine 37, 14–26. doi: 10.1016/j.phymed.2017.10.021
Zgoła-Grześkowiak, A., and Grześkowiak, T. (2013). Application of dispersive liquid-liquid microextraction followed by HPLC-MS/MS for the trace determination of clotrimazole in environmental water samples. J. Sep. Sci. 36, 2514–2521. doi: 10.1002/jssc.201300271
Zhang, H., Wang, X., Qian, M., Wang, X., Xu, H., Xu, M., et al. (2011). Residue analysis and degradation studies of fenbuconazole and myclobutanil in strawberry by chiral high-performance liquid chromatography-tandem mass spectrometry. J. Agric. Food Chem. 59, 12012–12017. doi: 10.1021/jf202975x
Keywords: fluconazole, Candida albicans, liquid-liquid extraction, LC-MS/MS, intracellular concentration
Citation: Wang X, Wang X, Cai T, Qin Y, Li L, Jiang Y, Han B and Cao Y (2022) Development and validation of a sensitive LC-MS/MS method for determination of intracellular concentration of fluconazole in Candida albicans. Front. Microbiol. 13:1007576. doi: 10.3389/fmicb.2022.1007576
Received: 30 July 2022; Accepted: 16 September 2022;
Published: 05 October 2022.
Edited by:
Weihua Pan, Shanghai Changzheng Hospital, ChinaReviewed by:
Wenqiang Chang, Shandong University, ChinaWenjuan Wu, Tongji University School of Medicine, China
Copyright © 2022 Wang, Wang, Cai, Qin, Li, Jiang, Han and Cao. This is an open-access article distributed under the terms of the Creative Commons Attribution License (CC BY). The use, distribution or reproduction in other forums is permitted, provided the original author(s) and the copyright owner(s) are credited and that the original publication in this journal is cited, in accordance with accepted academic practice. No use, distribution or reproduction is permitted which does not comply with these terms.
*Correspondence: Yuanying Jiang, amlhbmd5eUBzbW11LmVkdS5jbg==; Bing Han, aGJzaGNuQDE2My5jb20=; Yongbing Cao, eWJjYW9AdmlwLnNpbmEuY29t
†These authors have contributed equally to this work