 Can Holyavkin1,2
 Burcu Turanlı-Yıldız1,2
 Ülkü Yılmaz1,2Ceren Alkım1,2†
 Mevlüt Arslan1,2†
 Alican Topaloğlu1,2Halil İbrahim Kısakesen1,2Gustavo de Billerbeck3
 Jean Marie François4*
 Z. Petek Çakar1,2*
- 1Department of Molecular Biology & Genetics, Faculty of Science & Letters, Istanbul Technical University, Istanbul, Turkey
- 2Dr. Orhan Öcalgiray Molecular Biology, Biotechnology and Genetics Research Center (ITU-MOBGAM), Istanbul Technical University, Istanbul, Turkey
- 3INSA, UPS, INP, Université de Toulouse, Toulouse, France
- 4Toulouse Biotechnology Institute (TBI), CNRS, INRA, INSA, Université de Toulouse, Toulouse, France
2-Phenylethanol is an aromatic compound commonly used in the food, cosmetic, and pharmaceutical industries. Due to increasing demand for natural products by consumers, the production of this flavor by microbial fermentation is gaining interest, as a sustainable alternative to chemical synthesis or expensive plant extraction, both processes relying on the use of fossil resources. However, the drawback of the fermentation process is the high toxicity of 2-phenylethanol to the producing microorganism. The aim of this study was to obtain a 2-phenylethanol-resistant Saccharomyces cerevisiae strain by in vivo evolutionary engineering and characterize the adapted yeast at the genomic, transcriptomic and metabolic levels. For this purpose, the tolerance to 2-phenylethanol was developed by gradually increasing the concentration of this flavor compound through successive batch cultivations, leading to an adapted strain that could tolerate 3.4 g/L of 2-phenylethanol, which was about 3-times better than the reference strain. Genome sequencing of the adapted strain identified point mutations in several genes, notably in HOG1 that encodes the Mitogen-Activated Kinase of the high-osmolarity signaling pathway. As this mutation is localized in the phosphorylation lip of this protein, it likely resulted in a hyperactive protein kinase. Transcriptomic analysis of the adapted strain supported this suggestion by revealing a large set of upregulated stress-responsive genes that could be explained in great part by HOG1-dependent activation of the Msn2/Msn4 transcription factor. Another relevant mutation was found in PDE2 encoding the low affinity cAMP phosphodiesterase, the missense mutation of which may lead to hyperactivation of this enzyme and thereby enhance the stressful state of the 2-phenylethanol adapted strain. In addition, the mutation in CRH1 that encodes a chitin transglycosylase implicated in cell wall remodeling could account for the increased resistance of the adapted strain to the cell wall-degrading enzyme lyticase. Finally, the potent upregulation of ALD3 and ALD4 encoding NAD+ -dependent aldehyde dehydrogenase together with the observed phenylacetate resistance of the evolved strain suggest a resistance mechanism involving conversion of 2-phenylethanol into phenylacetaldehyde and phenylacetate implicating these dehydrogenases.
1. Introduction
2-Phenylethanol (2-PE) is an aromatic alcohol compound that is widely used in the cosmetic, perfume, and food industries. This flavor compound is mainly produced by chemical synthesis at a world production of about 10,000 tons per year with a market value of about 280 million USD (Mitri et al., 2022). The chemical synthesis involves three different processes which include the Friedel-Crafts reaction of ethylene oxide with benzene in the presence of aluminum chloride, the hydrogenation of styrene oxide with sodium hydroxide and Raney nickel as a catalyst, and the oxidation of propylene with 2-phenylethyl hydroperoxide. However, the use of toxic and carcinogenic chemicals such as benzene and styrene oxide is a major drawback. Additionally, as 2-PE is used in food and pharmaceuticals, safety regulations advocate the use of natural production methods, which are also decided by consumer plebiscites. These natural methods include solvent-based extraction mainly from rose flowers and biotechnological processes, either by bioconversion of phenylalanine or directly from glucose using different yeast species (Mitri et al., 2022).
The biotechnological production of 2-PE by yeasts is limited by its high toxicity, as full inhibition of growth has been observed in the range of 1.5 to 4.0 g/L, depending on the yeast (Saccharomyces cerevisiae) strain and species used (Carlquist et al., 2015). Concentrations above 4.0 g/L was shown to cause cell death (Vargai et al., 2018). Various potential targets have been proposed in the literature to account for the mechanism by which 2-PE exerts its toxicity. Among others, increasing membrane fluidization (Ingram and Buttke, 1984), ion leakage (Seward et al., 1996), and consequently, reduction of amino acids and glucose uptake (Lester, 1965) were the most frequently considered. It was also reported that 2-PE can induce respiration deficiency by increasing mitochondrial membrane permeability in the yeast S. cerevisiae (Wilkie and Maroudas, 1969). There are also some reports on the inhibitory effects of 2-PE on DNA synthesis (Bostock, 1970), RNA synthesis and glucose incorporation (Burns and Wang, 1968).
To increase the efficiency of microbial 2-PE production, microorganisms that can tolerate high levels of 2-PE need to be developed. For the improvement of phenotypes with an unknown molecular basis, evolutionary engineering, also known as adaptive laboratory evolution (ALE), is a highly promising approach (Mavrommati et al., 2022). It allows the selection of the desired phenotype by following the rules of natural evolution, without preliminary information. It starts with a random mutagenesis step that increases the starting population’s genetic diversity and continues with exposure to selective pressure for obtaining the desired phenotypes (Çakar et al., 2012). In this work, we used this in vivo evolutionary engineering strategy that enabled S. cerevisiae to adapt to 3.4 g/L 2-PE, where the 2-PE-tolerance of the evolved strain became about 3 times higher than the original strain. We then characterized this adapted strain at the genomic, metabolic, and transcriptomic levels. Overall, major findings of this work were that the evolved strain acquired a physiological state reflecting the typical environmental stress response (ESR). This stressful state of the 2-PE-adapted strain could be very likely the result of a mutation in the HOG1 gene leading to a hyperactive MAPKinase that in turn activates the Msn2/4p transcription factor. In addition, the extraordinary transcriptional activation of ALD3 gene encoding a NAD+ -dependent aldehyde dehydrogenase known to oxidize 2-phenylacetaldehyde into the less toxic 2-phenylacetate (2-PEA) may be the direct mechanism to reduce the toxicity effect of 2-PE in yeast.
2. Materials and methods
2.1. Strain, media, and growth conditions
The prototrophic haploid Saccharomyces cerevisiae CEN.PK 113.7D (MATa, MAL2-8c, SUC2) (Entian and Kötter, 2007) was used as the reference strain throughout the study. Ethyl methanesulfonate (EMS) mutagenesis was applied to the reference strain to generate a genetically diverse initial population, as described previously (Lawrence, 1991; Çakar et al., 2009). EMS mutagenesis was carried out to allow 10% of the initial population to survive.
Yeast peptone dextrose (YPD) medium containing 10 g/L yeast extract, 20 g/L dextrose, 10 g/L peptone; and yeast minimal medium (YMM) containing 20 g/L dextrose and 6.7 g/L yeast nitrogen base without amino acids were used for cultivation. Agar was added to a final concentration of 20 g/L when solid media were prepared. Cultivations were done at 30°C, 150 rpm in 50-mL culture tubes with 10 ml culture volume unless otherwise stated. Optical density measurements at 600 nm (OD600) were used to monitor growth by using a spectrophotometer (Shimadzu UV-1700). Cultures were stored at −80°C as 2 ml YMM culture aliquots containing 30% (v/v) glycerol.
2.2. Selection of 2-phenylethanol-resistant strains by evolutionary engineering
The EMS-mutagenized culture was used as the initial population for the selection procedure. As an evolutionary engineering strategy, successive batch selection was performed by gradually increasing the concentration of 2-phenylethanol (2-PE) from 1.5 up to 3.4 g/L, as described below. The initial stress level of 1.5 g/L was chosen based on minimum inhibitory concentration (MIC) determination for 2-PE for both reference strain and the EMS-mutagenized initial population.
For selection experiments, first, the EMS-mutagenized culture was inoculated into 10 ml of YMM that contained 1.5 g/L 2-PE. The culture was then incubated at 30°C, 150 rpm, for 24 h, centrifuged at 10,000 g for 5 min using a benchtop centrifuge (Eppendorf, Centrifuge 5424, Germany), and washed twice with fresh YMM. The culture was then inoculated into fresh YMM with a gradually increased 2-PE concentration at an initial OD600 of 0.3 (approximately 3×10⁶ cells/mL) in 10 ml culture volume. The first culture grown in the presence of 1.5 g/L 2-PE was named the first passage. The second passage was obtained by transferring the first passage to a fresh YMM containing 1.6 g/L 2-PE to an initial OD600 of 0.3. For each passage, the cultures were also incubated under non-stress (control) conditions (YMM only). These reference cultures were used to calculate the survival rates for each passage. At each passage, 2-PE concentrations were gradually increased by 0.1 g/L until 2.8 g/L (passage no:14). At 2.8 g/L and higher 2-PE concentrations, the same 2-PE concentration was used for more than one passage before increasing the concentration by 0.1 g/L, until 3.4 g/L at the 56th passage, the final population of selection. The final population was plated on solid YMM upon serial dilution. Ten individual colonies were randomly picked from plates for further analyses.
2.3. Quantification of 2-PE tolerance and cross-resistances to various stresses
2-PE-resistance of individual mutants was quantitatively estimated using the high-throughput, most-probable number (MPN) method, as described previously (Russek and Colwell, 1983; Çakar et al., 2005). Briefly, serial dilutions in the range of 10−1 to 10−8 were made in 96-well plates that contained 180 μL YMM (control) and 3 g/L 2-PE in 180 μL YMM (stress condition), as five replicates. After 72 h of incubation at 30°C, viable cell numbers were estimated using MPN tables (Lindquist, 2016). 2-PE-resistance was expressed as “survival rate”, and it was calculated by dividing the number of viable cells that survived 3 g/L 2-PE with respect to the number of viable cells in the absence of 2-PE (Çakar et al., 2009; Küçükgöze et al., 2013).
Resistance to 2-PE and other stress conditions were estimated using spot assay based on serial dilutions on solid culture media (Küçükgöze et al., 2013). Briefly, overnight precultures grown at 30°C in 10 mL YMM until their late logarithmic phase of growth were concentrated to 4 OD600 units by centrifugation at 10,000 g for 1 min and resuspended in 50 μL sterile YMM. They were then serially diluted between 10−1 to 10−5 and 5 μL of each dilution were spotted on YMM plates (control) and YMM plates containing various stress factors: potassium acetate, boron, cobalt, copper, nickel, ethanol, hydrogen peroxide, 2-PE, NaCl, sorbitol, phenylacetaldehyde, and phenylacetate. The stressors were added at concentrations indicated in Figure 1 and Supplementary Figure S2. Plates were incubated at 30°C for 72 h.
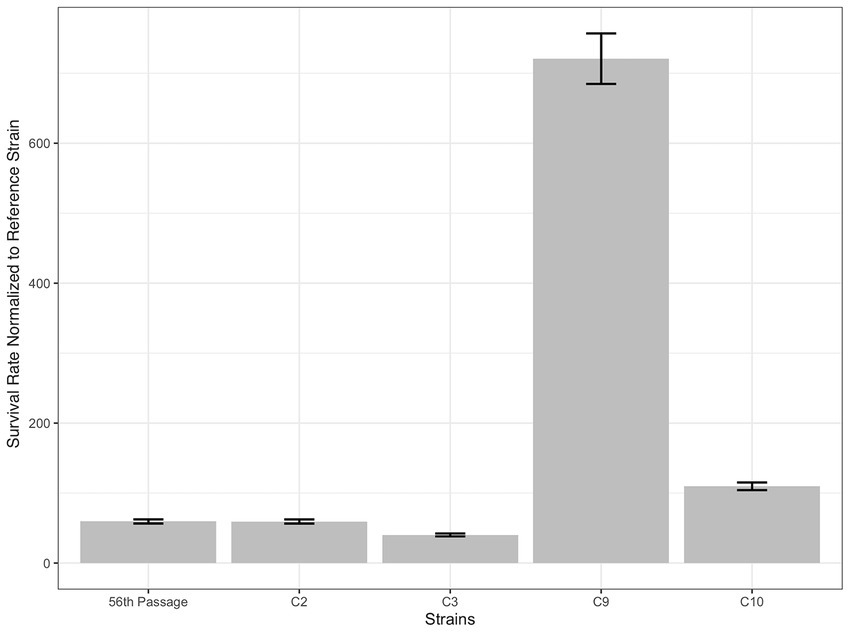
Figure 1. 2-phenylethanol (2-PE) resistance and cross-resistance test results of the 2-PE-resistant evolved strain C9 and the reference strain (Ref) upon 2-PE (2.5 g/L and 3 g/L), boron (80 mM), cobalt (1 mM and 3 mM), NaCl (0.5 M), and phenylacetate (2 mM) stresses.
2.4. Whole-genome sequencing
For comparative whole-genome sequencing, the reference and evolved strain cultures were grown and collected as described previously (Sürmeli et al., 2019). For DNA extraction, a MasterPureTM DNA Purification Kit (Epicenter, San Diego, United States) was used, according to the manufacturer’s instructions. DNA concentration and purity was determined using NanoDrop 2000 UV–Vis spectrophotometer (Thermo Fisher Scientific, Waltham, MA, United States) and QubitR Fluorometer 3.0 (ThermoFisher Scientific). The genomic DNA libraries were prepared from 100 ng isolated DNA using Ion Xpress Plus Fragment Library Kit (ThermoFisher) and Ion 540™ Chip Kit according to the manufacturer’s protocol. The whole-genome sequencing was carried out on Ion S5 Next-Generation Sequencing Platform (ThermoFisher) and coupled automated library prep platform Ion ChefTM (ThermoFisher). Raw data were deposited in the NCBI Sequence Read Archive (SRA) database under BioProject PRJNA601278.
The quality of the raw data was evaluated by FastQC v.0.11.5 (Babraham Bioinformatics). Low-quality bases and remnant adapters were trimmed using Trimmomatic v.0.32 (Bolger et al., 2014). The reads of both reference and resistant strains were aligned to the previously assembled sequence of S. cerevisiae CEN.PK113-7D (GCA_000269885.1) (Nijkamp et al., 2012) using the Burrows-Wheeler aligner MEM v.0.7.1 (Li and Durbin, 2009). Mutations were called by using Genome Analysis Toolkit (GATK) v.3.8.0 (DePristo et al., 2011) and were manually inspected with GenomeBrowse v2.1.2 (GoldenHelix). The variants with low quality and common in both reference and the evolved strains were filtered out using in-house R scripts. Unique mutations of the evolved strain were annotated using Variant Effect Predictor v.90 using the latest gene build S. cerevisiae CEN.PK113-7D, ASM26988v1.
2.5. Whole-genome transcriptomic analysis
For comparative whole-genome transcriptomic analysis of the selected 2-PE-resistant evolved strain and the reference strain, Agilent yeast microarray systems were used, as described previously (Küçükgöze et al., 2013). Briefly, three replicates of each culture were grown in 100 ml YMM, using 500 ml flasks, at 30°C and 150 rpm. Cells at about 107 cells/mL (~1 OD600) were used for total RNA isolation by RNeasy Mini Kit (Qiagen). RNA concentrations were determined by using a microvolume UV–Vis spectrophotometer (NanoDrop 2000). The RNA integrity numbers (RIN) were determined using Agilent Bioanalyzer 2100 and the relevant RNA 6000 Nano Assay Kit, according to the instructions of the manufacturer. RIN values of all RNA samples included in the transcriptomic analysis were higher than 8.
Internal controls were provided by Agilent One-Color RNA Spike-In Kit. cRNA samples were labeled with cyanine 3 (Cy3), and purified using Absolutely RNA Nanoprep Kit (Agilent). Hybridization of the samples on microarray slides was done at 65°C for 17 h, using Microarray Hybridization Chamber Kit (Agilent). Following washing steps, the microarray slides were scanned, and the data were analyzed by using Agilent Feature Extraction Software (Version 10.7) and GeneSpring GX Data Analysis Software (Version 12.0). Student’s t-test and Benjamini and Hochberg’s p value correction and false discovery rate (FDR) (Benjamini and Hochberg, 1995) were used were used for reliability assessment of gene expression data. For significantly different gene expression analysis, corrected p values <0.05 were considered. Additionally, genes with two-fold or higher expression changes (increase and decrease) and a p value of less than or equal to 0.01 were considered for cluster analysis. For all samples, the microarray experiment was performed in triplicate, with three independent cultures. FunSpec online software (Robinson et al., 2002) and FunCat database1 (Ruepp et al., 2004) were used for data classification into clusters and functional categories. To compare the gene expression data with Environmental Stress Response (ESR)-induced and ESR-repressed gene sets in yeast, “Yeast Growth Rate Homepage”2 (Brauer et al., 2008) was used. Pathway enrichment analyses were performed using the Limma package in R/Bioconductor (Ritchie et al., 2015) based on the Kyoto Encyclopedia of Genes and Genomes (KEGG) pathway database. This work is fully MIAME-compliant and the complete microarray data have been deposited at GEO repository. The accession number is GSE59353 at.3
2.6. Physiological analyses
The physiological properties of the evolved strain and the reference strain were determined by obtaining their growth and metabolite profiles. All physiological analyses were performed under both control (YMM) and stress (YMM + 3 g/L 2-PE) conditions, at 30°C and 150 rpm. Initially, both strains were incubated overnight in 10 ml YPD and then precultured overnight in 10 mL YMM for 24 h, using 50 mL-culture tubes. The cultures were inoculated into 50 mL control (YMM) and stress (YMM + 3 g/L 2-PE) medium in 250 mL-flasks to an initial OD600 of 0.2 (approximately 2×10⁶ cells/mL). One milli liter-samples were taken from both cultures at one-hour intervals. These samples were used in OD600 measurements for cell growth profiling and for metabolite measurements, in triplicates. For metabolite measurements, 1.5 mL-culture samples were centrifuged at 15,000 g for 5 min, and the supernatants were filtered using 0.22 μm filters. The filtered supernatants were used for metabolite measurements, including glucose, ethanol, glycerol and acetate, using HPLC (Shimadzu Series 10A HPLC, Shimadzu Co., Kyoto, Japan) at 60°C. As the mobile phase, 5 mM H2SO4 was used at a flow rate of 0.6 ml/min, as described previously (Küçükgöze et al., 2013). RID-10A refractive-index detector and an Aminex© HPX-87H ion exclusion column (300 mm × 7.8 mm, Bio-Rad Laboratories, CA, United States) were also used for the measurements. For final cell dry weight (CDW) analysis, 2 ml-culture samples were centrifuged in preweighed microfuge tubes, centrifuged at 15,000 g for 5 min, the supernatants were discarded and the pellets were dried at 80°C for 12 h. The tubes were then cooled in a desiccator for 90 min and reweighed.
Trehalose and glycogen contents were determined as described previously (Küçükgöze et al., 2013), based on an enzymatic method (Parrou and François, 1997).
Lyticase sensitivity assay was performed according to Kuranda et al. (2006) with slight modifications, as described previously (Kocaefe-Özşen et al., 2022). Briefly, overnight cultures of the evolved and the reference strain, grown both in the presence and absence (control) of 3 g/L 2-PE stress were harvested upon centrifugation at 10,000 g for 10 min. Cell pellets were dissolved in 10 ml of 10 mM Tris/HCl buffer (pH 7.4), including 40 mM β-mercaptoethanol. Upon incubation at 25°C for 30 min, 2 U/ml lyticase was added and the samples were incubated at 30°C and agitated at 150 rpm. OD600 measurements were taken every 20 min. Lyticase sensitivity was monitored by measuring the decrease in OD600, and lyticase resistance was calculated by dividing the measured OD600 values by the initial OD600 value and multiplying the result by 100. The experiments were performed as three biological repeats.
2.7. Statistical analysis
At least three biological repeats were made for all experiments. The R software “stats” package (R Core Team, 2020) was used for data analyses. To calculate statistical significance, a two-tailed, unpaired Student’s t-test was used, and p < 0.05 was considered as statistically significant, except for microarray and whole genome sequencing analyses.
3. Results
3.1. Experimental conditions for evolutionary engineering of 2-PE resistance
Before starting with the selection experiments, the 2-PE concentration that reduced 50% of the growth of both the reference strain and the EMS-mutagenized initial population was determined as 1.5 g/L (see Supplementary Table S1). Therefore, this concentration of 2-PE was chosen as the initial stress level for selection by evolutionary engineering. The evolutionary engineering experiments were performed with the EMS-mutagenized initial population of the prototrophic S. cerevisiae strain CEN.PK113-7D, as described in the Materials and Methods section. Briefly, successive batch selection was applied in YMM with gradually increased 2-PE concentrations starting from 1.5 g/L up to 3.4 g/L, for 56 passages (about 224 generations). As the survival rate significantly decreased to less than 60% at the 56th passage corresponding to 3.4 g/L 2-PE stress, the evolutionary selection experiment was stopped at that passage, named as the final population of selection. This final population was plated on solid YMM to pick 10 individual colonies randomly for further characterization.
3.2. Stress resistance characteristics of selected evolved strains
The reference strain, the final population and the ten individual colonies (C1 to C10), were tested for their 2-PE resistance by spot assay on YMM plates. It was found that C2, C3, C5, C9, and C10 were able to grow in the presence of 3 g/L 2-PE (Supplementary Figure S1), while the reference strain could barely grow at this 2-PE concentration. At 5 g/L of 2-PE on the YMM plates, neither the final population nor the isolated clones were able to grow (data not shown). Additional quantitative estimation of 2-PE resistance of the reference strain, final population and individual clones C2, C3, C9 and C10 was done using the MPN method by growing them in microtiter plates in YMM containing 3 g/L 2-PE for 72 h at 30°C. As shown in Figure 2, the survival rate of the final selection population was approximately 59 times higher than that of the reference strain. It is also shown that the survival rate of the isolated clones was 40 to more than 700 times higher than that of the reference strain, which illustrates a large heterogeneity in the resistance of the final population to 2-PE and thus indicates that the acquisition of this resistance is largely pleiotropic. The evolved strain C9 that exhibited the highest survival rate was therefore retained and further analyzed for the genetic stability of this phenotypic trait by performing five successive batch growth cycles (about 20 generations) in a rich YPD medium in the absence of 2-PE stress, showing no loss of resistance levels after this successive cycle (data not shown).
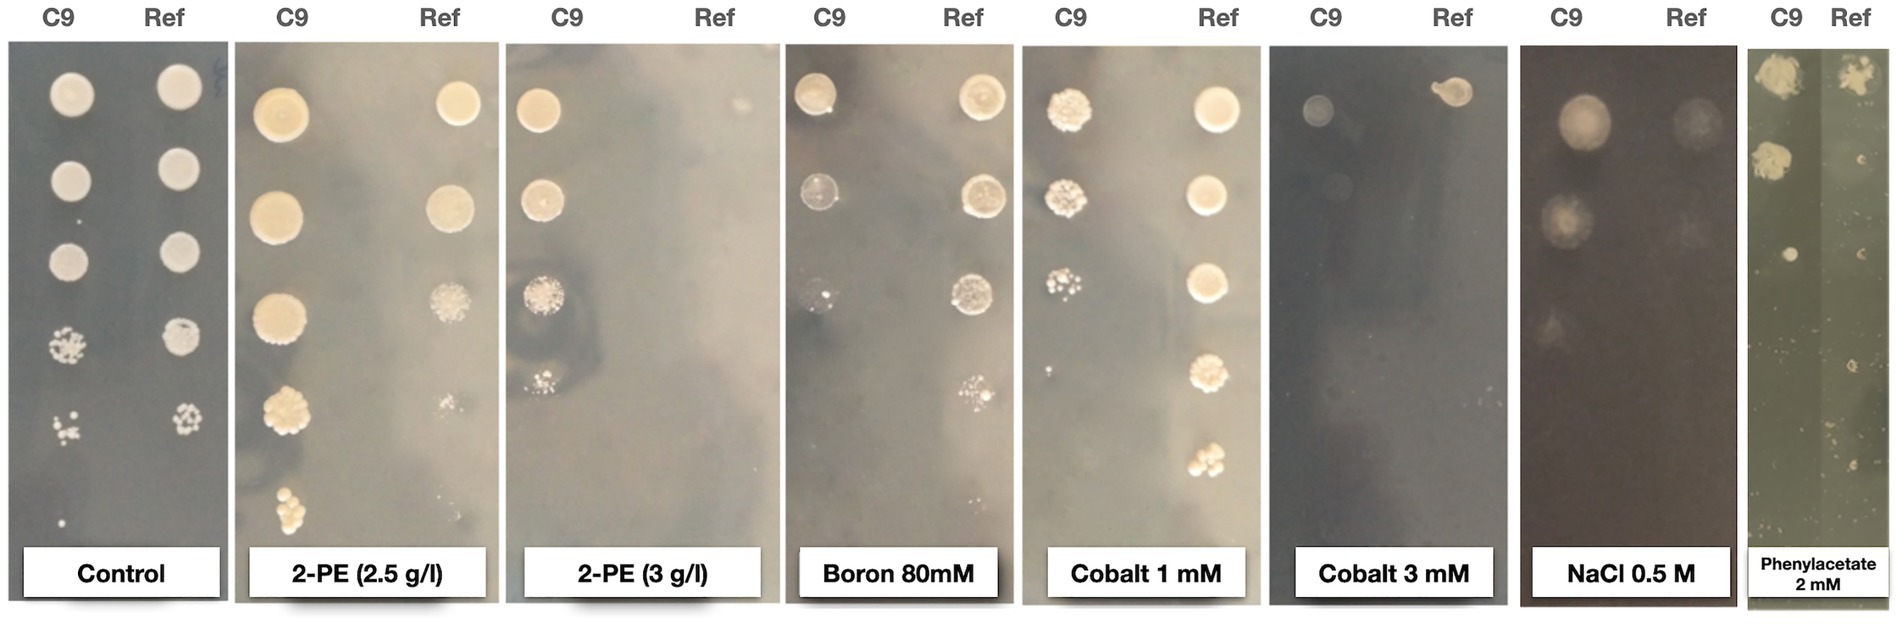
Figure 2. Survival rates of the final population of selection (56th passage), and the individual evolved strains C2, C3, C9, and C10, selected from the final population, in the presence of 3 g/L 2-phenylethanol stress. The survival rates are shown as fold of the reference strain’s survival rate.
When yeast cells gain resistance against a certain stress type, they may also become resistant against other stress types (Lewis et al., 1995; Hohmann, 2002). For this reason, we tested the 2-PE-resistant strain C9 and the reference strain (as control) for their potential cross-resistance against various stress types. Cross-resistance to other stressors was carried out by spot assay, revealing that the tolerance of C9 to cobalt and boron was slightly lower than that of the reference strain. In contrast, the C9 strain exhibited a slightly higher tolerance to NaCl and a significantly better resistance to 2- phenylacetate (Figure 1). The observed cross-resistance of the evolved strain against 2-phenylacetate may be associated with a 2-PE resistance mechanism that involves conversion of 2-phenylethanol into phenylacetaldehyde and phenylacetate. Interestingly, sensitivity to phenylacetaldehyde was similar for C9 and the reference as well as for ethanol, acetate, sorbitol, copper, nickel, and H2O2 (Supplementary Figure S2).
3.3. Physiological analyses
Growth profiles on a 2% glucose synthetic medium showed that the maximum specific growth rate of the reference strain (0.42 h−1) was significantly higher than that of C9 (0.32 h−1). In the presence of 3 g/L 2-PE stress, the evolved strain C9 was, in agreement with our plates data (Supplementary Figure S1), growing better than the reference strain, exhibiting a maximum specific growth rate of 0.16 h−1, as compared to 0.13 h−1 for the reference strain (Figure 3).
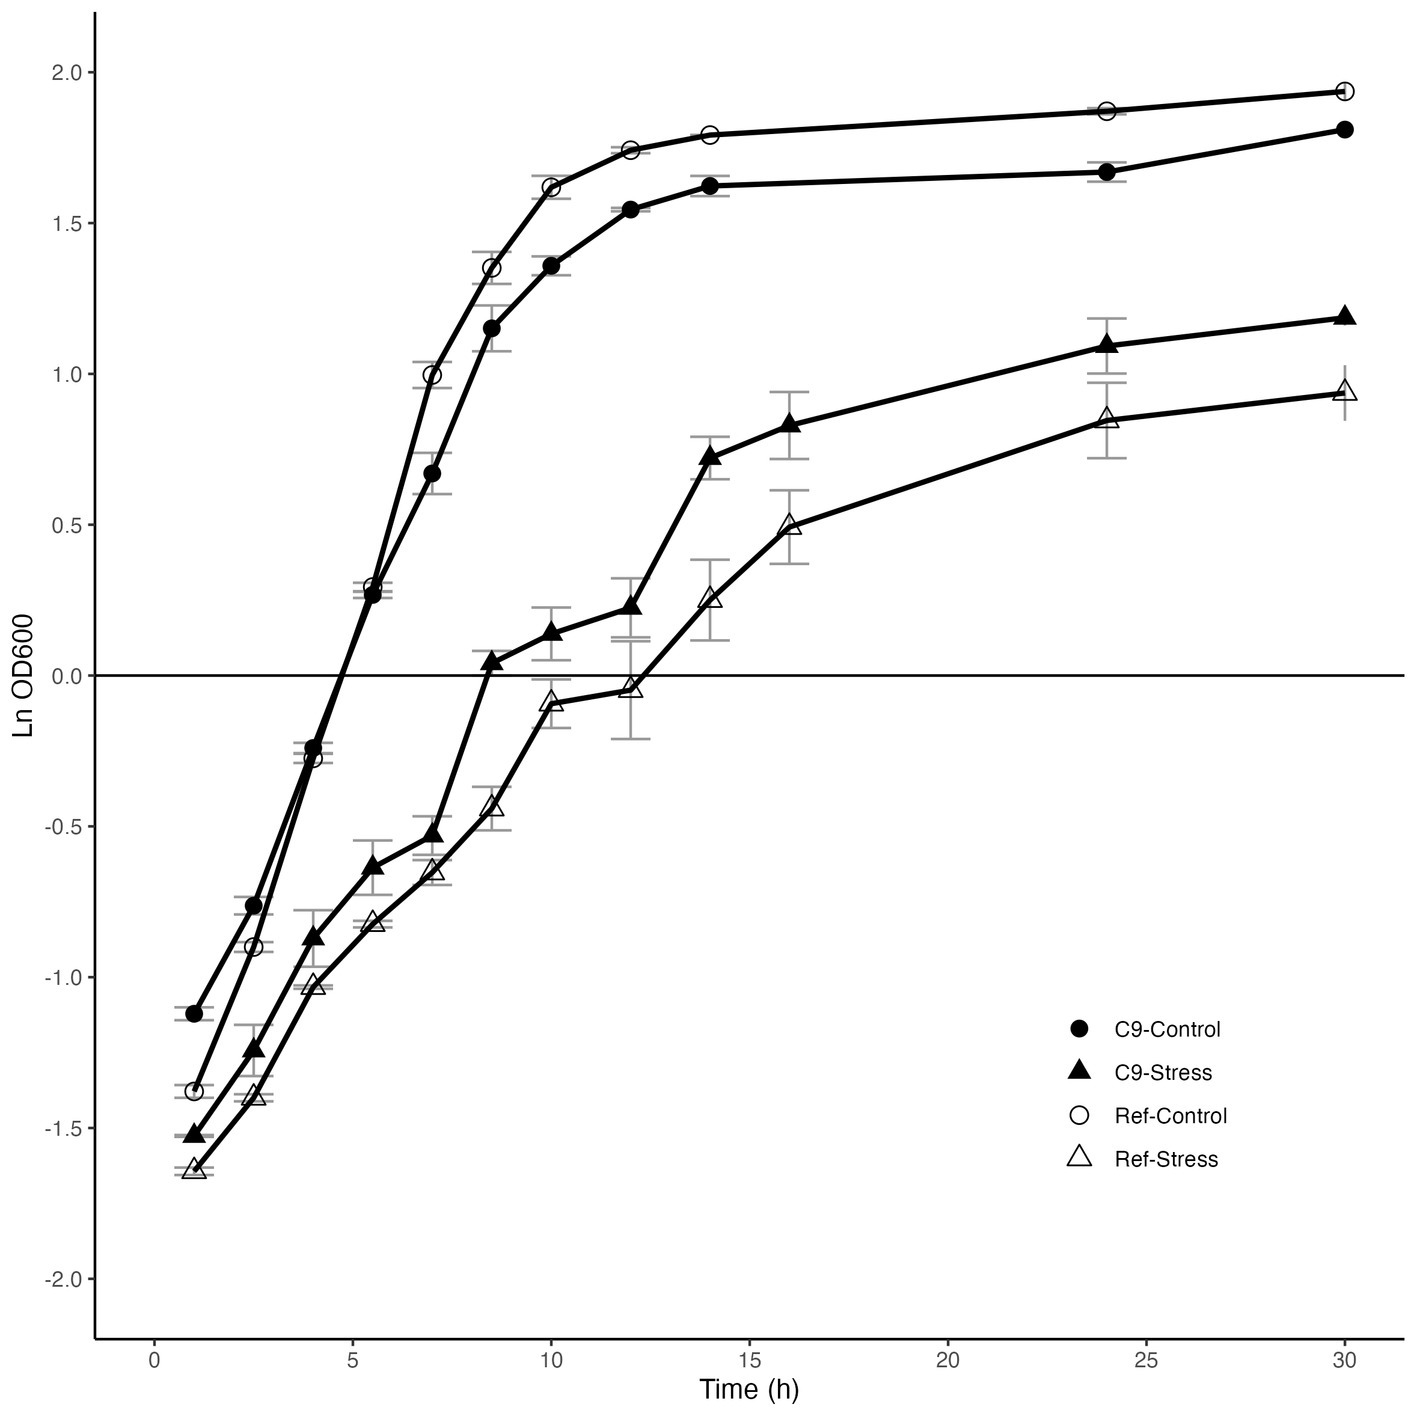
Figure 3. Growth behavior of the reference strain (Ref) and the evolved strain C9 in the absence and presence of 3 g/L 2-phenylethanol stress.
The metabolite profiles of C9 and the reference strain are presented in Figure 4. Both strains showed similar characteristics for glucose consumption and ethanol production in the absence and presence of 3 g/L of 2-PE stress. At the end of the cultivation (30th hour), glucose was depleted in the culture with both strains, while the produced ethanol concentration reached 8 g/L in the absence and 3 g/L in the presence of 3 g/L of 2-PE. This reduced production of ethanol suggested that the presence of 2-PE has modified the fermentation profile of yeast, leading to other by-products. Accordingly, the production of other fermentation by-products acetate and glycerol at the end of the glucose consumption significantly increased in C9 up to about 6-fold of the reference strain under control conditions. In the presence of 3 g/L 2-PE stress, the levels of these exometabolites were still significantly higher in C9, compared to the reference strain (Figure 4).
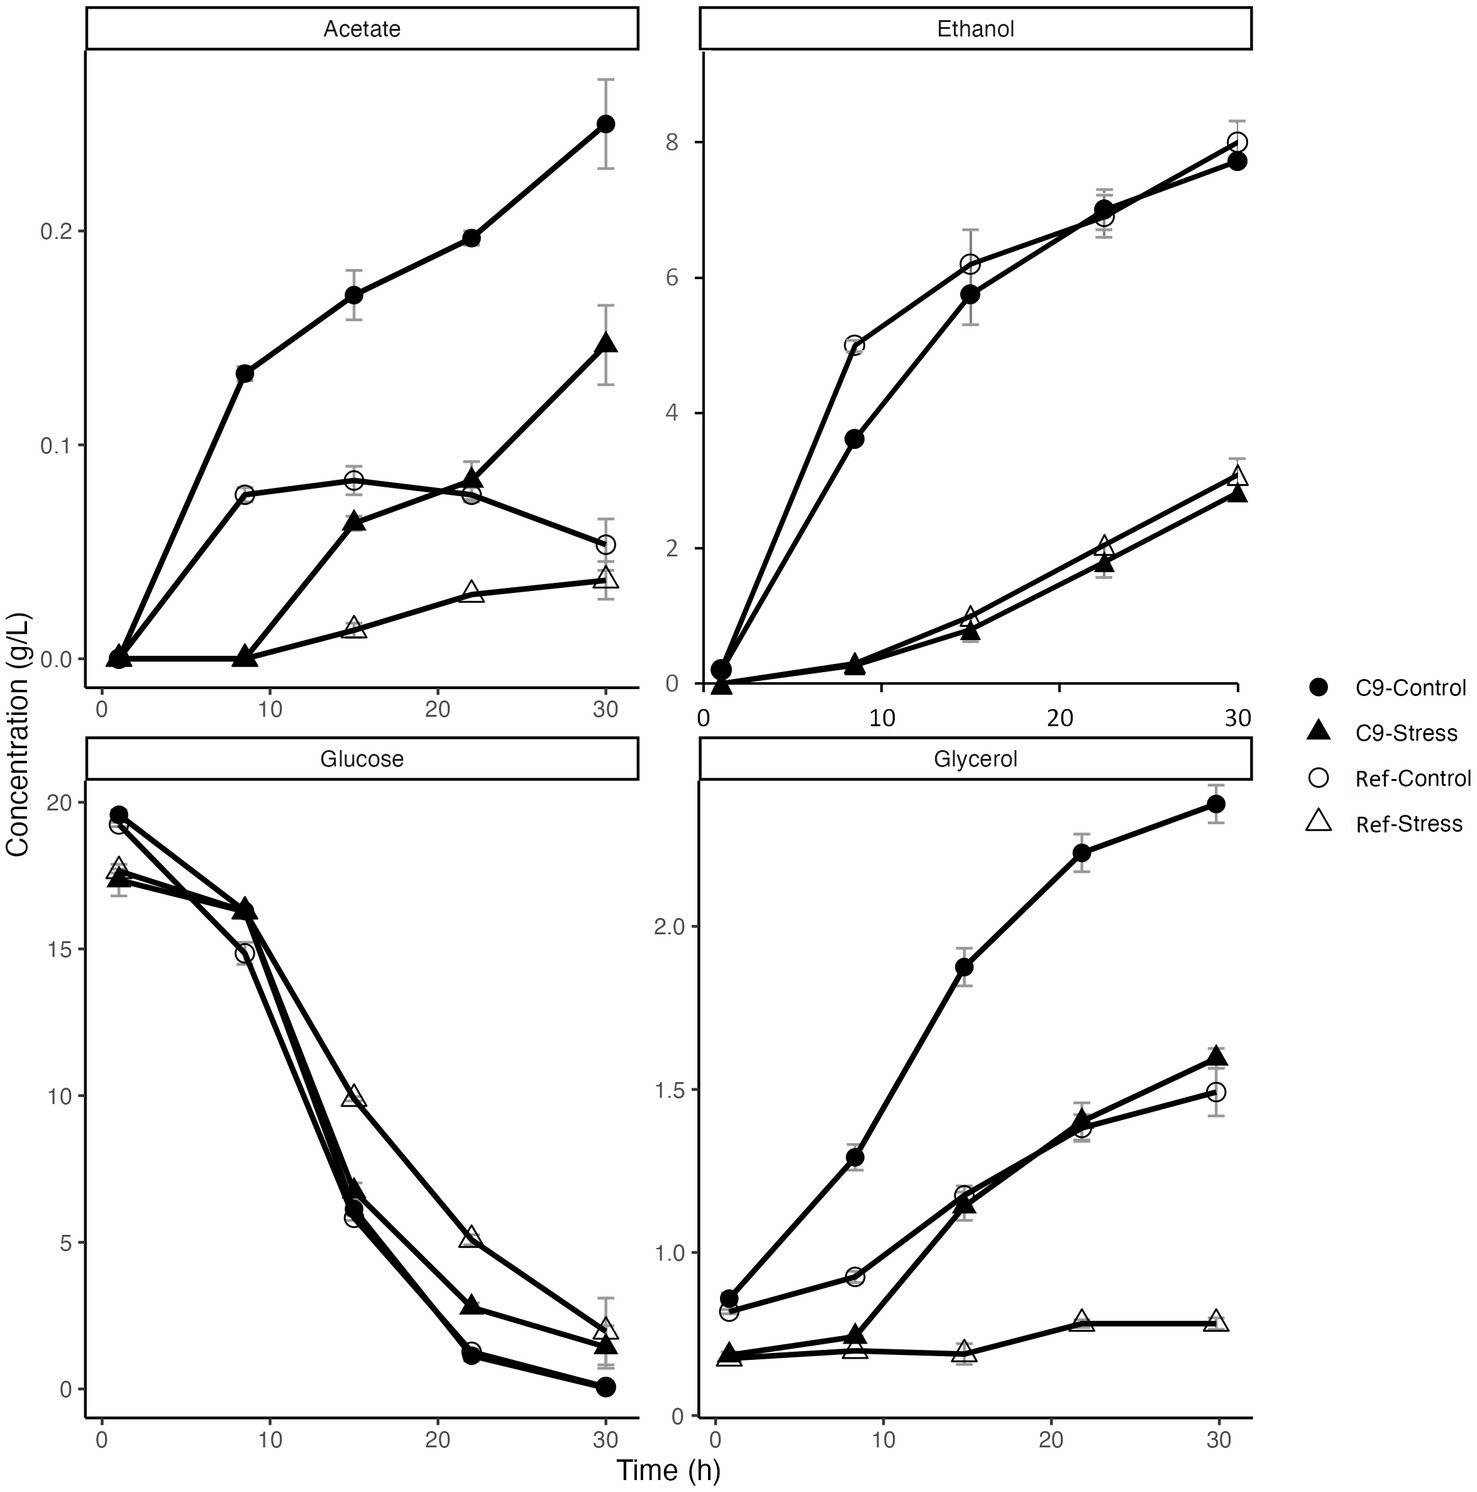
Figure 4. Metabolite profiles of the reference strain (Ref) and the evolved strain C9 in the absence and presence of 3 g/L 2-phenylethanol stress.
Of note, the levels of glycerol in C9 strain cultivated with and without 3 g/L 3-PE reached 1.5 and 2.4 g/L, respectively, which is up to about 3-fold higher than the levels of glycerol measured during growth of the reference strain, under the same conditions. In addition, C9 contained 3 times more trehalose than the reference strain in the absence of 2-PE and this difference increased to 5-fold in the presence of 3 g/L 2-PE stress (Supplementary Figure S3). On the other hand, the glycogen content of both strains was not significantly different from each other both in the absence and presence of 2-PE (Supplementary Figure S4). In previous studies dedicated to evolve yeasts to become resistant to either caffeine (Sürmeli et al., 2019), iron (Balaban et al., 2020), silver (Terzioğlu et al., 2020), or oxidative stress (Kocaefe-Özşen et al., 2022), we reported a relationship between resistance to these stresses and cell wall remodeling. Therefore, we also examined whether the resistance to 2-PE entailed some cell wall remodeling by a treatment of the strains with lyticase, a cell wall-degrading enzymatic cocktail (Kuranda et al., 2006). Our results revealed that the evolved strain had a significantly higher resistance against lyticase than the reference strain (Figure 5), indicating that some cell wall remodeling had occurred in response to 2-PE adaptation.
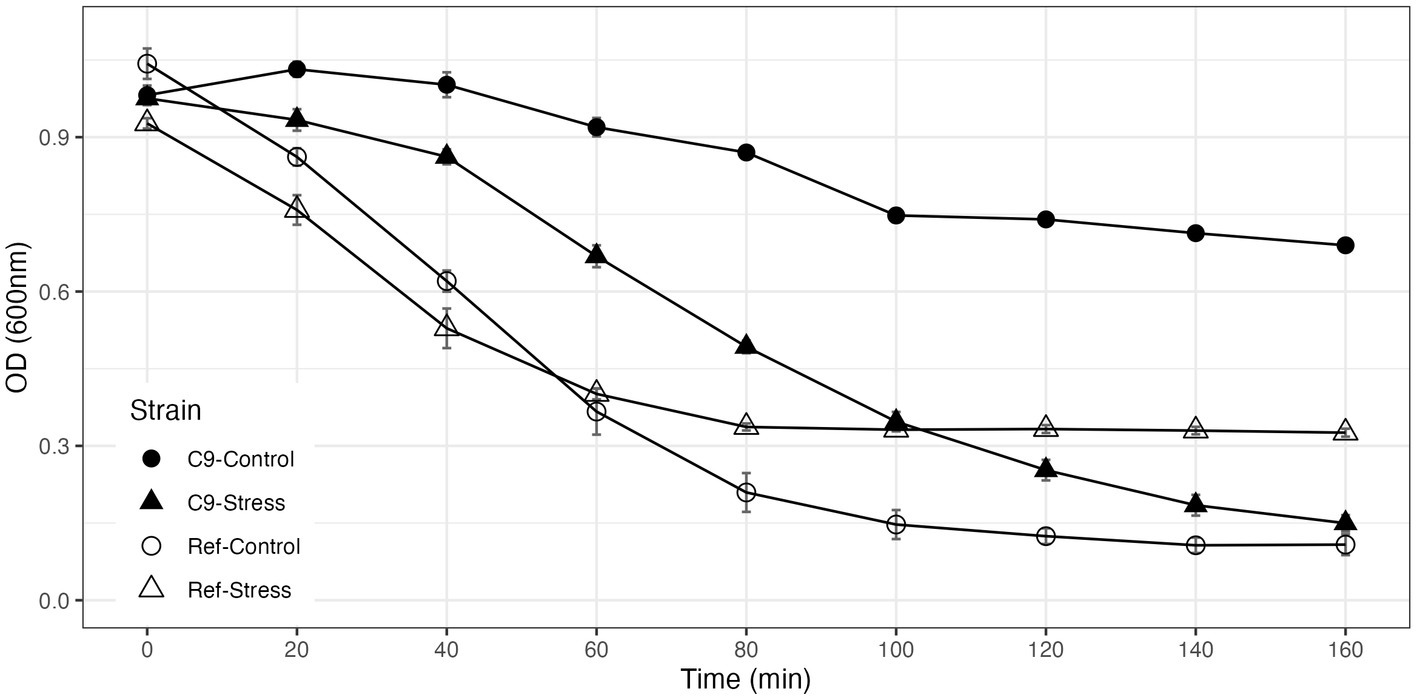
Figure 5. Lyticase sensitivity assay results of the reference strain (Ref) and the evolved strain under 3 g/L 2-phenylethanol stress and control conditions. Lyticase sensitivity was calculated as the percent decrease in lyticase resistance from 100% (the initial resistance value).
3.4. Comparative genome sequencing of the evolved strain to the reference strain
Whole-genome sequencing of the evolved and the reference strain was performed using next-generation shotgun sequencing with Illumina 2-channel sequencing by synthesis (SBS) technology. Upon sequencing, about 20 million reads with an average length of 270 bp were produced for the evolved C9 strain and the reference strain, which corresponded to 205x and 224x genome coverage, respectively. As we did not detect any indels in the genome sequence, we focused our analysis on SNPs and found 53 single nucleotide variations (SNVs) in the C9 genome, including 3 nonsense, 28 nonsynonymous, 7 synonymous, and 15 intergenic mutations. In line with the EMS mechanism of action, 50 of these mutations were transition mutations (C > T, G > A, or T > C) and the remaining three were transversion mutations (C > G or T > A). The list of the mutations detected only in coding sequence are reported in Table 1.
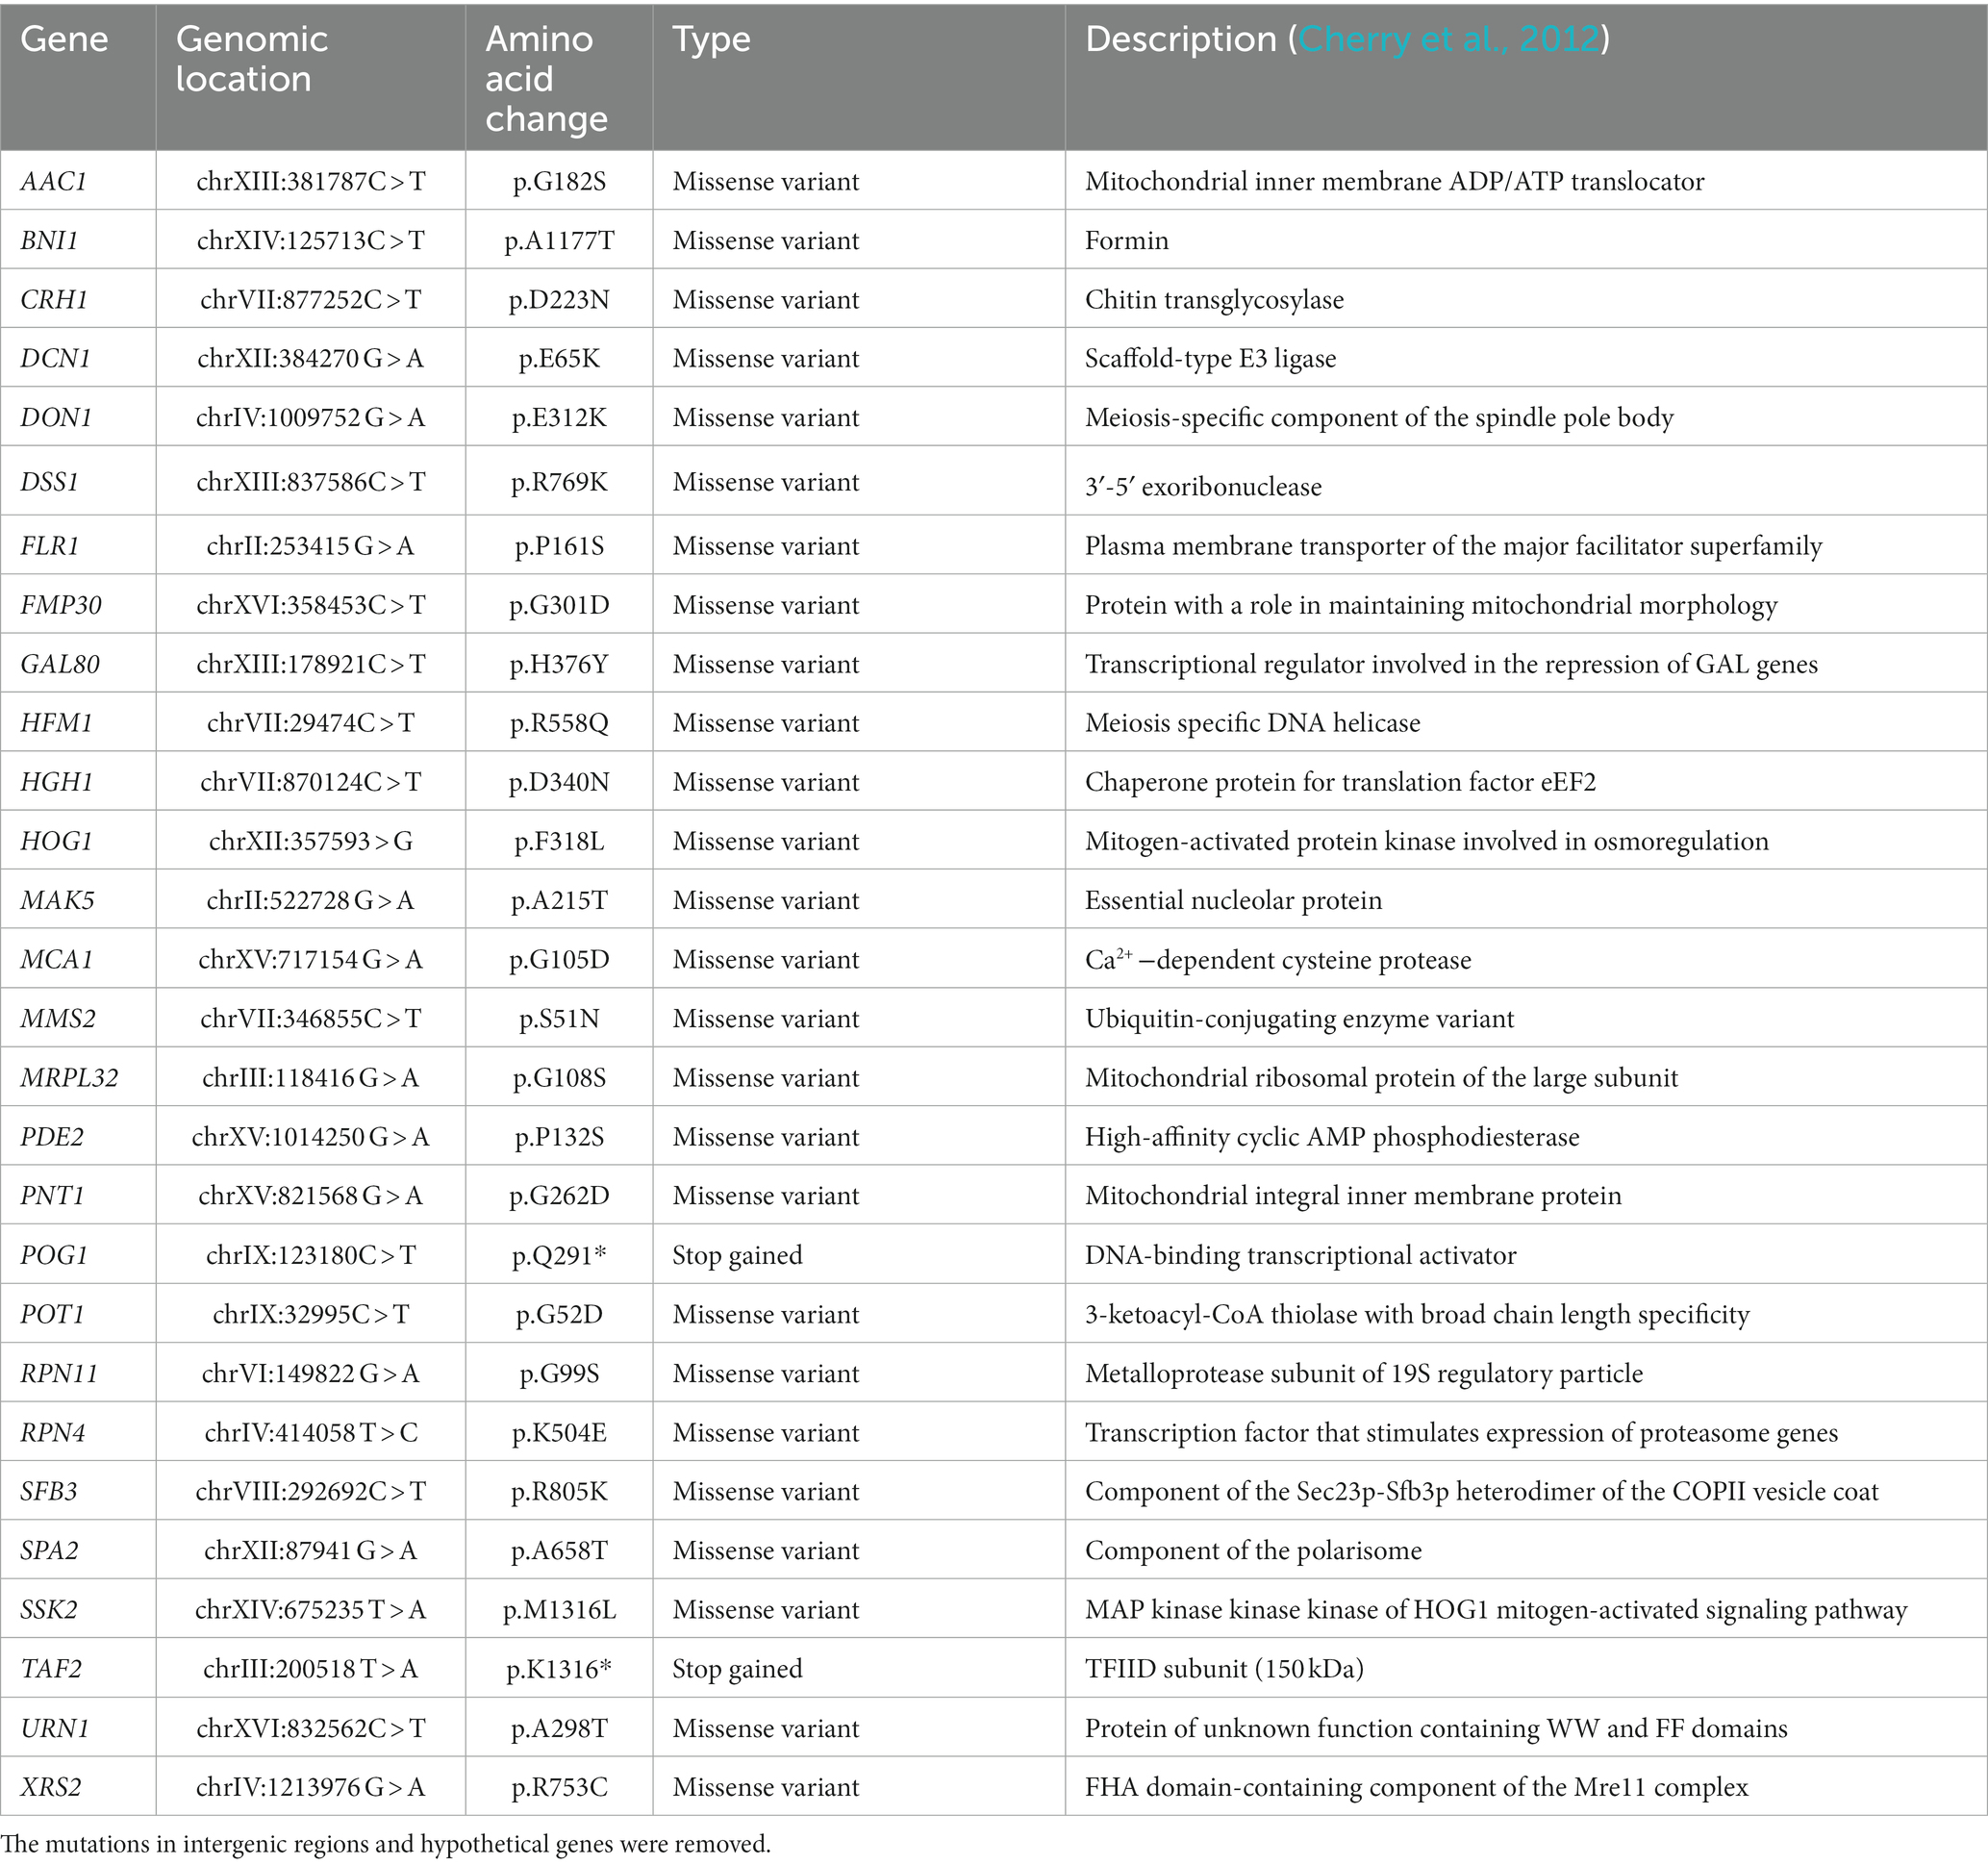
Table 1. The mutations detected in 2-phenylethanol-resistant mutant strain.
Two of them were in the HOG1 and SSK2 genes that belong to the mitogen-activated protein kinase involved in osmoregulation (Hohmann, 2002). The mutation in HOG1 gave rise to a variant that converts phenylalanine to leucine at position 318 (Hog1p.F318L) exhibiting a hyperactive Hog1p kinase since this mutation is localized in the phosphorylation lip of this protein kinase (Bell et al., 2001). In favor of the increased activity resulting from this HOG1 mutation, it was found that the evolved strain produced significantly higher amounts of glycerol (2.4 g/L) than the reference strain, in the absence of 2-PE (Figure 4). The mutation in the SSK2 gene, which encodes the MAP kinase kinase kinase, upstream of Hog1p is located in the vicinity of the active site of this kinase and thus may lead to its loss of activity. As the mutation of HOG1 gene already resulted in a hyperactive osmotic pathway, the Ssk2p.M1316L variant may be relevant for the alternative -HOG1-independent function of this kinase in mediating a calcium sensitivity response (Laviña et al., 2014) that we actually did not check in this study. Also relevant in regard to the physiological studies of the C9 strain was the finding of a mutation in CRH1 that encodes a chitin transglycosidase responsible for chitin to β-1,6 glucan cross-linking (Rodriguez-Pena et al., 2000). This mutation, which gave rise to the Crh1p.D223N variant, is located in the linker region between sugar-binding areas of this enzyme (Blanco et al., 2015). While the effect of this mutation on the protein structure and enzyme activity remains to be clarified, it is possible that the finding of a higher resistance of C9 cells to lyticase, which has β-1,3-glucan hydrolase and β-1,3-glucanase activity, resulted from the expression of this Crh1p.D223N variant. Additionally, two missense mutations were found in BNI1 (Bni1p.A1177T) and SPA2 (Spa2p.A658T) that encode components of the polarisome, which is required for the proper initiation of bud growth and the proper shape of the bud. The mutation in these two genes may contribute to protect cell from lysis during budding by some local cell wall remodeling machinery since this event is a highly vulnerable process and prone to cause lysis (Mishra et al., 2022).
Other unexpected mutations were also identified in the genome analysis of C9 strain. A missense mutation in GAL80 encoding the transcriptional regulator of GAL genes leading to the Gal80p.H376Y variant has never been mapped but this mutation is located in a C-terminal domain of Gal80p where other mutations have been shown to lose the interaction with Gal4p (Pilauri et al., 2005). The PDE2 gene encoding the high-affinity cyclic AMP phosphodiesterase (Sass et al., 1986) presents a mutation in the N-terminal domain of the protein (Pde2p.P132S) whose effect is not known, either. Other intriguing mutations were found such as in FLR1 (Flr1p.P161S) that encodes an efflux transporter of the major facilitator superfamily, and in MAK5 (Mak5p.A215T) that encodes a putative RNA helicase involved in pre-RNA processing and in large ribosomal subunit biogenesis. SNPs in genes that are implicated in DNA replication and repair (DON1, HFM1, XRS2) were also identified. Finally, mutations in genes of the ubiquitin-proteasome system, namely MMS2 (Mms2p.S51N) and RPN4 (Rpn4p.K504E) which, together with a mutation in MCA1 encoding a homolog to human caspase (Madeo et al., 2002), could indicate some deficiency in clearance of misfolded and aggregated proteins by proteasome in the 2-PE-adapted strain. Altogether, these mutations support the notion that the toxicity of 2-PE in yeast is complex, triggering genetic modifications that are not trivial at first glance but some of them are likely linked to protect cell from this toxic compound such as through activation of the HOG1-dependent pathway.
3.5. Comparative transcriptomic analysis of the evolved strain with the reference strain
To complement the genome sequencing of the 2-PE-adapted strain, we performed a comparative transcriptomic analysis of this evolved strain with the reference strain to infer potential genetic targets of 2-PE-induced toxicity. This transcriptomic analysis showed that about 30% of all genes in the genome of C9 strain was differentially expressed with about 1,000 genes (17%) upregulated and 800 genes (13%) downregulated when a two-fold change and adjusted p values <0.05 were used as criteria for differential gene expression. Gene clustering using the FunCat database (Figure 6) showed that metabolic energy (39%) and cell rescue and defense (22%) were the most enriched functional categories among upregulated genes, whereas protein synthesis (33%) as well as energy (32%) were the major functional categories identified in the downregulated genes. Many genes associated with ATP production were also upregulated in the evolved strain, according to KEGG pathway analysis of the Oxidative Phosphorylation Pathway (KEGG ID sce00190; Supplementary Figure S5). Genes encoding several subunits of membrane proteins were upregulated in C9, including the SDHC and SDHA subunits of succinate dehydrogenase, CYT1, COR1, and QCR7 subunits of cytochrome reductase, and COX1, COX2, COX3, COX4, and COX6A subunits of cytochrome c oxidase (Supplementary Figure S5). Furthermore, the alpha (ATP1), beta (ATP2), epsilon (ATP15), a (ATP6), and j (ATP18) subunits of ATP synthase were significantly upregulated (Supplementary Table S2), suggesting that the 2-PE resistance may involve ATP-related activities in the oxidative phosphorylation pathway.
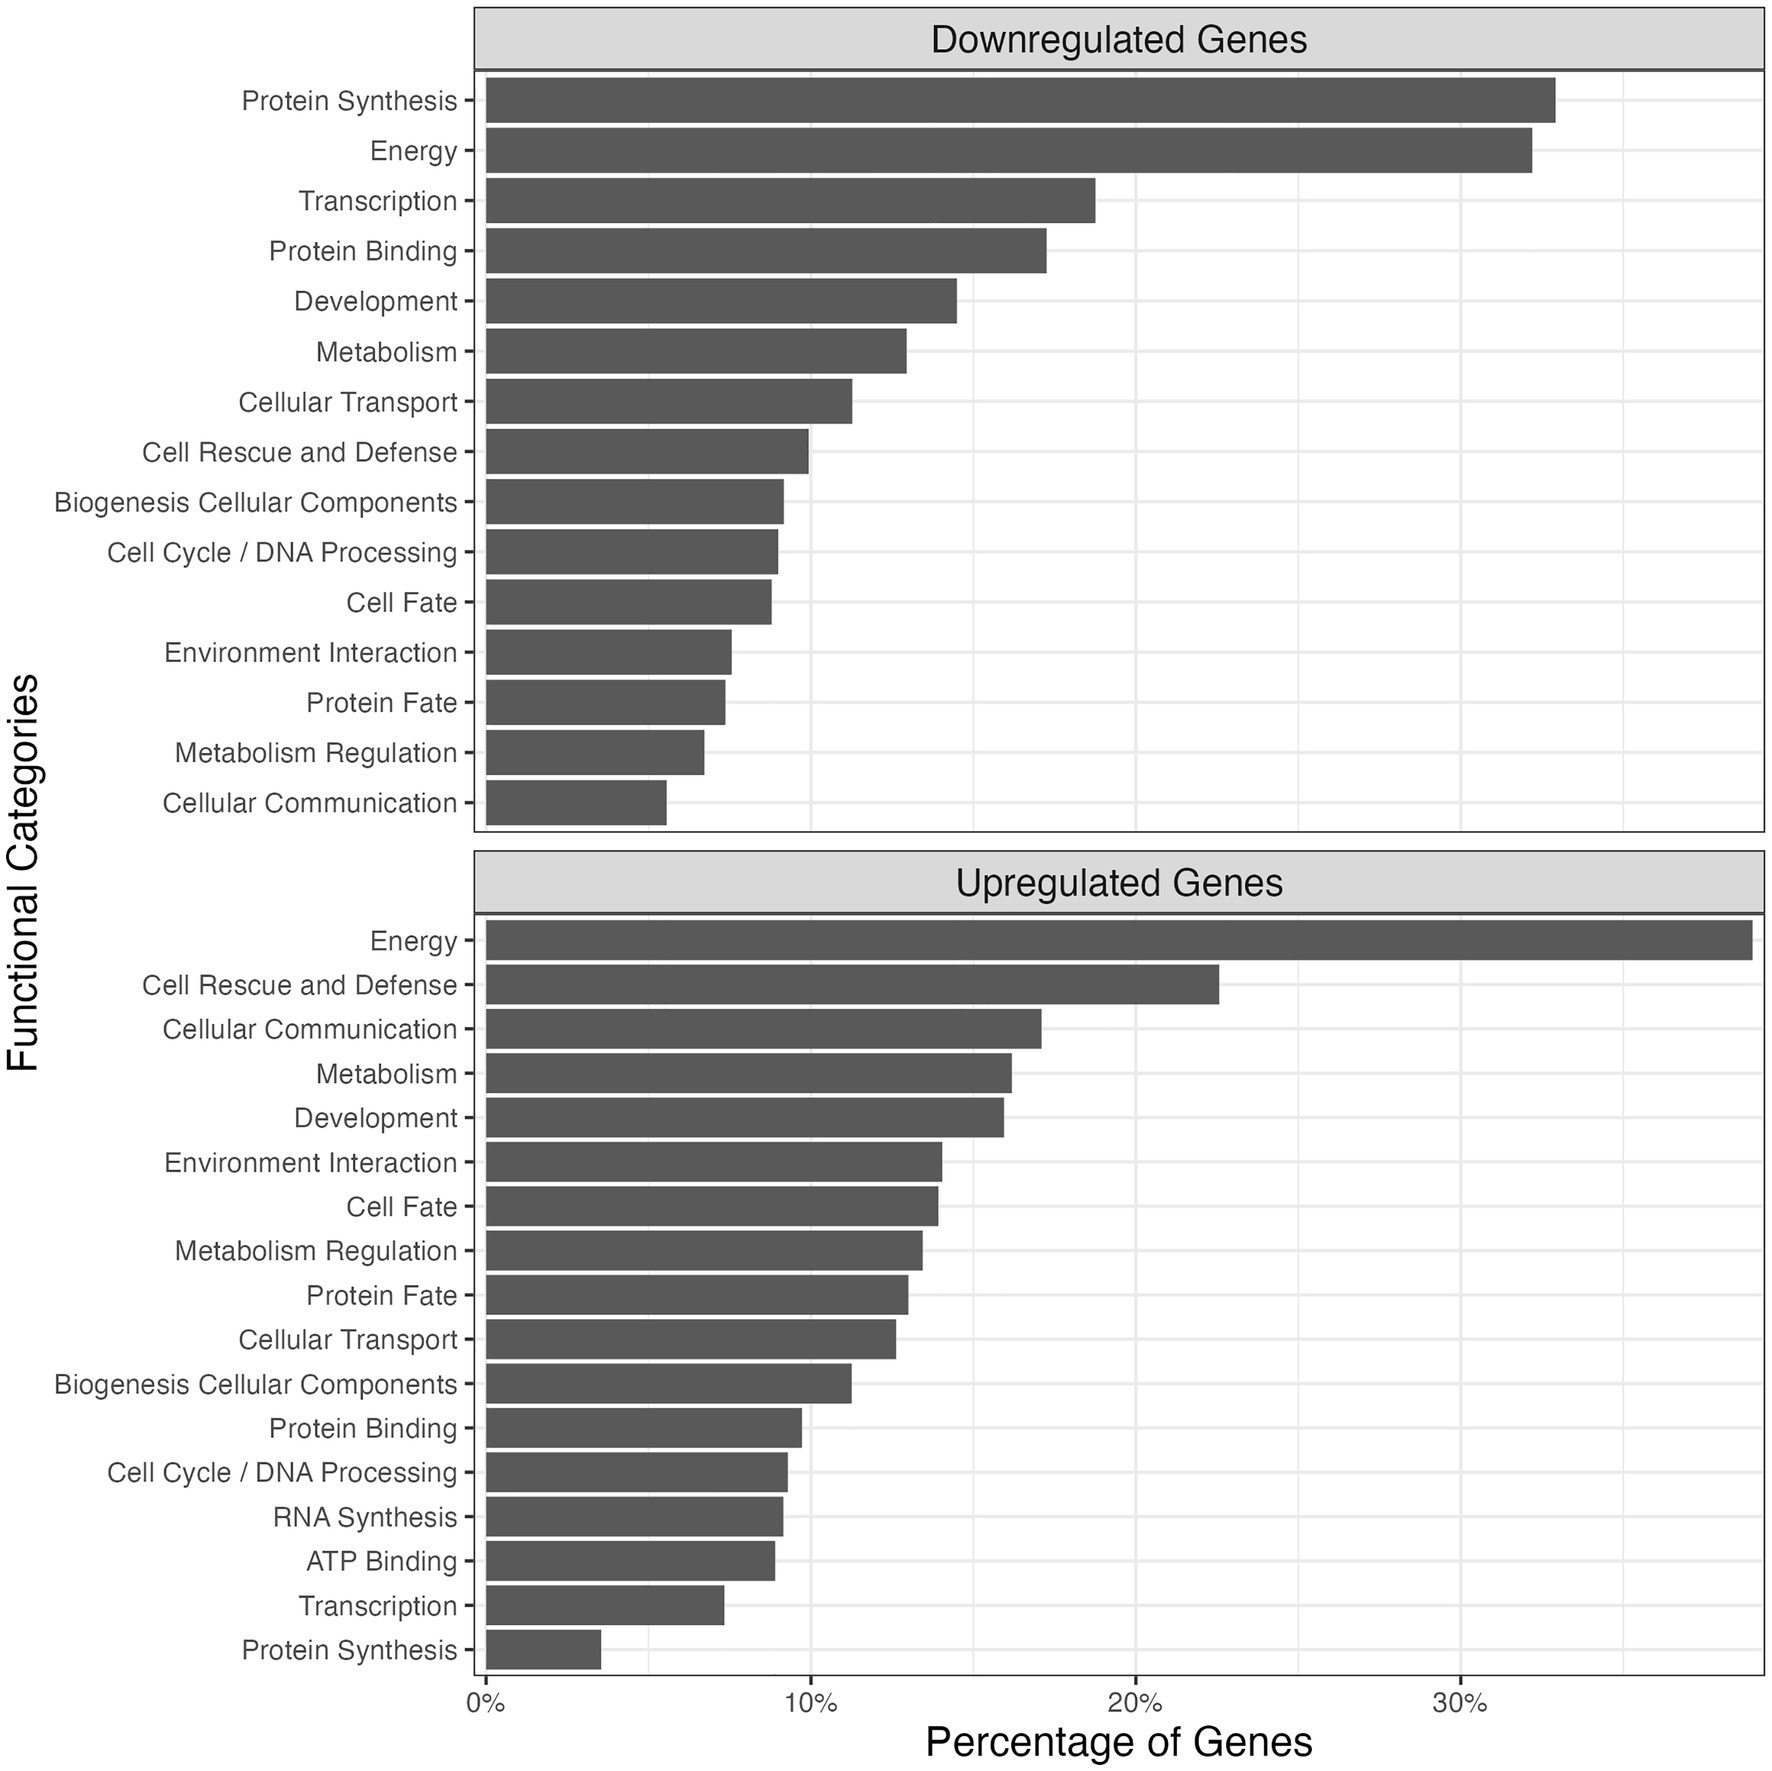
Figure 6. Functional categories and the corresponding percentages of the number of involved upregulated/downregulated genes of C9 among the total number of genes found in each functional category. The functional category annotation and gene clustering were performed using the FunCat database.
Gene ontology analysis of these transcriptomic data was also carried out using FUNspec.4 This analysis showed that the most enriched biological processes encompassing upregulated genes were response to stress, including the cellular response to oxidative stress and fungal cell wall organization (Table 2), whereas a large number of downregulated genes belonged to biological processes related to ribosomal biogenesis, translation and RNA processing (Table 3).
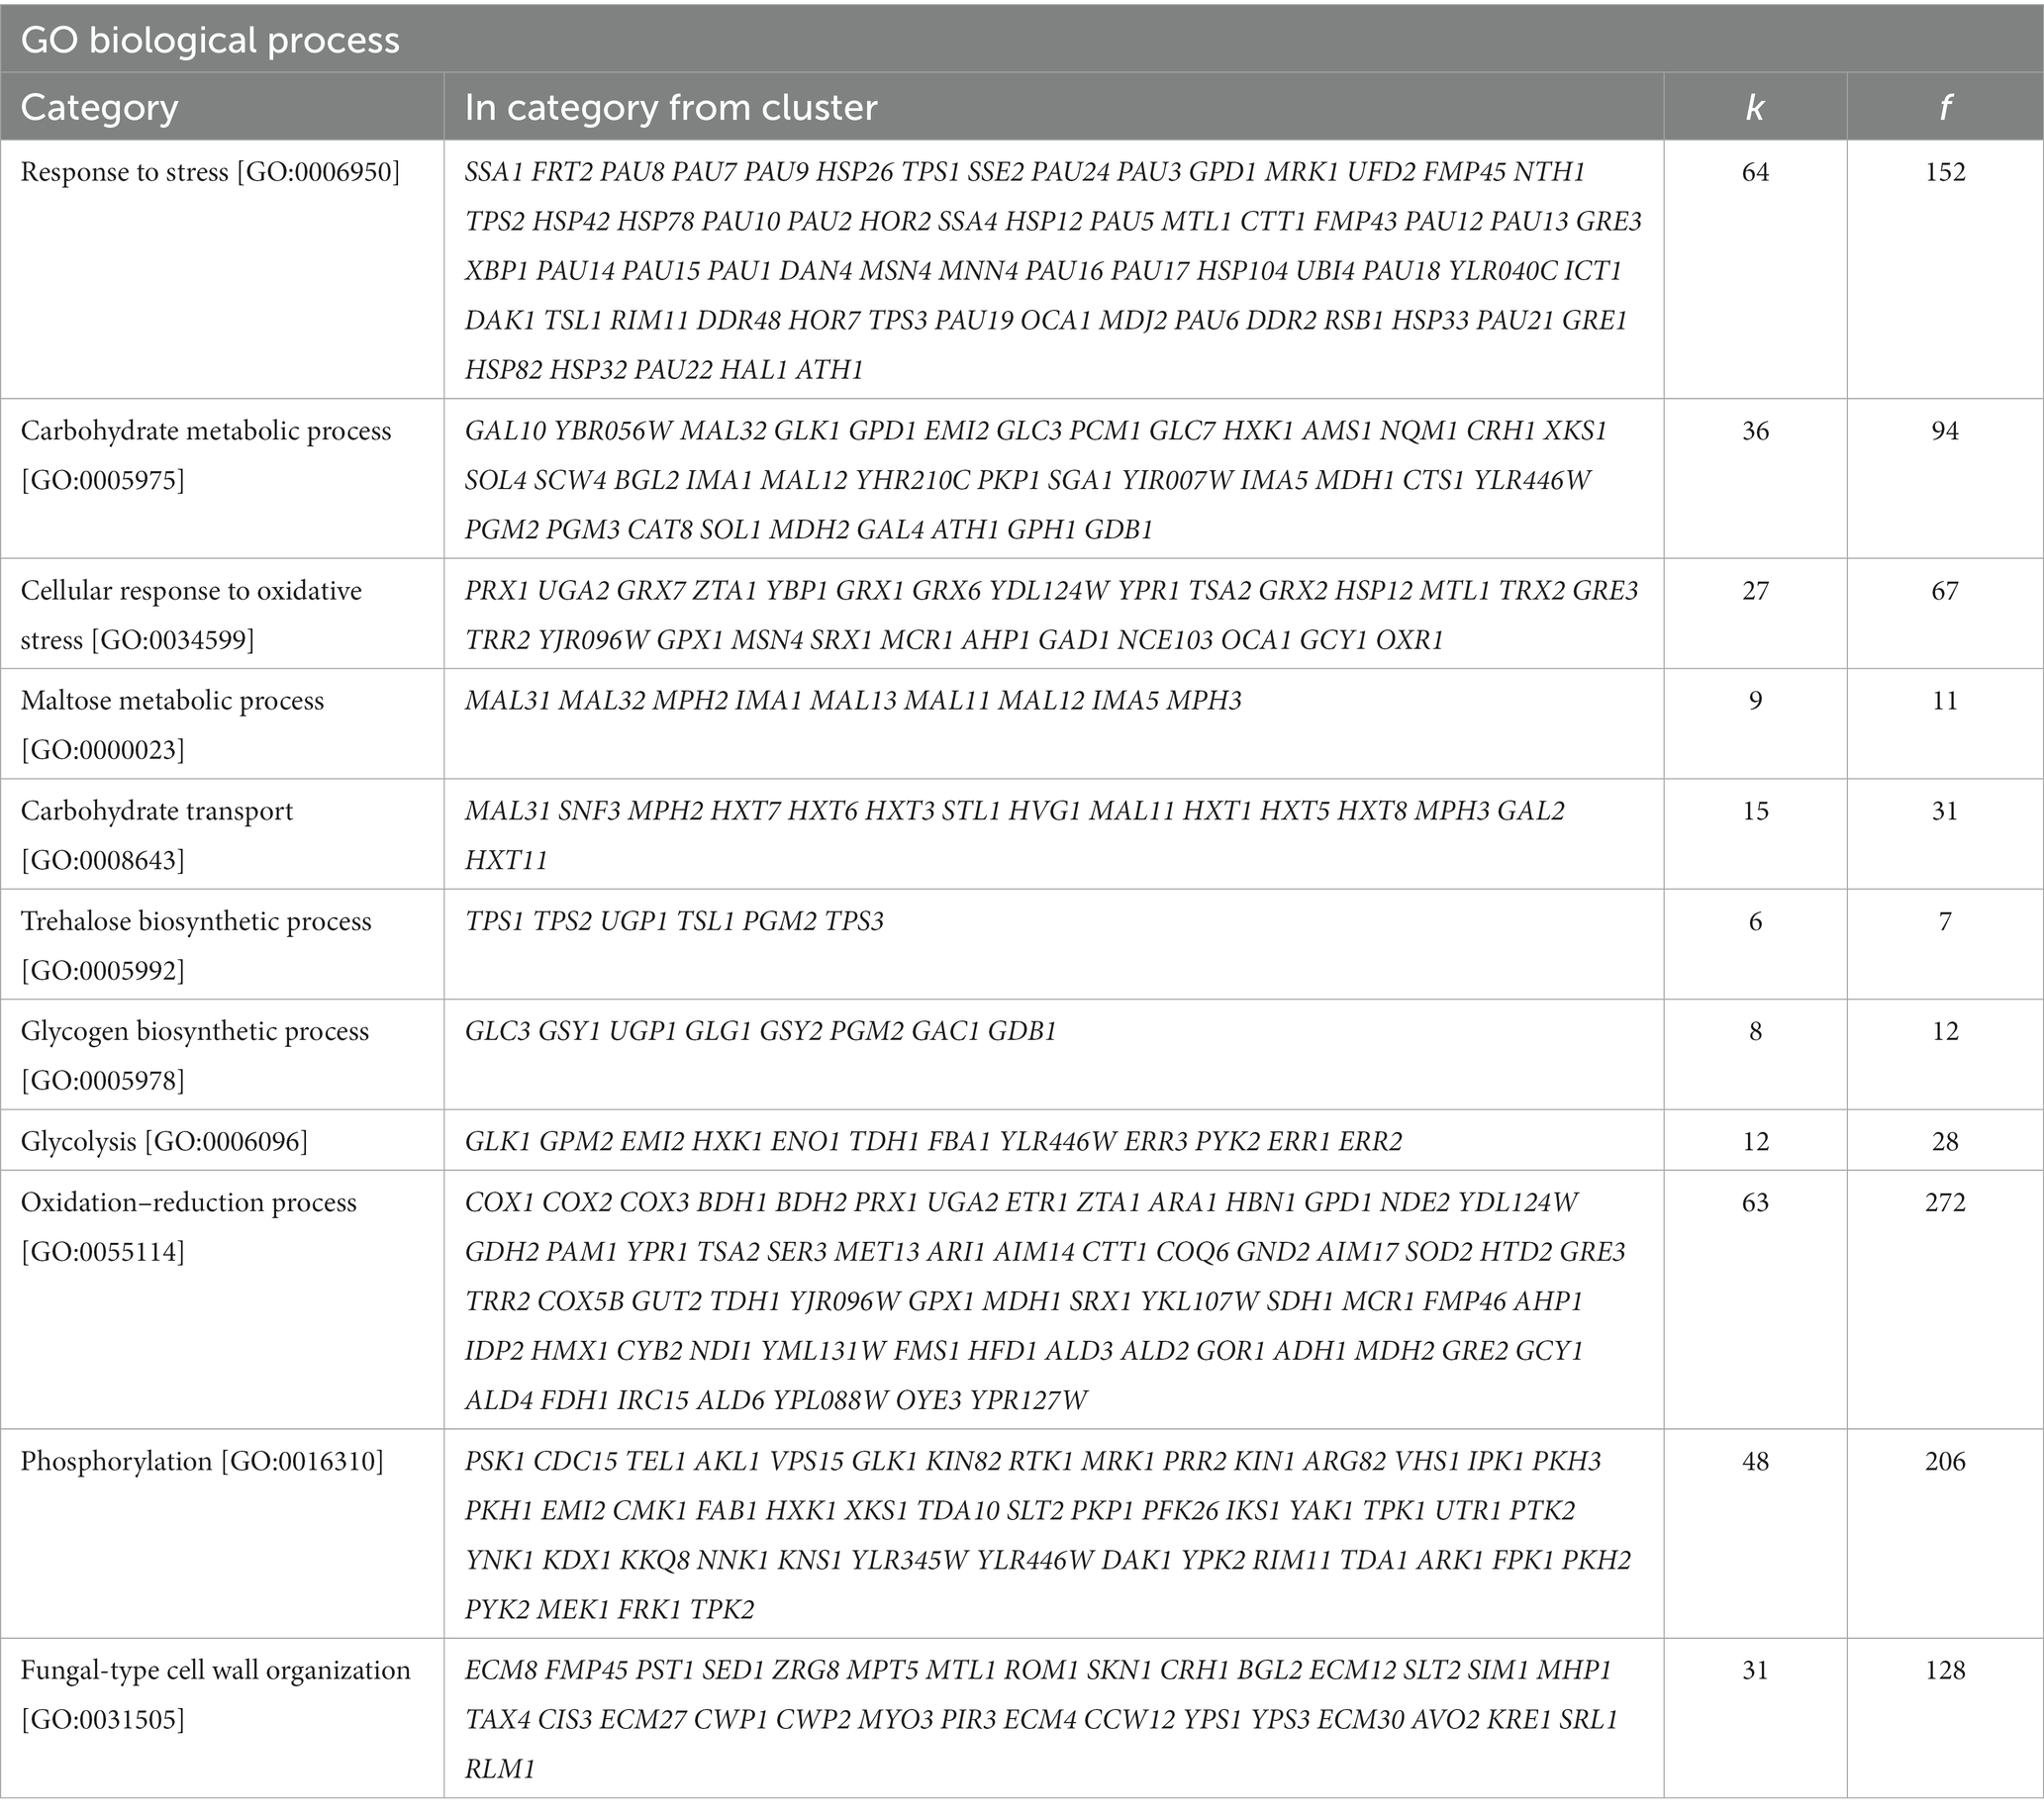
Table 2. FUNSpec Gene Ontology (GO) analysis results of the upregulated genes in C9 (k: number of genes in input cluster in given category, f: total number of genes in given category).
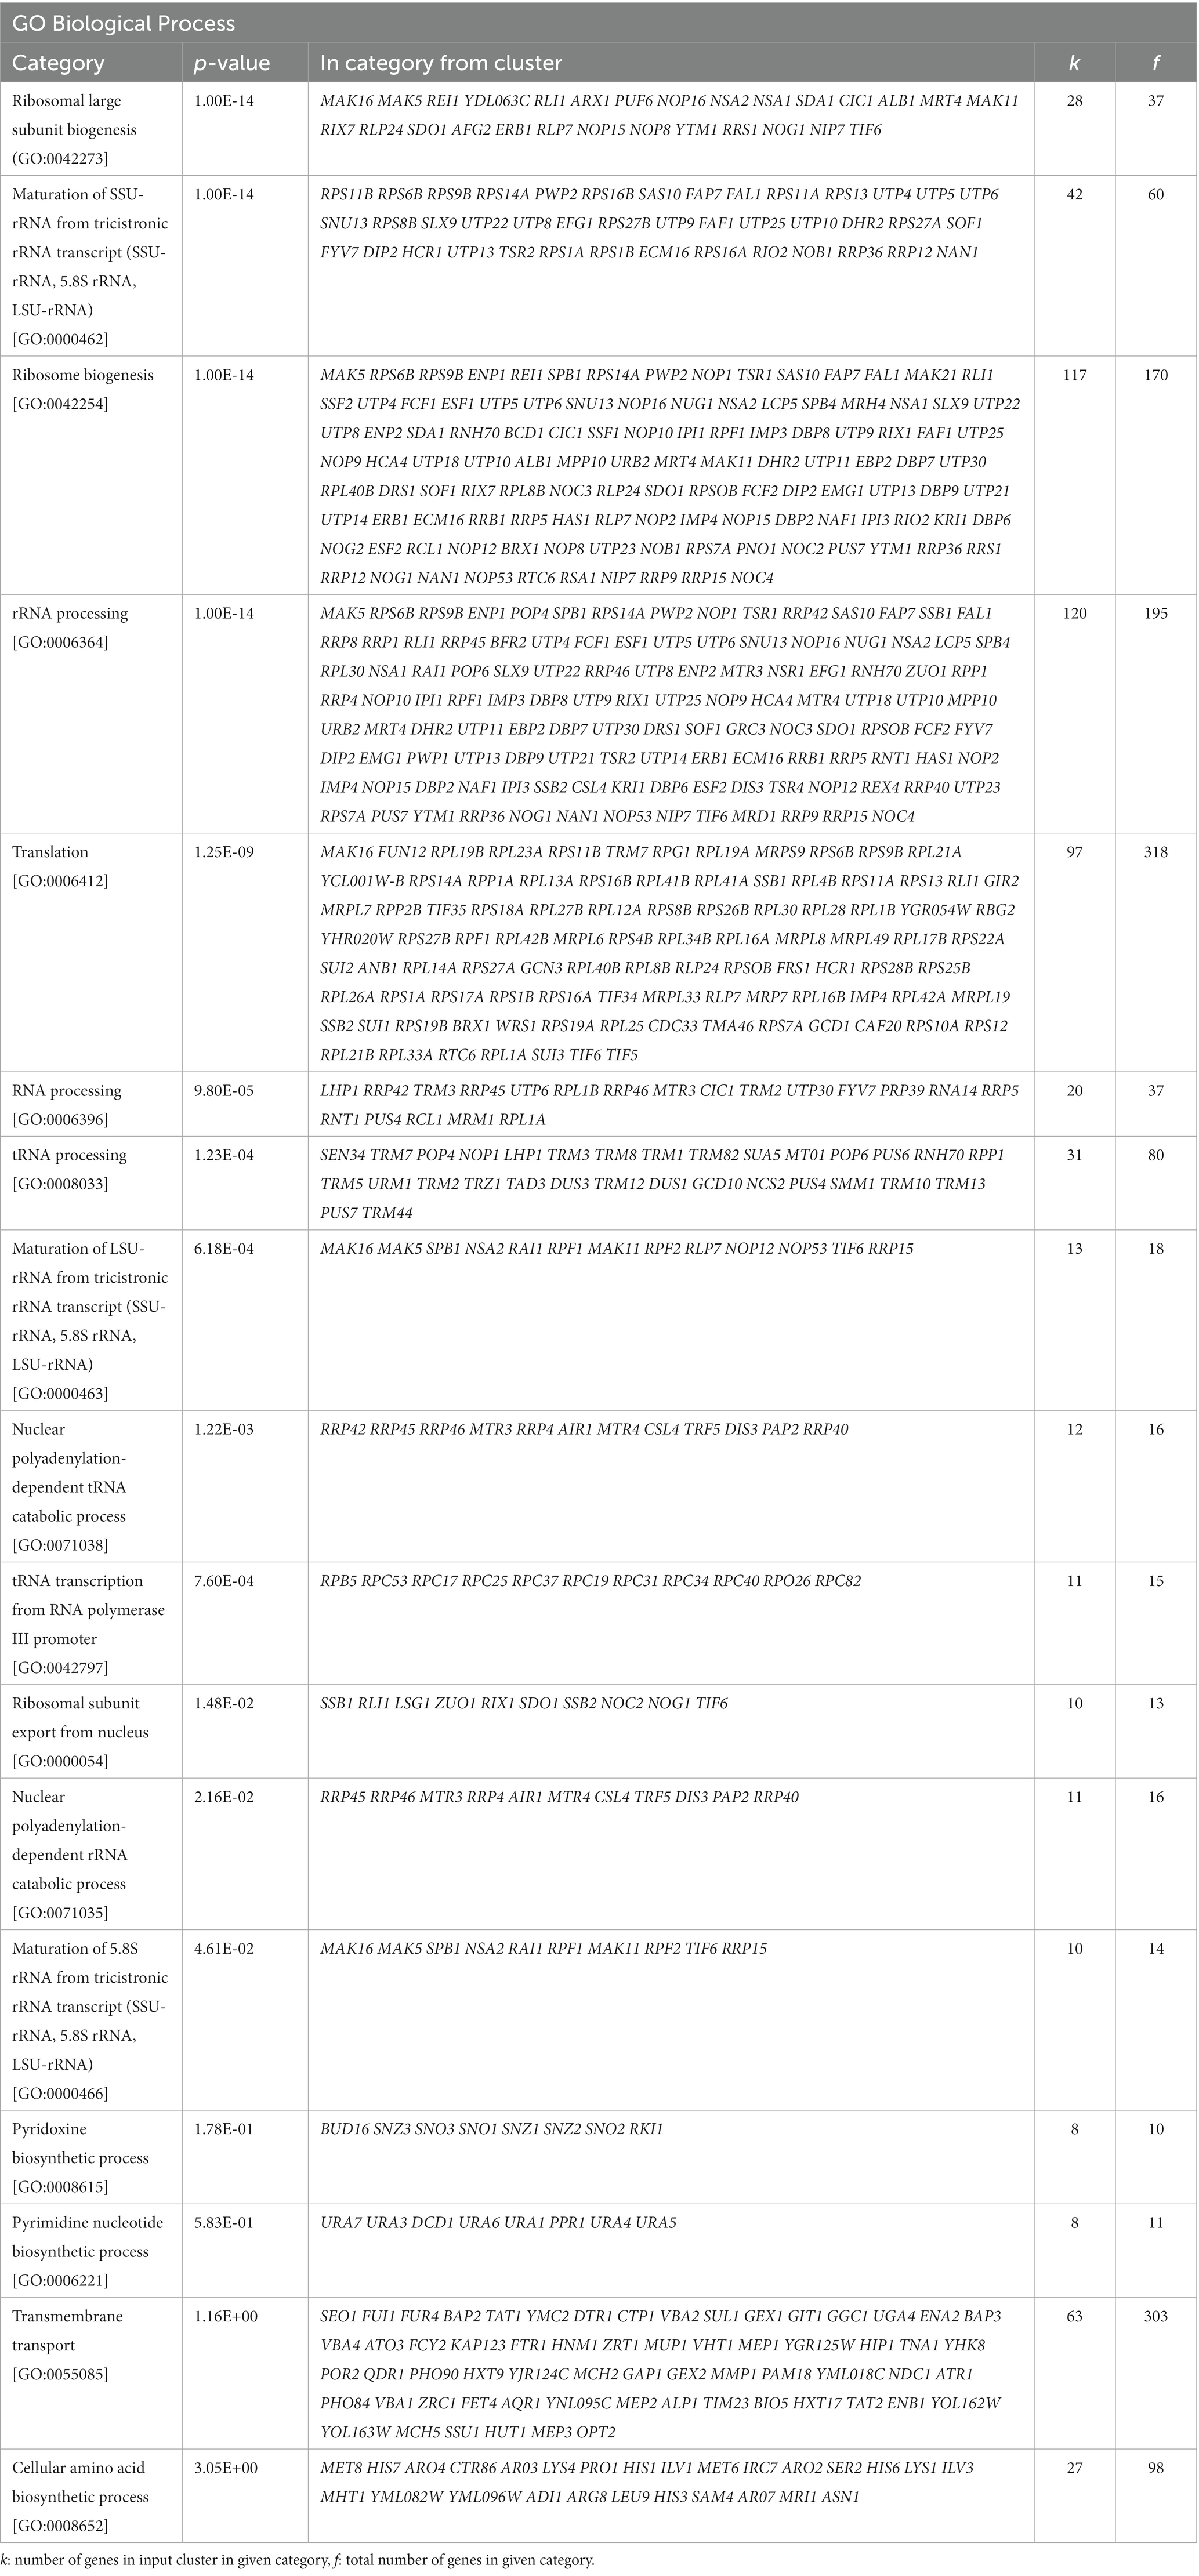
Table 3. FUNSpec Gene Ontology (GO) analysis results of the downregulated genes in C9.
Altogether, these data indicated that the 2-PE adapted C9 strain is set in a so-called stressing state. These data are supported by the finding that 93.9% of the upregulated genes and 96.4% of the downregulated genes in this C9 strain belong to the environmental stress response (ESR) reported in Brauer et al. (2008) (Figure 7).
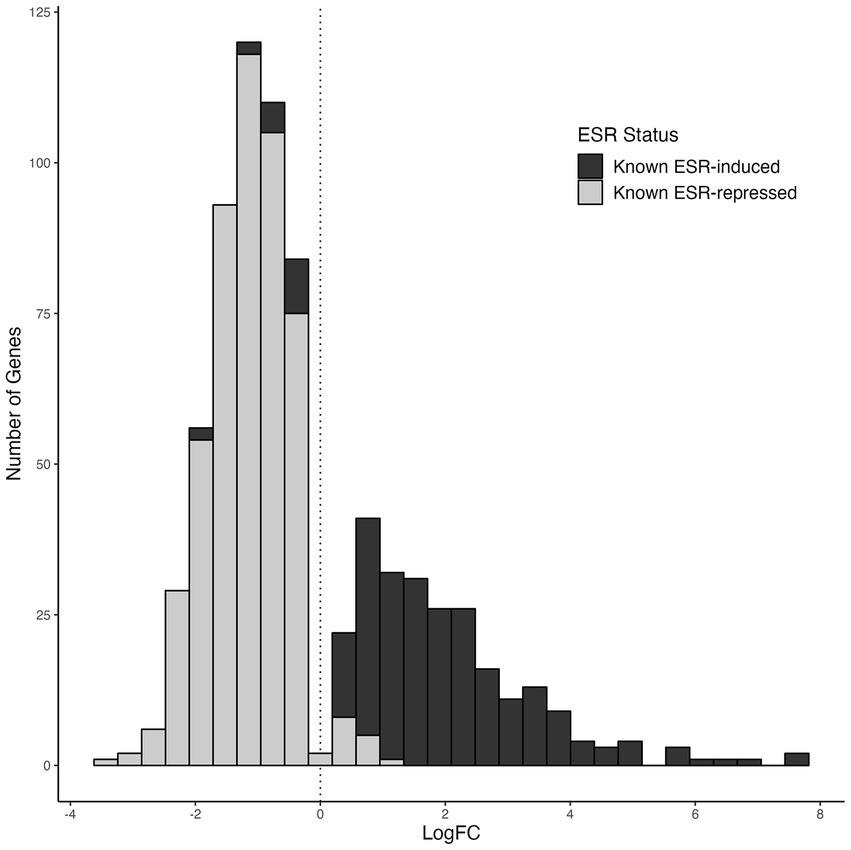
Figure 7. Expression distribution of known environmental stress-response (ESR) gene groups in the 2-phenylethanol-resistant strain C9. The gray columns show the previously known genes that are expected to be repressed under ESR, while the black columns show the previously known genes that are expected to be induced under ESR, according to Brauer et al. (2008).
These transcriptomic data were also analyzed using the YEASTRACT database,5 in particular to determine which transcription factors are implicated in the expression of enriched categories of upregulated and downregulated genes. As expected, Msn2p/Msn4p and Yap1p, which are known to induce expression of many stress-regulated genes were recovered in about 67 and 51% of all upregulated genes, respectively, with hallmarks genes that belong to glycogen and trehalose biosynthesis and stress response (Table 4). The transcription factors Sok2p and Ste12p were also found. They both participate in regulating genes involved in pseudo-hyphae/invasive growth through a MAP kinase pathway (Pan and Heitman, 2000; Malcher et al., 2011).
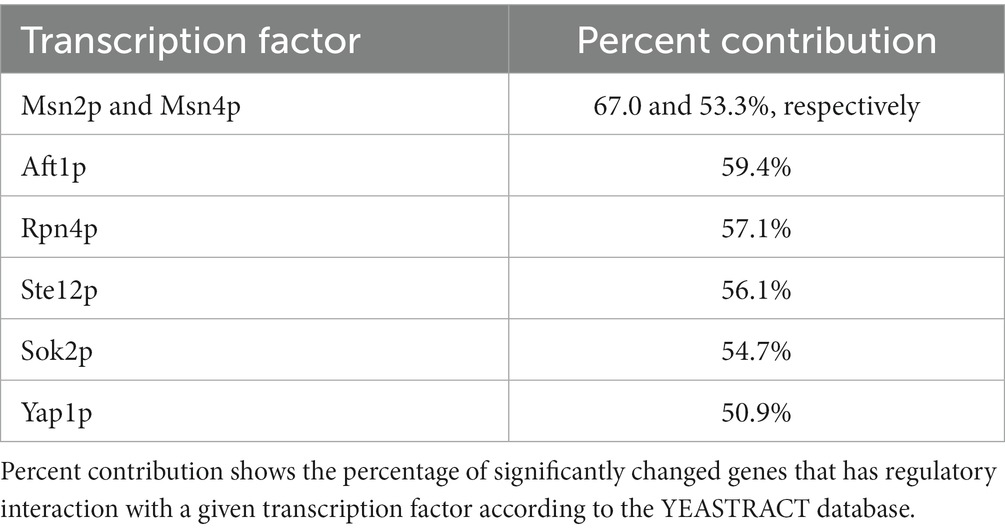
Table 4. Transcription factors and their percent contribution to the upregulated genes that have regulatory interaction of 2-PE-evolved strain C9.
More trivially, most of the stress-responsive genes harbor in their promoter a Sok2p and/or a Ste12p binding motif, as can be easily obtained through YEASTRACT analysis (data not shown). The transcription factors Rpn4p, which is reported as an activator of proteasome (Xie and Varshavsky, 2001) and Aft1p, which activates transcription in response to iron availability (Yamaguchi-Iwai et al., 1995) were also identified. Overall, the presence of these transcription factors are in concordance with the pathway enrichment analysis, that notably highlighted MAPK signaling, proteasome, autophagy and ribosome biogenesis (Table 5).
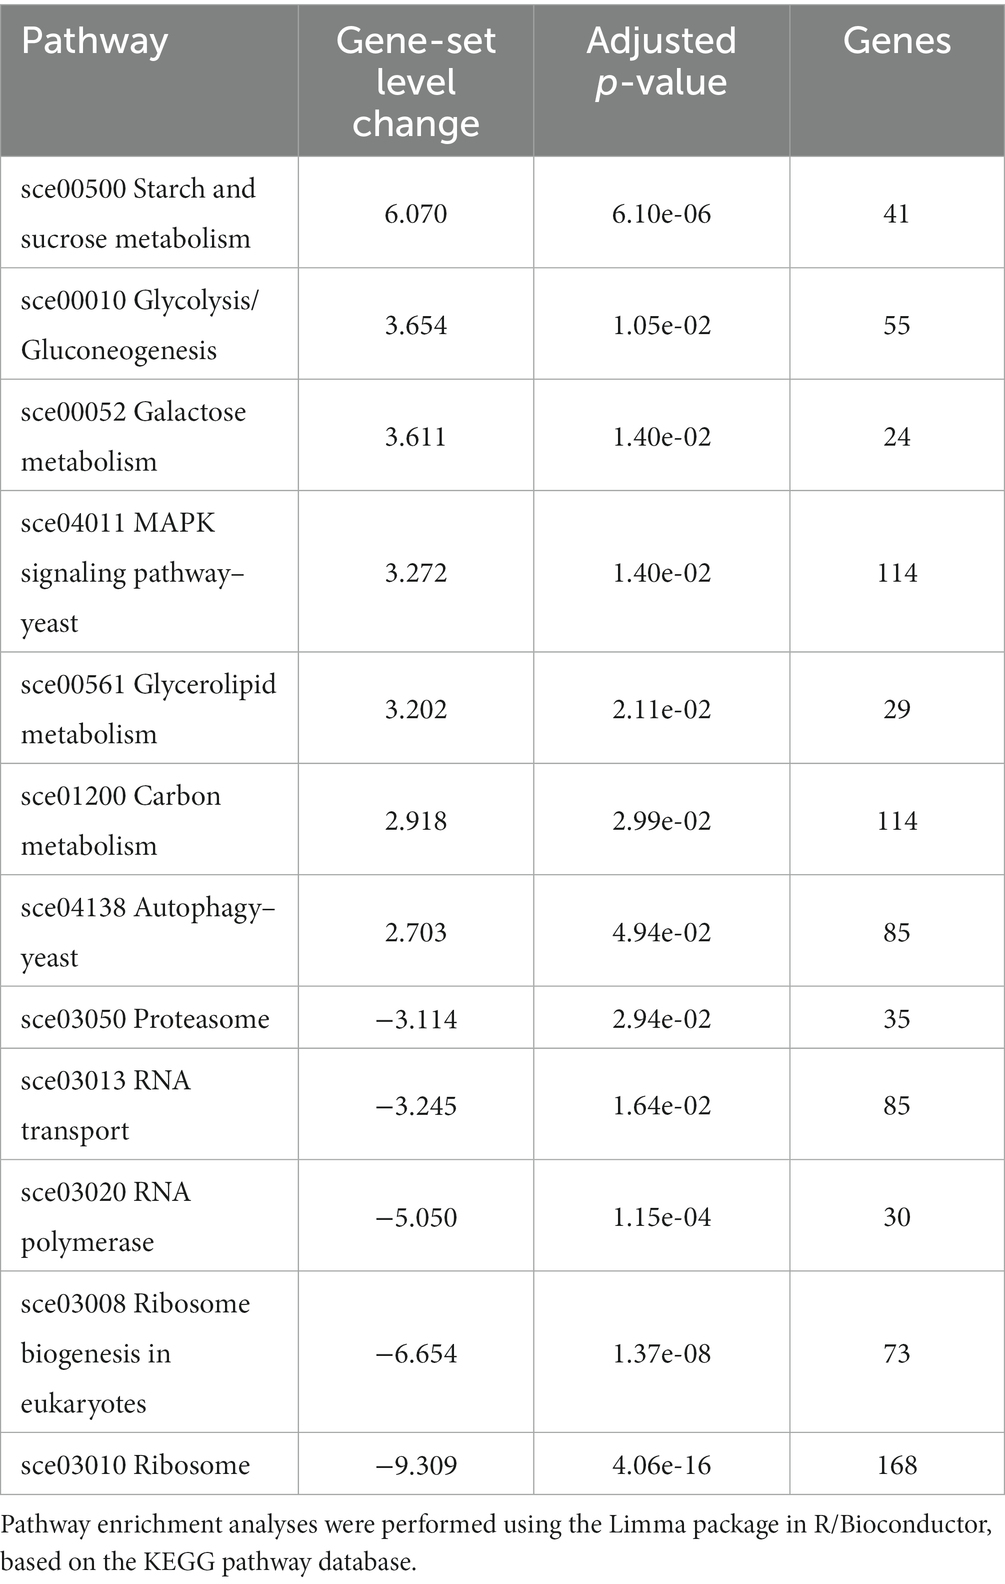
Table 5. The significantly (FDR adjusted p values <0.05) altered pathways according to the pathway enrichment analysis results of the evolved strain C9.
In addition, KEGG pathway analysis of the MAPK signaling pathway showed that the differentially expressed genes in C9 were mainly related to cell wall remodeling, osmolyte synthesis, filamentation and mating (Figure 8).
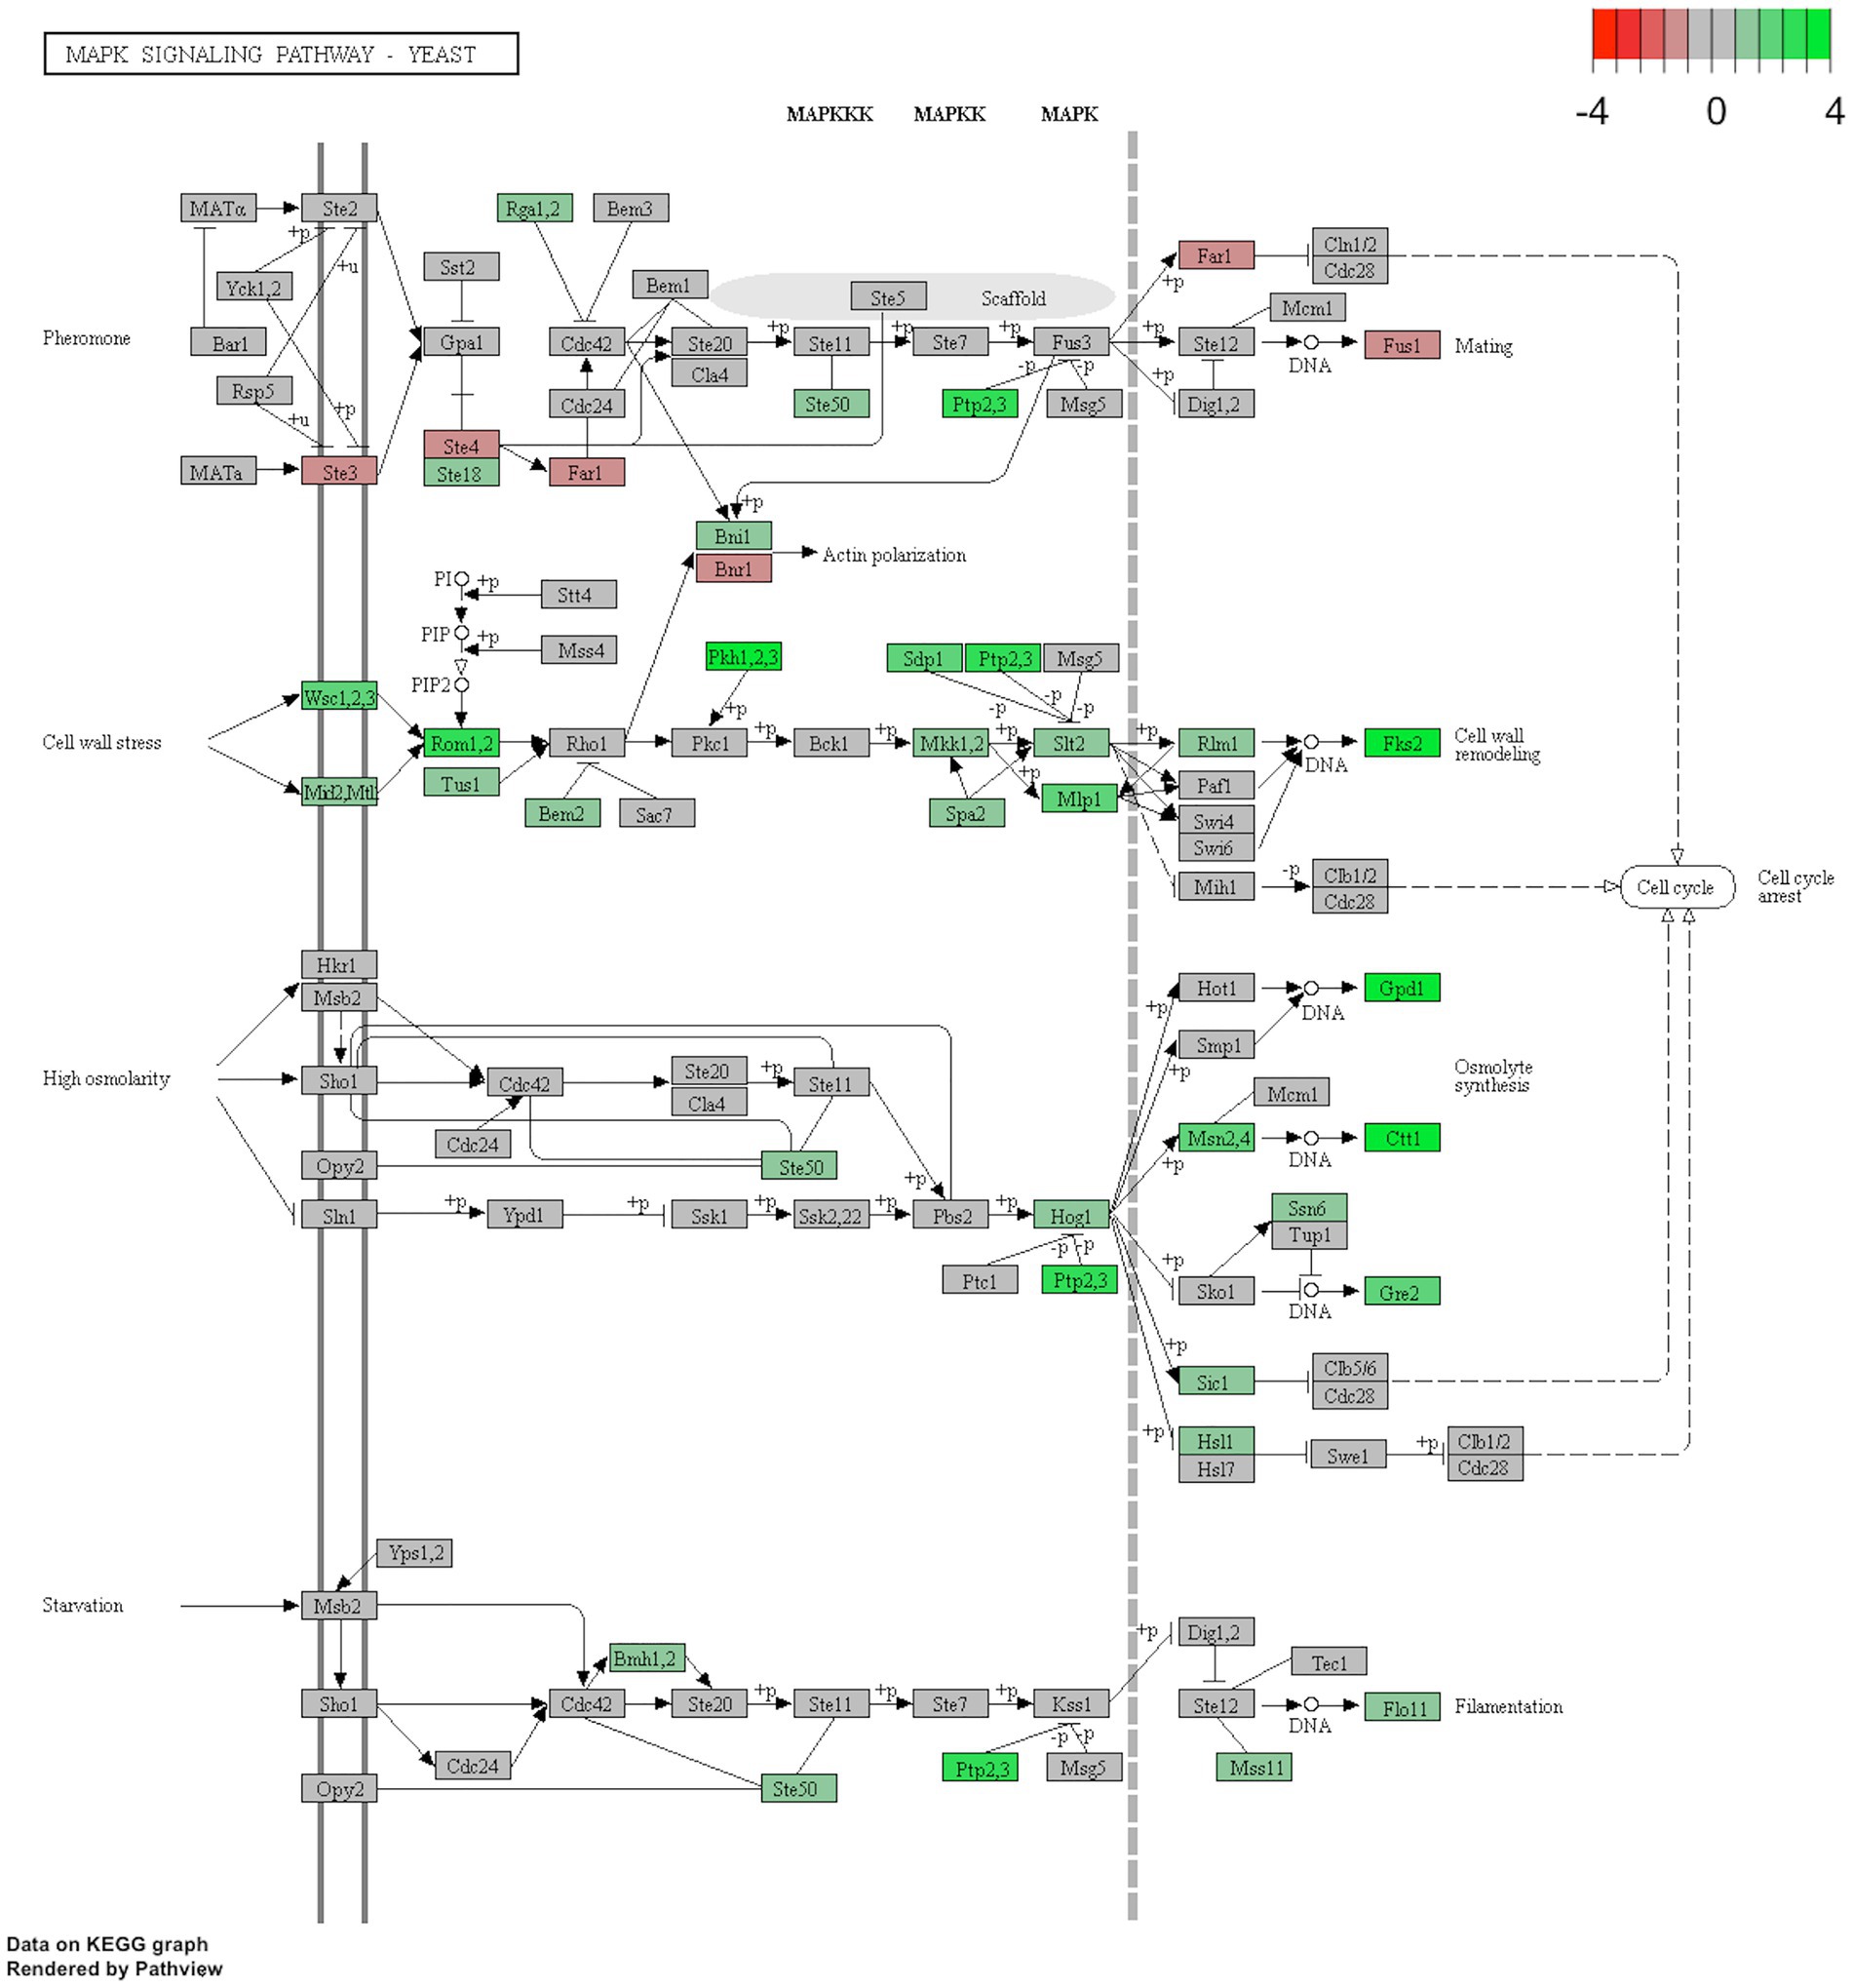
Figure 8. KEGG pathway of the MAPK Signalling Pathway (sce04011) that belongs to the 2-phenylethanol-resistant strain C9. Red boxes show the genes that were downregulated, while the green boxes show the upregulated genes.
In complement to this hierarchical analysis, we looked more closely to some genes that were either highly upregulated or downregulated in 2-PE-adapted strain C9 by a factor of at least 5-fold (Supplementary Tables S3, S4). Among these strongly upregulated genes, it is worth to notice genes involved in maltose metabolism including the maltose transporter (MAL11, MAL31) and maltase-encoding genes (MAL12, MAL32). This strong upregulation of these MAL genes could be caused either by their dependence on the transcriptional regulation by Msn2/4p and/or by their position at the telomeres of yeast chromosome VII (MAL11, MAL12, MAL13) and by chromosome II (MAL31, MAL32 and MAL33). Several genes of the galactose metabolism, i.e., GAL2, GAL10, GAL4, and PGM2, were also found to be upregulated in C9 (Supplementary Table S3). The transcriptional increase of these genes could be linked to the GAL80 missense mutation found in the C9 strain. Potent transcriptional increase was also noted for all the genes that belong to storage carbohydrates and many specific genes whose expression can be activated under various stress conditions such as CTT1, DDR2, HSP12, GRE2, etc. (see Supplementary Table S3; González et al., 2000). This potent upregulation can be explained by the presence in their promoter of one to several Msn2/Msn4p binding motifs termed STRE (Martinez-Pastor et al., 1996; Schmitt and McEntee, 1996). Another relevant finding was to detect a very potent transcriptional activation of ALD3 (234-fold) and ALD4 (28-fold) encoding promiscuous NAD+-dependent aldehyde dehydrogenases (Navarro-Aviño et al., 1999), as well as BDH2 (21 fold), which codes for a putative medium-chain alcohol dehydrogenase with similarity to a butanediol dehydrogenase that oxidizes (R,R)-2,3-butanediol to (3R)-acetoin (González et al., 2000). The strong upregulation of these genes can also be explained by their transcriptional dependency on Msn2/Msn4p. Among the most highly downregulated genes, which included many of the genes encoding ribosomal proteins (Supplementary Table S4), there were also several genes related to the transport of inorganic phosphate (Pi), sulfate, ammonium, zinc, and iron, supporting the notion that 2-PE can interfere with membrane fluidization (Ingram and Buttke, 1984) and ion transport (Seward et al., 1996).
Finally, since C9 strain showed stronger resistance than the reference strain to degradation of its cell wall by lyticase, we inspected the differentially expressed genes that belong to cell wall organization. We found that expression levels of many cell wall mannoprotein-encoding genes (CWP1, CWP2, FIT1, FIT2, CCW12), genes involved in cell wall biogenesis (ECM12, ECM27, ECM30, ECM4, ECM8) as well as CRH1 and CRH2 encoding chitin transglycosylase that catalyzes the glycosyl linkage between chitin and β-glucans (Blanco et al., 2015) were increased by 3 to 5-fold in the C9 strain. The upregulation of the two latter genes may also complement the effect of the mutation in CRH1 in increasing the resistance of the C9 strain to lyticase treatment. The upregulation of 20 out of the 24 genes of the PAU family can also be related to cell wall remodeling induced by 2-PE since PAU genes encode cell wall-related proteins, which are negatively regulated by oxygen and induced under hypoxic conditions (Rachidi et al., 2000; Alkim et al., 2013).
4. Discussion
In this work, the tolerance of the S. cerevisiae laboratory strain CEN.PK 113-7D to 2-PE was increased from 1.5 to 3.4 g/L by an adaptive laboratory evolution (ALE) strategy. This tolerance of the evolved strain was very similar to that obtained by a similar ALE strategy, except that in the latter, the adapted strain was forced to reach after 24 h the same optical density upon each additional increase of the 2-PE concentration (Zhu et al., 2021). While Zhu et al. (2021) did not report the genome sequencing of their evolved strain, the genome sequencing of our evolved strain revealed mutations in many genes that belong to various cellular functions and pathways, which at first glance, were not related to 2-PE detoxification or metabolization. On the other hand, the transcriptome of this evolved strain was profoundly altered with more than 30% of all genes in the genome being differentially expressed as compared to the original strain. In addition, the transcriptomic profile of our 2-PE-adapted strain very much resembled those of yeast challenged with various stresses and leading to the so-called ESR-induced and repressed genes (Gasch, 2000). These data strongly indicated that our C9 strain is poised in a permanent stressful state. Jin et al. (2018) reported on the transcriptomic response of S. cerevisiae upon exposure to 4 g/L 2-PE stress. At variance to our transcriptomic data, their data indicated that most of the highly upregulated genes reported in our study, notably in stress response, were found downregulated in their study (Jin et al., 2018). They also reported high enrichment in genes that belong to membrane and mitochondrial function, which was not the case in our work. Thus, there is a clear difference in the transcriptomic response of a strain challenged with 2-PE and that of a strain that has been adapted to this toxic compound. This difference may help to shed light on the mechanisms of resistance to 2-PE set up by the yeast, from those that were triggered in response to the presence of this toxic compound. Our study clearly showed that the adaptation to 2-PE led to a so-called stressful state of the cell.
The so called “stressful state” of our 2-PE-adapted strain C9 is likely the major consequence of two hierarchical events. At the genomic level, the mutations in the HOG1 gene resulted in the expression of a hyperactive HOG1-dependent pathway, due to the fact that the mutation in this gene is located in the phosphorylation lip of Hog1p, which was previously reported to significantly increase the Hog1p kinase activity (Bell et al., 2001). This hyperactive Hog1p.F138L in turn activates a hyperosmotic stress resistance mechanism that was witnessed in our C9 strain by a significantly increased production of glycerol, as compared to the reference strain. Under osmotic stress conditions, yeast cells start to synthesize internal osmolytes, primarily glycerol, to create an osmotic gradient (Saito and Posas, 2012). The production of glycerol is mainly regulated by two genes in yeast: HOG1 and PBS2. Null mutants of HOG, which encode a mitogen-activated protein kinase involved in osmoregulation, had decreased glycerol accumulation under osmotic stress (Brewster et al., 1993). It is also known that ethanol causes water stress in yeast by lowering water activity, and cells produce compatible solutes like glycerol and trehalose for their protection against dehydration stress (Hallsworth, 1998). Thus, we could hypothesize that 2-PE treatment induced a mutation in HOG1 to create a hyperactive Hog1p.F138L enabling to better resist 2-PE toxicity by decreasing the available water loss via accumulation of glycerol, similar to the hyperosmotic stress response. However, whether or not glycerol accumulation contributes to 2-PE resistance is still an open question that will require additional work. Nonetheless, in support of a role of glycerol contributing to 2-PE resistance, it has been recently reported that high glycerol synthesis ability and the efficient HOG pathway may contribute to the high 2-PE tolerance of the stress-tolerant yeast Candida glycerinogenes WL2002-5 while converting 2-phenylalanine into 2-PE (Lu et al., 2016). The other effect of the hyperactivity of this Hog1p enzyme is likely to activate nuclear relocalization of the transcription factors Msn2p/Msn4p through its phosphorylation (Petrenko et al., 2013). Moreover, the expression of genes encoding these transcription factors were upregulated in the 2-PE-evolved strain, accounting for the strong upregulation of stress-related genes found in this strain, among which are genes implicated in reserve carbohydrates metabolism, as hallmarks of stress response (Parrou et al., 1999; Enjalbert et al., 2004). Whether the increased trehalose accumulation contributes to the resistance of strain C9 to 2-PE is a matter of debate, because on the one hand, it is well established that cells with high intracellular trehalose show better resistance to different stresses and higher viability (François and Parrou, 2001; Elbein et al., 2003; Kitichantaropas et al., 2016). On the other hand, the increase in trehalose production in the evolved strain could be a consequential event of the acquisition of the mutation in the HOG1 gene that results in the upregulation of trehalose synthesis genes, TPS1, TSL1 and TPS2 through the activation of Msn2/4p.
The missense mutation in PDE2 resulting in the variant Pde2p.P132S could additionally contribute to the stressful state of the C9 strain. Indeed, PDE2 encodes a high-affinity cyclic AMP phosphodiesterase, whose overexpression can antagonize effects of hyperactive PKA pathway by reducing cAMP (Sass et al., 1986). As the cAMP-dependent PKA pathway is known to enhance sensitivity to several stress conditions (Sass et al., 1986; Casado et al., 2011; Molin et al., 2020), in part through the repression of Msn2p/Msn4p-dependent gene expression (Smith et al., 1998), it is therefore conceivable that the missense mutation in PDE2 leads to a gain of function that increases the phosphodiesterase activity.
An alteration of cell wall structure was another significant physiological modification observed in the 2-PE-adapted C9 strain, as indicated by a greater resistance of this strain to the hydrolytic action of lyticase, an enzyme cocktail with β-1,3-glucan hydrolase and β-1,3-glucanase activity. This cell wall alteration could result from the conjugation of two mechanisms. The first one is upregulation of many cell wall-related genes that are typically involved in the cell wall compensatory mechanism triggered in response to cell wall damages (Lagorce et al., 2003; García et al., 2004), suggesting a cell wall compensatory mechanism in response to 2-PE treatment. This effect is likely a result of the hyperactive Hog1p.F138L variant resulting from HOG1 mutation and the attendant activation of Msn2/4p transcription factor, since many cell wall genes have been reported to be upregulated through these factors (Berry and Gasch, 2008; Garcia et al., 2009). The other mechanism could be linked to the mutation in CRH1 in C9 strain. This gene encodes one of the two chitin transglycosylases that are responsible for chitin to β-1,6-glucan cross-linkages (Rodriguez-Pena et al., 2000; Cabib, 2009). The missense mutation found in CRH1 could have generated higher trans-glycosidase activity of Crh1p. These two mechanisms could be responsible for modification of the linkages between cell wall components, leading to higher resistance to the hydrolytic action of lyticase. In addition, mutation in BNI1 and SPA2 in the 2-PE-adapted C9 strain could also contribute to cell wall remodeling or cell wall repair at the bud site during growth since these two genes encode components of the polarisome that is needed for this polarized (unidimensional) cell growth (Pruyne and Bretscher, 2000). It was indeed shown that in response to cell wall damages caused by mechanical stress, there is a rapid depolarization at the growth sites, which involves disruption of actin cables and destabilization of the polarisome, resulting in growth inhibition. These events are then accompanied by uniform synthesis and strengthening of the stretched cell wall, thereby preventing potential cell lysis (Mishra et al., 2022). Interestingly, it was reported that this cell survival in response to a compressive mechanical stress was under the cooperative control of Pkc1p and calcineurin pathways, which are two major signaling pathways implicated in the cell wall compensatory response. Therefore, a similar process induced by 2-PE and probably mediated by Hog1-dependent osmotic stress pathway could also take place and account for growth reduction of the 2-PE-evolved strain, as compared to the reference strain.
Other mutations were found in C9 strain that could contribute to 2-PE resistance. This can be the case for the missense mutation of FLR1. This gene codes for a plasma membrane transporter of the major facilitator superfamily, a member of the drug H+-antiporter family (Goffeau et al., 1997). The missense mutation in this gene could result in a hyperactive Flr1p.P161S variant that is implicated in the expulsion of 2-PE out of the cell. Likewise, the mutation in MAK5 gene (Mak5p.A215T) that encodes an essential nucleolar protein involved in large ribosome subunit biogenesis (Zagulski et al., 2003) may account for the reduced expression of genes that encode ribosomal proteins, which favors a stressful-state.
The C9 strain yet harbored many other mutations and transcriptional changes that at first glance do not seem to be related to the resistance to 2-PE. In particular, the missense mutation in GAL80, which encodes a transcriptional repressor of GAL genes (Sellick et al., 2008) was accompanied by the upregulation of several of the GAL genes, i.e., GAL2, GAL10, GAL4 and PGM2, indicating that the Gal80p.H376Y variant encoded by the mutated GAL80 has lost its repression activity. Likewise, strong upregulation of MAL genes is likely a consequence of hyperactive Hog1p that activated Msn2/4p-dependent genes, among which are most of the MAL genes. It is noteworthy that the upregulation of maltose and galactose genes, which are otherwise repressed by glucose in reference to yeast (Federoff et al., 1983), could enable C9 to utilize these alternative carbon sources together with glucose, although we have not examined this possibility.
It is known that when yeast cells gain resistance against a particular stress type, they may be either protected or be more susceptible to other stress types (Lewis et al., 1995; Hohmann, 2002). Thus, we tested the evolved strain C9 and the reference strain for their potential cross-resistance against a variety of stress types. Among various stressors tested, the evolved strain was slightly more sensitive to boron and cobalt stress than the reference strain, which can be explained by the well-known ‘trade-off’ situation in evolutionary engineering (Çakar et al., 2012), where the evolved strains may lose some properties while gaining new ones. In this work, the higher boron sensitivity of the evolved strain may be associated with the downregulation of ATR1 (Supplementary Table S4) which encodes the main boron exporter in yeast. It was previously shown that S. cerevisiae cells overexpressing ATR1 were boron-resistant (Kaya et al., 2009). Also, the higher sensitivity of C9 to iron may be associated with the downregulation of the genes related to iron metabolism (Supplementary Table S4), as these genes are involved in general iron uptake under iron depletion or cobalt stress (Stadler and Schweyen, 2002). In addition, the genes related to iron metabolism were upregulated in a cobalt-resistant S. cerevisiae strain (Çakar et al., 2009; Alkim et al., 2013). Overall, the increased sensitivity of C9 to these stressors is very likely a consequence associated with the physiological state of the strain adapted to 2-PE, but is neither involved in 2-PE-resistance nor in the metabolism of this molecule.
On the other hand, the finding of a higher resistance of the evolved strain against 2-phenylacetate brought out the idea that an easy way to make the cells resistant to 2-PE is to convert it to phenylacetate, which involves two consecutive oxidation reactions. Quite interestingly, our transcriptomic analysis unraveled a huge upregulation of ALD3 (>200 fold) and ALD4 (> 20 fold), which encode a cytoplasmic and a mitochondrial NAD+-aldehyde dehydrogenase, respectively. These enzymes can catalyze the oxidation of phenylacetaldehyde into phenylacetate, which has been already shown for Ald3p (Kim et al., 2014). The oxidation of 2-PE into phenylacetaldehyde could be also catalyzed by Ald3p/Ald4p or possibly by the oxidoreductase encoded by BDH2 since this gene is homologous to BDH1 which codes for an oxidoreductase that oxidizes 2,3-butanediol into acetoin (González et al., 2000), and the expression of BDH2 is 21-fold increase in the 2-PE-adapted strain. Taken together, our data suggest that beyond inducing a stress state that likely contributes to 2-PE resistance, the upregulation of oxidoreductase and dehydrogenase genes activates a mechanism that detoxifies the yeast from 2-PE by transforming it into a less toxic molecule, 2-phenylacetate. It should be noted that activation of a detoxification mechanism is quite commonly found following the ALE strategy, as was obtained for furfural (Jung et al., 2017; Zheng et al., 2022) or coniferyl aldehyde resistance (Hacısalihoğlu et al., 2019). Our data also indicate that this detoxification mechanism must be suppressed in the engineering of highly 2-PE-producing yeast, consistent with the fact that deletion of ALD3 combined with overexpression of ARO9 and ARO10 encoding a transaminase and decarboxylase, respectively, promoted high production of 2-PE from phenylalanine (Kim et al., 2014). These results also tell us that engineering a strain for high 2-PE production that must be at the same time highly resistant to this flavor could be achieved by adapting a strain defective in this detoxification mechanism.
5. Conclusion
In this work, we applied in vivo evolutionary engineering to adapt the yeast S. cerevisiae to the toxic compound 2-phenylethanol (2-PE). This ALE strategy led to the isolation of an adapted strain able to sustain growth in the presence of 3.4 g/L of 2-PE, which is roughly three times higher than the non-evolved strain. The genome sequencing of the evolved strain revealed numerous genes bearing single mutations, among which the most relevant was in the HOG1 gene. The mutation in this gene resulted in a hyperactive Hog1p kinase which in turn activates the high osmolarity signaling pathway, as witnessed by up to 3 times higher production of glycerol in the evolved strain. In addition, our transcriptomic analysis implies that the resistance phenotype may be related to the Msn2/Msn4p-dependent stress response mediated by HOG1 pathway, which also included activation of many cell wall-related genes, with a measurable consequence that the evolved strain being more resistant to lyticase, a cell wall-degrading cocktail containing endo β-1,3 glucanase and exo-β-1,3-glucanase activity. Furthermore, the finding of a huge upregulation of ALD3 and ALD4 encoding NAD+ aldehyde dehydrogenase, and BDH2 encoding a putative oxidoreductase along with the finding that phenylacetate is much less toxic than 2-PE suggested the activation of a detoxification mechanism of 2-PE through its conversion into phenylacetate mediated by these dehydrogenases. Taken together, the 2-PE tolerance is a multigenic and complex trait that needs to be investigated further in light of the present study’s findings.
Data availability statement
The datasets presented in this study can be found in online repositories. The names of the repository/repositories and accession number(s) can be found in the article/Supplementary material.
Author contributions
ZÇ, GB, and JF: conceptualization, supervision, and funding acquisition. CH, BT-Y, ÜY, CA, MA, AT, and HK: methodology. CH, BT-Y, CA, MA, and AT: data curation and writing – original draft preparation. CH, AT, GB, JF, and ZÇ: writing, review and editing and project administration. All authors contributed to the article and approved the submitted version.
Funding
This study was supported by Istanbul Technical University (ITU) Research Funds (BAP Project no: 36128, PI: ZÇ) and COST Action FA0907 (to GB and JF).
Acknowledgments
We thank Şerif Karabulut, Yusuf Sürmeli, Gülçin Balaban, Ogün Morkoç and Ömer Esen for technical assistance.
Conflict of interest
The authors declare that the research was conducted in the absence of any commercial or financial relationships that could be construed as a potential conflict of interest.
Supplementary material
The Supplementary material for this article can be found online at: https://www.frontiersin.org/articles/10.3389/fmicb.2023.1148065/full#supplementary-material
Footnotes
1. ^ http://mips.helmholtz-muenchen.de/funcatDB
2. ^ http://growthrate.princeton.edu/transcriptome/analyze.shtml
3. ^ http://www.ncbi.nlm.nih.gov/geo/query/acc.cgi?acc=GSE59353
References
Alkim, C., Benbadis, L., Yilmaz, U., Cakar, Z. P., and François, J. M. (2013). Mechanisms other than activation of the iron regulon account for the hyper-resistance to cobalt of a Saccharomyces cerevisiae strain obtained by evolutionary engineering. Metallomics 5, 1043–1060. doi: 10.1039/c3mt00107e
Balaban, B. G., Yılmaz, U., Alkım, C., Topaloğlu, A., Kısakesen, H. I., Holyavkin, C., et al. (2020). Evolutionary engineering of an iron-resistant Saccharomyces cerevisiae mutant and its physiological and molecular characterization. Microorganisms 8:43. doi: 10.3390/microorganisms8010043
Bell, M., Capone, R., Pashtan, I., Levitzki, A., and Engelberg, D. (2001). Isolation of hyperactive mutants of the MAPK p38/Hog1 that are independent of MAPK kinase activation. J. Biol. Chem. 276, 25351–25358. doi: 10.1074/jbc.M101818200
Benjamini, Y., and Hochberg, Y. (1995). Controlling the false discovery rate: a practical and powerful approach to multiple testing. J. R. Stat. Soc. Series B Stat. Methodol. 57, 289–300. doi: 10.1111/j.2517-6161.1995.tb02031.x
Berry, D. B., and Gasch, A. P. (2008). Stress-activated genomic expression changes serve a preparative role for impending stress in yeast. Mol. Biol. Cell 19, 4580–4587. doi: 10.1091/mbc.e07-07-0680
Blanco, N., Sanz, A. B., Rodríguez-Peña, J. M., Nombela, C., Farkaš, V., Hurtado-Guerrero, R., et al. (2015). Structural and functional analysis of yeast Crh1 and Crh2 transglycosylases. FEBS J. 282, 715–731. doi: 10.1111/febs.13176
Bolger, A. M., Lohse, M., and Usadel, B. (2014). Trimmomatic: a flexible trimmer for Illumina sequence data. Bioinformatics 30, 2114–2120. doi: 10.1093/bioinformatics/btu170
Bostock, C. J. (1970). The effect of 2-phenyl ethanol on the DNA synthesis cycle of Schizosaccharomyces pombe. J. Cell Sci. 7, 523–530. doi: 10.1242/jcs.7.2.523
Brauer, M. J., Huttenhower, C., Airoldi, E. M., Rosenstein, R., Matese, J. C., Gresham, D., et al. (2008). Coordination of growth rate, cell cycle, stress response, and metabolic activity in yeast. Mol. Biol. Cell 19, 352–367. doi: 10.1091/mbc.e07-08-0779
Brewster, J. L., de Valoir, T., Dwyer, N. D., Winter, E., and Gustin, M. C. (1993). An osmosensing signal transduction pathway in yeast. Science 259, 1760–1763. doi: 10.1126/science.7681220
Burns, V. W., and Wang, D. (1968). Effects of phenethyl alcohol on yeast cells. J. Cell. Physiol. 72, 97–107. doi: 10.1002/jcp.1040720204
Cabib, E. (2009). Two novel techniques for determination of polysaccharide cross-links show that Crh1p and Crh2p attach chitin to both beta(1-6)- and beta(1-3)glucan in the Saccharomyces cerevisiae cell wall. Eukaryot. Cell 8, 1626–1636. doi: 10.1128/EC.00228-09
Çakar, Z. P., Alkım, C., Turanlı, B., Tokman, N., Akman, S., Sarıkaya, M., et al. (2009). Isolation of cobalt hyper-resistant mutants of Saccharomyces cerevisiae by in vivo evolutionary engineering approach. J. Biotechnol. 143, 130–138. doi: 10.1016/j.jbiotec.2009.06.024
Çakar, Z. P., Seker, U. O., Tamerler, C., Sonderegger, M., and Sauer, U. (2005). Evolutionary engineering of multiple-stress resistant Saccharomyces cerevisiae. FEMS Yeast Res. 5, 569–578. doi: 10.1016/j.femsyr.2004.10.010
Çakar, Z. P., Turanlı-Yıldız, B., Alkım, C., and Yılmaz, Ü. (2012). Evolutionary engineering of Saccharomyces cerevisiae for improved industrially important properties. FEMS Yeast Res. 12, 171–182. doi: 10.1111/j.1567-1364.2011.00775.x
Carlquist, M., Gibson, B., Karagul Yuceer, Y., Paraskevopoulou, A., Sandell, M., Angelov, A. I., et al. (2015). Process engineering for bioflavour production with metabolically active yeasts - a mini-review. Yeast 32, 123–143. doi: 10.1002/yea.3058
Casado, C., Gonzalez, A., Platara, M., Ruiz, A., and Arino, J. (2011). The role of protein kinase a pathway in the response to alkaline pH stress in yeast. Biochem. J. 438, 523–533. doi: 10.1042/BJ20110607
Cherry, J. M., Hong, E. L., Amundsen, C., Balakrishnan, R., Binkley, G., Chan, E. T., et al. (2012). Saccharomyces genome database: the genomics resource of budding yeast. Nucleic Acids Res. 40, D700–D705. doi: 10.1093/nar/gkr1029
DePristo, M. A., Banks, E., Poplin, R., Garimella, K. V., Maguire, J. R., Hartl, C., et al. (2011). A framework for variation discovery and genotyping using next-generation DNA sequencing data. Nat. Genet. 43, 491–498. doi: 10.1038/ng.806
Elbein, A. D., Pan, Y. T., Pastuszak, I., and Carroll, D. (2003). New insights on trehalose: a multifunctional molecule. Glycobiology 13, 17R–27R. doi: 10.1093/glycob/cwg047
Enjalbert, B., Parrou, J. L., Teste, M. A., and Francois, J. (2004). Combinatorial control by the protein kinases PKA, PHO85 and SNF1 of transcriptional induction of the Saccharomyces cerevisiae GSY2 gene at the diauxic shift. Mol. Genet. Genomics 271, 697–708. doi: 10.1007/s00438-004-1014-8
Entian, K. D., and Kötter, P. (2007). Yeast genetic strain and plasmid collections. J. Biol. Methods 36, 629–666. doi: 10.1016/S0580-9517(06)36025-4
Federoff, H. J., Eccleshall, T. R., and Marmur, J. (1983). Regulation of maltase synthesis in Saccharomyces carlsbergensis. J. Bacteriol. 154, 1301–1308. doi: 10.1128/jb.154.3.1301-1308.1983
François, J., and Parrou, J. L. (2001). Reserve carbohydrates metabolism in the yeast Saccharomyces cerevisiae. FEMS Microbiol. Rev. 25, 125–145. doi: 10.1111/j.1574-6976.2001.tb00574.x
García, R., Bermejo, C., Grau, C., Pérez, R., Rodríguez-Peña, J. M., Francois, J., et al. (2004). The global transcriptional response to transient cell wall damage in Saccharomyces cerevisiae and its regulation by the cell integrity signaling pathway. J. Biol. Chem. 279, 15183–15195. doi: 10.1074/jbc.M312954200
Garcia, R., Rodriguez-Pena, J. M., Bermejo, C., Nombela, C., and Arroyo, J. (2009). The high osmotic response and cell wall integrity pathways cooperate to regulate transcriptional responses to zymolyase-induced cell wall stress in Saccharomyces cerevisiae. J. Biol. Chem. 284, 10901–10911. doi: 10.1074/jbc.M808693200
Gasch, A. P. (2000). The environmental stress response: a common yeast response to diverse environmental stresses. Mol. Biol. Cell 11, 4241–4257. doi: 10.1091/mbc.11.12.4241
Goffeau, A., Park, J., Paulsen, I. T., Jonniaux, J. L., Dinh, T., Mordant, P., et al. (1997). Multidrug-resistant transport proteins in yeast: complete inventory and phylogenetic characterization of yeast open reading frames within the major facilitator superfamily. Yeast 13, 43–54. doi: 10.1002/(SICI)1097-0061(199701)13:1<43::AID-YEA56>3.0.CO;2-J
González, E., Fernández, M. R., Larroy, C., Sola, L., Pericas, M. A., Parés, X., et al. (2000). Characterization of a (2R, 3R)-2, 3-Butanediol dehydrogenase as the Saccharomyces cerevisiae YAL060W gene product: disruption and induction of the gene. J. Biol. Chem. 275, 35876–35885. doi: 10.1074/jbc.M003035200
Hacısalihoğlu, B., Holyavkin, C., Topaloğlu, A., Kısakesen, H. I., and Çakar, Z. P. (2019). Genomic and transcriptomic analysis of a coniferyl aldehyde-resistant Saccharomyces cerevisiae strain obtained by evolutionary engineering. FEMS Yeast Res. 19:foz021. doi: 10.1093/femsyr/foz021
Hallsworth, J. E. (1998). Ethanol-induced water stress in yeast. J. Ferment. Bioeng. 85, 125–137. doi: 10.1016/S0922-338X(97)86756-6
Hohmann, S. (2002). Osmotic stress signaling and osmoadaptation in yeasts. Microbiol. Mol. Biol. Rev. 66, 300–372. doi: 10.1128/MMBR.66.2.300-372.2002
Ingram, L. O., and Buttke, T. M. (1984). Effects of alcohols on micro-organisms. Adv. Microb. Physiol. 25, 253–300.
Jin, D., Gu, B., Xiong, D., Huang, G., Huang, X., Liu, L., et al. (2018). A transcriptomic analysis of Saccharomyces cerevisiae under the stress of 2-phenylethanol. Curr. Microbiol. 75, 1068–1076. doi: 10.1007/s00284-018-1488-y
Jung, Y. H., Kim, S., Jungwoo Yang, J., Seo, J. H., and Kim, K. H. (2017). Intracellular metabolite profiling of Saccharomyces cerevisiae evolved under furfural. Microb. Biotechnol. 10, 395–404. doi: 10.1111/1751-7915.12465
Kaya, A., Karakaya, H. C., Fomenko, D. E., Gladyshev, V. N., and Koc, A. (2009). Identification of a novel system for boron transport: Atr1 is a main boron exporter in yeast. Mol. Cell. Biol. 29, 3665–3674. doi: 10.1128/MCB.01646-08
Kim, B., Cho, B. R., and Hahn, J. S. (2014). Metabolic engineering of Saccharomyces cerevisiae for the production of 2-phenylethanol via Ehrlich pathway. Biotechnol. Bioeng. 111, 115–124. doi: 10.1002/bit.24993
Kitichantaropas, Y., Boonchird, C., Sugiyama, M., Kaneko, Y., Harashima, S., and Auesukaree, C. (2016). Cellular mechanisms contributing to multiple stress tolerance in Saccharomyces cerevisiae strains with potential use in high-temperature ethanol fermentation. AMB Express 6:107. doi: 10.1186/s13568-016-0285-x
Kocaefe-Özşen, N., Yilmaz, B., Alkım, C., Arslan, M., Topaloğlu, A., Kısakesen, H. I., et al. (2022). Physiological and molecular characterization of an oxidative stress-resistant Saccharomyces cerevisiae strain obtained by evolutionary engineering. Front. Microbiol. 13:822864. doi: 10.3389/fmicb.2022.822864
Küçükgöze, G., Alkım, C., Yılmaz, Ü., Kısakesen, H. İ., Gündüz, S., Akman, S., et al. (2013). Evolutionary engineering and transcriptomic analysis of nickel-resistant Saccharomyces cerevisiae. FEMS Yeast Res. 13, 731–746. doi: 10.1111/1567-1364.12073
Kuranda, K., Leberre, V., Sokol, S., Palamarczyk, G., and François, J. (2006). Investigating the caffeine effects in the yeast Saccharomyces cerevisiae brings new insights into the connection between TOR, PKC and Ras/cAMP signaling pathways. Mol. Microbiol. 61, 1147–1166. doi: 10.1111/j.1365-2958.2006.05300.x
Lagorce, A., Hauser, N. C., Labourdette, D., Rodriguez, C., Martin-Yken, H., Arroyo, J., et al. (2003). Genome-wide analysis of the response to cell wall mutations in the yeast Saccharomyces cerevisiae. J. Biol. Chem. 278, 20345–20357. doi: 10.1074/jbc.M211604200
Laviña, W. A., Shahsavarani, H., Saidi, A., Sugiyama, M., Kaneko, Y., and Harashima, S. (2014). Suppression mechanism of the calcium sensitivity in Saccharomyces cerevisiae ptp2Δmsg5Δ double disruptant involves a novel HOG-independent function of Ssk2, transcription factor Msn2 and the protein kinase a component Bcy1. J. Biosci. Bioeng. 117, 135–141. doi: 10.1016/j.jbiosc.2013.06.022
Lawrence, C. W. (1991). Classical mutagenesis techniques. Meth. Enzymol. 194, 273–281. doi: 10.1016/0076-6879(91)94021-4
Lester, G. (1965). Inhibition of growth, synthesis, and permeability in Neurospora crassa by phenethyl alcohol. J. Bacteriol. 90, 29–37. doi: 10.1128/jb.90.1.29-37.1965
Lewis, J. G., Learmonth, R. P., and Watson, K. (1995). Induction of heat, freezing and salt tolerance by heat and salt shock in Saccharomyces cerevisiae. Microbiology 141, 687–694. doi: 10.1099/13500872-141-3-687
Li, H., and Durbin, R. (2009). Fast and accurate short read alignment with Burrows-Wheeler transform. Bioinformatics 25, 1754–1760. doi: 10.1093/bioinformatics/btp324
Lindquist, J. (2016). The most probable number method. 1–4. available at: https://www.jlindquist.com/generalmicro/102dil3a.html (accessed December 17, 2019).
Lu, X., Wang, Y., Zong, H., Ji, H., Zhuge, B., and Dong, Z. (2016). Bioconversion of L-phenylalanine to 2-phenylethanol by the novel stress-tolerant yeast Candida glycerinogenes WL2002-5. Bioengineered 7, 418–423. doi: 10.1080/21655979.2016.1171437
Madeo, F., Herker, E., Maldener, C., Wissing, S., Lächelt, S., Herlan, M., et al. (2002). A caspase-related protease regulates apoptosis in yeast. Mol. Cell 9, 911–917. doi: 10.1016/S1097-2765(02)00501-4
Malcher, M., Schladebeck, S., and Mösch, H. U. (2011). The Yak1 protein kinase lies at the center of a regulatory cascade affecting adhesive growth and stress resistance in Saccharomyces cerevisiae. Genetics 187, 717–730. doi: 10.1534/genetics.110.125708
Martinez-Pastor, M. T., Marchler, G., Schüller, C., Marchler-Bauer, A., Ruis, H., and Estruch, F. (1996). The Saccharomyces cerevisiae zinc finger proteins Msn2p and Msn4p are required for transcriptional induction through the stress response element (STRE). EMBO J. 15, 2227–2235. doi: 10.1002/j.1460-2075.1996.tb00576.x
Mavrommati, M., Daskalaki, A., Papanikolaou, S., and Aggelis, G. (2022). Adaptive laboratory evolution principles and applications in industrial biotechnology. Biotechnol. Adv. 54:107795. doi: 10.1016/j.biotechadv.2021.107795
Mishra, R., Minc, N., and Peter, M. (2022). Cells under pressure: how yeast cells respond to mechanical forces. Trends Microbiol. 30, 495–510. doi: 10.1016/j.tim.2021.11.006
Mitri, S., Koubaa, M., Maroun, R. G., Rossignol, T., Nicaud, J. M., and Louka, N. (2022). Bioproduction of 2-phenylethanol through yeast fermentation on synthetic media and on agro-industrial waste and by-products: a review. Foods. 11:109. doi: 10.3390/foods11010109
Molin, M., Logg, K., Bodvard, K., Peeters, K., Forsmark, A., Roger, F., et al. (2020). Protein kinase A controls yeast growth in visible light. BMC Biol. 18:168. doi: 10.1186/s12915-020-00867-4
Navarro-Aviño, J. P., Prasad, R., Miralles, V. J., Benito, R. M., and Serrano, R. (1999). A proposal for nomenclature of aldehyde dehydrogenases in Saccharomyces cerevisiae and characterization of the stress-inducible ALD2 and ALD3 genes. Yeast 15, 829–842. doi: 10.1002/(SICI)1097-0061(199907)15:10A<829::AID-YEA423>3.0.CO;2-9
Nijkamp, J. F., Broek, M. V. D., Datema, E., de Kok, S., Bosman, L., Luttik, M. A., et al. (2012). De novo sequencing, assembly and analysis of the genome of the laboratory strain Saccharomyces cerevisiae CEN.PK113-7D, a model for modern industrial biotechnology. Microb. Cell Factories 11:36. doi: 10.1186/1475-2859-11-36
Pan, X., and Heitman, J. (2000). Sok2 regulates yeast pseudohyphal differentiation via a transcription factor cascade that regulates cell-cell adhesion. Mol. Cell. Biol. 20, 8364–8372. doi: 10.1128/MCB.20.22.8364-8372.2000
Parrou, J. L., Enjalbert, B., and François, J. (1999). STRE- and cAMP-independent transcriptional induction of Saccharomyces cerevisiae GSY2 encoding glycogen synthase during diauxic growth on glucose. Yeast 15, 1471–1484. doi: 10.1002/(SICI)1097-0061(199910)15:14<1471::AID-YEA474>3.0.CO;2-Q
Parrou, J. L., and François, J. (1997). A simplified procedure for a rapid and reliable assay of both glycogen and trehalose in whole yeast cells. Anal. Biochem. 248, 186–188. doi: 10.1006/abio.1997.2138
Petrenko, N., Chereji, R. V., McClean, M. N., Morozov, A. V., and Broach, J. R. (2013). Noise and interlocking signaling pathways promote distinct transcription factor dynamics in response to different stresses. Mol. Biol. Cell 24, 2045–2057. doi: 10.1091/mbc.e12-12-0870
Pilauri, V., Bewley, M., Diep, C., and Hopper, J. (2005). Gal80 dimerization and the yeast GAL gene switch. Genetics 169, 1903–1914. doi: 10.1534/genetics.104.036723
Pruyne, D., and Bretscher, A. (2000). Polarization of cell growth in yeast. I. Establishment and maintenance of polarity states. J. Cell Sci. 113, 365–375. doi: 10.1242/jcs.113.3.365
R Core Team (2020). R: a language and environment for statistical computing. R Foundation for Statistical Computing. Vienna, Austria. Available at: https://www.R-project.org/
Rachidi, N., Martinez, M. J., Barre, P., and Blondin, B. (2000). Saccharomyces cerevisiae PAU genes are induced by anaerobiosis. Mol. Microbiol. 35, 1421–1430. doi: 10.1046/j.1365-2958.2000.01807.x
Ritchie, M. E., Phipson, B., Wu, D. I., Hu, Y., Law, C. W., Shi, W., et al. (2015). Limma powers differential expression analyses for RNA-sequencing and microarray studies. Nucleic Acids Res. 43:e47. doi: 10.1093/nar/gkv007
Robinson, M. D., Grigull, J., Mohammad, N., and Hughes, T. R. (2002). FunSpec: a web-based cluster interpreter for yeast. BMC Bioinform. 3:35. doi: 10.1186/1471-2105-3-35
Rodriguez-Pena, J. M., Cid, V. J., Arroyo, J., and Nombela, C. (2000). A novel family of cell wall-related proteins regulated differently during the yeast life cycle. Mol. Cell. Biol. 20, 3245–3255. doi: 10.1128/MCB.20.9.3245-3255.2000
Ruepp, A., Zollner, A., Maier, D., Albermann, K., Hani, J., Mokrejs, M., et al. (2004). The FunCat, a functional annotation scheme for systematic classification of proteins from whole genomes. Nucleic Acids Res. 32, 5539–5545. doi: 10.1093/nar/gkh894
Russek, E., and Colwell, R. R. (1983). Computation of most probable numbers. Appl. Environ. Microbiol. 45, 1646–1650. doi: 10.1128/aem.45.5.1646-1650.1983
Saito, H., and Posas, F. (2012). Response to hyperosmotic stress. Genetics 192, 289–318. doi: 10.1534/genetics.112.140863
Sass, P., Field, J., Nikawa, J., Toda, T., and Wigler, M. (1986). Cloning and characterization of the high-affinity cAMP phosphodiesterase of Saccharomyces cerevisiae. Proc. Natl. Acad. Sci. U. S. A. 83, 9303–9307. doi: 10.1073/pnas.83.24.9303
Schmitt, A. P., and McEntee, K. (1996). Msn2p, a zinc finger DNA-binding protein, is the transcriptional activator of the multistress response in Saccharomyces cerevisiae. Proc. Natl. Acad. Sci. U. S. A. 93, 5777–5782. doi: 10.1073/pnas.93.12.5777
Sellick, C. A., Campbell, R. N., and Reece, R. J. (2008). Galactose metabolism in yeast—structure and regulation of the Leloir pathway enzymes and the genes encoding them. Int. Rev. Cell Mol. Biol. 269, 111–150. doi: 10.1016/S1937-6448(08)01003-4
Seward, R., Willetts, J. C., Dinsdale, M. G., and Lloyd, D. (1996). The effects of ethanol, hexan-1-ol, and 2-phenylethanol on cider yeast growth, viability, and energy status; synergistic inhibition. J. Inst. Brew. 102, 439–443. doi: 10.1002/j.2050-0416.1996.tb00928.x
Smith, A., Ward, M. P., and Garrett, S. (1998). Yeast PKA represses Msn2p/Msn4p-dependent gene expression to regulate growth, stress response and glycogen accumulation. EMBO J. 17, 3556–3564. doi: 10.1093/emboj/17.13.3556
Stadler, J. A., and Schweyen, R. J. (2002). The yeast iron regulon is induced upon cobalt stress and crucial for cobalt tolerance. J. Biol. Chem. 277, 39649–39654. doi: 10.1074/jbc.M203924200
Sürmeli, Y., Holyavkin, C., Topaloğlu, A., Arslan, M., Kısakesen, H. I., and Çakar, Z. P. (2019). Evolutionary engineering and molecular characterization of a caffeine-resistant Saccharomyces cerevisiae strain. World J. Microbiol. Biotechnol. 35:183. doi: 10.1007/s11274-019-2762-2
Terzioğlu, E., Alkim, C., Arslan, M., Balaban, B. G., Holyavkin, C., Kısakesen, H. I., et al. (2020). Genomic, transcriptomic and physiological analyses of silver-resistant Saccharomyces cerevisiae obtained by evolutionary engineering. Yeast 37, 413–426. doi: 10.1002/yea.3514
Vargai, P., Cervenansky, I., Mihal, M., and Markos, J. (2018). Design of hybrid systems with in-situ product removal from fermentation broth: case study for 2-phenylethanol production. Chem. Eng. Process. 134, 58–71. doi: 10.1016/j.cep.2018.10.011
Wilkie, D., and Maroudas, N. G. (1969). Induction of cytoplasmic respiratory deficiency in yeast by phenethyl alcohol. Genet. Res. Int. 13, 107–111. doi: 10.1017/S0016672300002792
Xie, Y., and Varshavsky, A. (2001). RPN4 is a ligand, substrate, and transcriptional regulator of the 26S proteasome: a negative feedback circuit. Proc. Natl. Acad. Sci. U. S. A. 98, 3056–3061. doi: 10.1073/pnas.071022298
Yamaguchi-Iwai, Y., Dancis, A., and Klausner, R. D. (1995). AFT1: a mediator of iron regulated transcriptional control in Saccharomyces cerevisiae. EMBO J. 14, 1231–1239. doi: 10.1002/j.1460-2075.1995.tb07106.x
Zagulski, M., Kressler, D., Bécam, A. M., Rytka, J., and Herbert, C. J. (2003). Mak5p, which is required for the maintenance of the M1 dsRNA virus, is encoded by the yeast ORF YBR142w and is involved in the biogenesis of the 60S subunit of the ribosome. Mol. Genet. Genomics 270, 216–224. doi: 10.1007/s00438-003-0913-4
Zheng, Y., Kong, S., Luo, S., Chen, C., Cui, Z., Sun, X., et al. (2022). Improving furfural tolerance of Escherichia coli by integrating adaptive laboratory evolution with CRISPR-enabled trackable genome engineering (CREATE). ACS Sustain. Chem. Eng. 10, 2318–2330. doi: 10.1021/acssuschemeng.1c05783
Keywords: adaptive laboratory evolution, environmental stress response, evolutionary engineering, genomic analysis, 2-phenylethanol, Saccharomyces cerevisiae, stress resistance, transcriptomic analysis
Citation: Holyavkin C, Turanlı-Yıldız B, Yılmaz Ü, Alkım C, Arslan M, Topaloğlu A, Kısakesen Hi, de Billerbeck G, François JM and Çakar ZP (2023) Genomic, transcriptomic, and metabolic characterization of 2-Phenylethanol-resistant Saccharomyces cerevisiae obtained by evolutionary engineering. Front. Microbiol. 14:1148065. doi: 10.3389/fmicb.2023.1148065
Edited by:
Huangen Ding, Louisiana State University, United StatesReviewed by:
Pornthap Thanonkeo, Khon Kaen University, ThailandRyo Nasuno, Nara Institute of Science and Technology (NAIST), Japan
Copyright © 2023 Holyavkin, Turanlı-Yıldız, Yılmaz, Alkım, Arslan, Topaloğlu, Kısakesen, de Billerbeck, François and Çakar. This is an open-access article distributed under the terms of the Creative Commons Attribution License (CC BY). The use, distribution or reproduction in other forums is permitted, provided the original author(s) and the copyright owner(s) are credited and that the original publication in this journal is cited, in accordance with accepted academic practice. No use, distribution or reproduction is permitted which does not comply with these terms.
*Correspondence: Jean Marie François, ZnJhbl9qbUBpbnNhLXRvdWxvdXNlLmZy; Z. Petek Çakar, Y2FrYXJwQGl0dS5lZHUudHI=
†Present address: Ceren Alkım, Toulouse Biotechnology Institute, CNRS, INRA, INSA, Toulouse, France Mevlüt Arslan, Department of Genetics, Faculty of Veterinary Medicine, Van Yüzüncü Yıl University, Van, Turkey