 Jing Li
 Zhihao Cui1
- 1College of Animal Science and Technology, Nanjing Agricultural University, Nanjing, China
- 2Department of Zoology, College of Science, King Saud University, Riyadh, Saudi Arabia
Cold stress is a significant environmental stimulus that negatively affects the health, production, and welfare of animals and birds. However, the specific effects of cold stimulation combined with lipopolysaccharide (LPS) on the mouse intestine remain poorly understood. Therefore, we designed this research to explore the effect of cold stimulation + LPS on mice intestine via microbiome and microbiota sequencing. Forty-eight mice were randomly divided into four experimental groups (n = 12): Control (CC), LPS-induced (CL), cold normal saline-induced (MC) and LPS + cold normal saline-induced (ML). Our results showed body weight was similar among different groups of mice. However, the body weight of mice in groups CC and CL were slightly higher compared to those in groups MC and ML. The results of gene expressions reflected that CL and ML exposure caused gut injury and barrier dysfunction, as evident by decreased ZO-1, OCCLUDIN (P < 0.01), and CASPASE-1 (P < 0.01) expression in the intestine of mice. Moreover, we found that cold stress induced oxidative stress in LPS-challenged mice by increasing malondialdehyde (MDA) accumulation and decreasing the antioxidant capacity [glutathione peroxidase (GSH-Px), superoxide dismutase (SOD), total and antioxidant capacity (T-AOC)]. The cold stress promoted inflammatory response by increased IL-1β in mice treated with cold normal saline + LPS. Whereas, microbiome sequencing revealed differential abundance in four phyla and 24 genera among the mouse groups. Metabolism analysis demonstrated the presence of 4,320 metabolites in mice, with 43 up-regulated and 19 down-regulated in CC vs. MC animals, as well as 1,046 up-regulated and 428 down-regulated in ML vs. CL animals. It is Concluded that cold stress enhances intestinal damage by disrupting the balance of gut microbiota and metabolites, while our findings contribute in improving management practices of livestock in during cold seasons.
Introduction
Cold stress is an important environmental stimulation factor to animals and human beings in cold regions and during wintertime in other regions, which bring negative effects on health, production and welfare of animals and birds (Wei et al., 2018; Liu et al., 2022). Previous studies found that cold stimulation effect the productivity, oxidative resistance and immune dysfunction (Li et al., 2020; Liu et al., 2022). The enteric canal is a useful organ for nutrient absorption and regulation of immune function (Lee et al., 2018), and this organ is sensitive to stressors like cold stimulation, which cause inflammation reactions, oxidative stress, and intestinal injury in animals (Fu et al., 2013; Zhao et al., 2013). Many intestinal pathogens are related to stress like inflammatory bowel disease and injury (Lee et al., 2018). Water is important for body health and physiological activities, but it is reported that weaned piglets drinking warm (30°C) water has a better feed-to-weight ratio than those drinking cold (13°C) water (Zhang et al., 2020), which implied that low-temperature drinking water is a cold stress factor. Lipopolysaccharide (LPS) is a pathogenic component derived from gram-negative bacteria, which produce an immune response and lead to injury through oxidative damage (Meng et al., 2022). LPS is widely used to induce enteric canal inflammation and oxidative damage in different animals (Hassan et al., 2021; Feng et al., 2023).
Gut microbiota comprises of trillions of microorganisms, such as archaea, parasites, fungi, viruses, and bacteria (Naibaho et al., 2021; Ruigrok et al., 2023). These microorganisms contribute to the absorption and metabolism of nutrition, protect against pathogens, and is helpful to develop host’s immune system (Nishida et al., 2018). Gut dysbiosis is commonly linked with intestinal diseases like irritable bowel syndrome (Nishino et al., 2018), inflammatory bowel disease (Matsuoka and Kanai, 2015), and salmonellosis (Aljahdali et al., 2020). Previous studies have confirmed an intestinal imbalance in LPS-induced animals (Chen et al., 2022; Ruan et al., 2022; Wang et al., 2022).
Lipopolysaccharide is known as a major activator of the inflammatory response, it binds to toll-like receptor 4 (TLR4), activates nuclear factor kappa B (NF-κB) and enhances the inflammation through the production of pro-inflammatory cytokines and injury to endothelial cells (Joo et al., 2016). In rat and rabbit animal models, LPS-induced systemic inflammation is depend on several factors including ambient temperature and LPS dose (Romanovsky et al., 2005). At a low temperature (cold stress), low doses of LPS causes fever and several sequential, while at neutral temperature even high doses of LPS cause low fever and less detrimental effects (Romanovsky et al., 2005; Rudaya et al., 2005).
Thus, we hypothesized that exposure to cold temperature is a factor that aggravates inflammation. To evaluate this hypothesis, we investigated the effect of cold stress on the severity of inflammatory responses due to LPS in mouse model. Therefore, we examined the impact of cold stress and LPS on the mouse intestine via microbiome and microbiota sequencing.
Materials and methods
Animals, experimental design and sample collection
A total of 48 four-week-old ICR mice (24 males and 24 females) with a middle weight of 18 ± 2.2 g was purchased from Qinglongshan Animal Breeding (Nanjing, China). After 3-day of acclimatization period, mice were randomly divided into four groups: control group (CC), LPS-induced group (CL), cold normal saline-induced group (MC), and LPS + cold normal saline-induced group (ML) as shown in Figure 1. Mice in group CC and CL were administered room temperature normal saline (25°C) by gavage from day 4th to 31st, while LPS was administered only in CL group on 32nd day. Whereas, mice in group MC and ML were administered cold normal saline (4°C) at a dosage of 0.5 mL per mouse every 2 h for four times daily to induce cold stress from day 4th to 31st, while LPS was administered only in ML group on 32nd day. On day 32nd, mice in groups CL and ML were infected with 20 mg/kg LPS (Solarbio life science, China) according to previous study (Chen et al., 2022). All the groups were kept and reared on same ambient temperature at 25°C throughout the experimental period from day 1st to 32nd. After 1-day of LPS administration on 33rd day, the mice in all the groups were euthanized to collect serum, heart, liver, kidney, lung, spleen, stomach, jejunum, ileum, cecum, colon, and rectum. The mice were provided the Pellet diet and water ad libitum throughout the experimental, and daily body weights and diarrhea were also recorded.
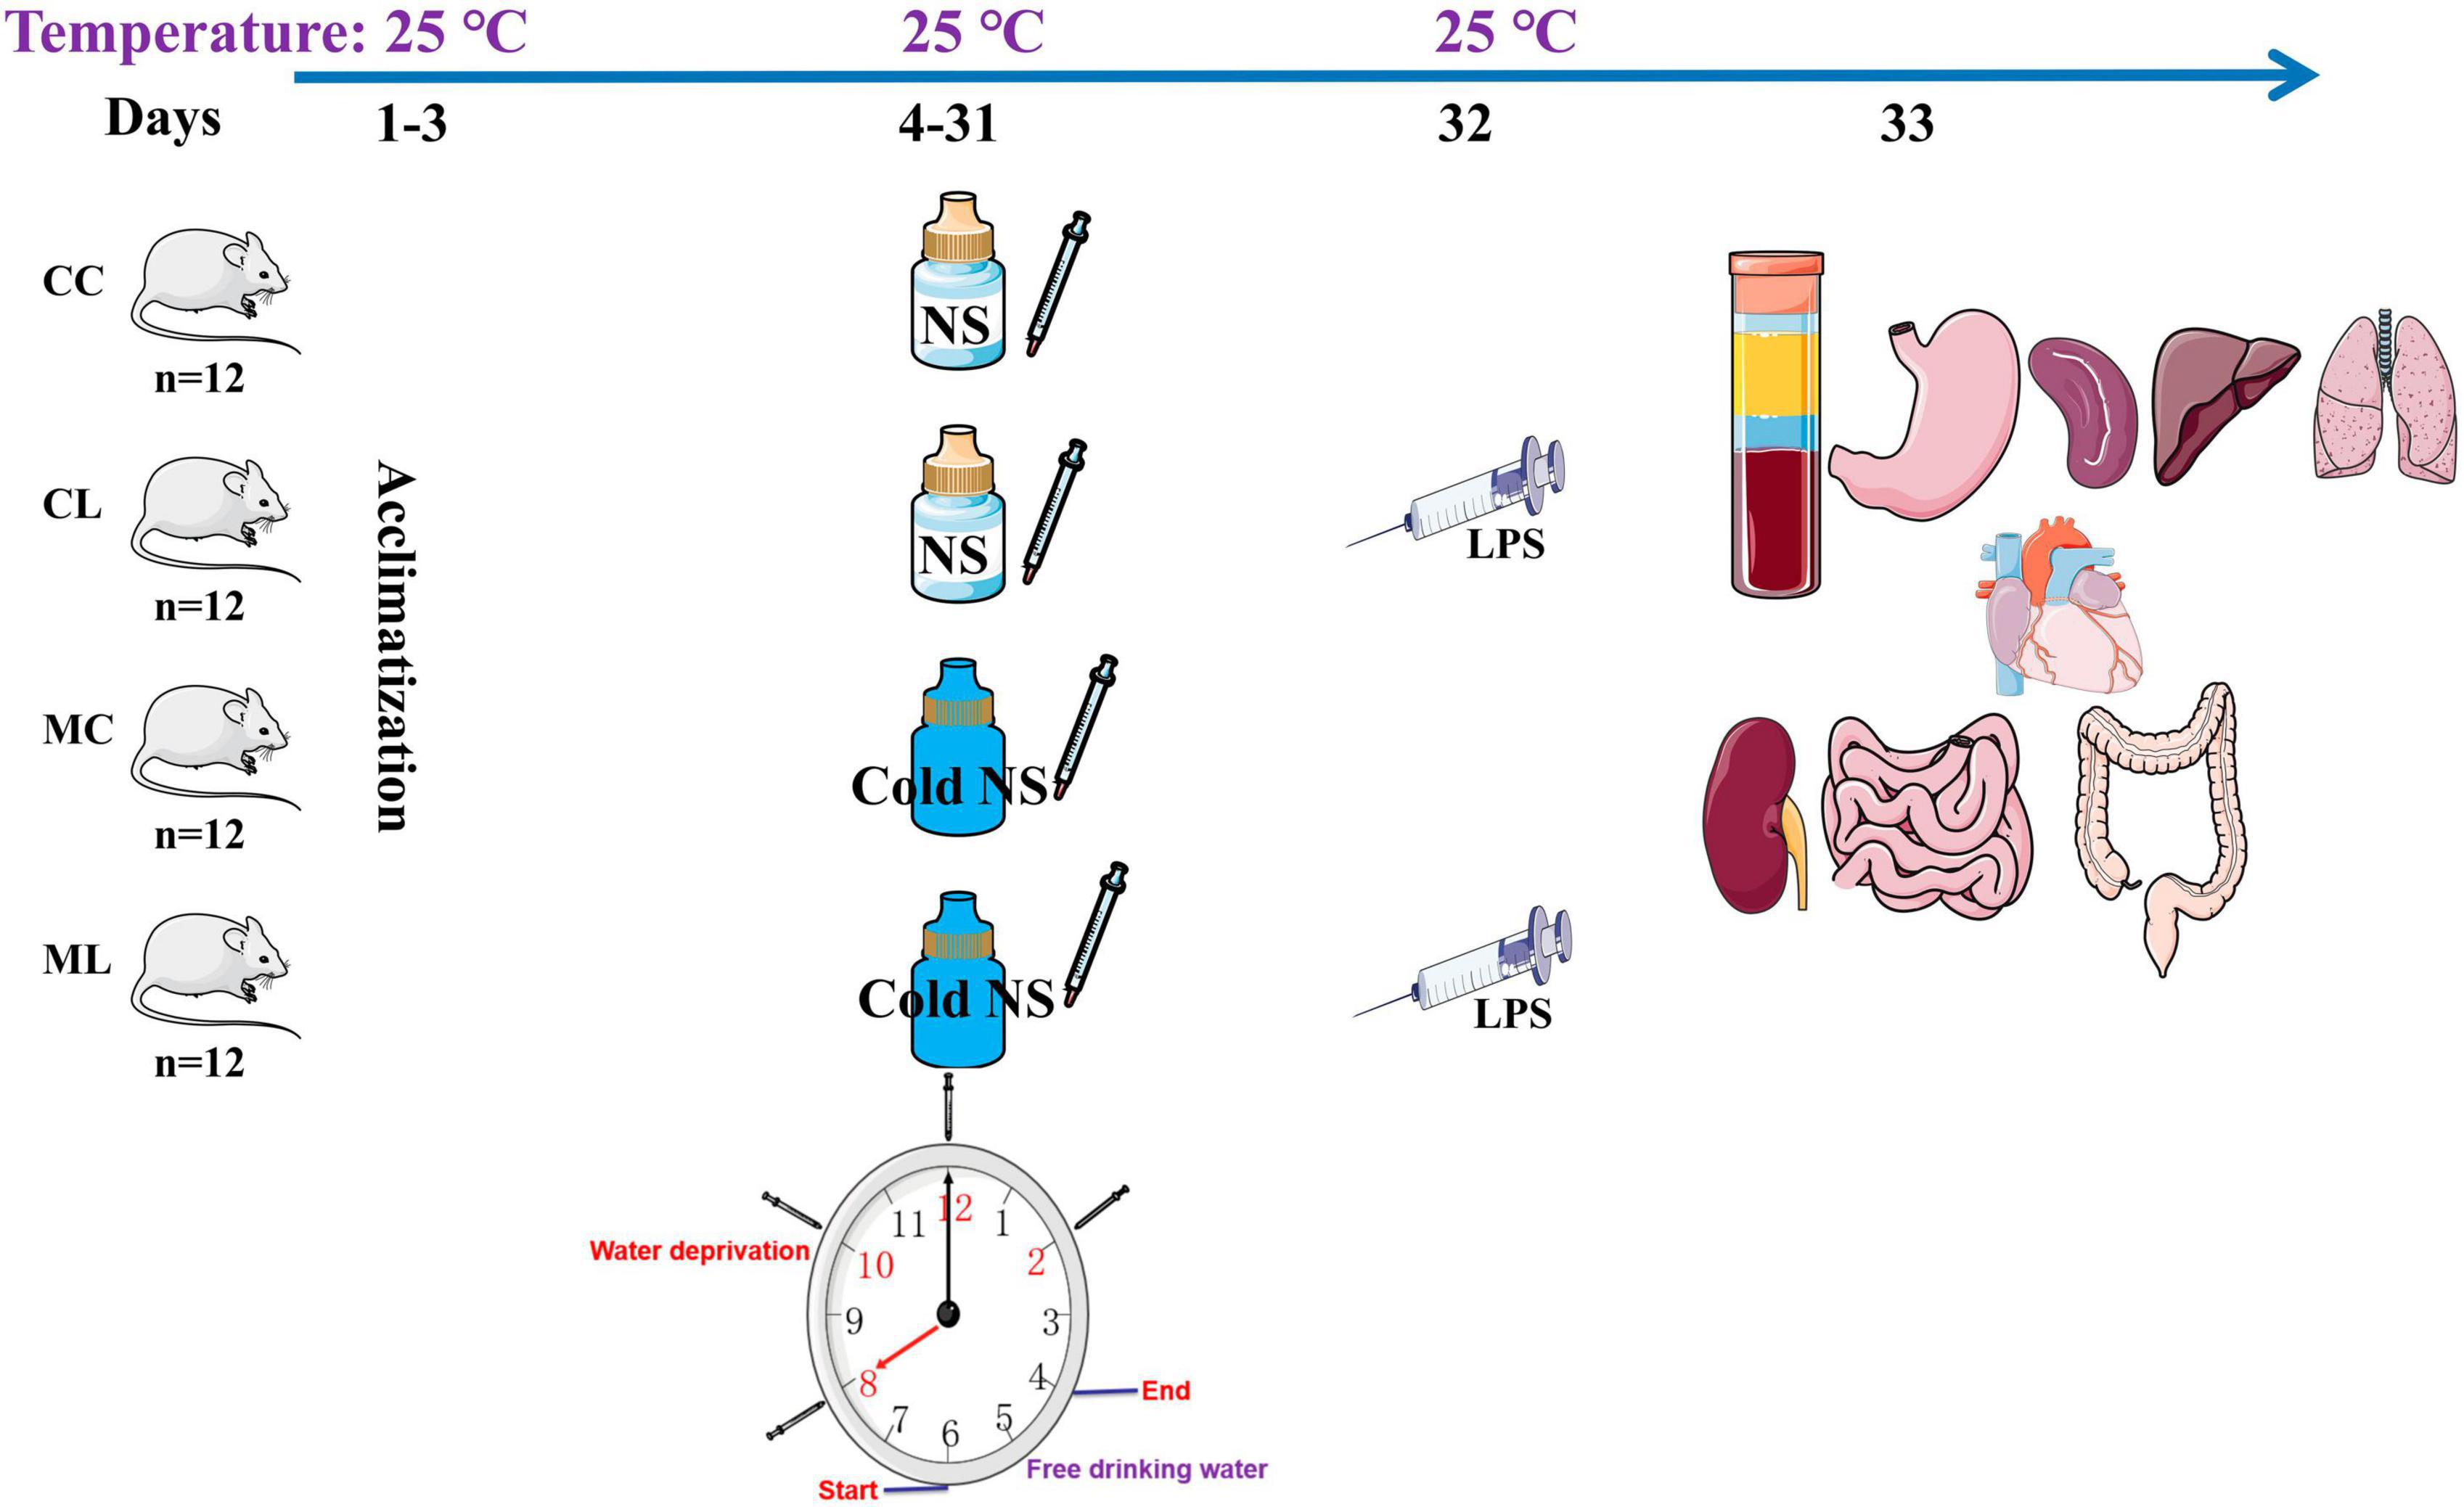
Figure 1. Research design diagram of the present experiment.
Hematoxylin and eosin staining
Tissue samples including the spleen, stomach, jejunum, ileum, cecum, and colon, were collected from mice of all the groups and fixed in 4% paraformaldehyde for 24 h and subjected to H&E staining. The tissues fixed in the formalin were processed further to observe the histopathological lesions by following the routinely used procedures like dehydrations, embedding, sectioning, mounting and staining. Thick sections of the tissues about 4–5 μm were cut and stained by the Hematoxylin and Eosin staining techniques. The histological sections were examined using a CX23 microscope (Olympus Co., Tokyo, Japan). The villus height and crypt depth of each selected mouse were measured following the methods described by Chen et al. (2022).
Antioxidant indexes, NO, and cytokine levels examination
The serums obtained from mice were kept at −20°C for further assays. For the antioxidant capacity indexes, superoxide dismutase, glutathione peroxidase, total anti-oxidation capacity, NO, and malondialdehyde were measured using commercially available kits following the manufacturer’s instructions (Nanjing Jiancheng Bioengineering Research Institute Co., Ltd., China). Tumor necrosis factor (TNF-α), interleukin 1 beta (IL-1β), interleukin-6 (IL-6) and IL-10 were detected in the blood serum of mice through specific kits (Solarbio life science, China).
Gut microbiome analysis
Mice rectums of all the groups (CC, CL, MC, and ML) were used to extract genomic DNA (gDNA) by employing the GenElute™ Microbiome DNA Purification Kit (Sigma-Aldrich, Germany), following the manufacturers instructions. The concentration and integrity of the DNA products were surveyed via NanoDrop 2000 spectrophotometer (Thermo Scientific, USA) and agarose gel electrophoresis. The targeting regions of the microbial 16S rRNA (V3-V4) gene were amplified using the forward primer 338F (5′-ACTCCTACGGGAGGCAGCAG-3′) and the reverse primer 806R (5′-GGACTACHVGGGTWTCTAAT-3′). Subsequently, amplicon sequencing of the ICR animals was conducted using the Illumina platform at Bioyi Biotechnology Co., Ltd., as described in previous studies (Chen et al., 2022; Dong et al., 2023). Following sequencing, Trimmomatic, Cutadapt, QIIME2, and DADA2 were utilized to generate accurate and reliable data for subsequent bioinformatic analysis (Edgar, 2013; Callahan et al., 2016; Bolyen et al., 2019). High-quality sequences with a similarity threshold of 97% were clustered into operational taxonomic units (OTUs) using USEARCH (Edgar, 2013) and assigned taxonomic annotations by aligning them with the SILVA database (Bolyen et al., 2019). A Venn map was constructed to identify the shared OTUs among the groups following the previous method (Chen and Boutros, 2011). The annotation of the microbial communities was visually displayed using KRONA software as outlined by Ondov et al. (2011). Alpha diversity metrics, including Chao1, Ace, Shannon, Simpson, and PD_whole_tree, were calculated to assess the individual microbial diversity. Beta diversity analysis, including Principal Component Analysis, Principal Coordinates Analysis, Non-Metric Multi-Dimensional Scaling, Unweighted Pair-group Method with Arithmetic Mean, and heat maps were performed to examine the variation in microbial communities across samples. These analyses were carried out using QIIME2 and R software as described by Bolyen et al. (2019). To uncover distinctive bacteria among the groups, we utilized various statistical methods and tools including analysis of variance, Wilcoxon rank-sum test, ternary phase diagram, Linear discriminant analysis Effect Size, Metastats, and statistical analysis of Metagenomic Profiles (White et al., 2009; Segata et al., 2011; Parks et al., 2014). Network analysis was performed using R to explore potential correlations among bacterial taxa. Additionally, the prediction of microbiota functional potential was conducted using PICRUSt2, targeting the Kyoto Encyclopedia of Genes and Genomes and Cluster of Orthologous Groups databases (Kanehisa and Goto, 2000; Langille et al., 2013).
Metabolomics analysis
Metabolites from rectum samples (n = 6) of each group were extracted and subjected to metabolomics analysis via LC/MS (Dunn et al., 2011; Wang et al., 2016). Raw data processing and annotation were performed using MassLynx and Progenesis QI software (Wang et al., 2016). Spearman rank correlation and PCA were conducted to ensure the validity of current results. The annotation of metabolites was carried out using the KEGG, HMDB, and Lipidmaps databases (Fahy et al., 2007; Wishart et al., 2018).
Venn diagrams, PCA, and OPLS-DA were performed to investigate the variation between and within the groups (Chen et al., 2020). Remarkable differences in metabolomics among the mice groups were identified based on the variable importance in projection (VIP) values (>1) combined with statistical significance (P < 0.05). The differential metabolomics was described using multiple methods, including bar charts illustrating fold differences, volcano plots, cluster heatmaps, correlation graphs, z-score diagrams, radar charts and violin plots.
qRT-PCR analysis
RNA extraction was performed from jejunum and ileum tissues of all the animals using Trizol reagent (Life Technologies, USA), and then the quality and quantity of RNA products were inspected via gel electrophoresis and Nanodrop 2000 (Thermo Fisher Scientific, China). The cDNA synthesis was carried out using Invitrogen™ kits (Thermo Fisher Scientific, USA), followed by RT-PCR analysis using 2X SYBR Green Fast qPCR Mix (ABclonal, China). The analysis was conducted using the StepOnePlus™ RT-PCR System (Applied Biosystems, USA). Three independently repeated reactions were performed for each mouse sample, and the relative quantification of genes was determined by using 2–ΔΔCT method. The primers information is shown in Table 1.
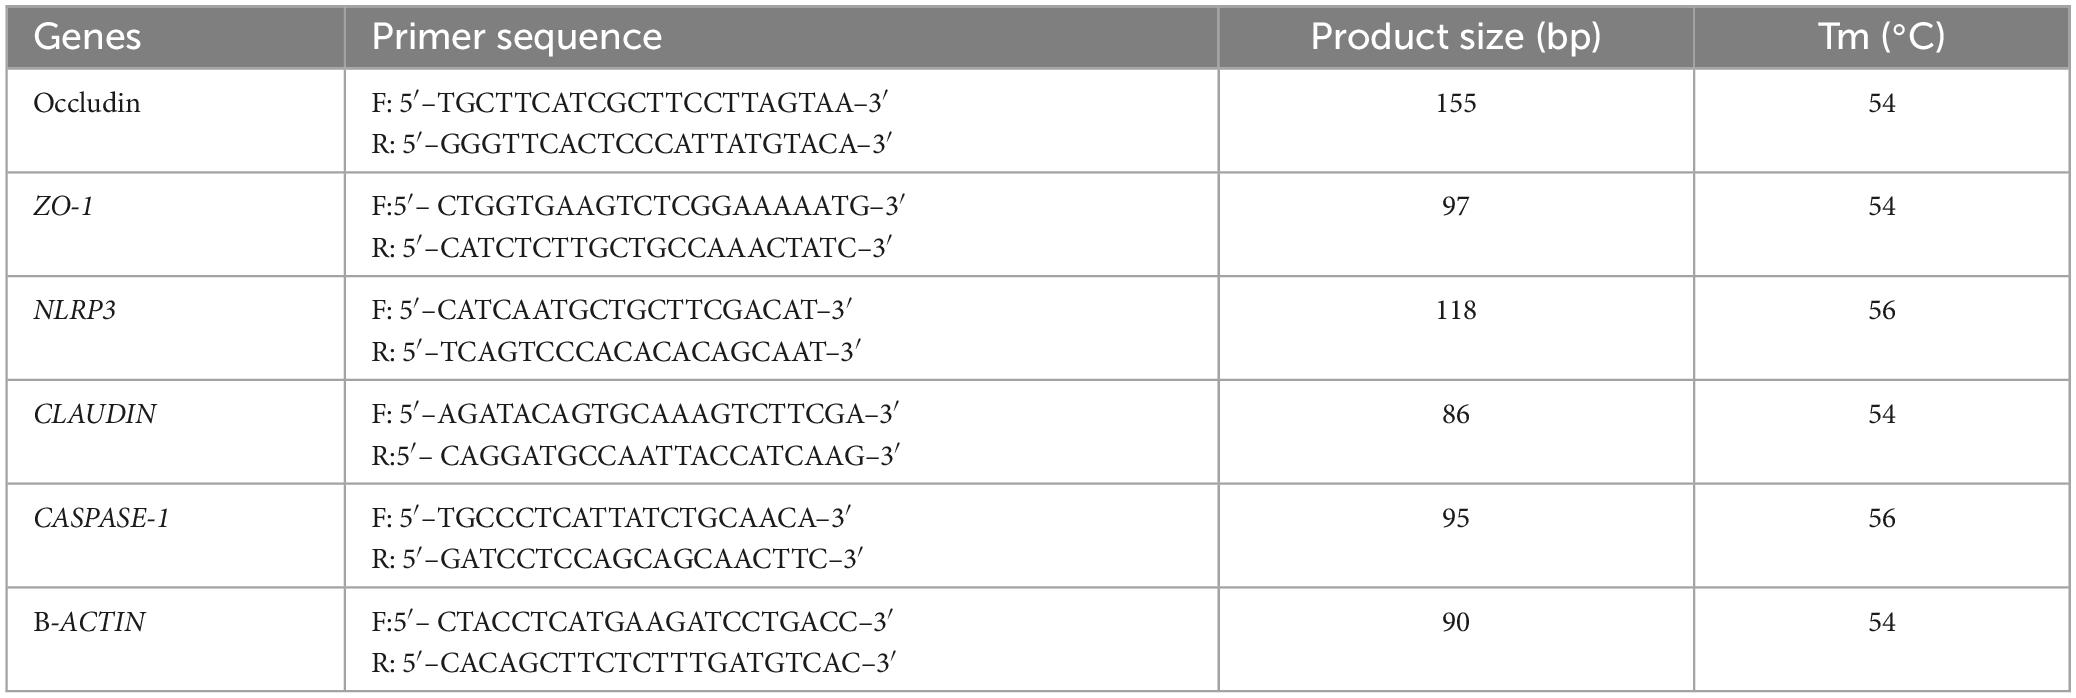
Table 1. Primers used in the present study.
Statistical analysis
Analysis of variance (ANOVA) and Student’s t-test were employed to analyze the data. The statistical analysis was conducted using IBM SPSS software (version 26.0). The data are presented as means ± standard deviation (SD), and P < 0.05 was considered statistically significant.
Results
The effects of LPS on mice body weights, organ indexes, and intestines damage
Similar body weight was observed in mice among all the experimental groups. However, the mice in groups CC and CL had slightly higher body weights compared to the mice in groups MC and ML (Figure 2A) but the difference is not significant (P > 0.05). Similarly, there was no prominent difference (P > 0.05) in the organ index between mouse groups (Figure 2B). Histopathological analysis revealed that LPS administration in groups CL and ML severely damaged the integrity of intestinal villi and gastric epithelium. The villus length was obviously shorter (p < 0.05) and crypt depth was observably longer (p < 0.05) in these mice, especially in animals in ML (Supplementary Figure 1).
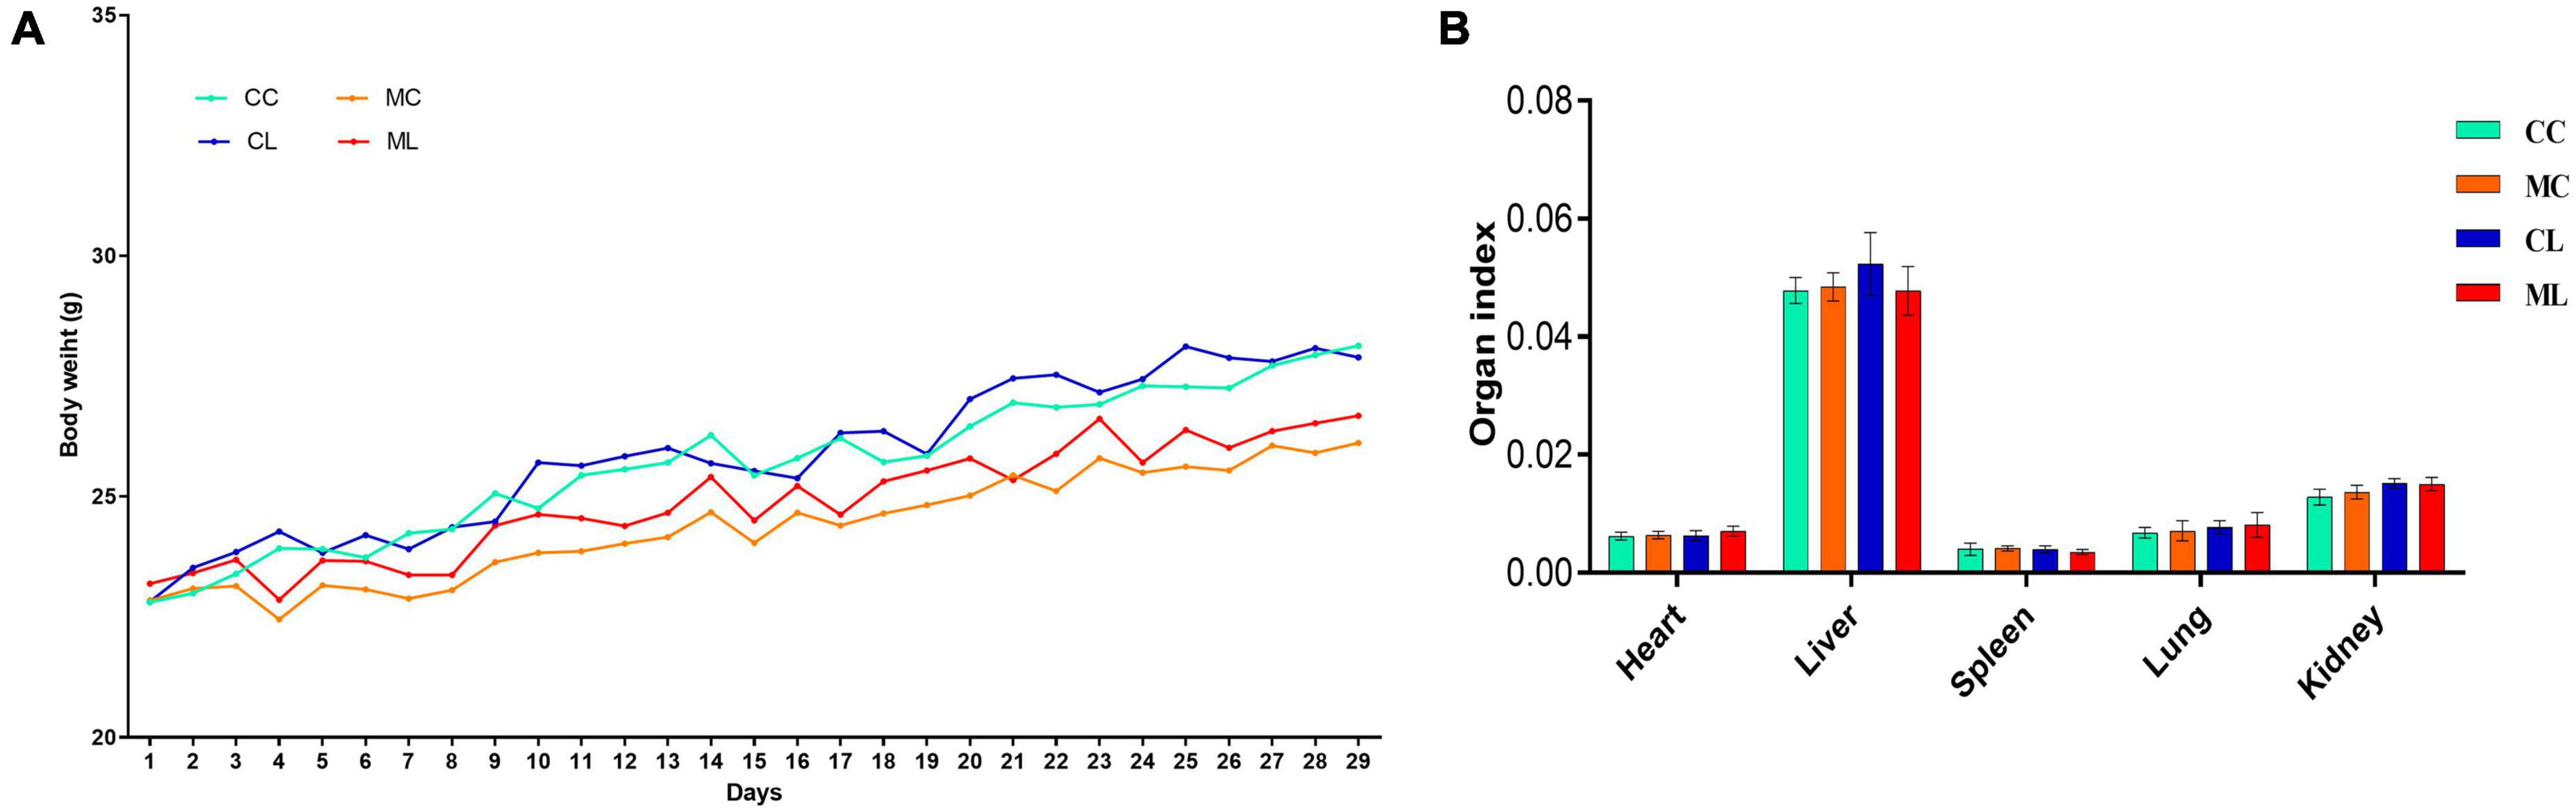
Figure 2. Effects of LPS on mice body weights (A) and organ indexes (B). Scale bar 50 μm. Data were presented as the mean ± SEM (n = 3).
Additionally, the spleens of LPS-induced mice showed enlarged red pulps and increased leukomonocytes (Figure 3).
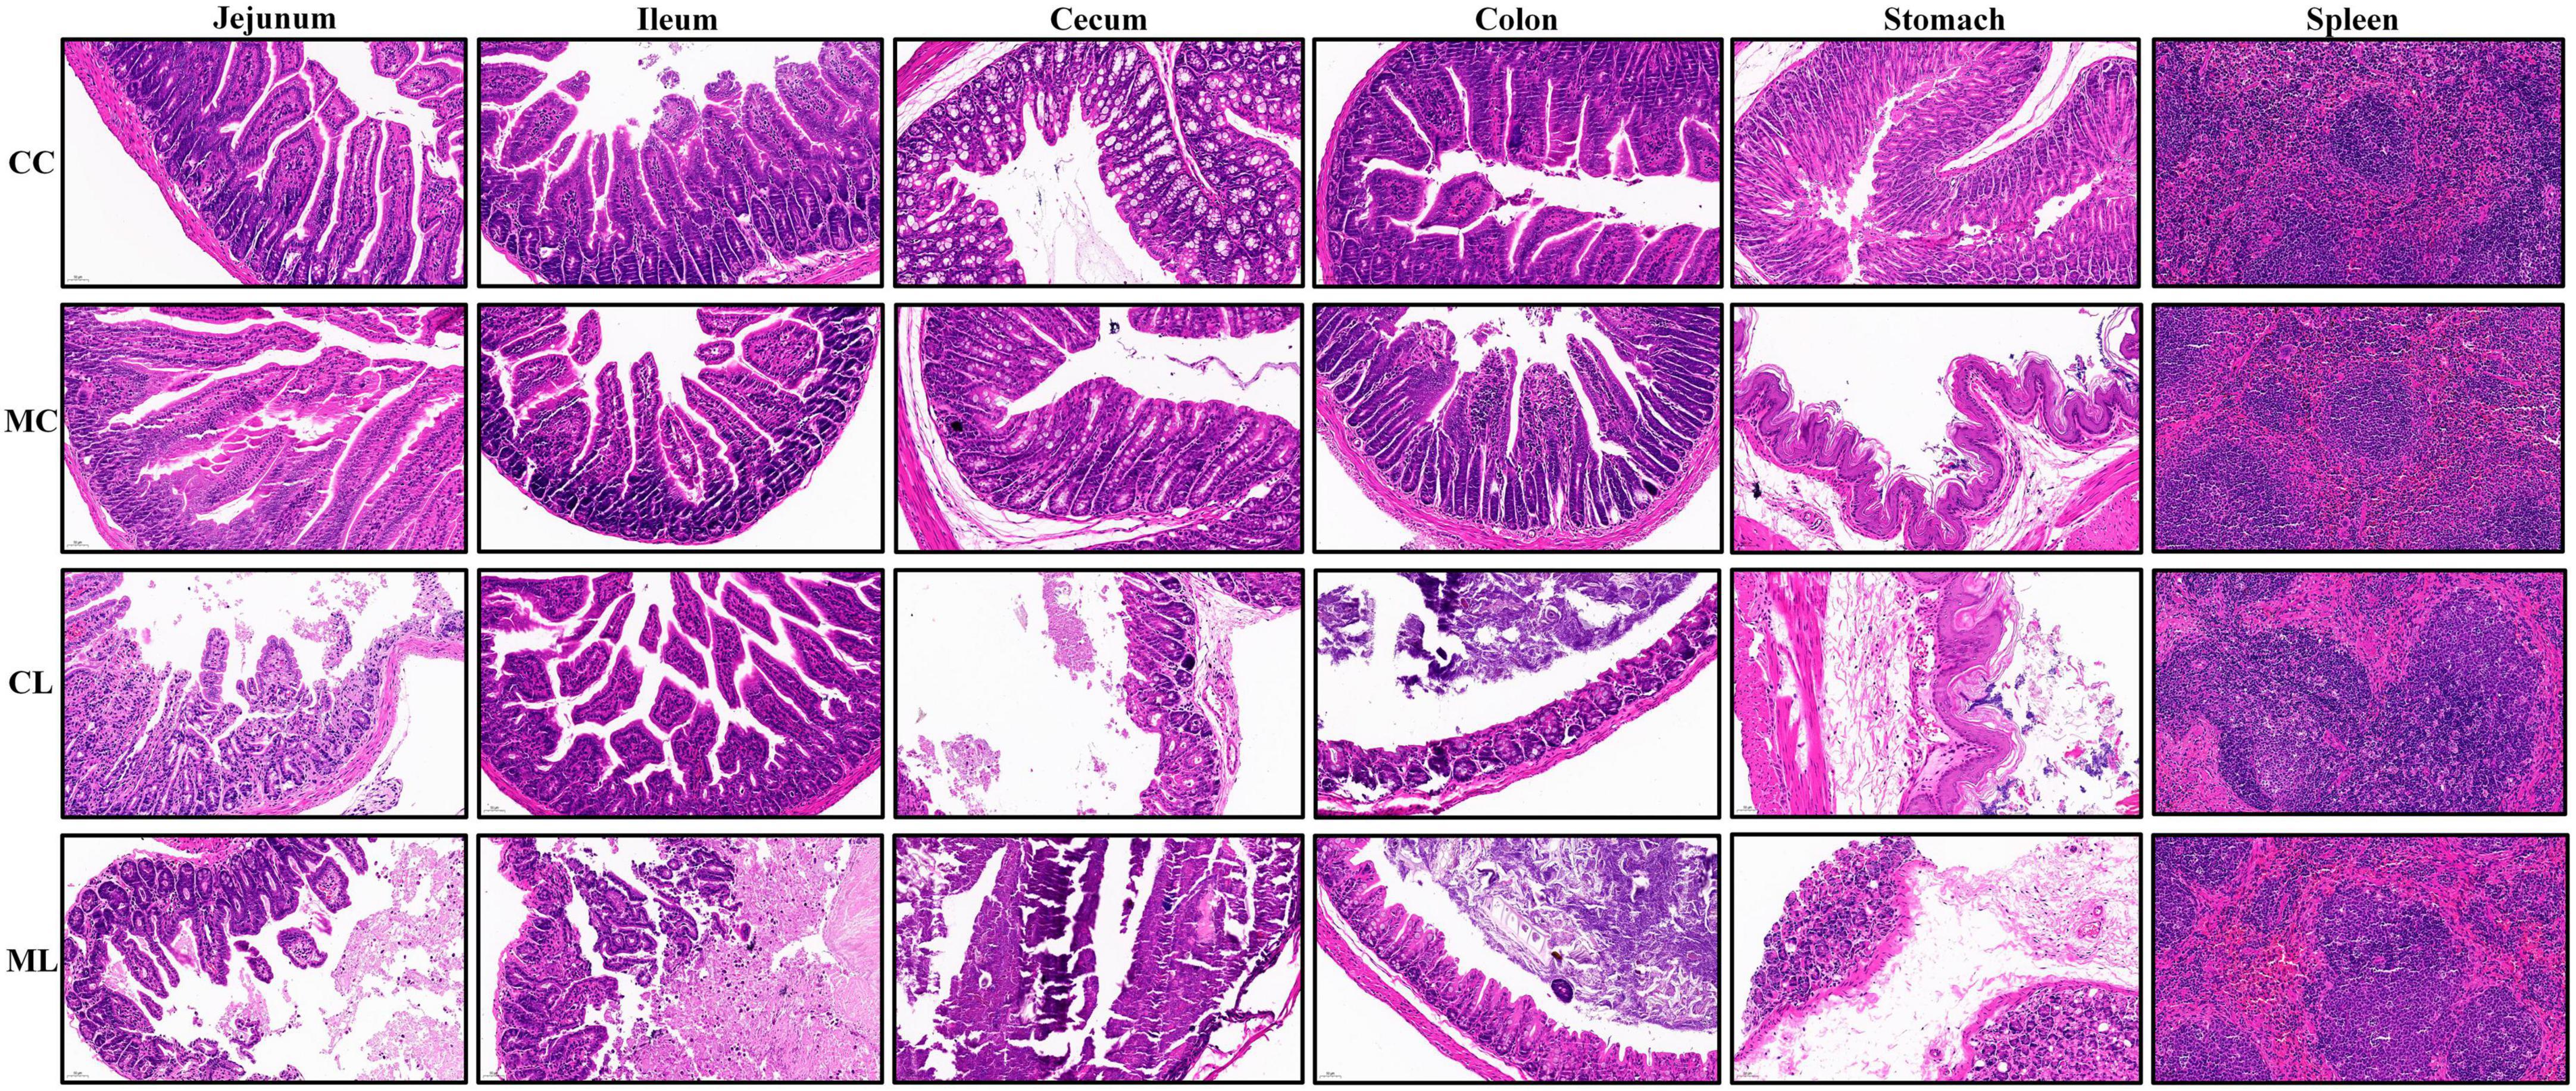
Figure 3. LPS caused damages in intestines, stomach and spleen in mice.
The effects of cold normal saline stress on LPS induced mice on antioxidant indexes, NO and cytokine levels in serum
The antioxidant indexes, including T-AOC, GSH-Px, and SOD were significantly (P < 0.05) lower in mice challenged with LPS and prolonged cold stress exposure compared with other groups. Conversely, the MDA level was markedly higher (P < 0.01) in mice particularly in the group treated with cold normal saline + LPS. Whereas, the level of nitric oxide (NO) and interleukin-10 (IL-10) were examined in different groups but the differences were non-significant (P > 0.05) in all the groups. However, the cytokines TNF-α and IL-6 (P < 0.01) were expressed higher significantly (P < 0.05) in mice challenged with LPS and prolonged cold stress exposure compared with other groups. Furthermore, IL-1β level was similar between groups CC and CL, but it was significantly (P < 0.05) elevated in mice treated with cold normal saline + LPS (Figure 4).
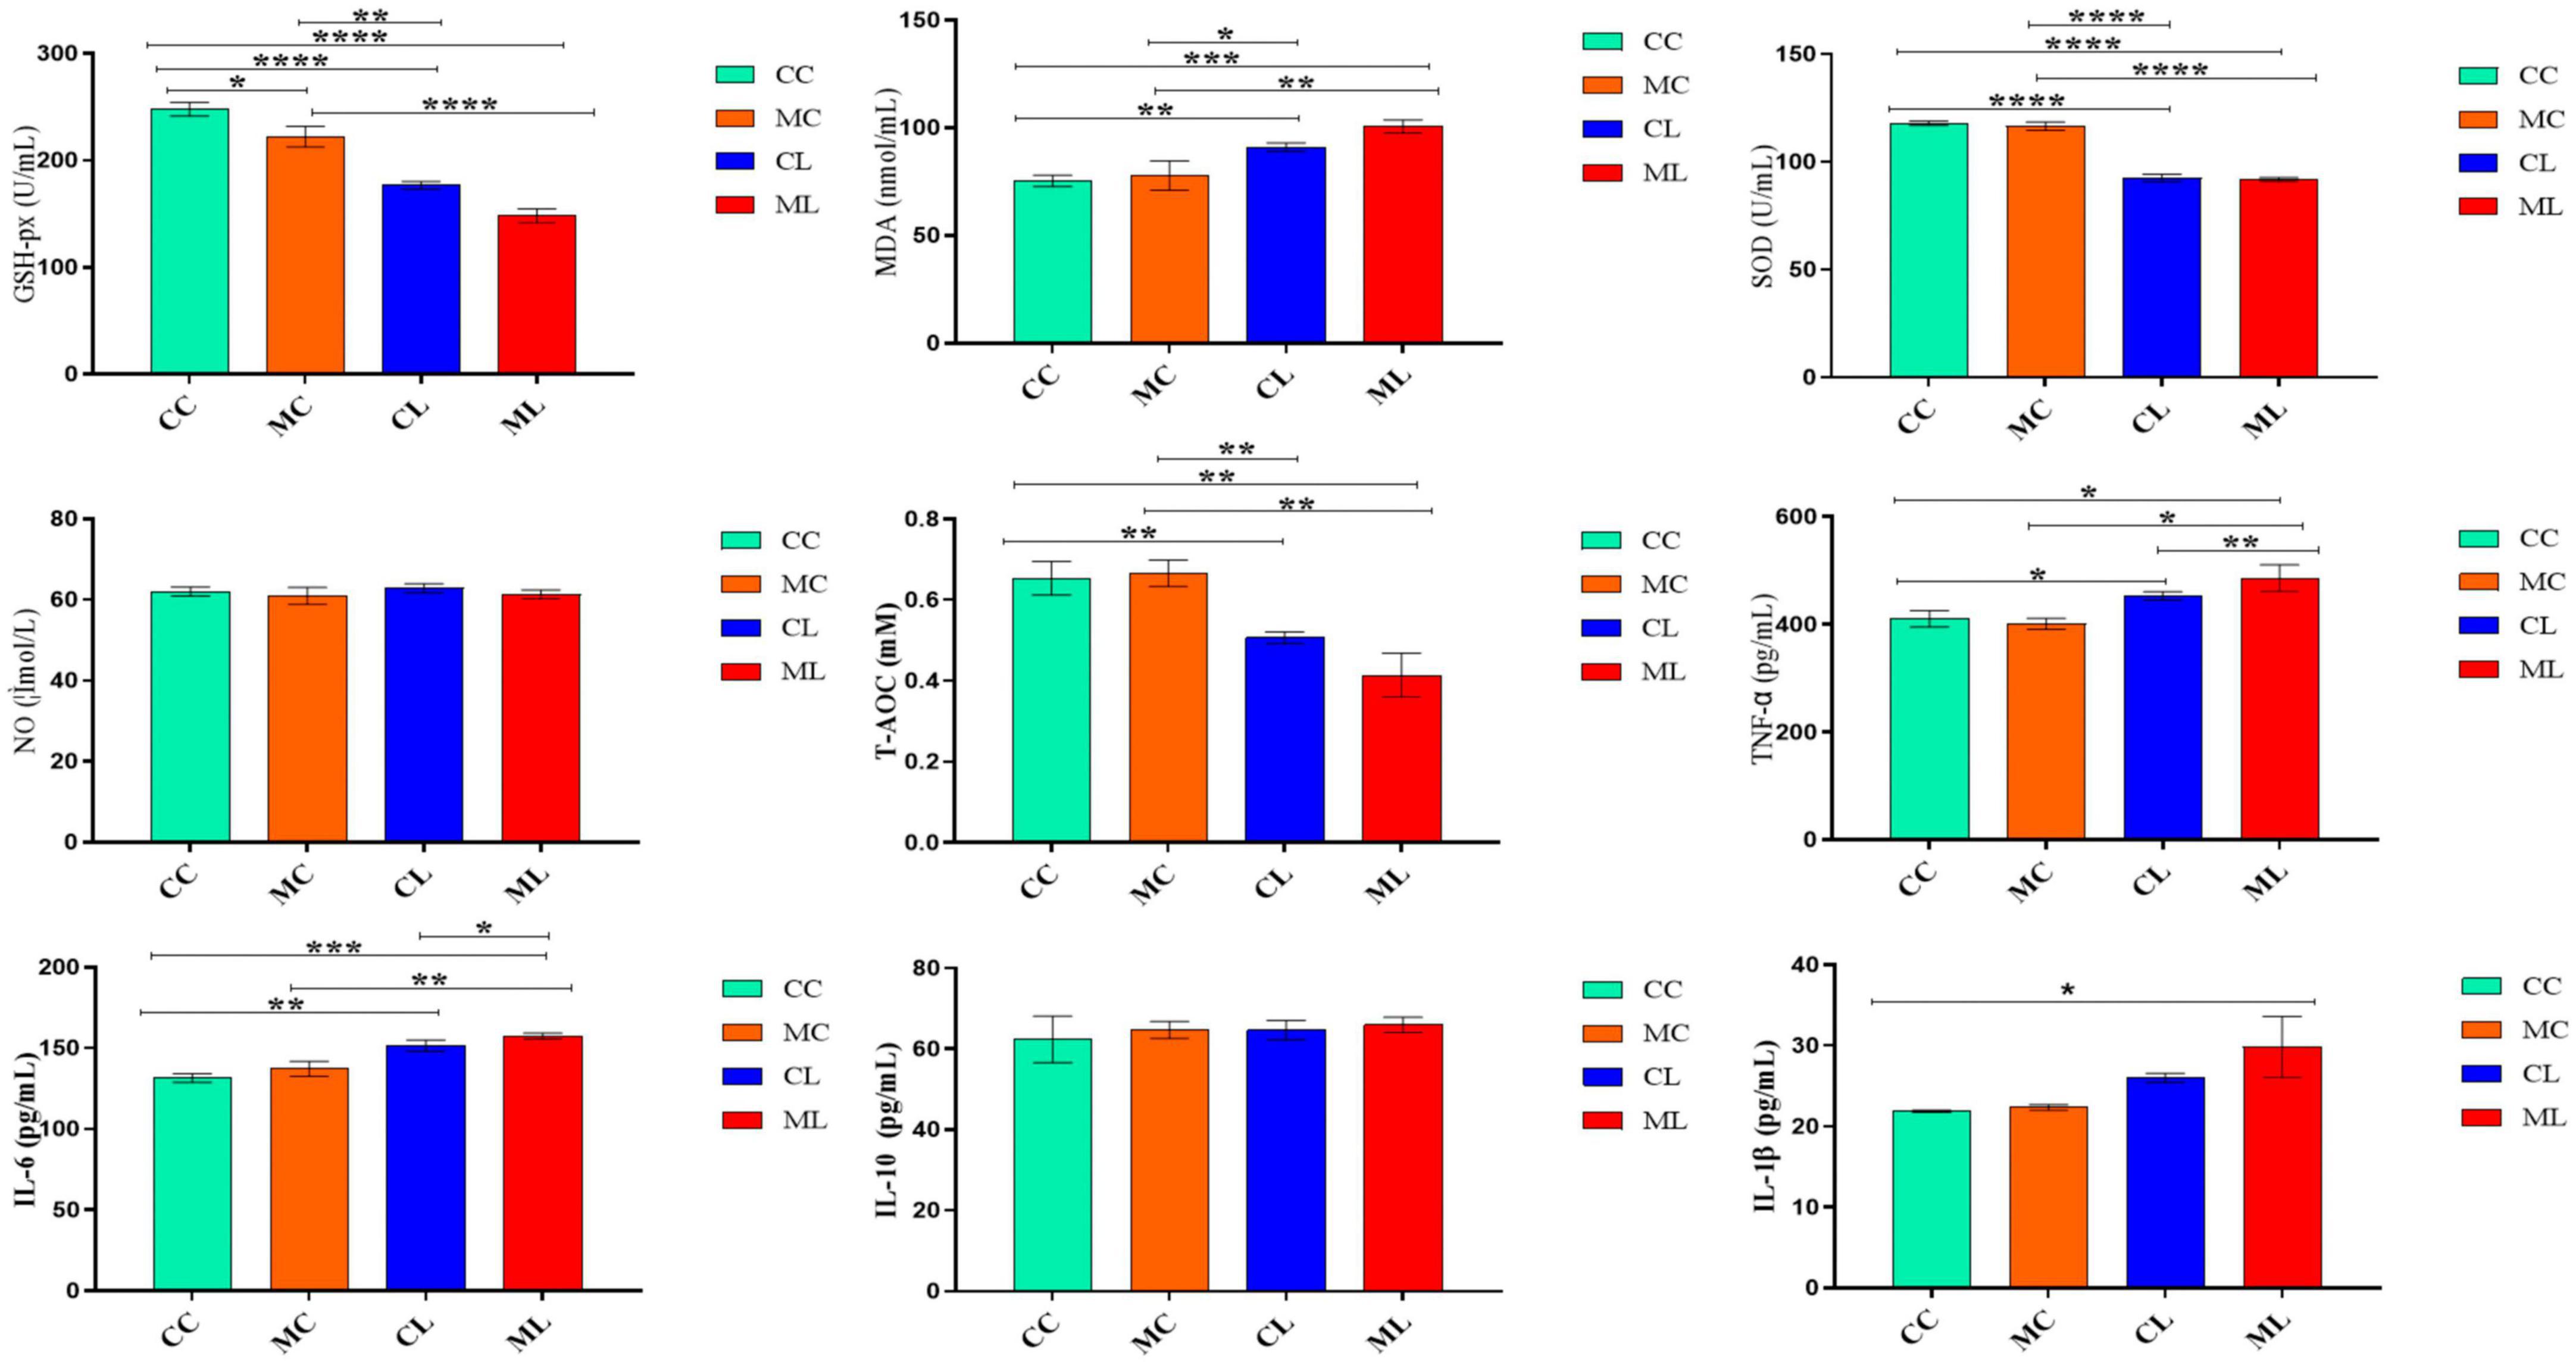
Figure 4. The effects of LPS on antioxidant indexes, NO and cytokine levels in serum. Significance is presented as *p < 0.05, **p < 0.01, ***p < 0.001, and ****p < 0.0001; data are presented as the mean ± SEM (n = 6).
The effects of cold normal saline stress on LPS induced mice on related genes’ expressions
The expression levels of ZO-1, OCCLUDIN, and CLAUDIN in the jejunum were significantly (P < 0.05) decreased in mice challenged with LPS and cold stress as compared to other groups. Conversely, the expression levels of CASPASE-1 and NLRP3 were significantly increased (P < 0.05) in CL and ML groups compared with CC and MC groups (Figure 5A). Similar results were observed in the ileum in which ZO-1, OCCLUDIN and CLAUDIN expressions were significantly (P < 0.05) decreased in CL and ML groups compared with CC and MC groups. Whereas, the expression levels of CASPASE-1 and NLRP3 were significantly increased (P < 0.05) in mice challenged with LPS and prolonged cold stress exposure as compared to CC and MC groups (Figure 5B).
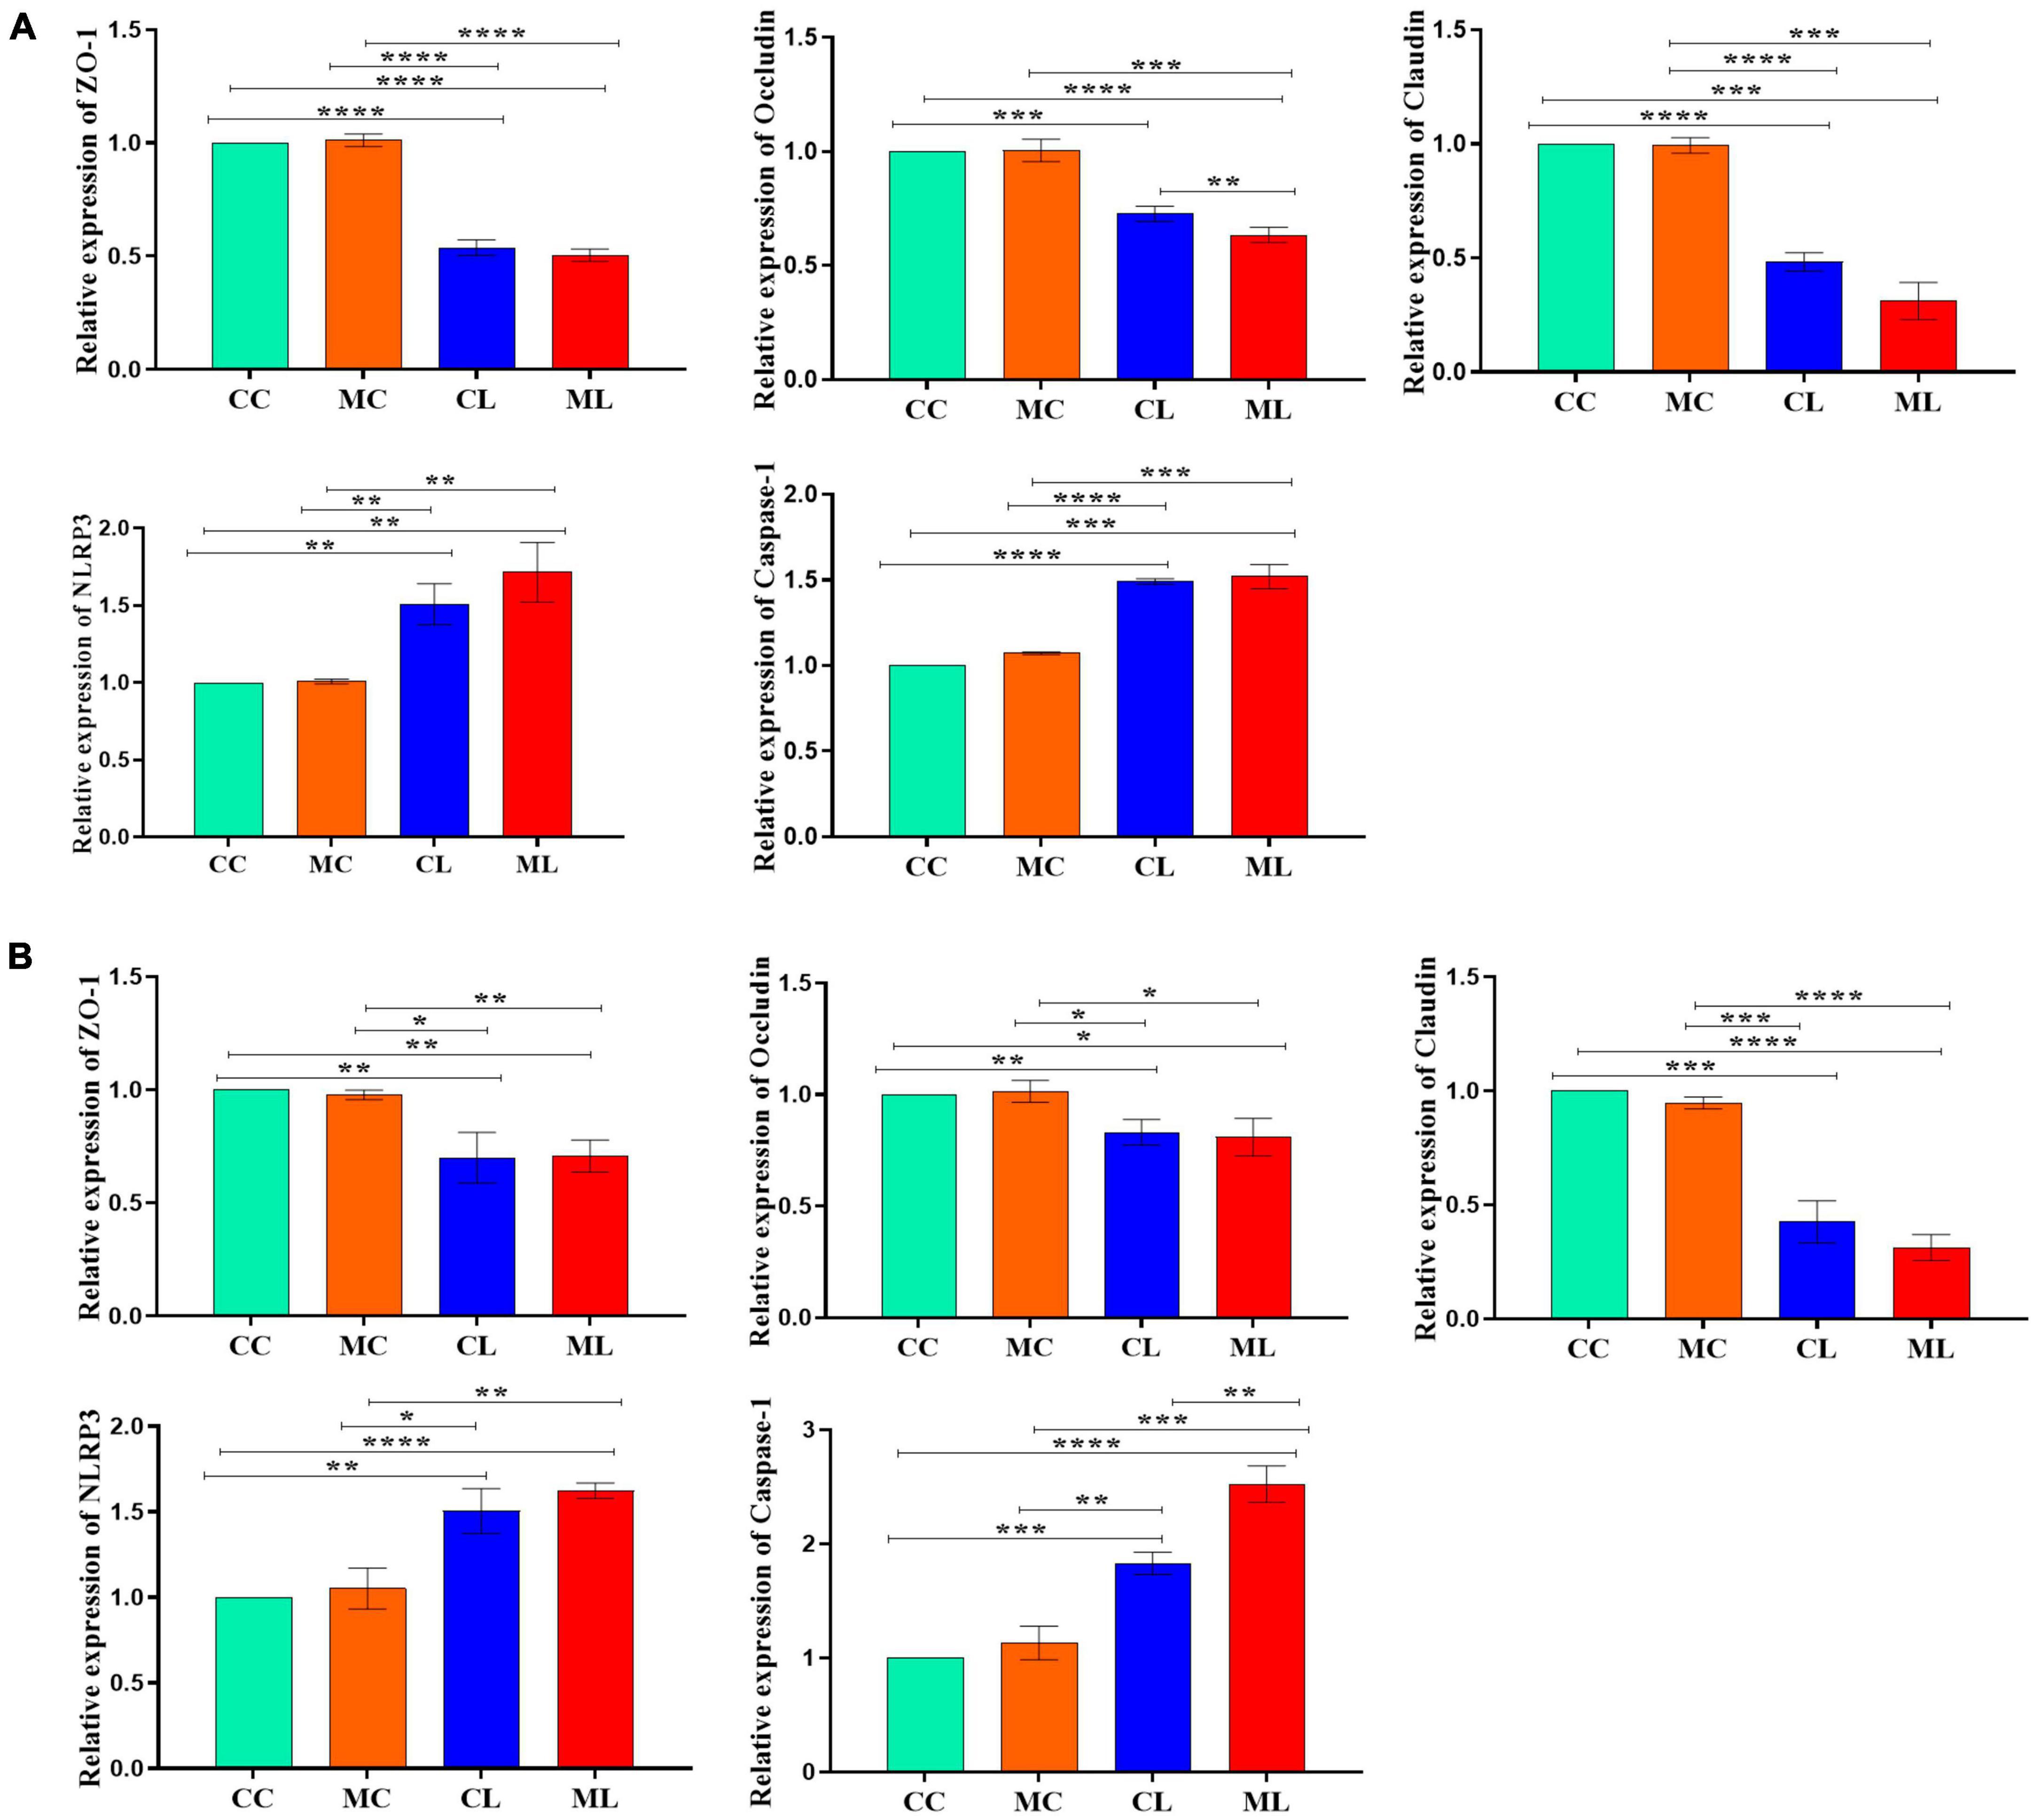
Figure 5. Relative expression analysis of ZO-1, Occludin, Claudin, Caspase-1 and NLRP3 via qRT-PCR, (A) jejunum, (B) ileum. Significance is presented as *p < 0.05, **p < 0.01, ***p < 0.001, and ****p < 0.0001; data are presented as the mean ± SEM (n = 3).
The effects of LPS on the structure and diversity of animal gut microbiota
A total of 1,781,514 and 1,775,898 raw and clean reads, respectively were obtained from the current mice samples. Each group had more than 75,339, 48,262, 49,246, and 60,260 non-chimeric reads (Table 2). The number of data reads in group MC was noticeably (P < 0.05) lower compared to the CC group (Figure 6A). In total, 9,228 operational taxonomic units (OTUs) were identified in the mice, with 246 OTUs shared among the groups. Group CL shared 434 to 486 OTUs, while group ML shared 459 to 518 OTUs with the other groups (Figure 6B). Alpha diversity analysis indicated that Shannon (P < 0.05) and Simpson (P < 0.05) indices in ML were memorably lower than those in MC (Table 3; Figure 6C). Beta diversity analysis showed that the samples in groups MC, CL, and ML clustered closely together on PCA. The distance between groups CC and MC was short based on PCoA, while groups CL and ML were close to each other based on NMDS (Figure 6D).
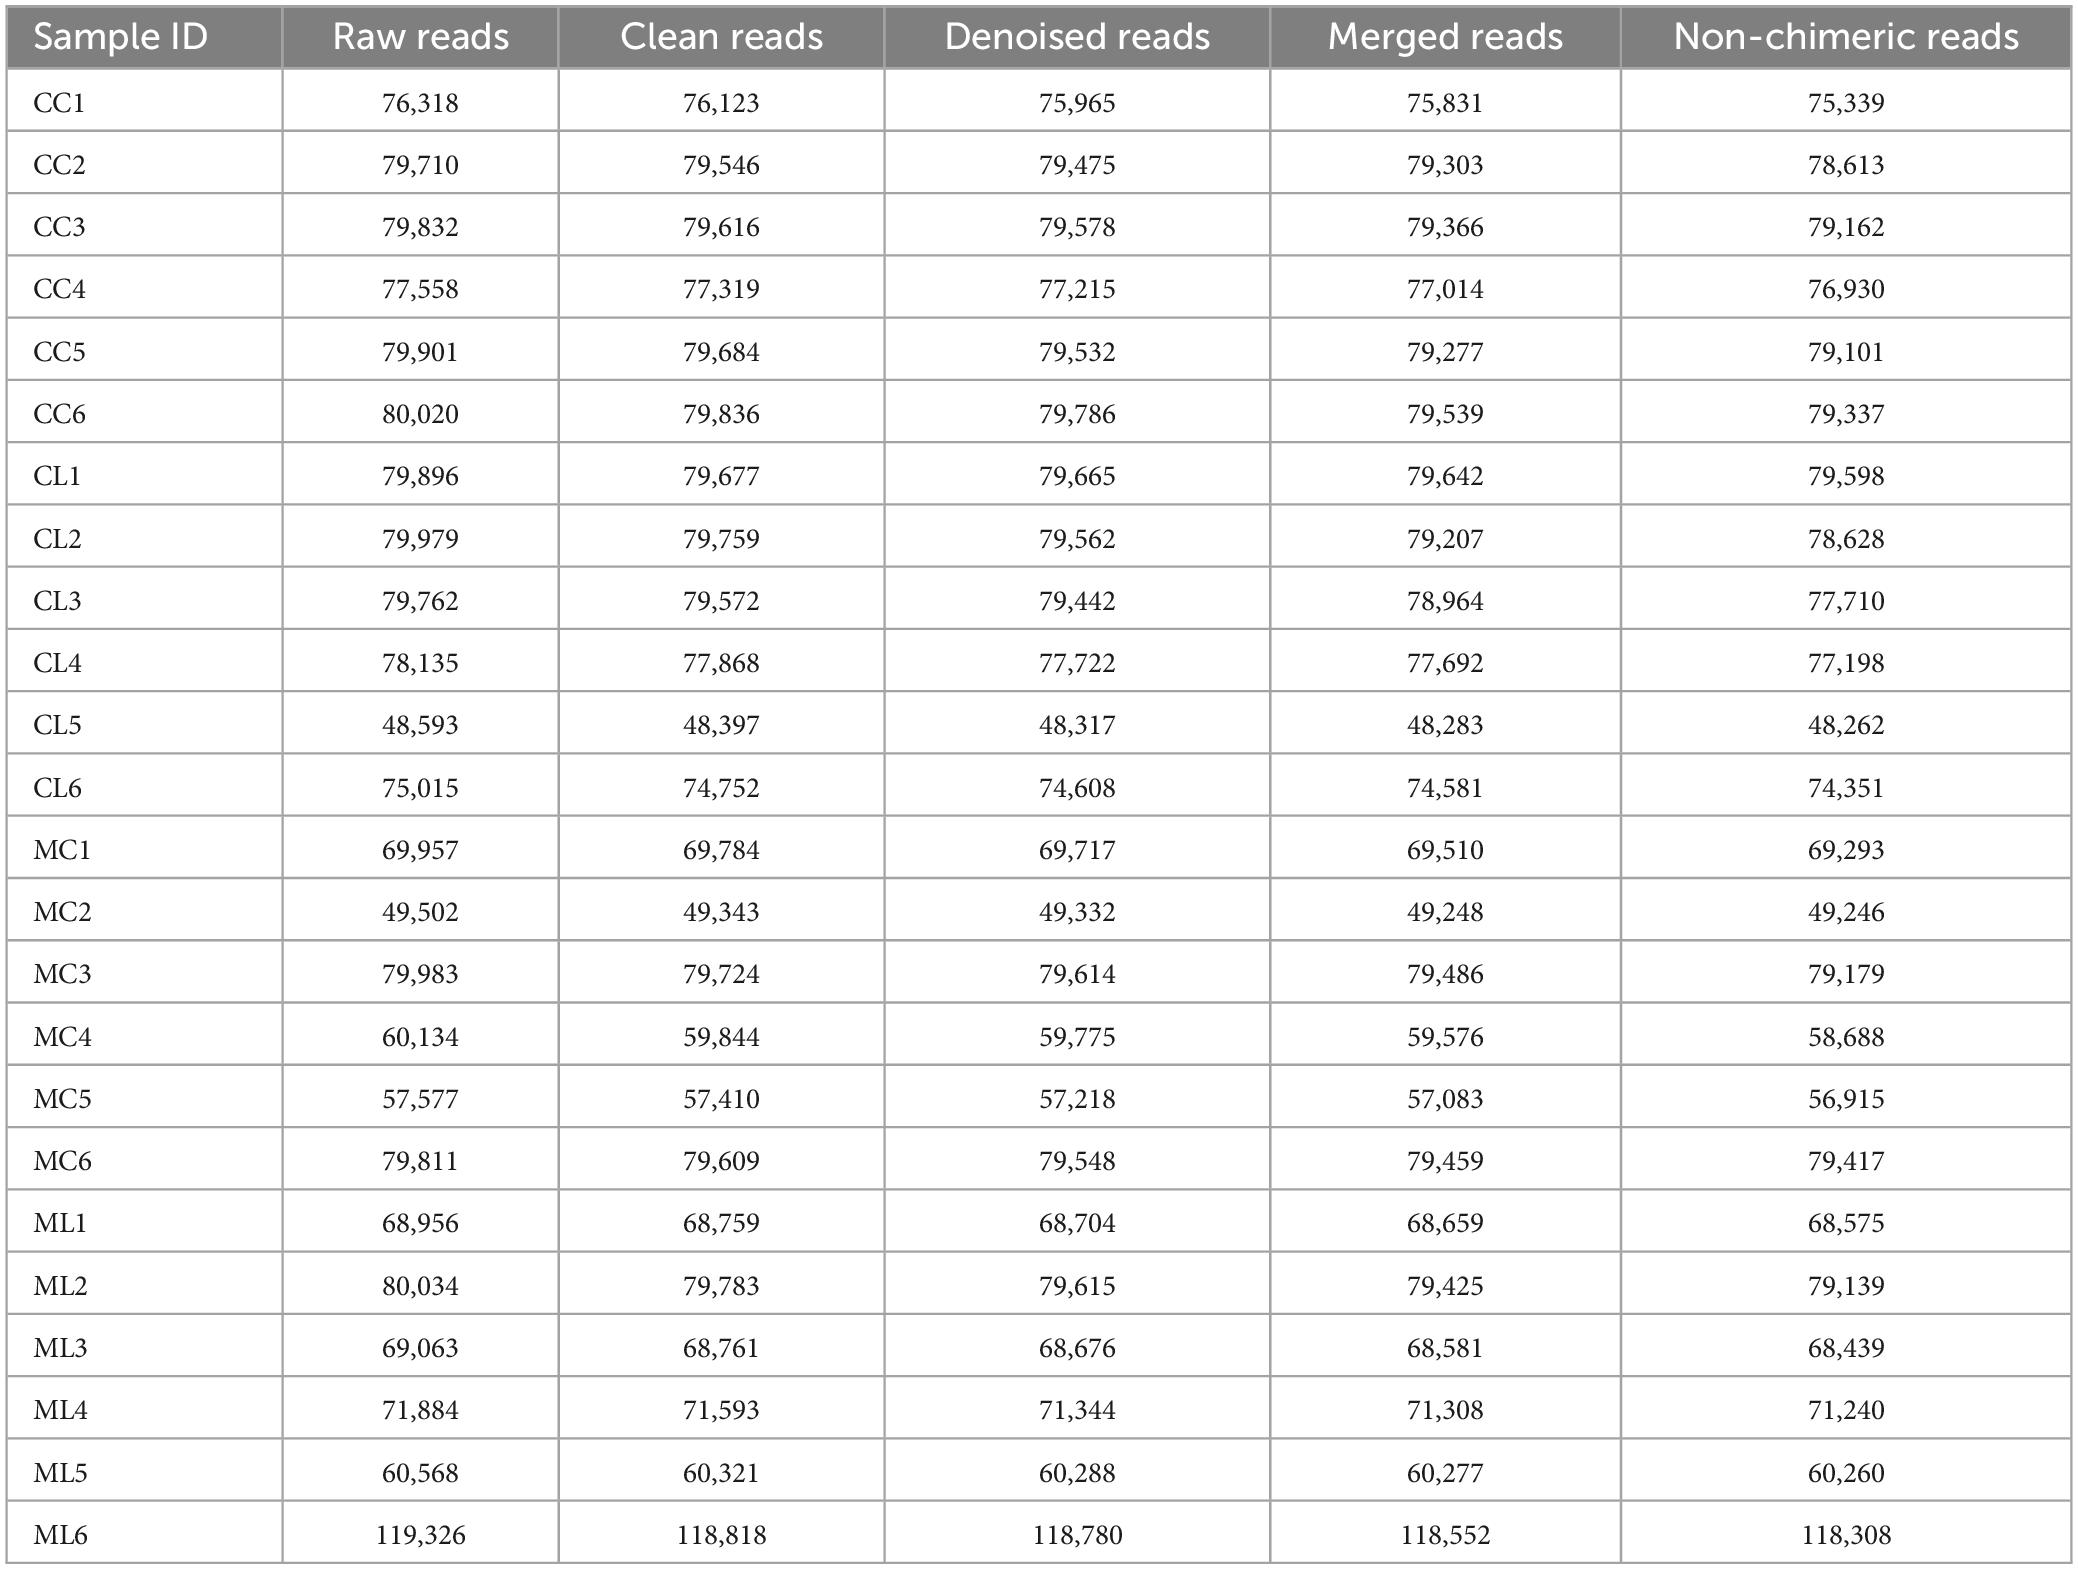
Table 2. Statistical analysis of mouse samples sequencing data.
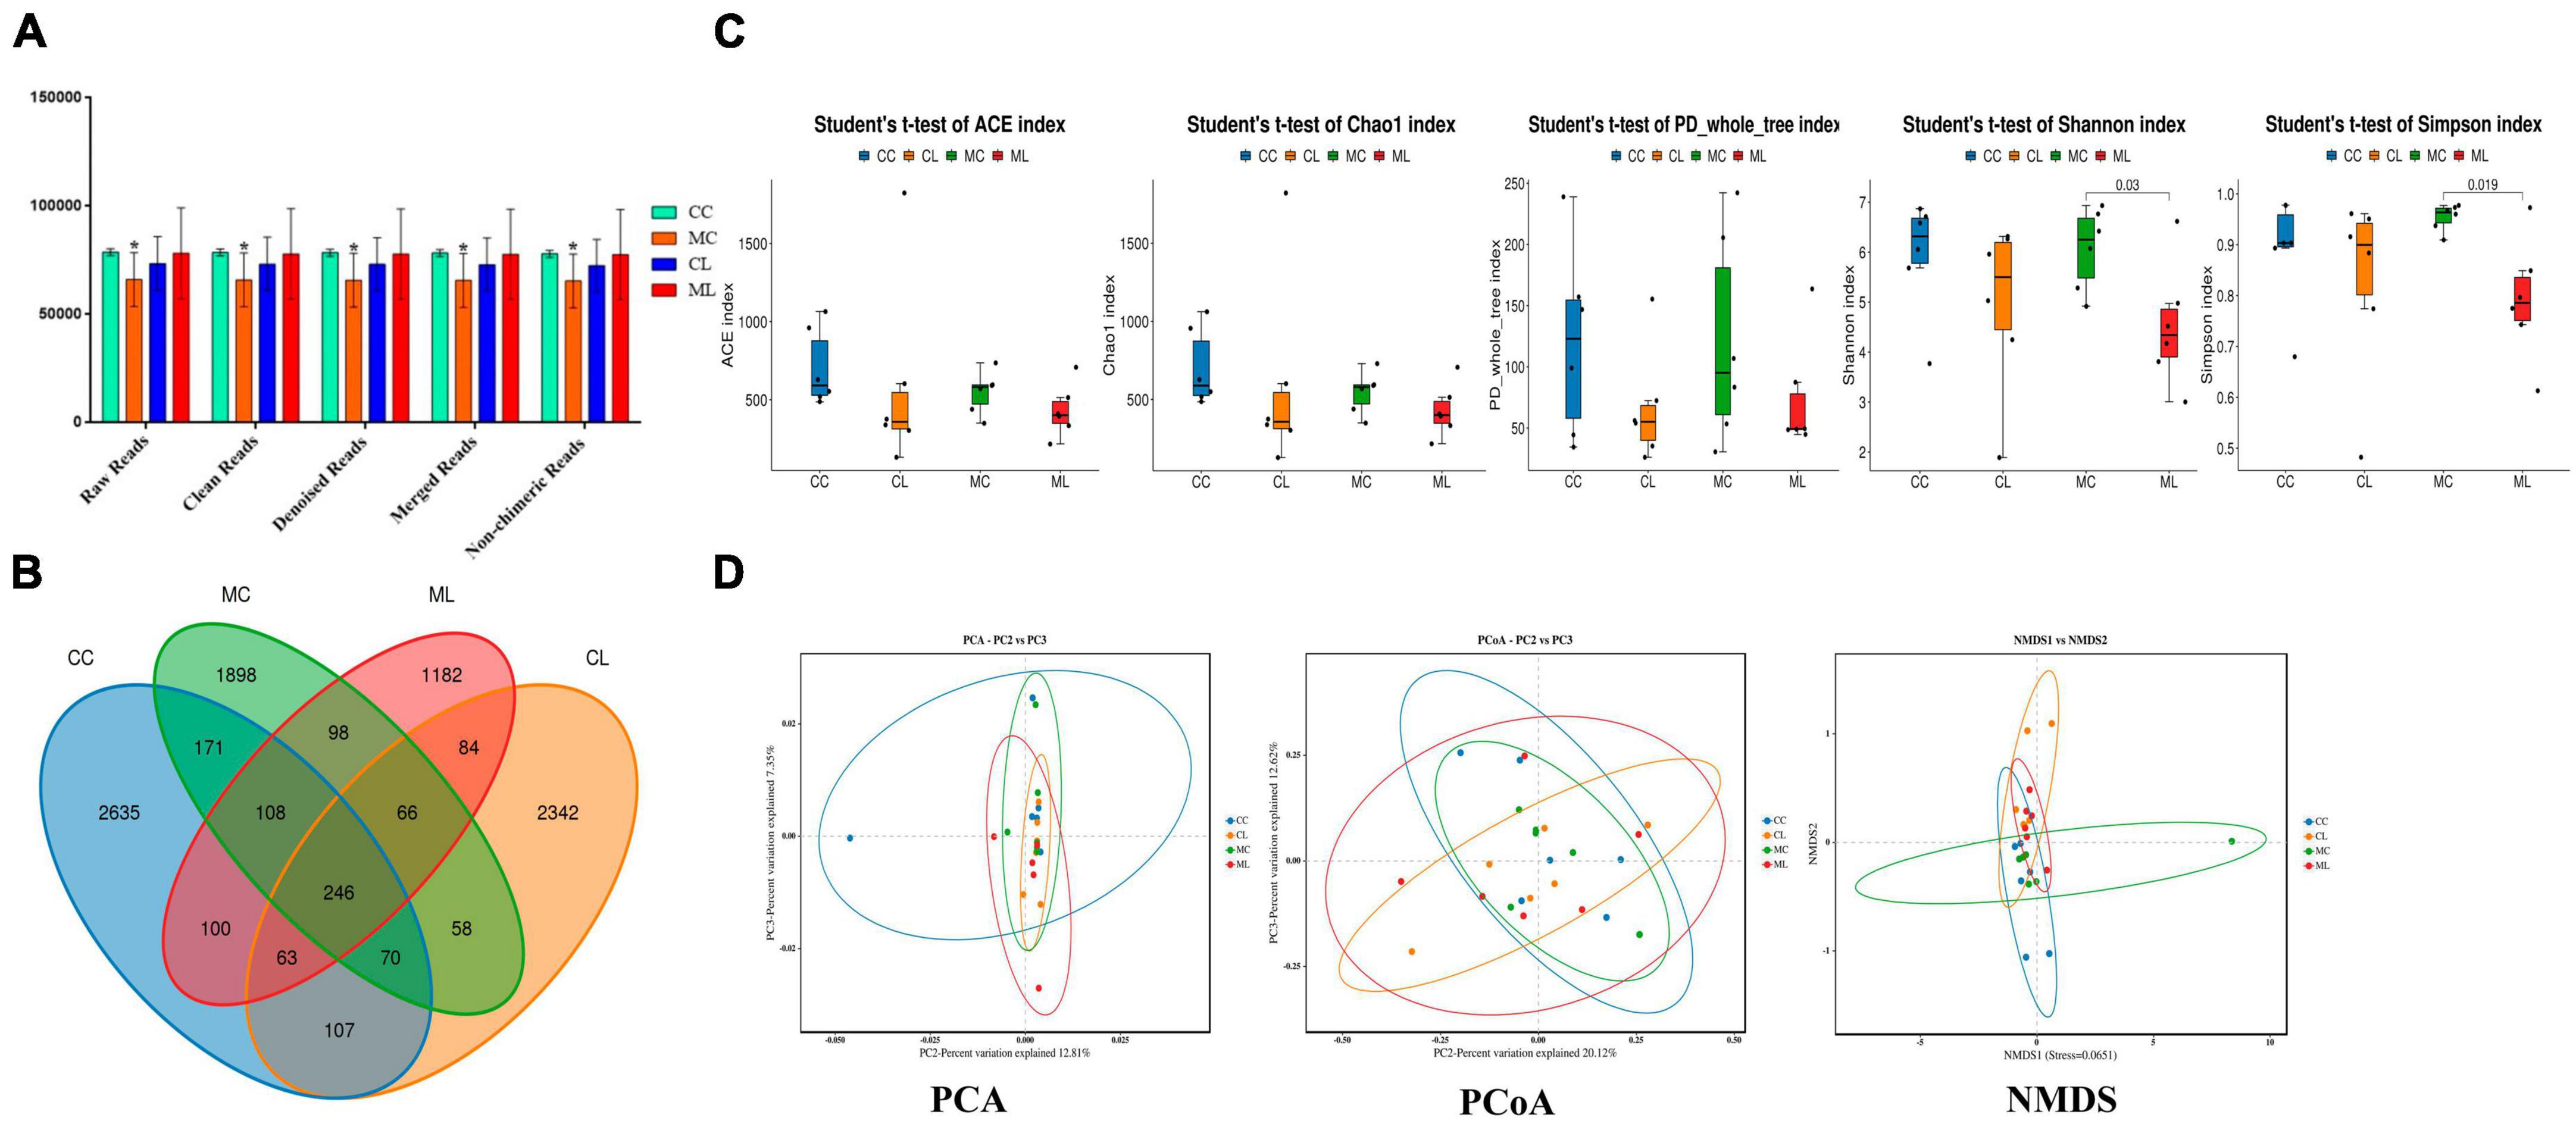
Figure 6. Effects of LPS on the structure and diversity of animal gut microbiota. (A) Sequencing data statistical analysis, (B) Length distribution of sequencing data, (C) Rank abundance curve, (D) Alpha diversity index analysis. Significance is presented as *p < 0.05, **p < 0.01, ***p < 0.001, and ****p < 0.0001; data are presented as the mean ± SEM (n = 6).

Table 3. Statistical analysis of Alpha diversity index.
The effect of LPS on intestinal microbiota in different taxa
At the phylum level, the ruling phyla in CC mice were Firmicutes (53.53%), Campylobacterota (20.01%), and Bacteroidota (12.91%), the ruling phyla in MC mice were Firmicutes (59.70%), Bacteroidota (11.6%) and Proteobacteria (9.96%), in CL animals were Proteobacteria (38.02%), Firmicutes (27.58%) and Bacteroidota (16.41%), while ruling phyla in ML animals were Proteobacteria (40.05%), Bacteroidota (19.40%) and Firmicutes (18.35%) (Figure 7A and Table 4). At the class level, the top three most abundant classes were Clostridia (32.23%), Bacilli (20.90%) and Campylobacteria (20.24%) in group CC, Gammaproteobacteria (36.90%), Bacilli (17.59%) and Bacteroidia (16.57%) in group CL, Clostridia (33.18%), Bacilli (26.2%) and Bacteroidia (11.19%) in group MC, while Gamma proteobacteria (42.66%), Bacteroidia (17.52%) and Campylobacteria (12.9%) in group ML (Figure 7B). At the order level, the main orders in group CC were Lachnospirales (25.56%), Campylobacterales (20.24%) and Lactobacillales (16.66%), in group CL were Enterobacterales (35.71%), Bacteroidales (16.32%) and Lactobacillales (12.73%), in group MC were Lachnospirales (24.62%), Lactobacillales (20.68%) and Bacteroidales (11.03%), and in group ML were Enterobacterales (41.02%), Bacteroidales (17.84%) and Campylobacterales (12.90%) (Figure 7C). At the family level, Lachnospiraceae (25.56%), Helicobacteraceae (20.21%) and Lactobacillaceae (16.19%) were mainly found in CC animals, Enterobacteriaceae (32.39%), Lactobacillaceae (10.28%) and Lachnospiraceae (8.78%) were primary families in CL mice, Lachnospiraceae (24.61%), Lactobacillaceae (18.61%) and Helicobacteraceae (7.66%) were mainly detected in MC animals, and Enterobacteriaceae (38.44%), Helicobacteraceae (12.90%) and Lactobacillaceae (5.12%) were principally examined in ML mice (Figure 7D). At the genus level, the staple genera were Helicobacter (20.21%), Lactobacillus (15.34%) and Lachnospiraceae_NK4A136_group (13.30%) in CC mice, Escherichia_Shigella (30.88%), Helicobacter (7.60%) and Bacteroides (5.91%) in CL animals, Lactobacillus (16.39%), unclassified_Lachnospiraceae (12.04%) and Lachnospiraceae_NK4A136_group (9.19%) in MC mice, Escherichia_Shigella (38.39%), Helicobacter (12.90%) and unclassified_Muribaculaceae (6.97%) in CL animals (Figure 7E). At species level, unclassified_Helicobacter (20.21%), unclassified_Lachnospiraceae_NK4A136_group (11.35%) and unclassified_Lactobacillus (9.30%) were mainly uncovered in mice in CC group, unclassified_Escherichia_Shigella (30.88%), unclassified_Helicobacter (6.75%) and unclassified_Bacteroides (5.28%) were revealed in mice in CL group, unclassified_Lactobacillus (13.38%), unclassified_Lachnospiraceae (11.82%) and unclassified_Lachnospiraceae_NK4A136_group (8.97%) were tested in mice in MC group, while unclassified_Escherichia_Shigella (38.39%), unclassified_Helicobacter (12.05%) and unclassified_Muribaculaceae (6.97%) were examined in mice in group ML (Figure 7F). Phylogenetic tree distribution analysis to top 80 abundant OTUs found that the abundance of g__Lachnospiraceae_NK4A136_group (ASV39), s__uncultured_Clostridiales_bacterium (ASV29), g__Lachnospiraceae_NK4A136_group (ASV9), g__Lachnospiraceae_NK4A136_group (ASV75), f__Lachnospiraceae (ASV52), s__Lachnospiraceae_bacterium_ DW59 (ASV77), g__Roseburia (ASV57), g__Anaerotruncus (ASV33), g__Candidatus_Arthromitus (ASV56), s__Lactobacillus_intestinalis (ASV7), g__Helicobacter (ASV5), g__Helicobacter (ASV38), g__Helicobacter (ASV24) and Alloprevotella (ASV36) decreased, especially in LPS induced mice, while g__Enterococcus (ASV67), g__Ligilactobacillus (ASV6), g__Ligilactobacillus (ASV64), s__Malacoplasma_muris (ASV18), s__Mucispirillum_sp._69 (ASV14), g__Mucispirillum (ASV12), g__Rodentibacter (ASV17), g__Escherichia_Shigella (ASV22), g__Escherichia_Shigella (ASV23), g__Escherichia_Shigella (ASV1), g__Helicobacter (ASV4), s__Helicobacter_ganmani (ASV40), g__Parabacteroides (ASV26), f__Muribaculaceae (ASV42), f__Muribaculaceae (ASV70), f__Muribaculaceae (ASV61), f__Muribaculaceae (ASV43), g__Bacteroides (ASV20), g__Bacteroides (ASV30), g__Bacteroides (ASV63), g__Bacteroides (ASV41) and g__Bacteroides (ASV74) increased in LPS challenged animals (Figure 8A). Krona species annotation showed that the main genera were unclassified__Helicobacter (20%), unclassified__Lachnospiraceae_NK4A136_group (11%), unclassified__Lachnospiraceae (9%) and unclassified__Lactobacillus (9%) in CC mice, unclassified__Escherichia_Shigella (31%), unclassified__Helicobacter (7%), unclassified__Bacteroides (5%), unclassified__Muribaculaceae (5%), unclassified__Ligilactobacillus (5%) and unclassified__Lactobacillus (5%) in mice in CL, and unclassified__Escherichia_Shigella (38%), unclassified__Helicobacter (12%) and unclassified__Muribaculaceae (7%) (Figure 8B).
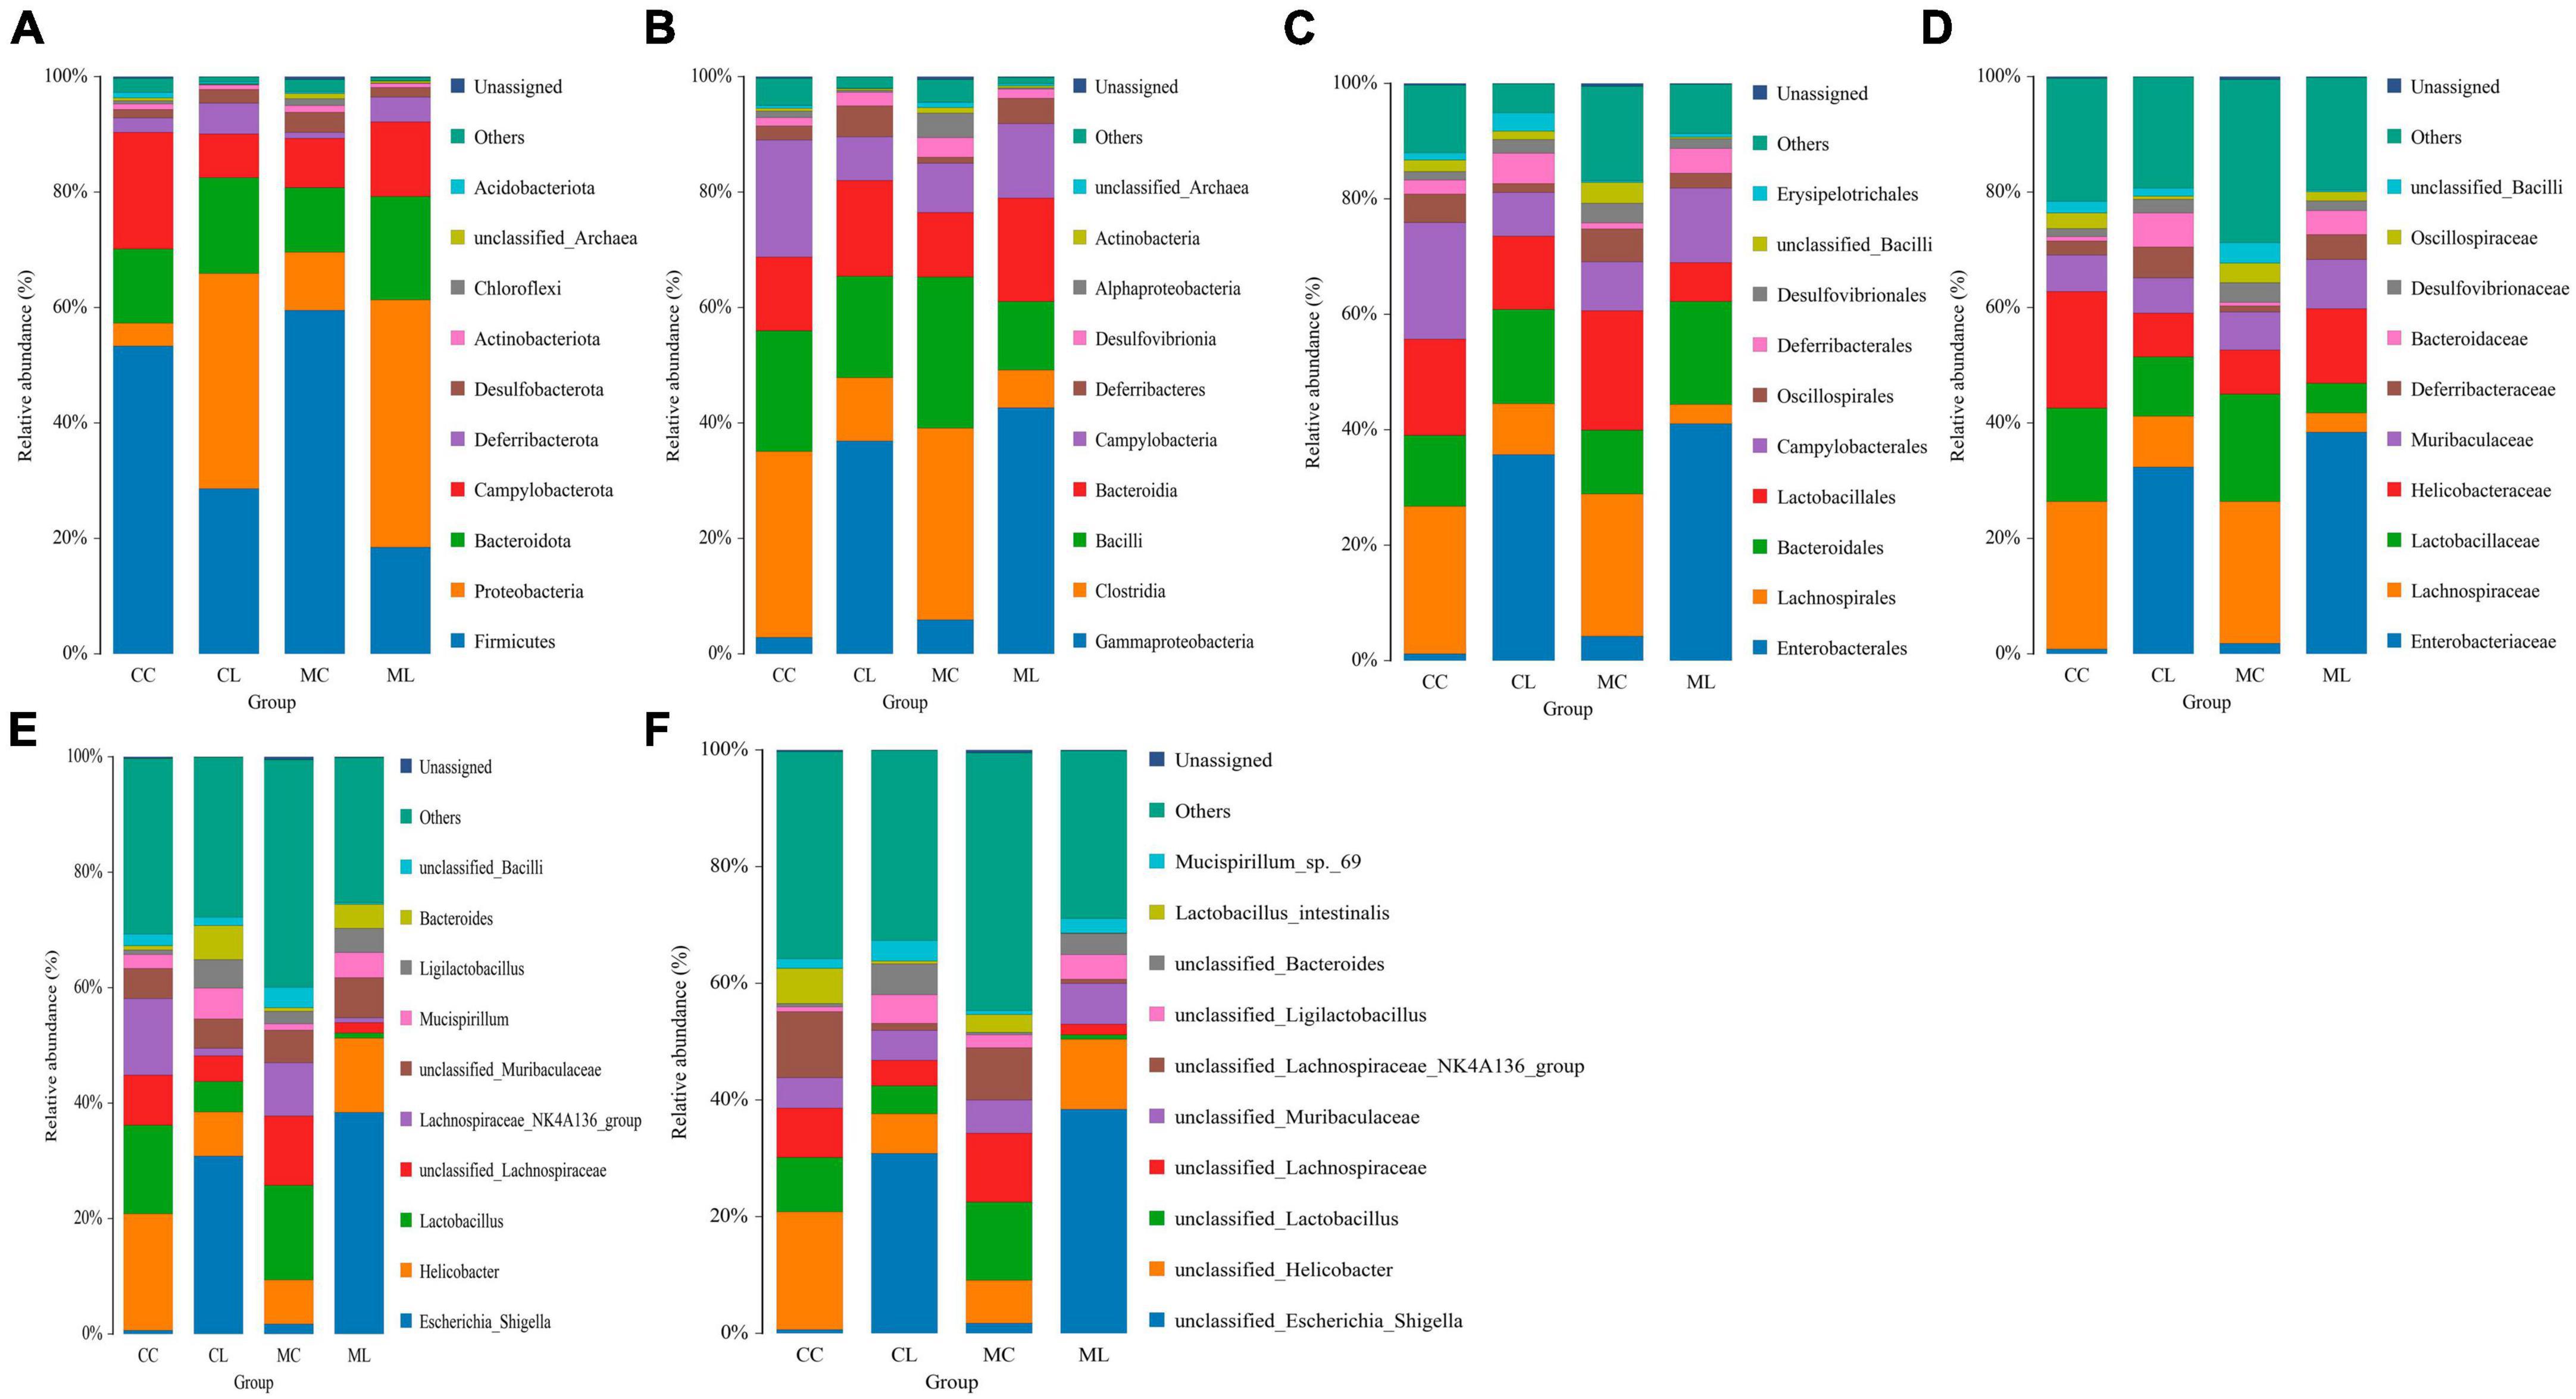
Figure 7. The effect of LPS on intestine microbiota in different taxa. (A) Phylum, (B) Class, (C) Order, (D) Family, (E) Genus, and (F) Species.
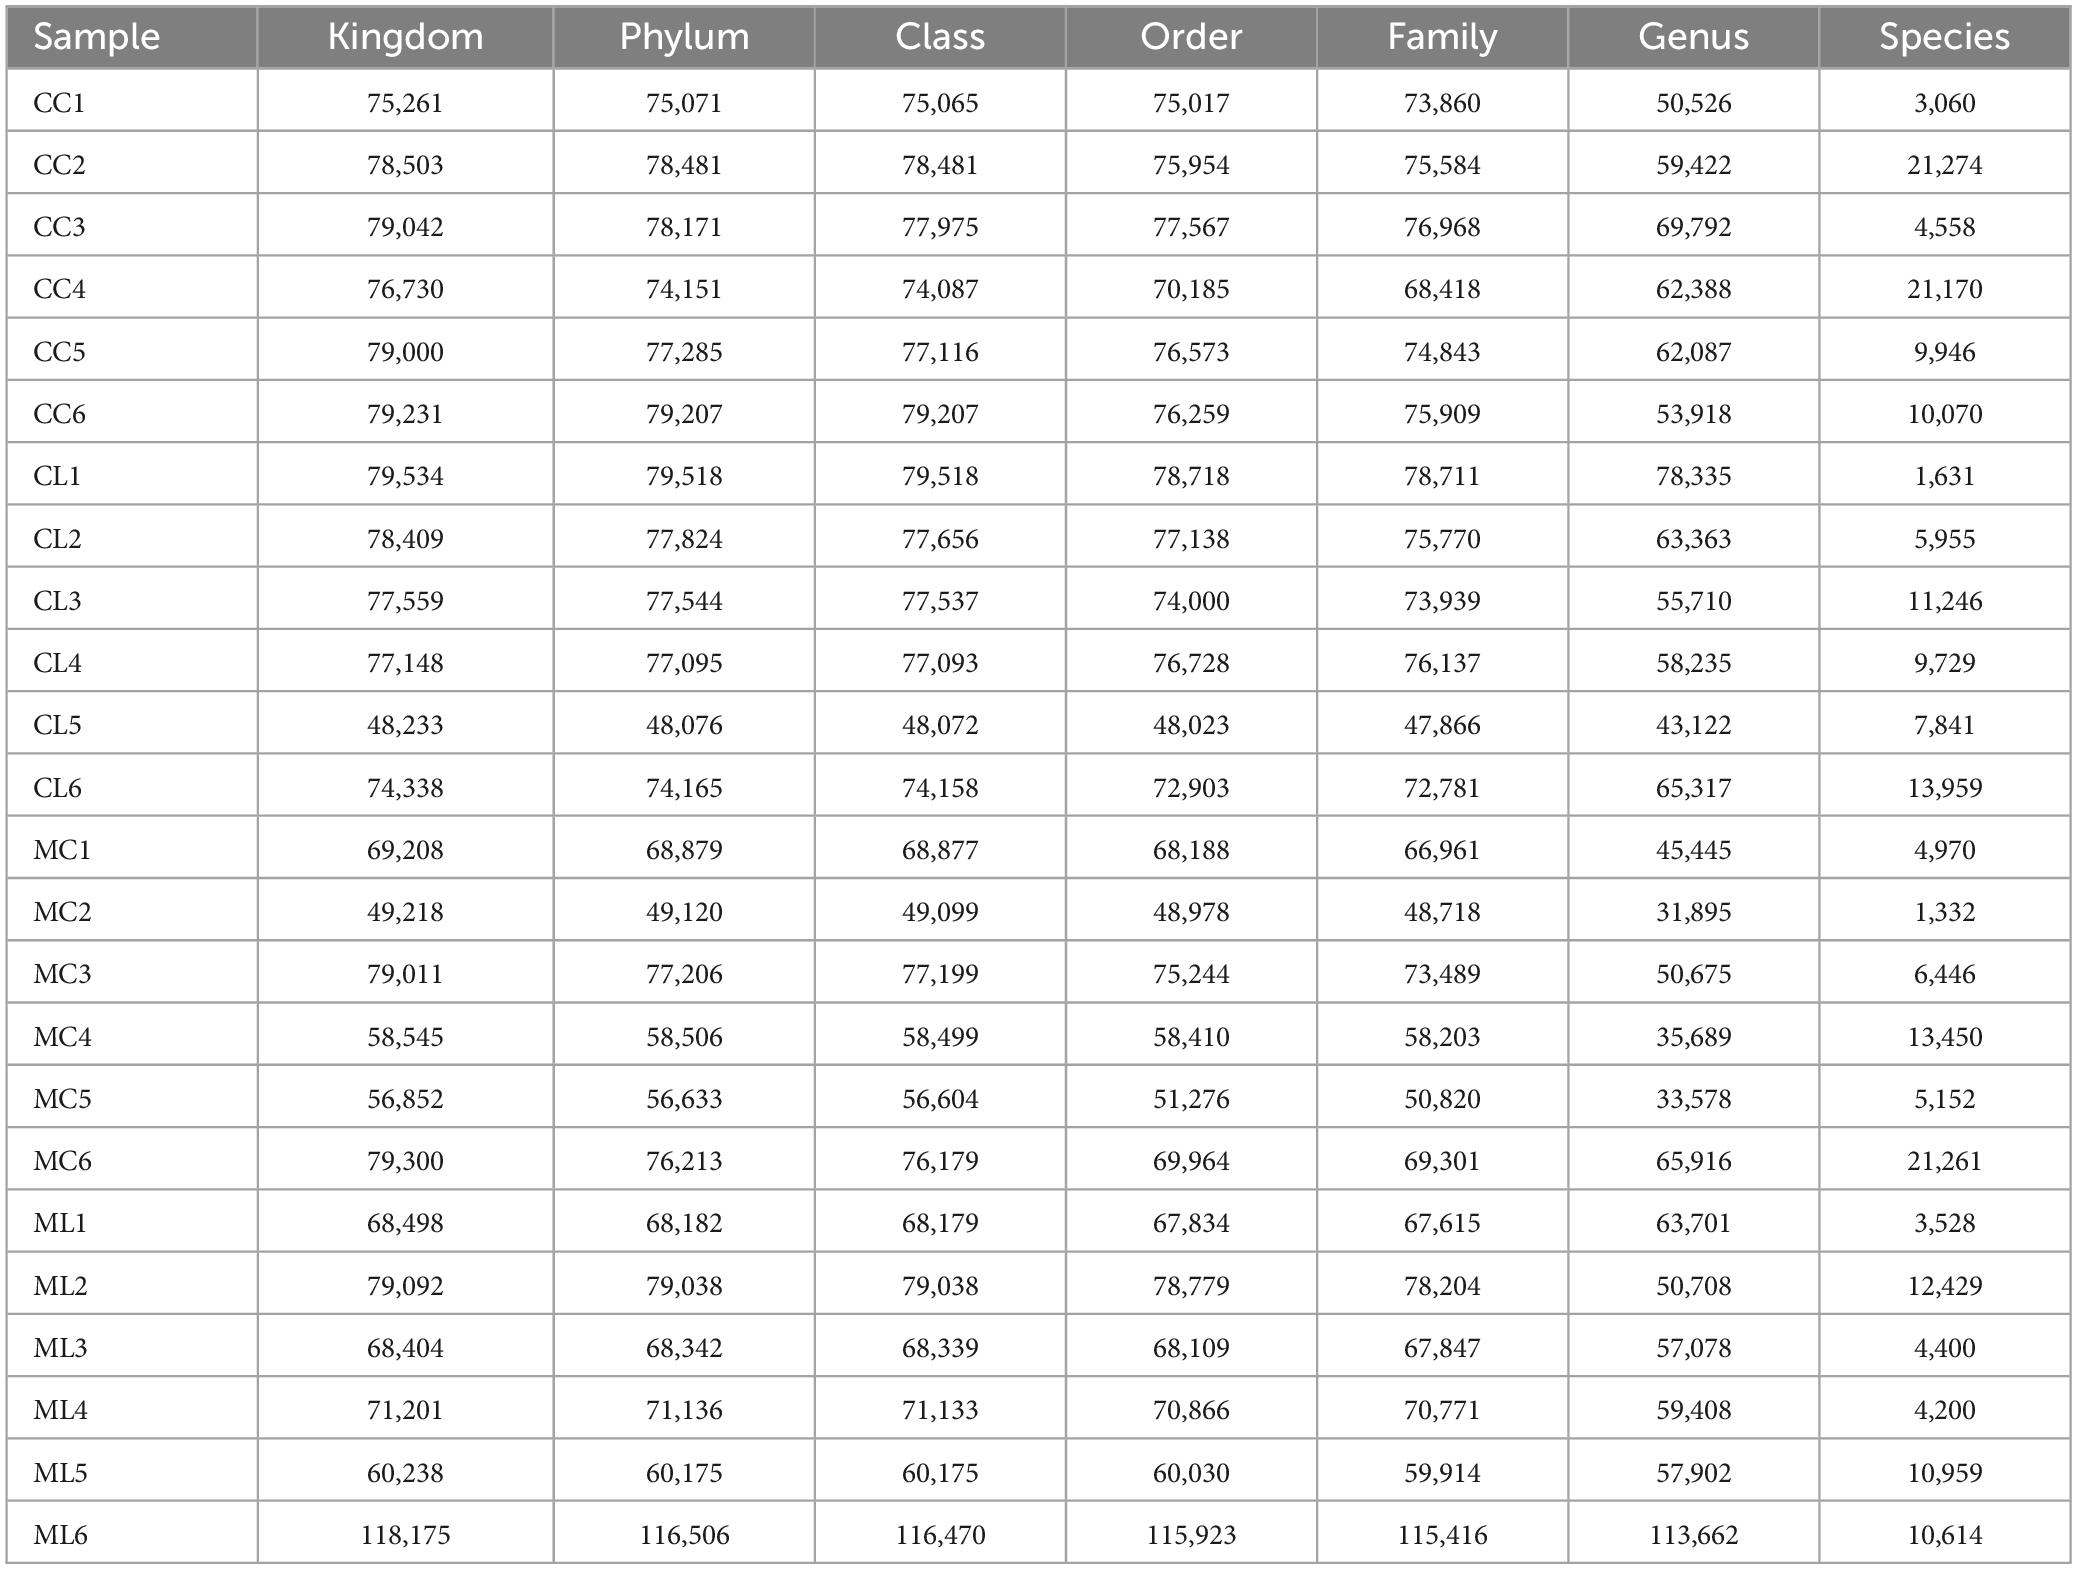
Table 4. Statistical analysis of reads in different taxa.
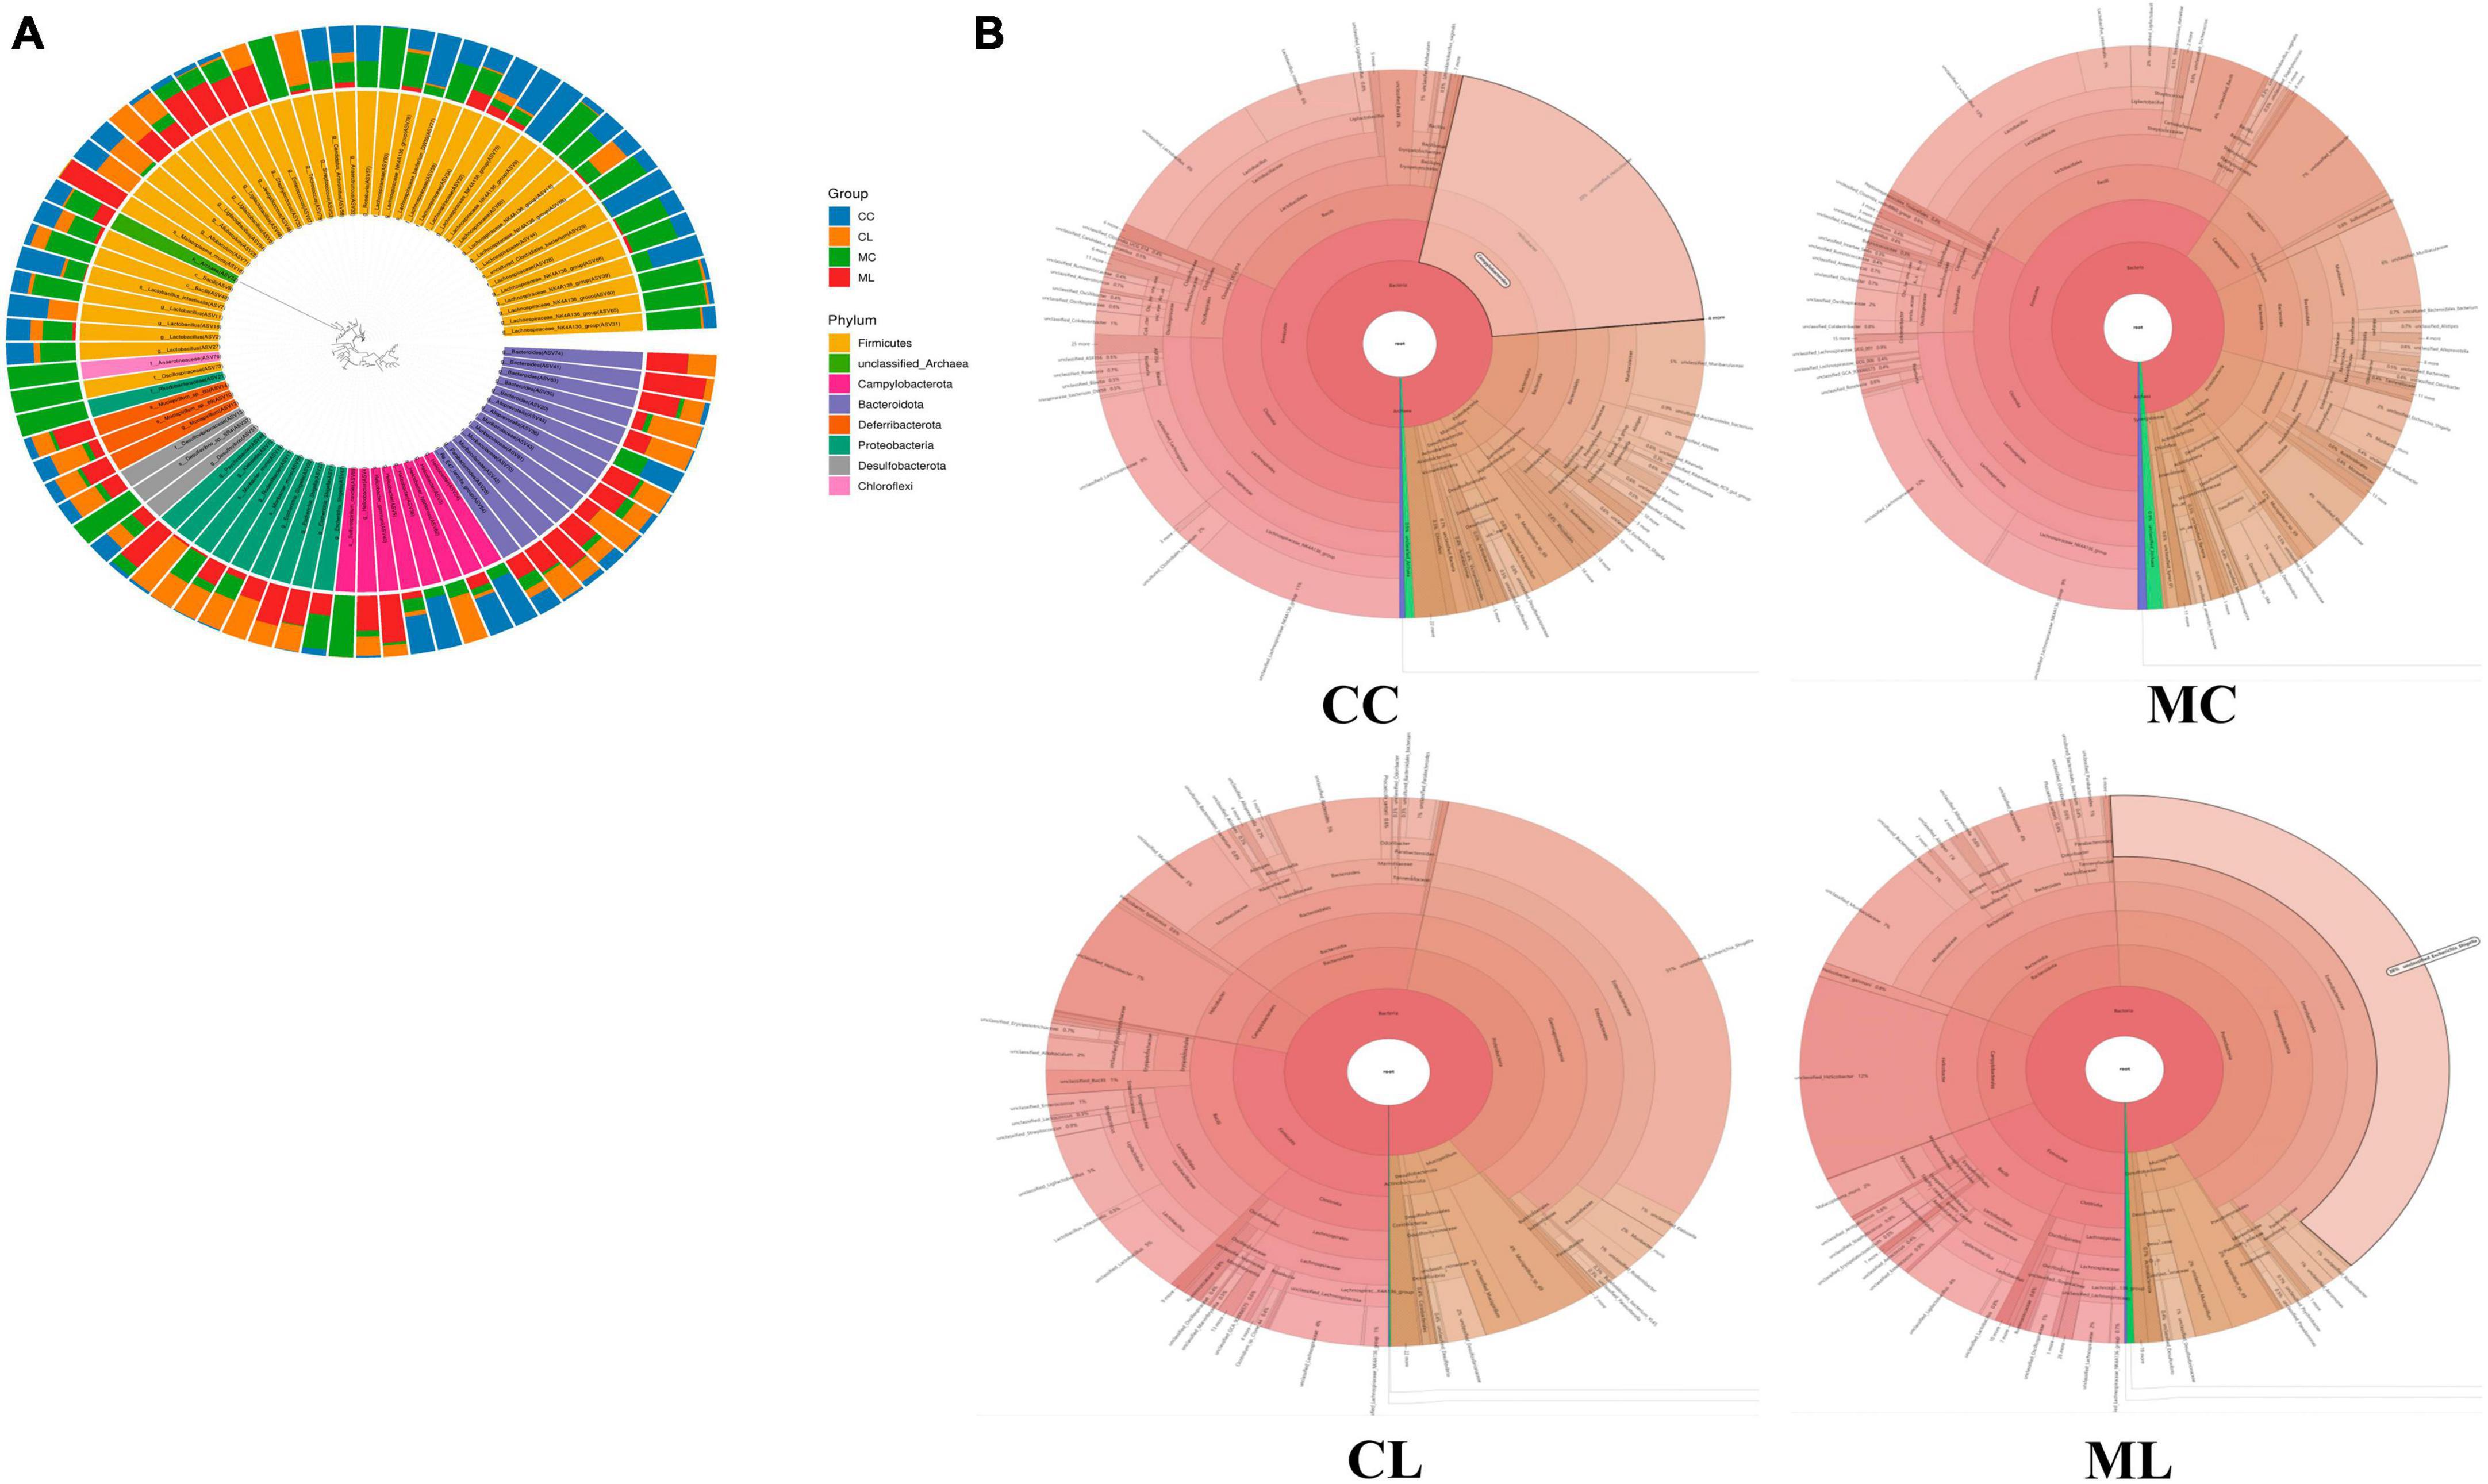
Figure 8. Microbiota composition analysis of mouse gut microbiota. (A) Phylogenetic tree distribution map, (B) Krona species annotation diagram.
Marker bacteria in microbiota of mice among different groups
We first performed LEfSe analysis and found that o__Enterobacterales, C__Gammaproteobacteria, p__Proteobacteria, f__Enterobacteriaceae, s__unclassified_Escherichia_Shigella, g__Escherichia_Shigella, p__Firmicutes, c__Clostridia, o__Oscillospirales, f__Oscillospiraceae, s__unclassified_Bacteroides and g__Lachnospiraceae_NK4A136_group were biomakers in mice (Figure 9).
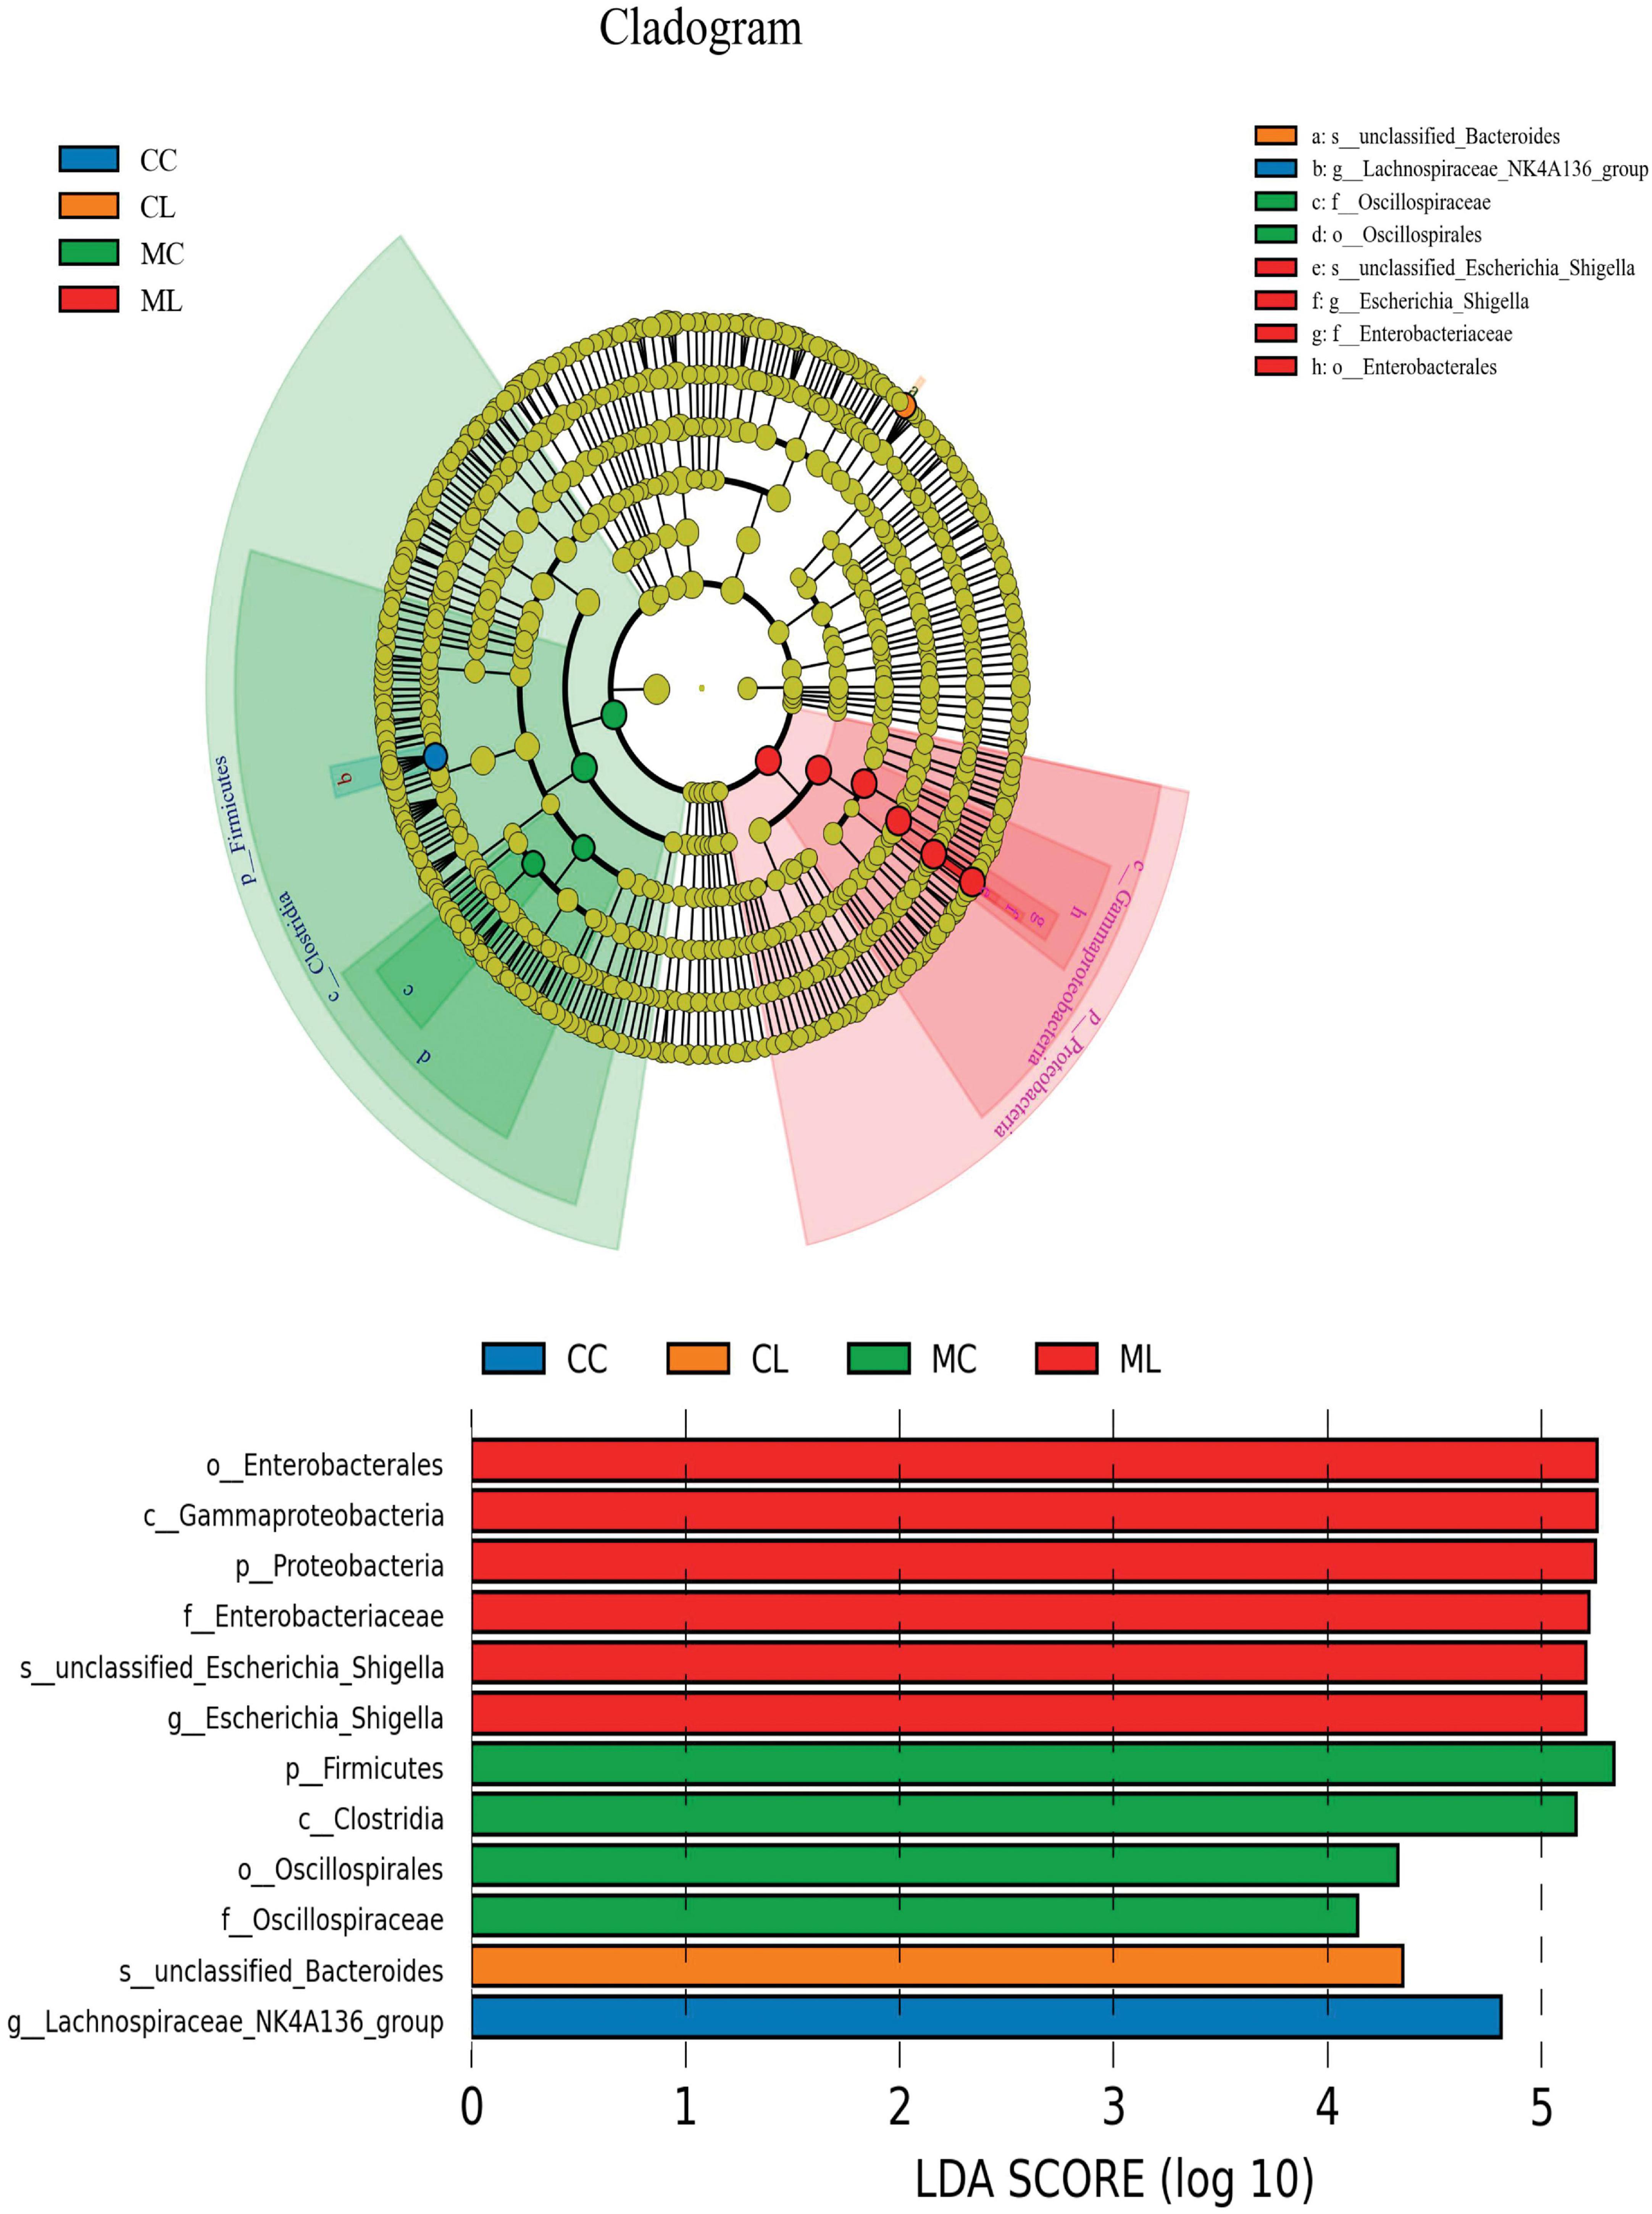
Figure 9. Marker microbiota analysis of mice in different groups via LEfSe analysis.
Then we used metastats analysis and revealed that compared with CC mice, the abundance of UCG_005 (P < 0.001), Family_XIII_001 (P < 0.05), UBA1819 (P < 0.05), Parasutterella (P < 0.05), Intestinimonas (P < 0.05) and Pantoea (P < 0.05) were lower in MC mice, while Acetatifactor (P < 0.01), Lactococcus (P < 0.01), Incertae_Sedis (P < 0.01), Atopostipes (P < 0.05), 2013Ark19i (P < 0.05), Blvii28_sludge_group (P < 0.05), Candidatus_Caldatribacterium (P < 0.05), Comamonas (P < 0.05), Ponticaulis (P < 0.05), Tepidisphaera (P < 0.05), unclassified_11_24 (P < 0.05), unclassified_Euzebyaceae (P < 0.05), unclassified_Halobacterota (P < 0.05) and unclassified_Mariniliaceae (P < 0.05) were higher. The abundance of Oscillibacter (P < 0.001), Peptococcus (P < 0.001), Colidextribacter (P < 0.01), Family_XIII_001 (P < 0.01), unclassified_Peptococcaceae (P < 0.01), Tyzzerella (P < 0.01), Novosphingobium (P < 0.01), Candidatus_Arthromitus (P < 0.01), Polynucleobacter (P < 0.05), Bacillus (P < 0.05), Serratia (P < 0.05), UCG_005 (P < 0.05), unclassified_Enterobacteriaceae (P < 0.05) and Pantoea (P < 0.05) were lower in group CL, while Escherichia_Shigella (P < 0.01), Streptococcus (P < 0.01), Enterococcus (P < 0.01), Bacteroides (P < 0.01), Acetatifactor (P < 0.01) and Rodentibacter (P < 0.05) were higher. Compared with mice in group CC, genera of Peptococcus (P < 0.001), unclassified_Ruminococcaceae (P < 0.001), Lachnospiraceae_UCG_001 (P < 0.001), Roseburia (P < 0.01), Novosphingobium (P < 0.01), Family_XIII_UCG_001 (P < 0.01), UCG_005 (P < 0.01), Tyzzerella (P < 0.01), unclassified_Lachnospiraceae (P < 0.01), unclassified_Comamonadaceae (P < 0.01), Oscillibacter (P < 0.01), unclassified_Peptococcaceae (P < 0.01), Colidextribacter (P < 0.01), unclassified_Cyanobacteriales (P < 0.01) and Bacillus (P < 0.01) were lower in group ML, while Escherichia_Shigella (P < 0.001), Providencia (P < 0.01), Enterococcus (P < 0.01) and Staphylococcus (P < 0.01) were higher. Whereas, compared with MC mice, the abundance of unclassified_Peptococcaceae (P < 0.01), Colidextribacter (P < 0.01), Incertae_Sedis (P < 0.01), Serralia (P < 0.01), Oscillibacter (P < 0.01), Candidatus_Arthromitus (P < 0.01), Chujaibacter (P < 0.05), Prevotella_7 (P < 0.05), Candidatus_Saccharimonas (P < 0.05), Peptococcus (P < 0.05), unclassified_Oscillospiraceae (P < 0.05), Runella (P < 0.05), 2013Ark19i (P < 0.05), Anaeromyxobacter (P < 0.05) and Blvii28_wastewater_sludge_group (P < 0.05) were lower in CL mice, while Escherichia_Shigella (P < 0.01), Mucispirillum (P < 0.01), Erysipelatoclostridium (P < 0.01), Bacteroides (P < 0.01), Parabacteroides (P < 0.05), were higher. Similarly, compared with mice in group MC, the abundance of RB41 (P < 0.001), unclassified_Peptococcaceae (P < 0.01), unclassified_Sphingomonadaceae (P < 0.01), Candidatus_Solibacter (P < 0.01), unclassified_Lachnospiraceae (P < 0.01), Peptococcus (P < 0.01), Acetatifactor (P < 0.05), Serratia (P < 0.05), Prevotella_7 (P < 0.05), Sphingomonas (P < 0.05), Chujaibacter (P < 0.05), unclassified_Sphingomonadaceae (P < 0.05), Prevotella (P < 0.05) and unclassified_Gemmatimonadaceae (P < 0.05) were lower in group ML, while Escherichia_Shigella (P < 0.001), Providencia (P < 0.01), Enterorhabdus (P < 0.01), Yaniella (P < 0.05), Bacteroides (P < 0.05) and UCG_005 (P < 0.05) were higher. Compared with mice in CL group, the abundance of Streptococcus (P < 0.01), Bacillus (P < 0.01), ASF356 (P < 0.05), Aclinospica (P < 0.05), Aliidiomarina (P < 0.05), Asticcacaulis (P < 0.05), BC19_17_termte_group (P < 0.05), Candidatus_Fritschea (P < 0.05), Castellaniella (P < 0.05), Cytophaga (P < 0.05) and Elusimicrobium (P < 0.05) were lower in ML mice, while Staphylococcus (P < 0.01), Providencia (P < 0.01), Yaniella (P < 0.01), Aeromonas (P < 0.01), Facklamia (P < 0.01), uncultured_Muribaculaceae_bacterium (P < 0.05), Aerococcus (P < 0.05), lgnavigranum (P < 0.05) and Jeotgalicoccus (P < 0.05) were higher (Figure 10).
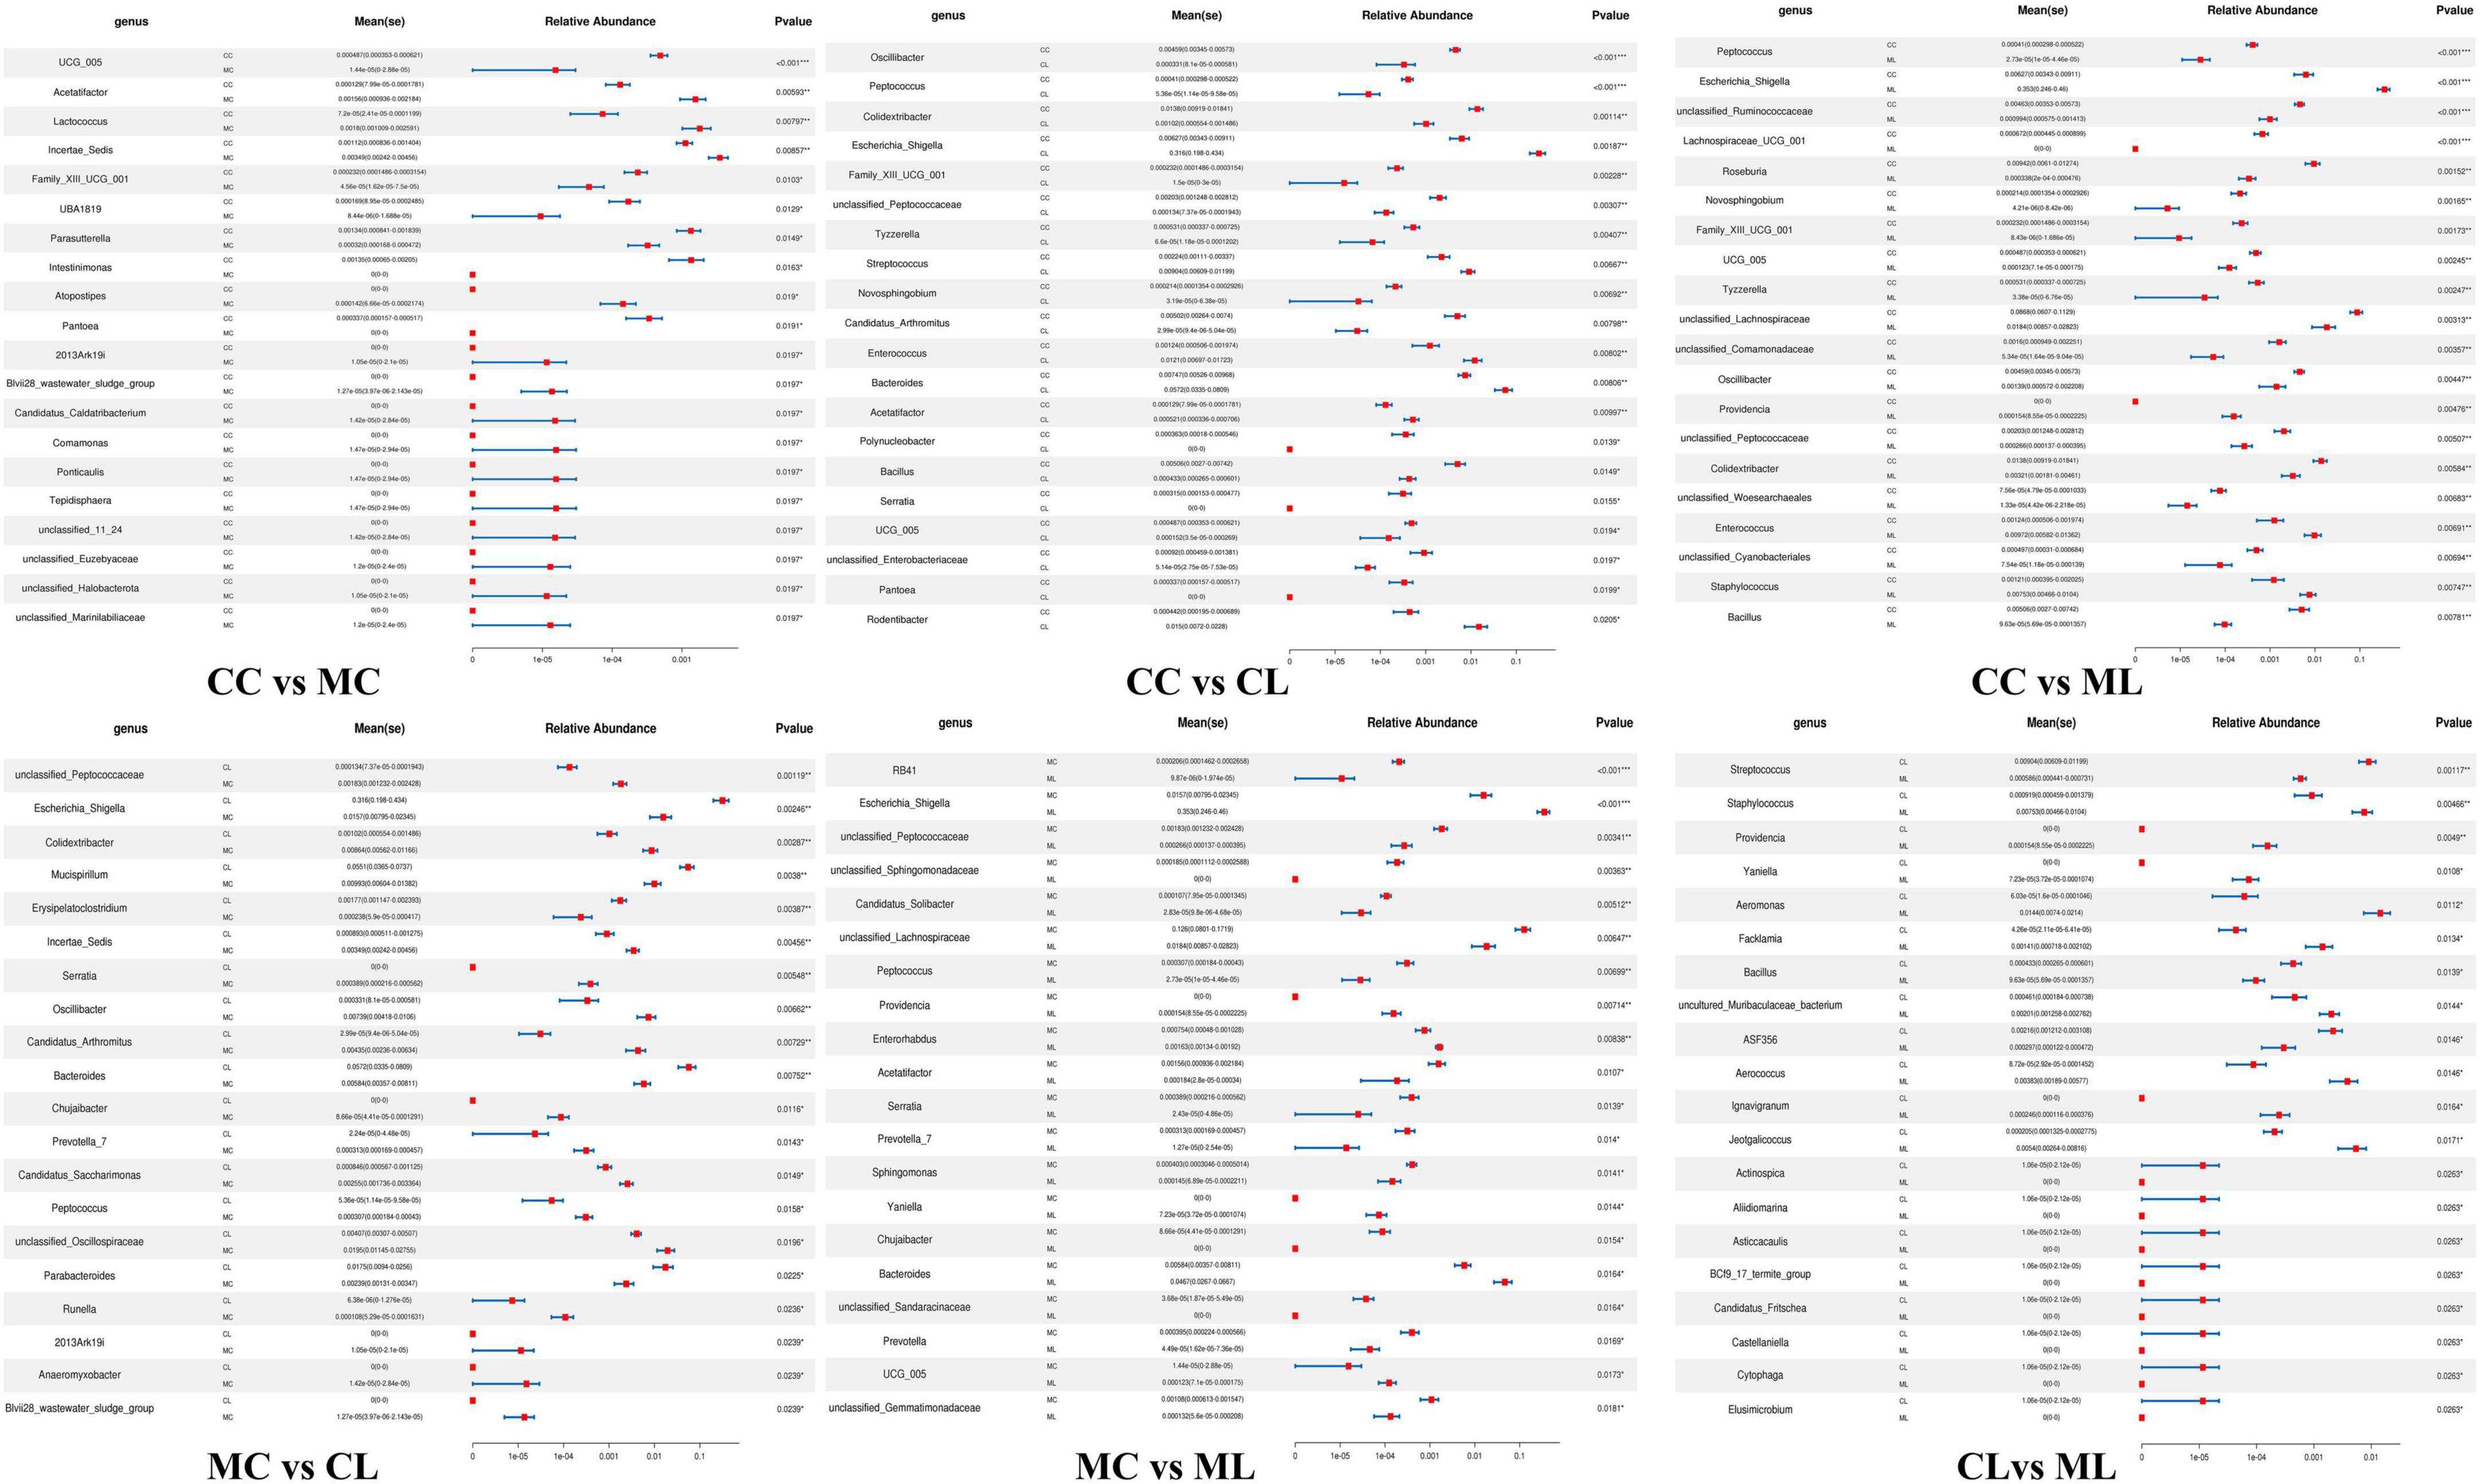
Figure 10. Marker microbiota analysis of mice in different groups via metastats.
Likewise, we compared the abundance of bacteria among the four groups at the phylum and genus levels. The results showed that the phylum Deferribacterota was significantly higher in CL mice compared to MC animals (P < 0.05). Firmicutes was markedly lower in group CL (P < 0.05) and ML (P < 0.05) compared to group MC, and it was also significantly lower than that in group CC (P < 0.05). Gemmatimonadota in ML animals was dramatically lower compared to MC animals (P < 0.05). Proteobacteria in CL mice showed a significantly higher abundance compared to CC (P < 0.01) and MC (P < 0.05) animals, respectively. Similar results were observed in ML mice, with a significantly higher abundance of Proteobacteria in ML compared to CC (P < 0.01) and MC (P < 0.05) (Figure 11A). At the genus level, the abundance of Acetatifactor in CL mice was significantly higher than in CC animals (P < 0.05). Candidatus_Solibacter (P < 0.05) and unclassified_Sphingomonadaceae (P < 0.05) in CL mice were notably higher compared to ML mice. Colidextribacter in MC mice was significantly lower than that in CC (P < 0.05) and CL (P < 0.05) animals. Erysipelatoclostridium (P < 0.05) and Mucispirillum (P < 0.05) in MC animals was markedly higher than that in CL mice. Escherichia_Shigella was higher in MC animals than CC (P < 0.05) and CL mice (P < 0.05). Similarly, this genus was obviously higher found in group ML than groups CC (P < 0.01) and CL (P < 0.05). Family_XIII_UCG_001 in group CC was higher than group MC (P < 0.05) and ML (P < 0.05), respectively. Incertae_Sedis (P < 0.05) and Serratia (P < 0.05) was significantly higher in mice in CL than that in MC. Lachnospiraceae_UCG_001 (P < 0.05), Novosphingobium (P < 0.05), Roseburia (P < 0.05) and unclassified_Comamonadaceae (P < 0.05) in CC mice was notably higher than ML mice, respectively. Oscillibacter in CC animals was significantly higher than MC (P < 0.01) and ML (P < 0.05) groups. Peptococcus was discovered higher in group CC than group MC (P < 0.05) and ML (P < 0.01). Similarly, it was observably higher in CL mice than ML mice (P < 0.05). Providencia was obviously higher in ML mice than animals in other groups (P < 0.05). RB41 was higher in CL groups than ML (P < 0.01). Tyzzerella in group CC was higher than group MC (P < 0.05) and ML (P < 0.05). Staphylococcus in mice in group ML was significantly higher than it in group MC (P < 0.05), while Streptococcus in mice in group ML was significantly lower than group MC (P < 0.05). UCG_005 in mice in CC was markedly higher than animals in group CL (P < 0.01) and ML (P < 0.05). The abundance of unclassified_Lachnospiraceae in group ML was significantly lower than it in group CC (P < 0.05) and CL (P < 0.05). Unclassified_Peptococcaceae in CC animals was markedly higher than MC animals (P < 0.05), similarly it was higher in CL mice than MC (P < 0.05) and ML (P < 0.05) (Figure 11B).
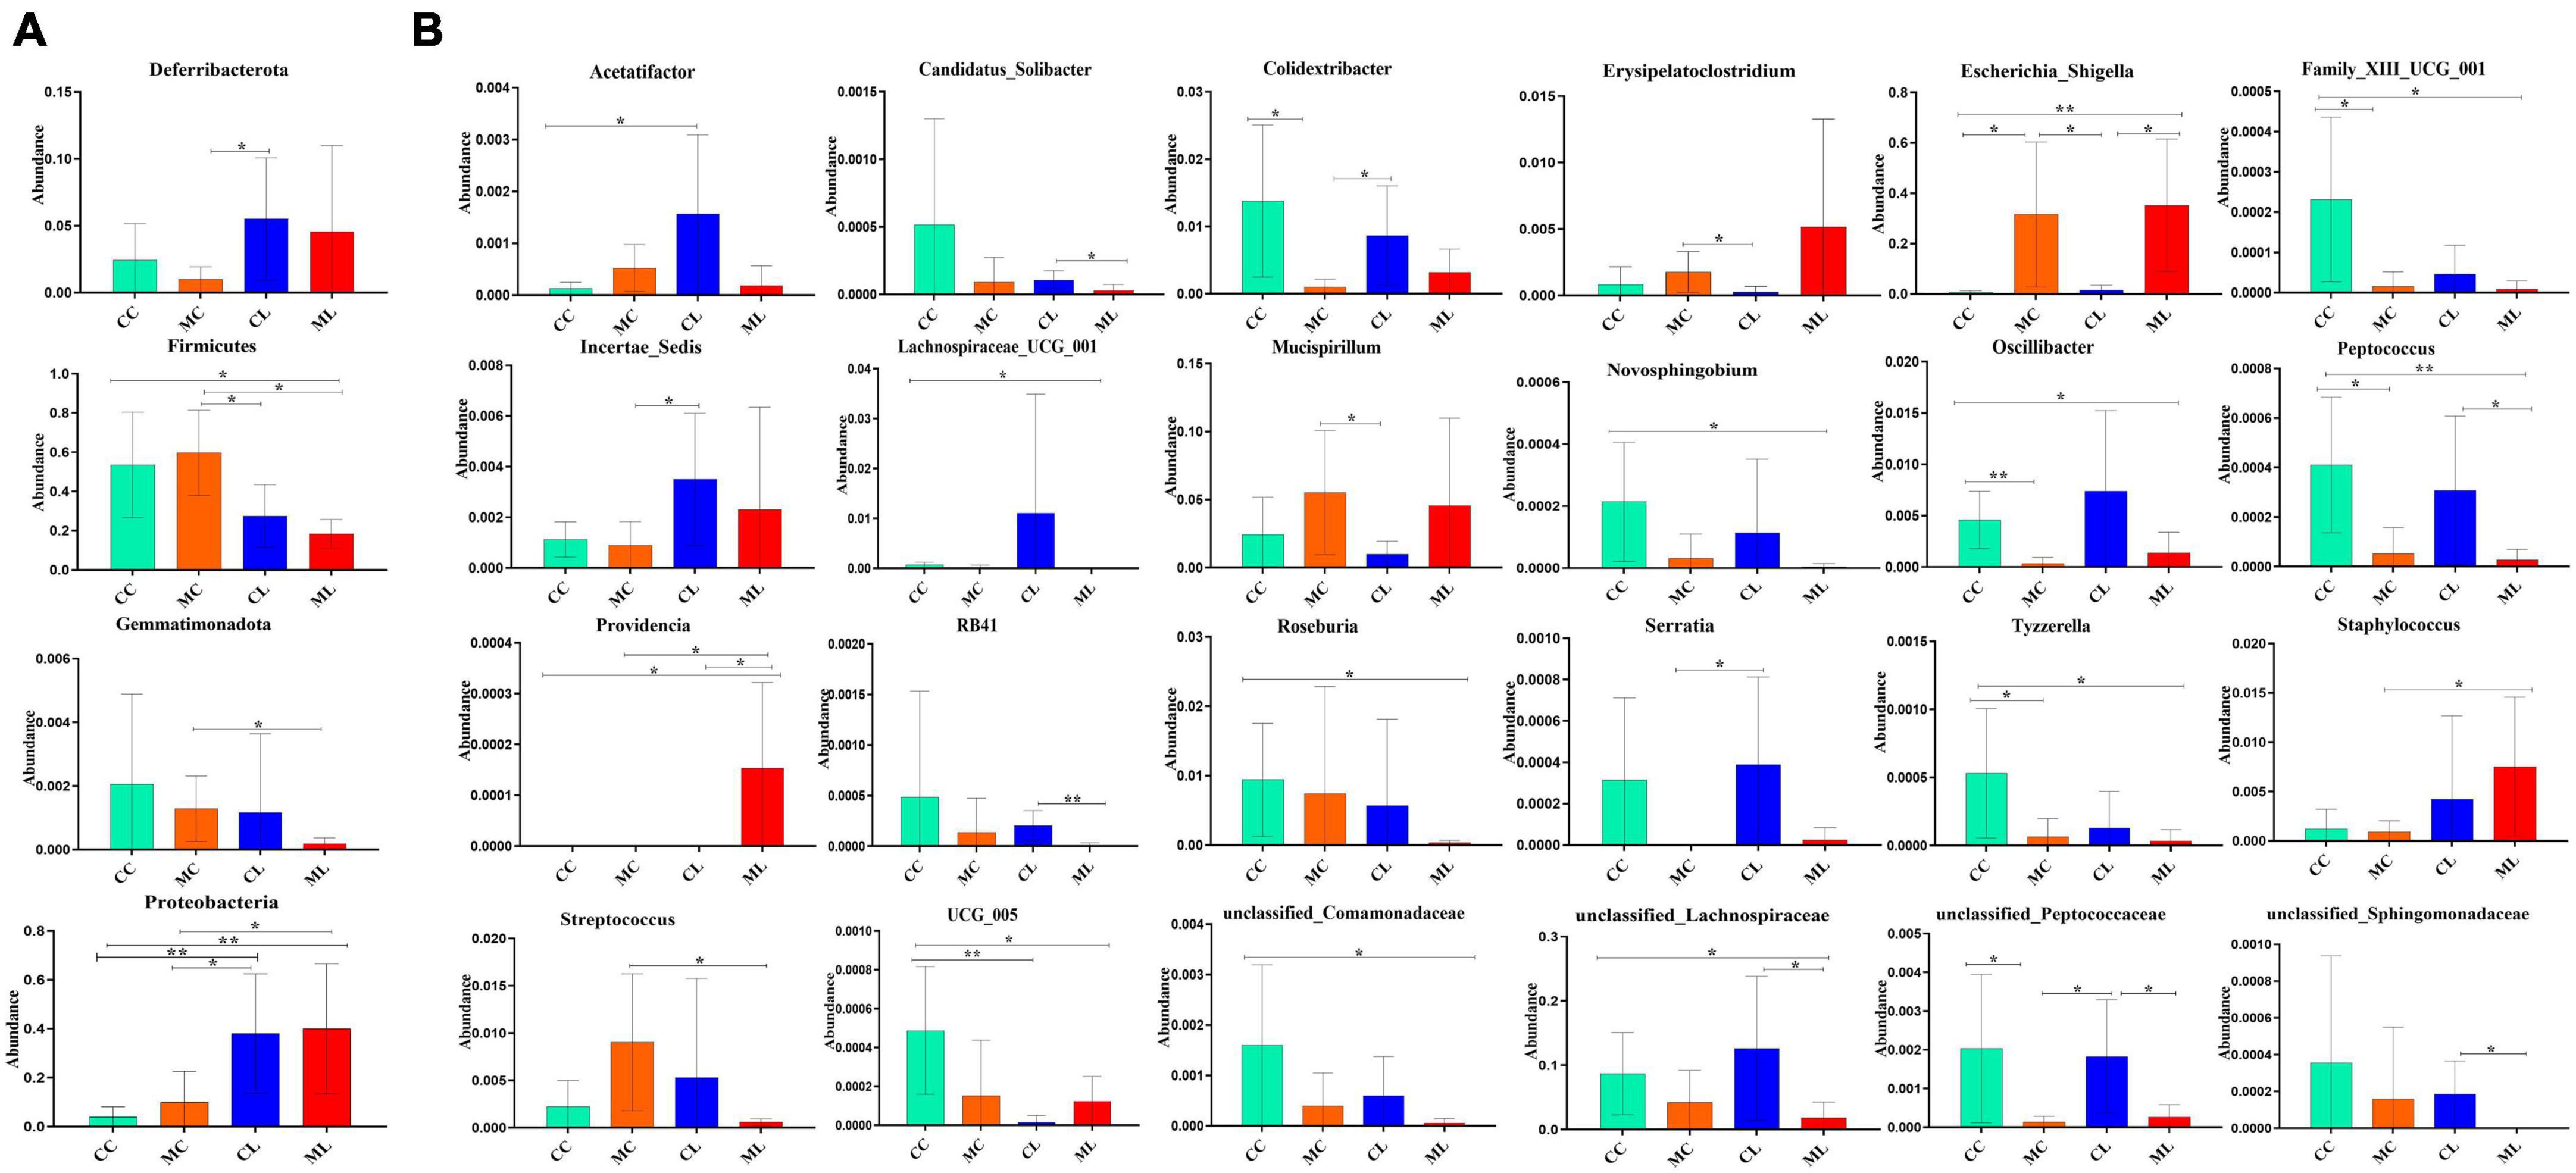
Figure 11. Distinguished microbiota analysis of mice in different groups. (A) Phylum, (B) Genus. Significance is presented as *p < 0.05, **p < 0.01; data are presented as the mean ± SEM (n = 6).
LPS changed microbiota function in mice among different groups
Function prediction via Picrust2 showed that obviously different functions of KEGG level of organismal systems (P < 0.05), genetic information processing (P < 0.05) and metabolism (P < 0.05) were examined between CC and ML mice (Table 5). Phenotypic analysis bugbase revealed that Contains_Mobile_Elements (P < 0.05), Gram_Negative (P < 0.05) and Gram_Positive were observably higher in ML mice, Facultatively_Anaerobic (P < 0.05), Potentially_Pathogenic (P < 0.05) and Stress_Tolerant (P < 0.05) were significantly higher in mice in CL and ML (Table 6). Tax4Fun analysis found that glycan biosynthesis and metabolism (GBD) (P < 0.01), circulatory system (P < 0.01), translation (P < 0.05), transcription (P < 0.05), folding, sorting and degradation (FSD) (P < 0.05), replication and repair (RR) (P < 0.05), and endocrine and metabolic diseases (EMDs) in CL animals were obviously lower than mice in CC, while metabolism of other amino acids (P < 0.05), cellular community-prokaryotes (P < 0.05) and signal transduction (P < 0.05) were significantly higher. Compared with mice in group CC, metabolism of other amino acids (P < 0.01), infectious diseases: bacterial (P < 0.05) and metabolism of terpenoids and polyketides (P < 0.05) were observably higher, while translation (P < 0.01), transcription (P < 0.05), GBD (P < 0.05), FSD (P < 0.05), RR (P < 0.05), and circulatory system (P < 0.05) were lower (Figure 12A). FAPROTAX analysis showed that nitrate reduction (P < 0.05) and chemoheterotrophy (P < 0.05) in CL and ML were memorably lower than CC, while nitrate reduction (P < 0.01), human pathogens all (P < 0.05), mammal gut (P < 0.05) and human gut (P < 0.05) were significantly higher in ML. Compared with animals in MC, nitrate reduction (P < 0.01), human pathogens (P < 0.05) and mammal gut (P < 0.05) were obviously higher in animals in ML group (Figure 12B).
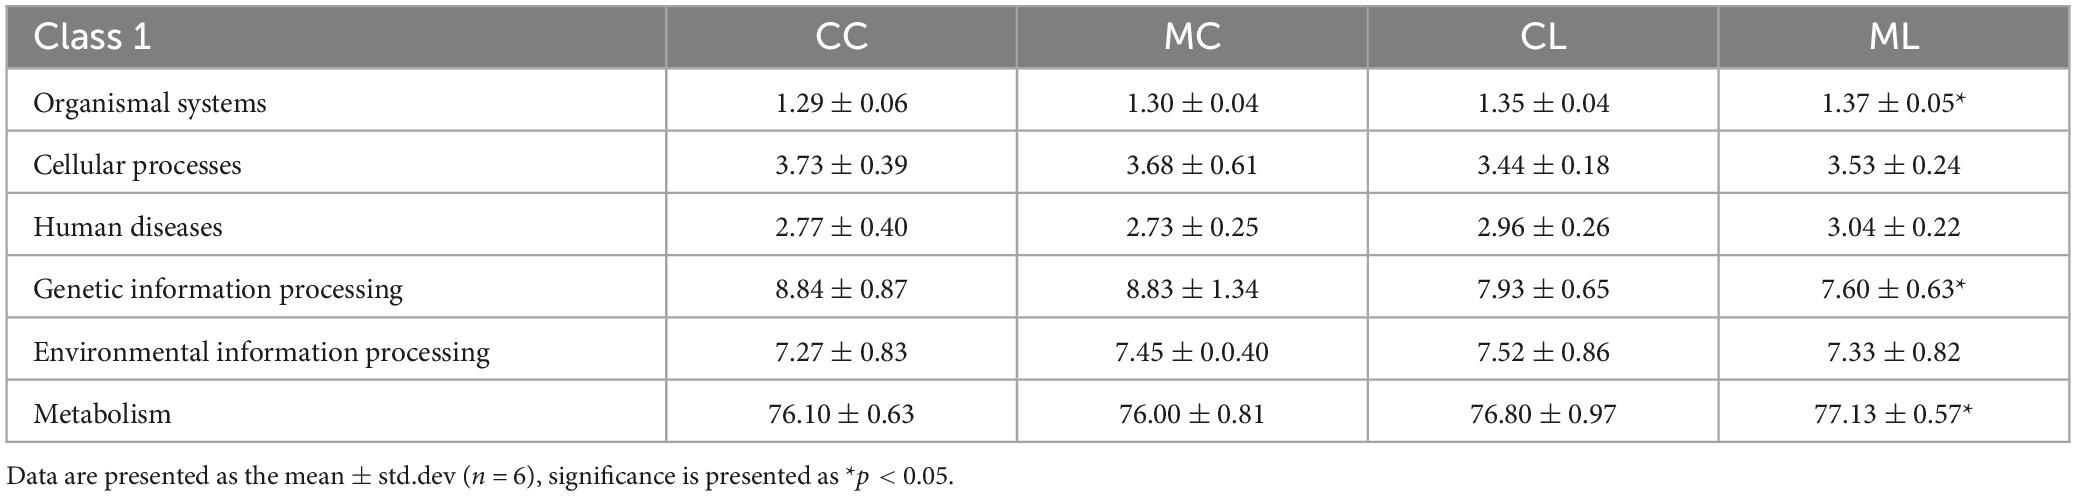
Table 5. Comparing KEGG level 1 function of mice microbiota in different groups via picrust2.

Table 6. Comparing phenotypic analysis of mice microbiota in different groups via bugbase prediction.
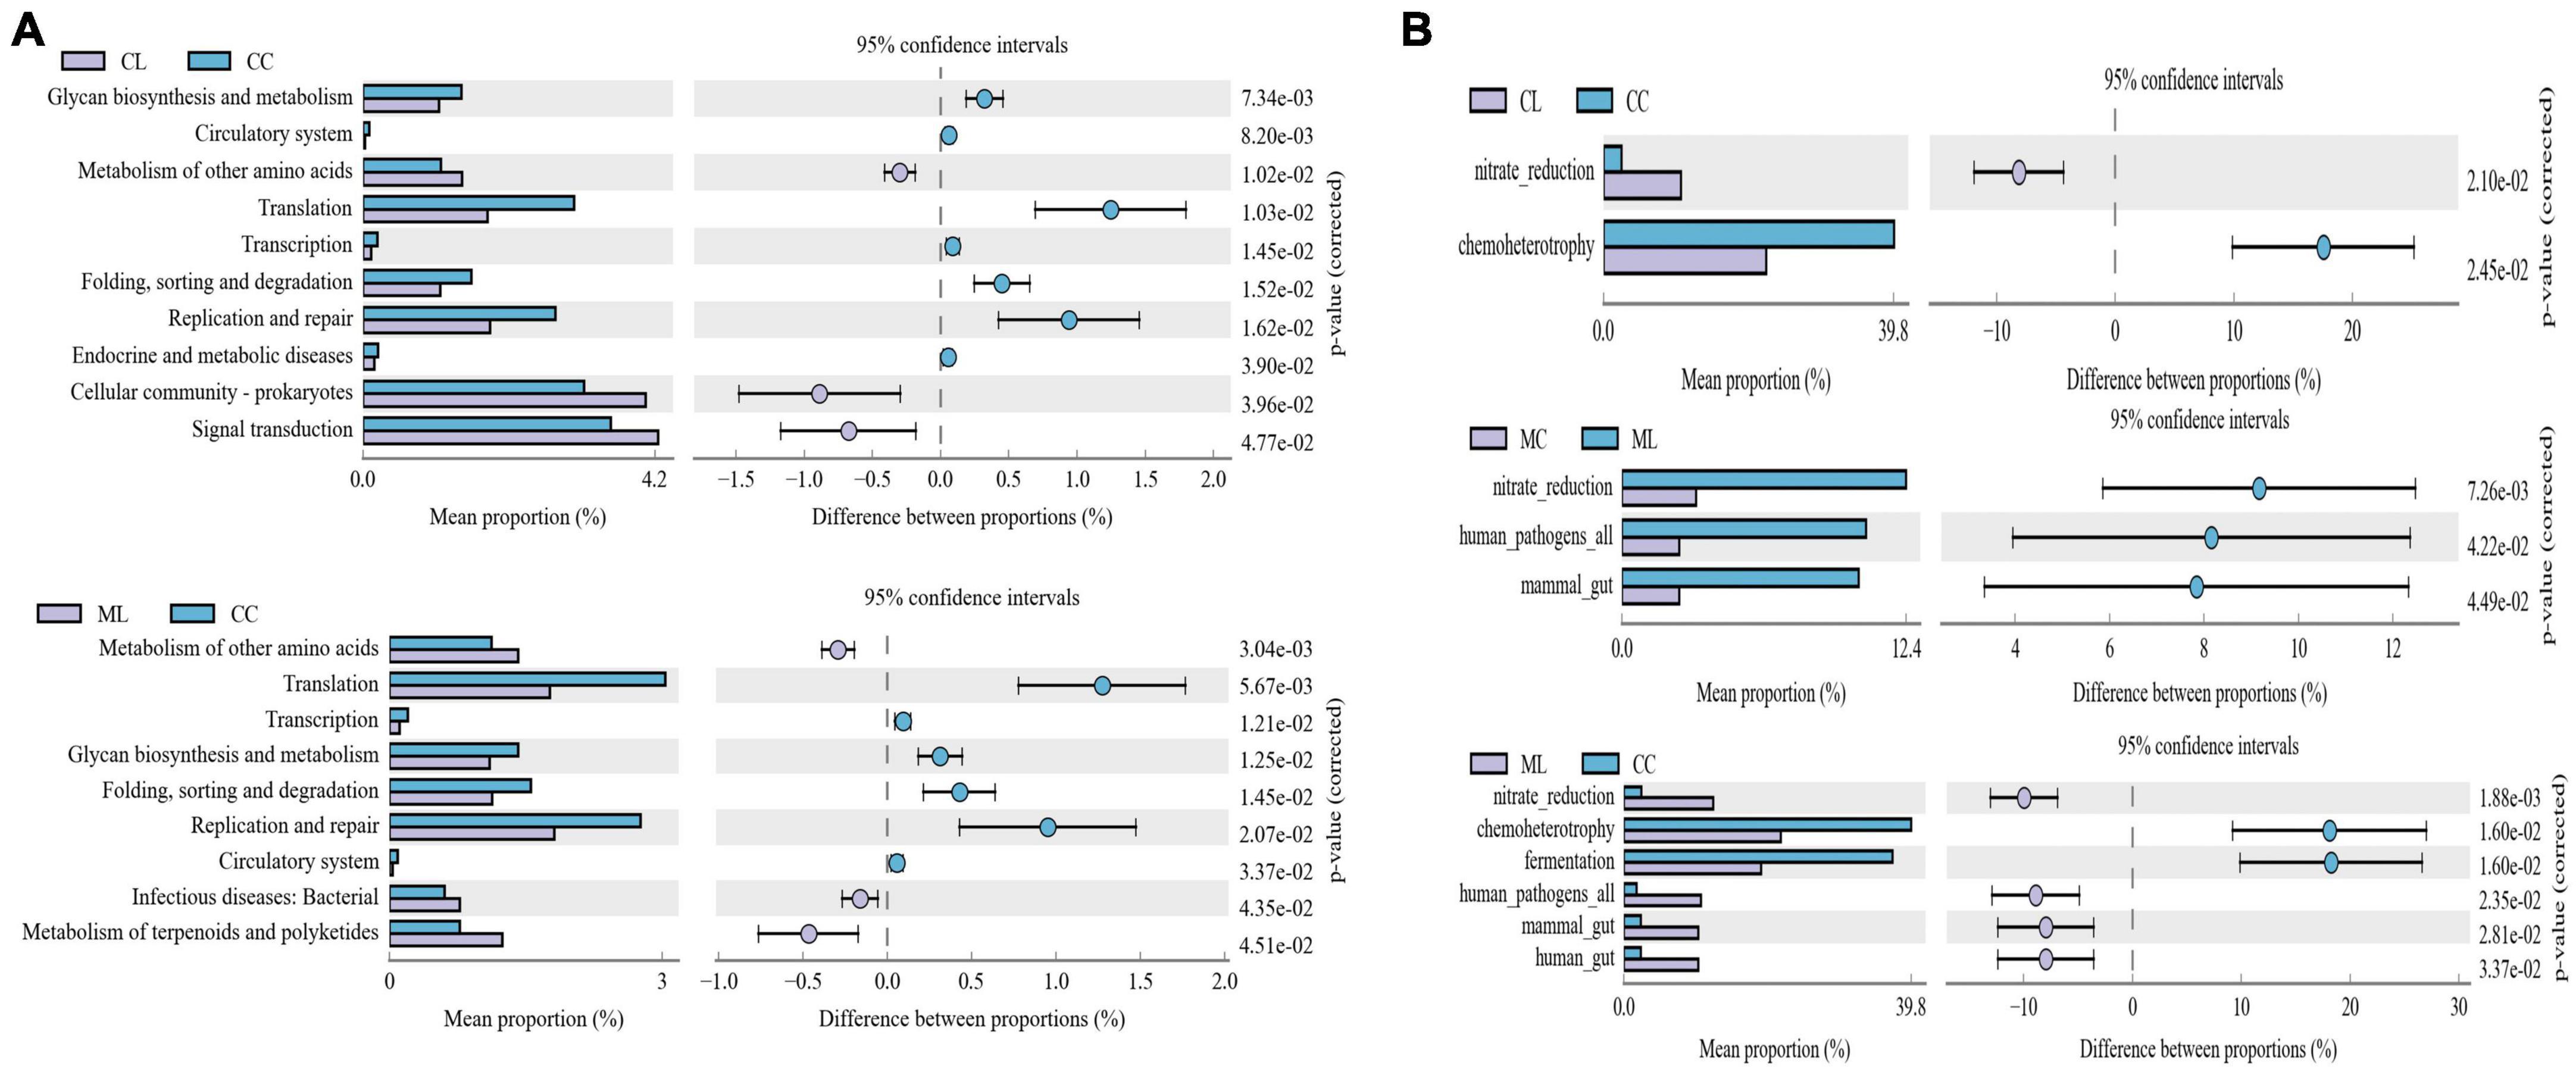
Figure 12. Potential Function prediction analysis of mouse microbiota. (A) Tax4Fun, (B) FAPROTAX.
LPS and cold normal saline changed metabolites in mice among different groups
Out of 4,320 metabolites, 2,181 and 2,139 were in positive and negative ion mode, respectively in mice in our study. Those metabolites were mainly annotated to amino acid metabolism and lipid metabolism via KEGG (Figure 13A), lipids and lipid-like molecules and organic acids and derivatives via HMDB (Figure 13B), and fatty acyls and glycerolipids via LIPID MAPS (Figure 13C). Compared with CC mice, there were 43 up-regulated and 19 down-regulated metabolites in MC animal, 410 up-regulated and 968 down-regulated metabolites in CL animal, while 213 up-regulated and 128 down-regulated metabolites in CL animals. Compared with group MC, there were 205 up-regulated and 792 down-regulated metabolites in CL animal, whereas 182 up-regulated and 103 down-regulated metabolites in ML animals. Compared with CL group, there were 1,046 up-regulated and 428 down-regulated metabolites in ML animals (Figure 14). Venn map showed that there were no shared differential metabolites among mice groups (Figure 15). Z-score analysis of top 30 differential metabolites in animals showed that the abundance of metabolites in mice treated with ice-cold normal saline decreased with red balls mainly distributed in MC and ML sides, while LPS challenging could increase the abundance of metabolites with more red balls in the CL sides (Supplementary Figure 2). To further reveal the marker metabolites between mice groups, we examined metabolites between CC vs. MC and CC vs. ML. The results showed that compared with mice in group CC, neg_3481 (P < 0.05), neg_457 (P < 0.01), neg_7126 (P < 0.05), pos_771 (P < 0.05), pos_715 (P < 0.05), neg_539 (P < 0.05), neg_4796 (P < 0.05), pos_1504 (P < 0.05), pos_3391 (P < 0.05), neg_6883 (P < 0.05) and pos_4916 (P < 0.05) were obviously higher in group MC and ML, while neg_6324 (P < 0.05) and pos_783 (P < 0.05) were significantly lower in group MC and ML. The abundance of neg_6169 (P < 0.05) and neg_6271 (P < 0.05) were observably lower in MC than CC, while higher in ML. The abundance of neg_1751 (P < 0.01), neg_87 (P < 0.01), pos_699 (P < 0.05) and pos_4607 (P < 0.05) in MC were markedly higher (P < 0.05) than CC, while lower in ML (Supplementary Figure 3). Whereas, comparing of metabolites in mice in CC indicated that 127 shared differential metabolites in group CL and ML, with 94 lower abundant metabolites and 33 higher abundant metabolites (Table 7).
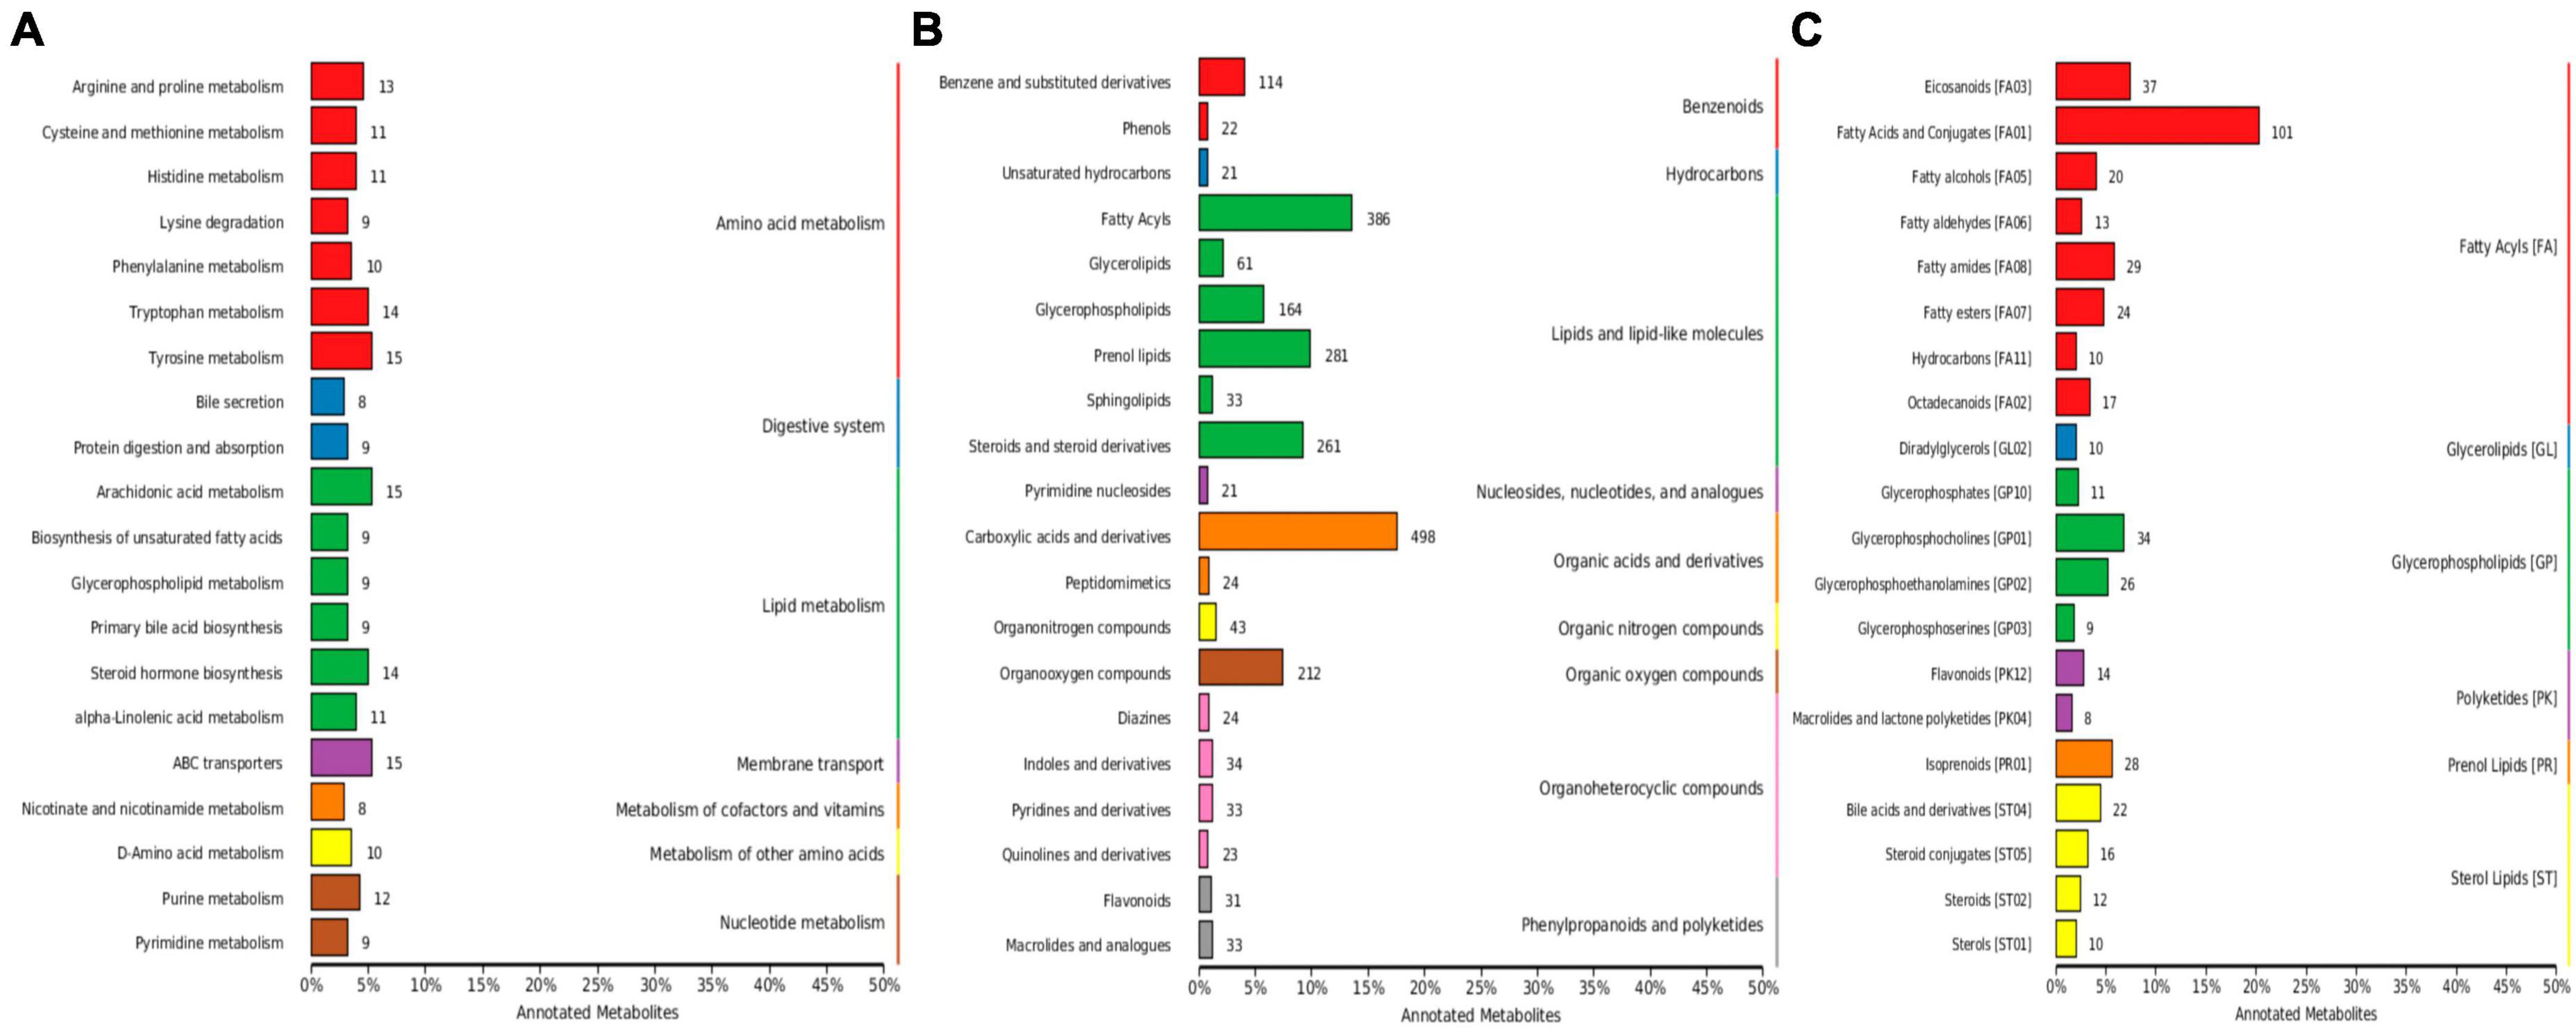
Figure 13. Metabolites annotation of mice. (A) KEGG, (B) HMDB, and (C) LIPID MAPS.

Figure 14. Volcano plot of differential metabolites in mice.
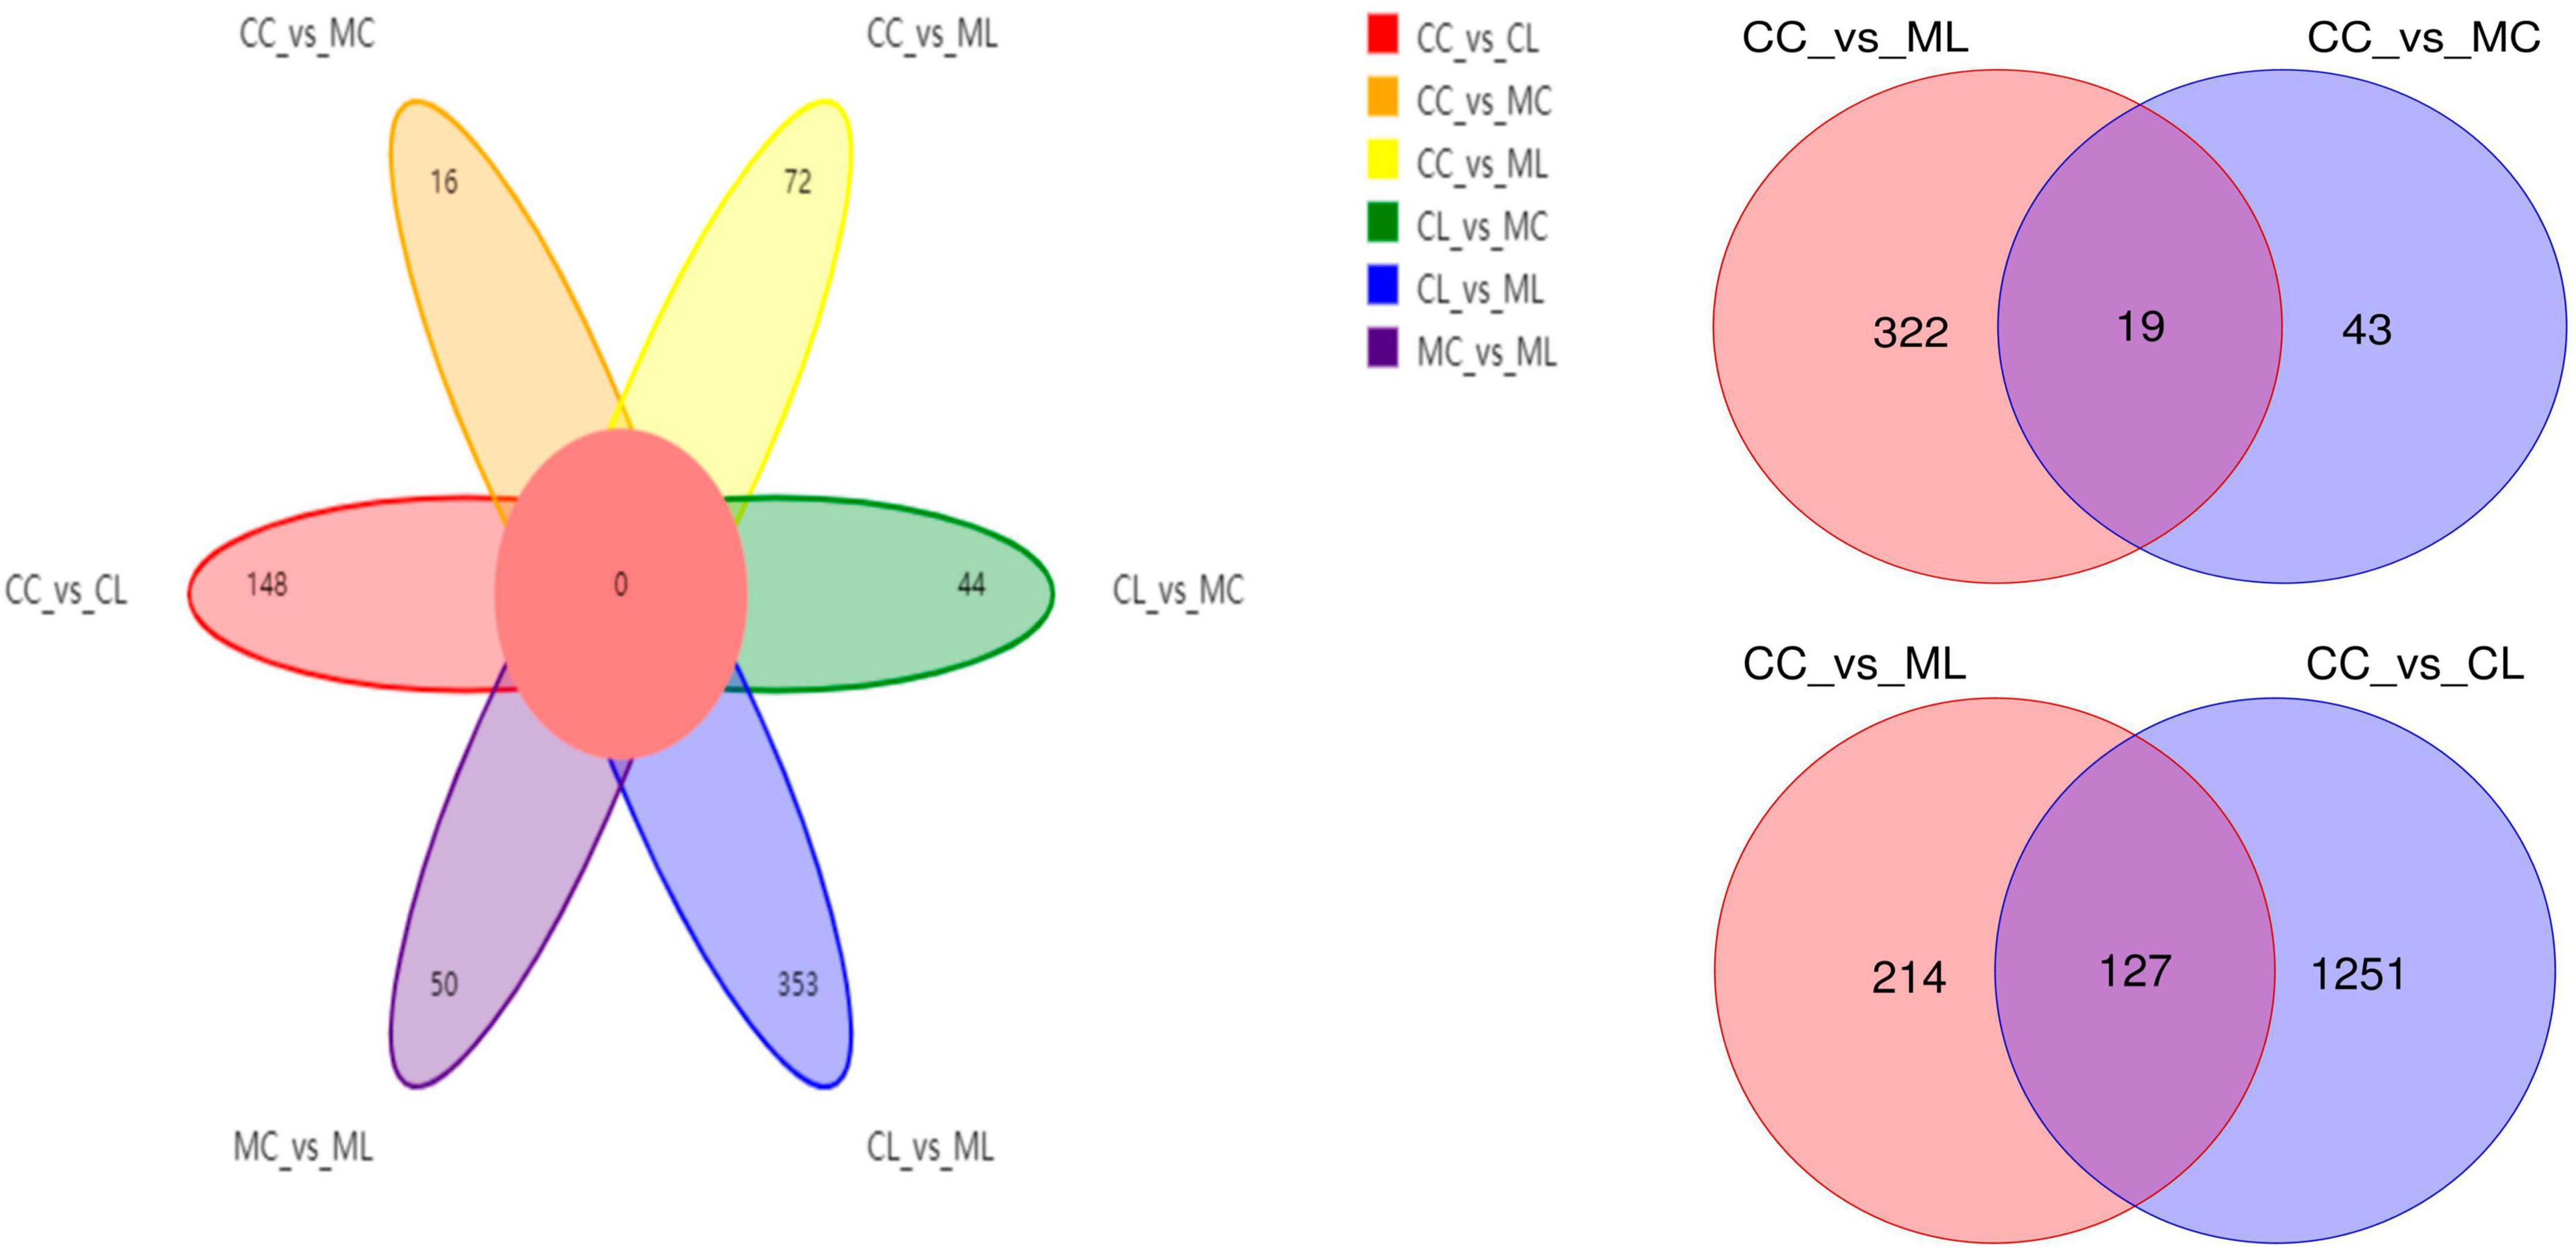
Figure 15. Venn map of differential metabolites among different mice groups.

Table 7. Comparing of differential metabolites among different mice groups.
Correlation analysis of gut microbiota and inflammatory cytokines in mice
Correlation analysis showed that Enterococcus and Escherichia_Shigella were both positively related to TNF-α, IL-1β and IL-6, while Lachnospiraceae_UCG_001 and unclassified_Lachnospiraceae were negatively related to these inflammatory cytokines. Bacteroides was positively related to TNF-α, Parateroides was positively related to IL-10, TNF-α and IL-1β, and unclassified_Muribaculaceae was positively related to IL-10, while Colidextribacter and Lachnospiraceae_NK4A136_group were negatively related to IL-1β and IL-6 (Supplementary Figure 4).
Discussion
During the winter period or in cold areas, cold water can induce stress in animals. When it is combined with factors such as feed supplements, social factors and environmental stresses, it can significantly impair the function of the digestive system in animals, and lead to growth performance disorders (Yin et al., 2014; Oraby et al., 2021; Rehman et al., 2021). In this study, we aimed to investigate the impact of cold stimulus combined with LPS on mice. Our findings revealed that the mice treated with cold normal saline exhibited a slightly lower body weight. This observation is consistent with previous studies conducted on pigs in which different temperature water treatments influenced the body weight (Zhang et al., 2020). Pathological analysis revealed that cold stress had minimal impact on the integrity of intestinal villi and gastric epithelium, while LPS significantly destroyed the villi. These findings are congrant with previous studies conducted on cold-stressed broilers (Su et al., 2018) and LPS-challenged hens (Feng et al., 2023).
Furthermore, the cytokines TNF-α and IL-6 were significantly more expressed in mice challenged with LPS and cold normal saline stress compared to other groups. Whereas, IL-1β level was similar between groups CC and CL, but it was significantly elevated in mice treated with cold normal saline + LPS. Previous study reported that chronic cold exposure upregulated IL6 and TNFα level in the blood of mice (Bal et al., 2017). Our findings are in line with their results in which cold normal saline stress increase the expression of TNF-α and IL-6.
To explore the potential mechanisms, we detected the gene expressions of tight junction proteins in small intestine (jejunum and ileum). Among them OCCLUDIN is recognized as important component of intestinal permeability (Chen et al., 2015, 2022). Whereas, relative gene expression confirmed that significant differences were detected in the expression levels of OCCLUDIN and CASPASE-1 in mice in the CL and ML groups. The expression of OCCLUDIN is in line with a study on inflammatory bowel disease in humans (Chen et al., 2015), while expression of CLAUDIN is in line with He et al. (2022). Additionally, slight differences in CLAUDIN and NLRP3 were observed between mice in the CL and ML groups. Previous studies found that the activation of Caspase-1 by NLRP3 cause inflammation reaction (Sho and Xu, 2019; He et al., 2022).
Moreover, our study assessed the antioxidant indexes, NO levels, and cytokine levels in the serum of various groups in mice. Our findings revealed that cold stress reduced the antioxidant capacity in LPS-challenged mice by lowering the level of T-AOC, GSH-Px, and SOD, and increasing the level of MDA. Additionally, cold stress promoted an inflammatory response, as evidenced by higher levels of IL-1β in mice treated with cold normal saline + LPS. Previous studies have mentioned that the expression of antioxidant is disturbed in different inflammatory conditions (Sho and Xu, 2019; Aziz et al., 2021; Murtaza et al., 2021). Gut microbiome analyzing showed that cold stress led to a decrease in data numbers in the MC group, as well as a reduction in the Shannon and Simpson indexes in the ML group. Moreover, cold stress increased the beta diversities of PCA, PCoA, and NMDS.
To further investigate the distinguished bacteria influenced by cold stress and LPS, we conducted LEfSe analysis and identified 12 biomarkers (o__Enterobacterales, C__Gammaproteobacteria, p__Proteobacteria, f__Enterobacteriaceae, s__unclassified_Escherichia_Shigella, g__Escherichia_Shigella, p__Firmicutes, c__Clostridia, o__Oscillospirales, f__Oscillospiraceae, s__unclassified_Bacteroides and g__Lachnospiraceae_NK4A136_group) in different mouse groups, which was partly in line with the results in cold stress treated rates (Sun et al., 2023). Among them higher abundance of pathogenic s__unclassified_Escherichia_Shigella and g__Escherichia_Shigella were found in mice in ML, which inferred that cold stress could promote the colonization of harmful bacteria in LPS induced mice. When compared with CC mice, the abundance of 20, 20, and 19 genera were obviously different with MC, CL, and MC animals, respectively. Compared with MC mice, the abundance of 20 and 20 genus were prominently different with mice in CL and ML groups, respectively. There were different 20 genus between CL and ML. Further analysis revealed significant differences in the abundance of 4 phyla and 24 genera were among the mouse groups. Notably, the abundance of Candidatus_Solibacter in the ML group was lower compared to the other groups, particularly the CL group. Previous studies have reported a positive correlation between Candidatus Solibacter, Peptococcus, and antioxidant capacity (Peng et al., 2021; Kong et al., 2022), which is suggesting that the decreased abundance of these genera in the MC and ML groups may indicate reduced oxidative resistance in animals exposed to cold stress.
Additionally, Escherichia_Shigella is a genus known to cause mucosal inflammation and has been found in abundant in mice with ulcerative colitis and individuals with Crohn’s disease (Jialing et al., 2020; Ma et al., 2022). The higher abundance of this genus observed in mice in the MC and ML groups, particularly in the ML animals, is consistent with previous studies (Chen et al., 2022). This finding suggests that cold stress may exacerbate intestinal inflammation in mice. On the other hand, lower abundances of Family_XIII_UCG_001, Lachnospiraceae_UCG_001, Novosphingobium, RB41, and Tyzzerella have been previously reported in chronic colitis mice (Huangfu et al., 2021; Xu et al., 2021), Crohn’s disease patients (Jiang et al., 2022), ulcerative colitis mice (Wang et al., 2019), heat stress-induced rabbits (Shi et al., 2022) and Alzheimer patients (Kaiyrlykyzy et al., 2022), respectively. These findings are consistent with the observations in the MC and ML groups of the current study, which indicated that cold stress may have a negative impact on mice by reducing the abundance of these four genera.
The proportion of Mucispirillum was higher in cold stressed mice, which was in agreement with findings in colitis mouse (Li et al., 2022). Providencia is an opportunistic pathogenic genera known to cause acute enteric infection (Ovchinnikova et al., 2013), and its higher abundance has been previously reported in diarrheal dogs (Herstad et al., 2021). The increased abundance of this pathogenic genus may contribute to intestinal injury in mice. Staphylococcus is also a pathogenic genera threatening public health (Hoveida et al., 2019), which may infer that this genera negatively affect animals in the current study.
Previous studies found that unclassified_Lachnospiraceae, Unclassified_Peptococcaceae and unclassified_Sphingomonadaceae were negatively associated with the pathogenesis of type 2 diabetes (Kim et al., 2022), pulmonary fibrosis (Li et al., 2022), and mastitis in camel, respectively. These findings are consistent with the decreased abundance of these three genera observed in the cold-stressed animals in the current study. Roseburia is a promising probiotic genus known to improve the gut ecosystem (Sanders et al., 2019; Seo et al., 2020). The lower abundance of Roseburia in the MC and ML groups may indicate that cold stress contributes to damage by reducing the presence of this genus.
Cold stress and LPS induction also had an impact on the metabolites in mice. We detected a total of 4,320 metabolites, with 43 up-regulated and 19 down-regulated metabolites in the CC vs. MC animal comparison. Similarly, in the comparison of ML vs. CL animals, we observed 1,046 up-regulated and 428 down-regulated metabolites. Z-score analysis further confirmed the changes in metabolites induced by cold stress. Among these metabolites, there were 19 that showed significant changes between CC vs. MC and CC vs. ML groups. These metabolites include (neg_3481, neg_457, neg_7126, pos_771, pos_715, neg_539, neg_4796, pos_1504, pos_3391, neg_6883, pos_4916, neg_6324, pos_783, neg_6169, neg_6271, neg_1751, neg_87, pos_699, and pos_4607). The alterations in these metabolites, induced by cold stress and LPS, ultimately led to changes in microbiota function.
There are many reports in which it is mentioned that systemic LPS treatment in mice severely impact whole body temperature as well as induce thermogenesis proteins in the skeletal muscle (Bal et al., 2021). In our study, LPS treatment is probably is not systemic, that’s why there were no noticeable induction of thermogenesis proteins in the skeletal muscle. This may be a limitation of present study.
Conclusion
In conclusion, we investigated the impact of cold stress on LPS-induced mice and observed that cold stress exacerbated intestinal damage by disrupting the balance of gut microbiota and altering its metabolites. These findings have important implications for improving the feeding and management practices of livestock in cold regions or during cold periods.
Data availability statement
The data presented in this study are deposited in the NCBI database under BioProject accession number PRJNA972973 (https://www.ncbi.nlm.nih.gov/bioproject/PRJNA972973/).
Ethics statement
All the experiment operations were under the instructions and approval of Laboratory Animals Research Centre of Jiangsu, China and the Ethics Committee of Nanjing Agricultural University. The study was conducted in accordance with the local legislation and institutional requirements.
Author contributions
JL: Data curation, Formal analysis, Investigation, Methodology, Writing—original draft, Writing—review and editing. ZC: Data curation, Investigation, Methodology, Formal analysis, Writing—review and editing. MW: Data curation, Investigation, Methodology, Writing—review and editing. MA: Formal analysis, Validation, Writing—review and editing. PY: Conceptualization, Funding acquisition, Project administration, Supervision, Validation, Visualization, Writing—review and editing.
Funding
The author(s) declare financial support was received for the research, authorship, and/or publication of this article. This study was supported by the Public Welfare Industry (Agriculture) Scientific Research Projects (201303145) and the National Natural Science Foundation of China (31501930).
Acknowledgments
The authors extend their appreciation to the Researchers Supporting Project number (RSP2023R191), King Saud University, Riyadh, Saudi Arabia.
Conflict of interest
The authors declare that the research was conducted in the absence of any commercial or financial relationships that could be construed as a potential conflict of interest.
Publisher’s note
All claims expressed in this article are solely those of the authors and do not necessarily represent those of their affiliated organizations, or those of the publisher, the editors and the reviewers. Any product that may be evaluated in this article, or claim that may be made by its manufacturer, is not guaranteed or endorsed by the publisher.
Supplementary material
The Supplementary Material for this article can be found online at: https://www.frontiersin.org/articles/10.3389/fmicb.2023.1256748/full#supplementary-material
Supplementary Figure 1 | Comparing of villus height and crypt depth in mice in different groups. (A) jejunum, (B) ileum, (C) colon. Significance is presented as *p < 0.05, **p < 0.01, ***p < 0.001, and ****p < 0.0001; data are presented as the mean ± SEM (n = 3).
Supplementary Figure 2 | Z-score analysis of top 30 differential metabolites among different mice groups.
Supplementary Figure 3 | Comparing of differential metabolites among different mice groups.
Supplementary Figure 4 | Analysis of the correlation between gut microbiota and inflammatory cytokines in mice.
References
Aljahdali, N. H., Sanad, Y. M., Han, J., and Foley, S. L. (2020). Current knowledge and perspectives of potential impacts of Salmonella enterica on the profile of the gut microbiota. BMC Microbiol. 20:353. doi: 10.1186/s12866-020-02008-x
Aziz, S., Abdullah, S., Anwar, H., Latif, F., and Mustfa, W. (2021). Effect of engineered nickel oxide nano particles on antioxidant enzymes in fresh water fish, Labeo rohita. Pak. Vet. J. 41, 424–428. doi: 10.29261/pakvetj/2021.044
Bal, N. C., Gupta, S. C., Pant, M., Sopariwala, D. H., Gonzalez-Escobedo, G., Turner, J., et al. (2021). Is upregulation of sarcolipin beneficial or detrimental to muscle function? Front. Physiol. 12:633058. doi: 10.3389/fphys.2021.633058
Bal, N. C., Maurya, S. K., Pani, S., Sethy, C., Banerjee, A., Das, S., et al. (2017). Mild cold induced thermogenesis: Are BAT and skeletal muscle synergistic partners? Biosci. Rep. 37:BSR20171087. doi: 10.1042/BSR20171087
Bolyen, E., Rideout, J. R., Dillon, M. R., Bokulich, N. A., Abnet, C. C., Al-Ghalith, G. A., et al. (2019). Reproducible, interactive, scalable and extensible microbiome data science using QIIME 2. Nat. Biotechnol. 37, 852–857. doi: 10.1038/s41587-019-0209-9
Callahan, B. J., Mcmurdie, P. J., Rosen, M. J., Han, A. W., Johnson, A. J. A., and Holmes, S. P. (2016). DADA2: high-resolution sample inference from Illumina amplicon data. Nat. Methods 13, 581–583. doi: 10.1038/nmeth.3869
Chen, C., Luo, F., Wu, P., Huang, Y., Das, A., Chen, S., et al. (2020). Metabolomics reveals metabolite changes of patients with pulmonary arterial hypertension in China. J. Cell. Mol. Med. 24, 2484–2496. doi: 10.1111/jcmm.14937
Chen, H., and Boutros, P. C. (2011). VennDiagram: a package for the generation of highly-customizable Venn and Euler diagrams in R. BMC Bioinformatics 12:35. doi: 10.1186/1471-2105-12-35
Chen, J., Tellez, G., Richards, J. D., and Escobar, J. (2015). Identification of potential biomarkers for gut barrier failure in broiler chickens. Front. Vet. Sci. 2:14. doi: 10.3389/fvets.2015.00014
Chen, X., Kong, Q., Zhao, X., Zhao, C., Hao, P., Irshad, I., et al. (2022). Sodium acetate/sodium butyrate alleviates lipopolysaccharide-induced diarrhea in mice via regulating the gut microbiota, inflammatory cytokines, antioxidant levels, and NLRP3/Caspase-1 signaling. Front. Microbiol. 13:1036042. doi: 10.3389/fmicb.2022.1036042
Dong, H., Chen, X., Zhao, X., Zhao, C., Mehmood, K., Kulyar, M. F., et al. (2023). Intestine microbiota and SCFAs response in naturally Cryptosporidium-infected plateau yaks. Front. Cell. Infect. Microbiol. 13:1105126. doi: 10.3389/fcimb.2023.1105126
Dunn, W. B., Broadhurst, D., Begley, P., Zelena, E., Francis-Mcintyre, S., Anderson, N., et al. (2011). Procedures for large-scale metabolic profiling of serum and plasma using gas chromatography and liquid chromatography coupled to mass spectrometry. Nat. Protoc. 6, 1060–1083. doi: 10.1038/nprot.2011.335
Edgar, R. C. (2013). UPARSE: highly accurate OTU sequences from microbial amplicon reads. Nat. Methods 10, 996–998. doi: 10.1038/nmeth.2604
Fahy, E., Sud, M., Cotter, D., and Subramaniam, S. (2007). LIPID MAPS online tools for lipid research. Nucleic Acids Res. 35, W606–W612. doi: 10.1093/nar/gkm324
Feng, J., Li, Z., Ma, H., Yue, Y., Hao, K., Li, J., et al. (2023). Quercetin alleviates intestinal inflammation and improves intestinal functions via modulating gut microbiota composition in LPS-challenged laying hens. Poult. Sci. 102:102433. doi: 10.1016/j.psj.2022.102433
Fu, J., Liu, C., Zhang, Z., Xing, M., and Xu, S. (2013). Influence of inflammatory pathway markers on oxidative stress induced by cold stress in intestine of quails. Res. Vet. Sci. 95, 495–501. doi: 10.1016/j.rvsc.2013.05.006
Hassan, M., Ali, A., Wajid, M., Ahmad, A., Saleemi, M. K., Sarwar, Y., et al. (2021). Purification and antigenic detection of lipopolysaccharides of Salmonella enterica serovar Typhimurium isolate from Faisalabad, Pakistan. Pak. Vet. J. 41, 434–438. doi: 10.29261/pakvetj/2021.046
He, Y., Li, Z., Xu, T., Luo, D., Chi, Q., Zhang, Y., et al. (2022). Polystyrene nanoplastics deteriorate LPS-modulated duodenal permeability and inflammation in mice via ROS drived-NF-κB/NLRP3 pathway. Chemosphere 307:135662. doi: 10.1016/j.chemosphere.2022.135662
Herstad, K. M. V., Trosvik, P., Haaland, A. H., Haverkamp, T. H. A., Muinck, E. J., and Skancke, E. (2021). Changes in the fecal microbiota in dogs with acute hemorrhagic diarrhea during an outbreak in Norway. J. Vet. Intern. Med. 35, 2177–2186. doi: 10.1111/jvim.16201
Hoveida, L., Halaji, M., Rostami, S., and Mobasherizadeh, S. (2019). Biofilm-producing ability of Staphylococcus spp isolated from different foodstuff products. Ann. Ig. 31, 140–147. doi: 10.7416/ai.2019.2266
Huangfu, L., Cai, X., Yang, J., Wang, H., Li, Y., Dai, Z., et al. (2021). Irisin attenuates inflammation in a mouse model of ulcerative colitis by altering the intestinal microbiota. Exp. Ther. Med. 22:1433. doi: 10.3892/etm.2021.10868
Jialing, L., Yangyang, G., Jing, Z., Xiaoyi, T., Ping, W., Liwei, S., et al. (2020). Changes in serum inflammatory cytokine levels and intestinal flora in a self-healing dextran sodium sulfate-induced ulcerative colitis murine model. Life Sci. 263:118587. doi: 10.1016/j.lfs.2020.118587
Jiang, J., Chen, L., Chen, Y., and Chen, H. (2022). Exclusive enteral nutrition remodels the intestinal flora in patients with active Crohn’s disease. BMC Gastroenterol. 22:212. doi: 10.1186/s12876-022-02293-y
Joo, S. Y., Park, M. J., Kim, K. H., Choi, H. J., Chung, T. W., Kim, Y. J., et al. (2016). Cold stress aggravates inflammatory responses in an LPS-induced mouse model of acute lung injury. Int. J. Biometeorol. 60, 1217–1225.
Kaiyrlykyzy, A., Kozhakhmetov, S., Babenko, D., Zholdasbekova, G., Alzhanova, D., Olzhayev, F., et al. (2022). Study of gut microbiota alterations in Alzheimer’s dementia patients from Kazakhstan. Sci. Rep. 12:15115. doi: 10.1038/s41598-022-19393-0
Kanehisa, M., and Goto, S. (2000). KEGG: kyoto encyclopedia of genes and genomes. Nucleic Acids Res. 1, 27–30.
Kim, K., Lee, S., Park, S. C., Kim, N. E., Shin, C., Lee, S. K., et al. (2022). Role of an unclassified Lachnospiraceae in the pathogenesis of type 2 diabetes: a longitudinal study of the urine microbiome and metabolites. Exp. Mol. Med. 54, 1125–1132. doi: 10.1038/s12276-022-00816-x
Kong, L., Wang, Z., Xiao, C., Zhu, Q., and Song, Z. (2022). Glycerol monolaurate attenuated immunological stress and intestinal mucosal injury by regulating the gut microbiota and activating AMPK/Nrf2 signaling pathway in lipopolysaccharide-challenged broilers. Anim. Nutr. 10, 347–359. doi: 10.1016/j.aninu.2022.06.005
Langille, M. G. I., Zaneveld, J., Caporaso, J. G., Mcdonald, D., Knights, D., Reyes, J. A., et al. (2013). Predictive functional profiling of microbial communities using 16S rRNA marker gene sequences. Nat. Biotechnol. 31, 814–821. doi: 10.1038/nbt.2676
Lee, Y. S., Lee, S. H., Gadde, U. D., Oh, S. T., Lee, S. J., and Lillehoj, H. S. (2018). Allium hookeri supplementation improves intestinal immune response against necrotic enteritis in young broiler chickens. Poult. Sci. 97, 1899–1908. doi: 10.3382/ps/pey031
Li, Q., Wu, W., Fang, X., Chen, H., Han, Y., Liu, R., et al. (2022). Structural characterization of a polysaccharide from bamboo (Phyllostachys edulis) shoot and its prevention effect on colitis mouse. Food Chem. 387:132807. doi: 10.1016/j.foodchem.2022.132807
Li, S., Li, J., Liu, Y., Li, C., Zhang, R., and Bao, J. (2020). Effects of intermittent mild cold stimulation on mRNA expression of immunoglobulins, cytokines, and toll-like receptors in the small intestine of broilers. Animals 10:1492. doi: 10.3390/ani10091492
Liu, X., Li, S., Zhao, N., Xing, L., Gong, R., Li, T., et al. (2022). Effects of acute cold stress after intermittent cold stimulation on immune-related molecules, intestinal barrier genes, and heat shock proteins in broiler ileum. Animals 12:3260. doi: 10.3390/ani12233260
Ma, X., Lu, X., Zhang, W., Yang, L., Wang, D., Xu, J., et al. (2022). Gut microbiota in the early stage of Crohn’s disease has unique characteristics. Gut Pathog. 14:46. doi: 10.1186/s13099-022-00521-0
Matsuoka, K., and Kanai, T. (2015). The gut microbiota and inflammatory bowel disease. Semin. Immunopathol. 37, 47–55. doi: 10.1007/s00281-014-0454-4
Meng, M., Huo, R., Wang, Y., Ma, N., Shi, X., Shen, X., et al. (2022). Lentinan inhibits oxidative stress and alleviates LPS-induced inflammation and apoptosis of BMECs by activating the Nrf2 signaling pathway. Int. J. Biol. Macromol. 222, 2375–2391. doi: 10.1016/j.ijbiomac.2022.10.024
Murtaza, S., Khan, J. A., Aslam, B., and Faisal, M. N. (2021). Pomegranate peel extract and quercetin possess antioxidant and hepatoprotective activity against concanavalin A-induced liver injury in mice. Pak. Vet. J. 41, 197–202. doi: 10.29261/pakvetj/2020.097
Naibaho, F. G., Hartanto, A., Bintang, M., Jamilah, I., Priyani, N., and Putra, E. D. (2021). GC-MS analysis and antimicrobial activity of the aqueous extract from the bulbs of Allium chinense G. Don. cultivated in North Sumatra, Indonesia. Asian J. Agric. Biol. 2021:201912562. doi: 10.35495/ajab.2019.12.562
Nishida, A., Inoue, R., Inatomi, O., Bamba, S., Naito, Y., and Andoh, A. (2018). Gut microbiota in the pathogenesis of inflammatory bowel disease. Clin. J. Gastroenterol. 11, 1–10. doi: 10.1007/s12328-017-0813-5
Nishino, K., Nishida, A., Inoue, R., Kawada, Y., Ohno, M., Sakai, S., et al. (2018). Analysis of endoscopic brush samples identified mucosa-associated dysbiosis in inflammatory bowel disease. J. Gastroenterol. 53, 95–106. doi: 10.1007/s00535-017-1384-4
Ondov, B. D., Bergman, N. H., and Phillippy, A. M. (2011). Interactive metagenomic visualization in a Web browser. BMC Bioinformatics 12:385. doi: 10.1186/1471-2105-12-385
Oraby, M. I., Baraka, T. A., and Rakha, G. H. (2021). Impact of cadmium intoxication on health status, rumen and blood constituents in Egyptian Ossimi sheep. Int. J. Vet. Sci. 10, 102–106.
Ovchinnikova, O. G., Rozalski, A., Liu, B., and Knirel, Y. A. (2013). O-antigens of bacteria of the genus providencia: structure, serology, genetics, and biosynthesis. Biochemistry (Mosc) 78, 798–817. doi: 10.1134/S0006297913070110
Parks, D. H., Tyson, G. W., Hugenholtz, P., and Beiko, R. G. (2014). STAMP: statistical analysis of taxonomic and functional profiles. Bioinformatics 30, 3123–3124. doi: 10.1093/bioinformatics/btu494
Peng, S., Wang, X., Wang, Y., Lv, T., Zhao, H., Wang, Y., et al. (2021). Effects of dietary Bacillus and non-starch polysaccharase on the intestinal microbiota and the associated changes on the growth performance, intestinal morphology, and serum antioxidant profiles in ducks. Front. Microbiol. 12:786121. doi: 10.3389/fmicb.2021.786121
Rehman, A., Hassan, F., Qamar, R., and Rehman, A. U. (2021). Application of plant growth promoters on sugarcane (Saccharum officinarum L.) budchip under subtropical conditions. Asian J. Agric. Biol. 2021:202003202. doi: 10.35495/ajab.2020.03.202
Romanovsky, A. A., Almeida, M. C., Aronoff, D. M., Ivanov, A. I., Konsman, J. P., Steiner, A. A., et al. (2005). Fever and hypothermia in systemic inflammation: recent discoveries and revisions. Front. Biosci. 10:2193–2216. doi: 10.2741/1690
Ruan, D., Wu, S., Fouad, A. M., Zhu, Y., Huang, W., Chen, Z., et al. (2022). Curcumin alleviates LPS-induced intestinal homeostatic imbalance through reshaping gut microbiota structure and regulating group 3 innate lymphoid cells in chickens. Food Funct. 13, 11811–11824. doi: 10.1039/D2FO02598A
Rudaya, A. Y., Steiner, A. A., Robbins, J. R., Dragic, A. S., and Romanovsky, A. A. (2005). Thermoregulatory responses to lipopolysaccharide in the mouse: dependence on the dose and ambient temperature. Am. J. Physiol. Regul. Integr. Comp. Physiol. 289, R1244–R1252.
Ruigrok, R., Weersma, R. K., and Vich, V. A. (2023). The emerging role of the small intestinal microbiota in human health and disease. Gut Microbes 15:2201155. doi: 10.1080/19490976.2023.2201155
Sanders, M., Merenstein, D., Reid, G., Gibson, G., and Rastall, A. R. A. (2019). Probiotics and prebiotics in intestinal health and disease: from biology to the clinic. Nat. Rev. Gastroenterol. Hepatol. 16, 605–616.
Segata, N., Izard, J., Waldron, L., Gevers, D., Miropolsky, L., Garrett, W. S., et al. (2011). Metagenomic biomarker discovery and explanation. Genome Biol. 12:R60. doi: 10.1186/gb-2011-12-6-r60
Seo, B., Jeon, K., Moon, S., Lee, K., Kim, W., Jeong, H., et al. (2020). Roseburia spp. abundance associates with alcohol consumption in humans and its administration ameliorates alcoholic fatty liver in mice. Cell Host Microbe 27, 25–40.e6. doi: 10.1016/j.chom.2019.11.001
Shi, Y., Tang, L., Bai, X., Du, K., Wang, H., Jia, X., et al. (2022). Heat stress altered the vaginal microbiome and metabolome in rabbits. Front. Microbiol. 13:813622. doi: 10.3389/fmicb.2022.813622
Sho, T., and Xu, J. (2019). Role and mechanism of ROS scavengers in alleviating NLRP3-mediated inflammation. Biotechnol. Appl. Biochem. 66, 4–13. doi: 10.1002/bab.1700
Su, Y., Zhang, X., Xin, H., Li, S., Li, J., Zhang, R., et al. (2018). Effects of prior cold stimulation on inflammatory and immune regulation in ileum of cold-stressed broilers. Poult. Sci. 97, 4228–4237. doi: 10.3382/ps/pey308
Sun, L., Wang, X., Zou, Y., He, Y., Liang, C., Li, J., et al. (2023). Cold stress induces colitis-like phenotypes in mice by altering gut microbiota and metabolites. Front. Microbiol. 14:1134246. doi: 10.3389/fmicb.2023.1134246
Wang, C., Li, W., Wang, H., Ma, Y., Zhao, X., Zhang, X., et al. (2019). Saccharomyces boulardii alleviates ulcerative colitis carcinogenesis in mice by reducing TNF-α and IL-6 levels and functions and by rebalancing intestinal microbiota. BMC Microbiol. 19:246. doi: 10.1186/s12866-019-1610-8
Wang, J., Zhang, T., Shen, X., Liu, J., Zhao, D., Sun, Y., et al. (2016). Serum metabolomics for early diagnosis of esophageal squamous cell carcinoma by UHPLC-QTOF/MS. Metabolomics 12:116. doi: 10.1007/s11306-016-1050-5
Wang, Y., Xiao, H., Liu, Y., Tong, Q., Yu, Y., Qi, B., et al. (2022). Effects of Bu Shen Hua Zhuo formula on the LPS/TLR4 pathway and gut microbiota in rats with letrozole-induced polycystic ovary syndrome. Front. Endocrinol. 13:891297. doi: 10.3389/fendo.2022.891297
Wei, H., Zhang, R., Su, Y., Bi, Y., Li, X., Zhang, X., et al. (2018). Effects of acute cold stress after long-term cold stimulation on antioxidant status, heat shock proteins, inflammation and immune cytokines in broiler heart. Front. Physiol. 9:1589. doi: 10.3389/fphys.2018.01589
White, J. R., Nagarajan, N., and Pop, M. (2009). Statistical methods for detecting differentially abundant features in clinical metagenomic samples. PLoS Comput. Biol. 5:e1000352. doi: 10.1371/journal.pcbi.1000352
Wishart, D. S., Feunang, Y. D., Marcu, A., Guo, A. C., Liang, K., Vázquez-Fresno, R., et al. (2018). HMDB 4.0: the human metabolome database for 2018. Nucleic Acids Res. 46, D608–D617. doi: 10.1093/nar/gkx1089
Xu, H., Huang, H., Liu, Y., Zhu, J., Zhou, Y., Chen, H., et al. (2021). Selection strategy of dextran sulfate sodium-induced acute or chronic colitis mouse models based on gut microbial profile. BMC Microbiol. 21:279. doi: 10.1186/s12866-021-02342-8
Yin, J., Wu, M. M., Xiao, H., Ren, W. K., Duan, J. L., Yang, G., et al. (2014). Development of an antioxidant system after early weaning in piglets2. J. Anim. Sci. 92, 612–619. doi: 10.2527/jas.2013-6986
Zhang, Z., Li, Z., Zhao, H., Chen, X., Tian, G., Liu, G., et al. (2020). Effects of drinking water temperature and flow rate during cold season on growth performance, nutrient digestibility and cecum microflora of weaned piglets. Animals 10:1048. doi: 10.3390/ani10061048
Keywords: cold stress, LPS, mice, microbiome, metabolism
Citation: Li J, Cui Z, Wei M, Almutairi MH and Yan P (2023) Omics analysis of the effect of cold normal saline stress through gastric gavage on LPS induced mice. Front. Microbiol. 14:1256748. doi: 10.3389/fmicb.2023.1256748
Received: 11 July 2023; Accepted: 13 November 2023;
Published: 14 December 2023.
Edited by:
Hesong Wang, Southern Medical University, ChinaReviewed by:
Yu Pi, Chinese Academy of Agricultural Sciences, ChinaNaresh Chandra Bal, KIIT University, India
Copyright © 2023 Li, Cui, Wei, Almutairi and Yan. This is an open-access article distributed under the terms of the Creative Commons Attribution License (CC BY). The use, distribution or reproduction in other forums is permitted, provided the original author(s) and the copyright owner(s) are credited and that the original publication in this journal is cited, in accordance with accepted academic practice. No use, distribution or reproduction is permitted which does not comply with these terms.
*Correspondence: Peishi Yan, eWFucHNAaG90bWFpbC5jb20=