 Marcelo Baeza
 Dionisia Sepulveda2
 Jennifer Alcaíno
- 1Departamento de Ciencias Ecológicas, Facultad de Ciencias, Universidad de Chile, Santiago, Chile
- 2Facultad de Ciencias, Universidad de Chile, Santiago, Chile
Codon usage bias (CUB) has been described in viruses, prokaryotes, and eukaryotes and has been linked to several cellular and environmental factors, such as the organism's growth temperature, gene expression levels, and regulation of protein synthesis and folding. Most of the studies in this area have been conducted in bacteria and higher eukaryotes, in some cases with different results. In this study, a comparative analysis of CUB in yeasts isolated from cold and template environments was performed in order to evaluate the correlation of CUB with yeast optimal temperature of growth (OTG), gene expression levels, cellular function, and structure of encoded proteins. Among the main findings, highly expressed ORFs tend to have a more similar CUB within and between yeasts, and a direct correlation between codons ending in C and expression level was generally found. A low correspondence between CUB and OTG was observed, with an inverse correlation for some codons ending in C. The clustering of yeasts based on their CUB partially aligns with their OTG, being more consistent for yeasts with lower OTG. In most yeasts, the abundance of preferred codons was generally lower at the 5′ end of ORFs, higher in segments encoding beta strand, lower in segments encoding extracellular and transmembrane regions, and higher in “translation” and “energy metabolism” pathways, especially in highly expressed ORFs. Based on our findings, it is suggested that the abundance and distribution of preferred and non-preferred codons along mRNAs contribute to proper protein folding and functionality by regulating protein synthesis rates, becoming a more important factor under conditions that require faster protein synthesis in yeasts.
Introduction
Codon usage bias (CUB) has been described in viruses, bacteria, fungi, plants, and animals (Hershberg and Petrov, 2008), and it has been proposed that it correlates with various biological factors such as the GC content, gene expression levels, tRNA abundance, gene translation initiation signals, and protein structure (Ikemura, 1985; Bulmer, 1991; Hooper and Berg, 2000; D'Onofrio et al., 2002; Chen et al., 2004; Hershberg and Petrov, 2008; Plotkin and Kudla, 2011; Parvathy et al., 2022). It has been proposed that microorganisms with a wide range of habitats tend to have a higher variation of CUB, which may help them to adapt efficiently to different conditions. On the other hand, microorganisms with similar phenotypic traits and that thrive in similar environments tend to have a similar CUB (Botzman and Margalit, 2011; Hart et al., 2018; Arella et al., 2021). These tendencies were observed in a metagenomic study of samples from different regions and substrates, including the sea, farm soils, human gut, and acid mine drainage (Roller et al., 2013). Microorganisms inhabiting cold regions have attracted considerable attention in recent decades due to their important ecological roles and potential in applied fields (Margesin, 2017), and it has been suggested the existence of a distinct CUB pattern for life in the cold. Comparison of coding sequences from psychrophiles revealed a decreasing trend for GC-rich and G/C-ending codons, while a preference for AGG (Ser) in thermophiles and CAA (Val) in mesophiles and psychrophiles (Khan and Patra, 2018). In a comparative genomic analysis of 78 Cryobacterium strains, a correlation between the CUB and growth temperature was reported. Strains having maximum growth temperature of 20°C or below tended to use synonymous codons ending in A or T, while those with a maximum growth temperature above 20°C preferred codons ending in G or C (Liu et al., 2020). A similar trend was found in a genomic study of the psychrophilic bacterium Pseudoalteromonas shioyasakiensis (Duan and Guo, 2021). A transcriptomic analysis of eight Antarctic yeasts revealed a variation in CUB associated with their growth temperatures: yeasts with growth temperatures below 20°C preferred codons AAC (Asn), GAG (Glu), CAC (His), ATC (Ile), AAG (Asn), and TTC (Phe), while those with growth temperatures above 20°C showed a CUB similar to that of mesophilic yeasts (Baeza et al., 2022). A preference for GGA (Gly) and CGA (Arg) has been described in the yeast Mrakia psychrophila, which grows optimally at 12–15°C (Su et al., 2016).
A pronounced CUB has been reported in highly but not in low expressed genes. Gene expression levels can be related to translation efficiency, and mutational pressure and natural selection have been proposed as the major forces driving CUB through selection of “translationally superior” codons (dos Reis et al., 2003; Goetz and Fuglsang, 2005; Klumpp et al., 2012; Novoa and Ribas de Pouplana, 2012; Frumkin et al., 2018; Liu, 2020; Iriarte et al., 2021). Furthermore, there is increasing evidence of the impact of CUB on gene expression and protein structure by influencing translation efficiency and accuracy, co-translational protein folding, and mRNA stability (Higgs and Ran, 2008; Shah and Gilchrist, 2010; Angov, 2011; Trotta, 2013; Liu, 2020). Stable mRNAs in Saccharomyces cerevisiae, such as those encoding enzymes involved in glycolysis and the large and small cytosolic ribosomal subunit proteins, tend to have a higher content of preferred codons (above 85% on average) and unstable mRNAs, such as those encoding polypeptides involved in yeast pheromone response and mitochondrial ribosomal proteins, have a lower content of preferred codons (an average of about 45%; Presnyak et al., 2015). Studies using cell-free translation systems from Neurospora and Drosophila showed that CUB affects the local translation elongation rates: optimal synonymous codons accelerate elongation, while non-optimal codons deaccelerate it, thereby affecting protein structure and function (Yu et al., 2015; Zhao et al., 2017). A genomic analysis of Neurospora crassa, Escherichia coli, S. cerevisiae, Caenorhabditis elegans, and Drosophila melanogaster showed that protein regions predicted to be unstructured are commonly encoded by non-preferred codons, while predicted structured regions are encoded by preferred ones (Zhou et al., 2015). However, it has been described that alpha-helices are mainly encoded by preferred codons and beta-strands by non-preferred codons in E. coli (Thanaraj and Argos, 1996).
In this work, a comprehensive comparative CUB analysis was conducted on 89 yeast strains from different species isolated from diverse environments to evaluate its correlations with several parameters, including gene expression levels, growth temperatures, GC composition, response to cold stress, and some predicted protein properties.
Methods
Yeast culture conditions
Phaffia rhodozyma strains were cultivated in YM or minimal medium supplemented with 2% glucose or maltose and incubated at 10, 15, 22, or 26°C with 150 r.p.m. orbital shaking. Growth was monitored by the optical density of the culture at 600 nm, and growth rates were calculated from the exponential growth phase. The temperature at which the yeast strain had the highest growth rate was considered optimal. The four P. rhodozyma isolates showed higher growth rates between 10 and 15°C, and the optimal growth temperature was 15°C for isolates UCD 647-385, Av, and VOH, and 10°C for CBS 6938 (Supplementary Table 1). Data on optimal temperature for growth for other yeasts were obtained from previous works (Baeza et al., 2022) and databases such as American Type Culture Collection (ATCC), Westerdijk Institute, Institute for Systems Biology, National Collection of Yeast Cultures.
RNA-seq
P. rhodozyma isolates were grown until the stationary phase in 100 ml of different media at 22°C, as indicated in Supplementary Table 2. Cultures were centrifuged at 4,000 g for 5 min, and total RNA was purified using TRIzol (Invitrogen). The RNA samples having 260/280 and 260/230 >1.9 were stored in 50% ethanol with 0.3 M sodium acetate and sent to Macrogen Inc. for next-generation sequencing using the protocols and platforms indicated in Supplementary Table 2. RNA integrity (RIN) was determined at Macrogen Inc., and samples with RIN > 7 were processed. Eleven transcriptomes were determined for the P. rhodozyma isolates in this work, eight for strain UCD 67-385, and three for the Chilean isolates VOH and AVHN2 (Loto et al., 2012). The raw data statistics are indicated in Supplementary Table 2 and are available at NCBI, BioProject accession number PRJNA966916. The transcriptomes of the Antarctic yeast isolates were previously described (Baeza et al., 2022), and the Sequence Read Archive (SRA) of the transcriptomes of other yeast species (a total of 1,416 SRA files) were downloaded from the NCBI database. The abbreviations, growth temperature, and codes of the SRA files of yeast species used in this work are listed in Supplementary Table 3.
Bioinformatic analysis
Contigs of at least 210 nt were assembled from each SRA using Tadpole assembler 38.84 (plugin in Geneious prime v11), and the expression levels of the ORFs in each yeast were determined by mapping each SRA (RNAseq plugin in Geneious prime v11) and expressed in reads per kilobase per million mapped reads (RPKM; Mortazavi et al., 2008). The maximum RPKM value was considered for contigs in yeast with multiple transcriptome data, and only contigs with RPKM values ≥ 10 were included in the subsequent analysis. The open reading frames (ORF) ≥ 210 nt in each contig were predicted, translated in silico, and compared to KAAS—KEGG Automatic Annotation Server (Moriya et al., 2007), using the default parameters of GHOSTX (Suzuki et al., 2014) and gene datasets for eukaryotes, and only annotated ORFs were considered for further analysis. The secondary structures (alpha-helices, beta-sheets, turns, and coils) and subcellular localization (cytoplasmic, transmembrane, and extracellular) were predicted from translated ORFs using the EMBOSS garnier plugin in Geneious prime v11 (Rice et al., 2000; Viklund and Elofsson, 2004).
Relative synonymous codon usage calculation and comparative analysis
The calculation of RSCU was performed for each ORF in each yeast as the ratio between the frequency of a codon and the expected frequency if all synonymous codons were used equally. An RSCU = 1 indicates that the codon usage pattern has no preference, while an RSCU > 1 indicates that the codon has a preference. Codons with RSCU ≥ 1.5 are classified as high-frequency codons, and those found in the highest expressed ORFs (RPKM > 1,000) were referred to as “preferred codons” in this work. Normality of the data was tested using Llliefors, Kolmogorov_Smirnov, Anderson Darling, and DÁgostino-K squared, all of which rejected normality; therefore, comparative analyses were performed using the non-parametric Kruskal-Wallis test and Dunn's multiple comparisons. Comparative analyses were performed for each codon between ORFs grouped by parameter when appropriate. Five groups were classified by expression level (L1, 10 ≥ RPKM ≤ 100; L2, 100 < RPKM ≤ 300; L3, 300 < RPKM ≤ 500; L4, 50 < RPKM ≤ 1,000; and L5, 1,000 < RPKM), eight groups according to % GC (gc1, 10 ≥ %GC ≤ 20; gc2, 20 < %GC ≤ 40; gc3, 40 < %GC ≤ 60; gc4, 60 < %GC ≤ 80), and 22 groups according to predicted cellular pathways as indicated in Table 1.
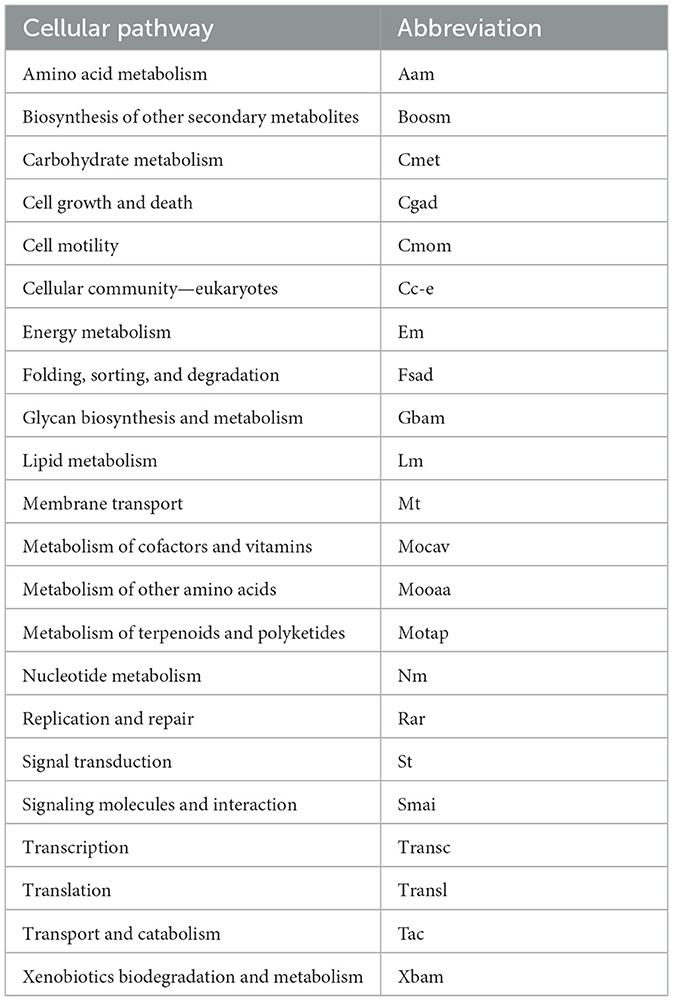
Table 1. List of abbreviations used in this work for cellular pathways.
Results
Codon bias in yeasts and correlation with growth temperature, expression levels, and %GC
RSCU was calculated for each ORF, and codon values were compared across yeasts. All codons showed a high percentage of significant difference in RSCU values between yeast pairs, ranging from 75% (CGG) to 93% (GAG and GTT; table in Figure 1). The number of significantly different codons between yeast pairs varied from eight codons in C. albicans vs. C. dubliniensis to 59 codons in 258 yeast pairs, such as Candida auris vs. Moesziomyces aphidis, Candida haemuloni vs. Rhodotorula toruloides, and Candida orthopsilosis vs. Tilletiopsis washingtonensis (heatmap in Figure 1). The median number of different codons was 54, with an interquartile range of 8 (boxplot in Figure 1).
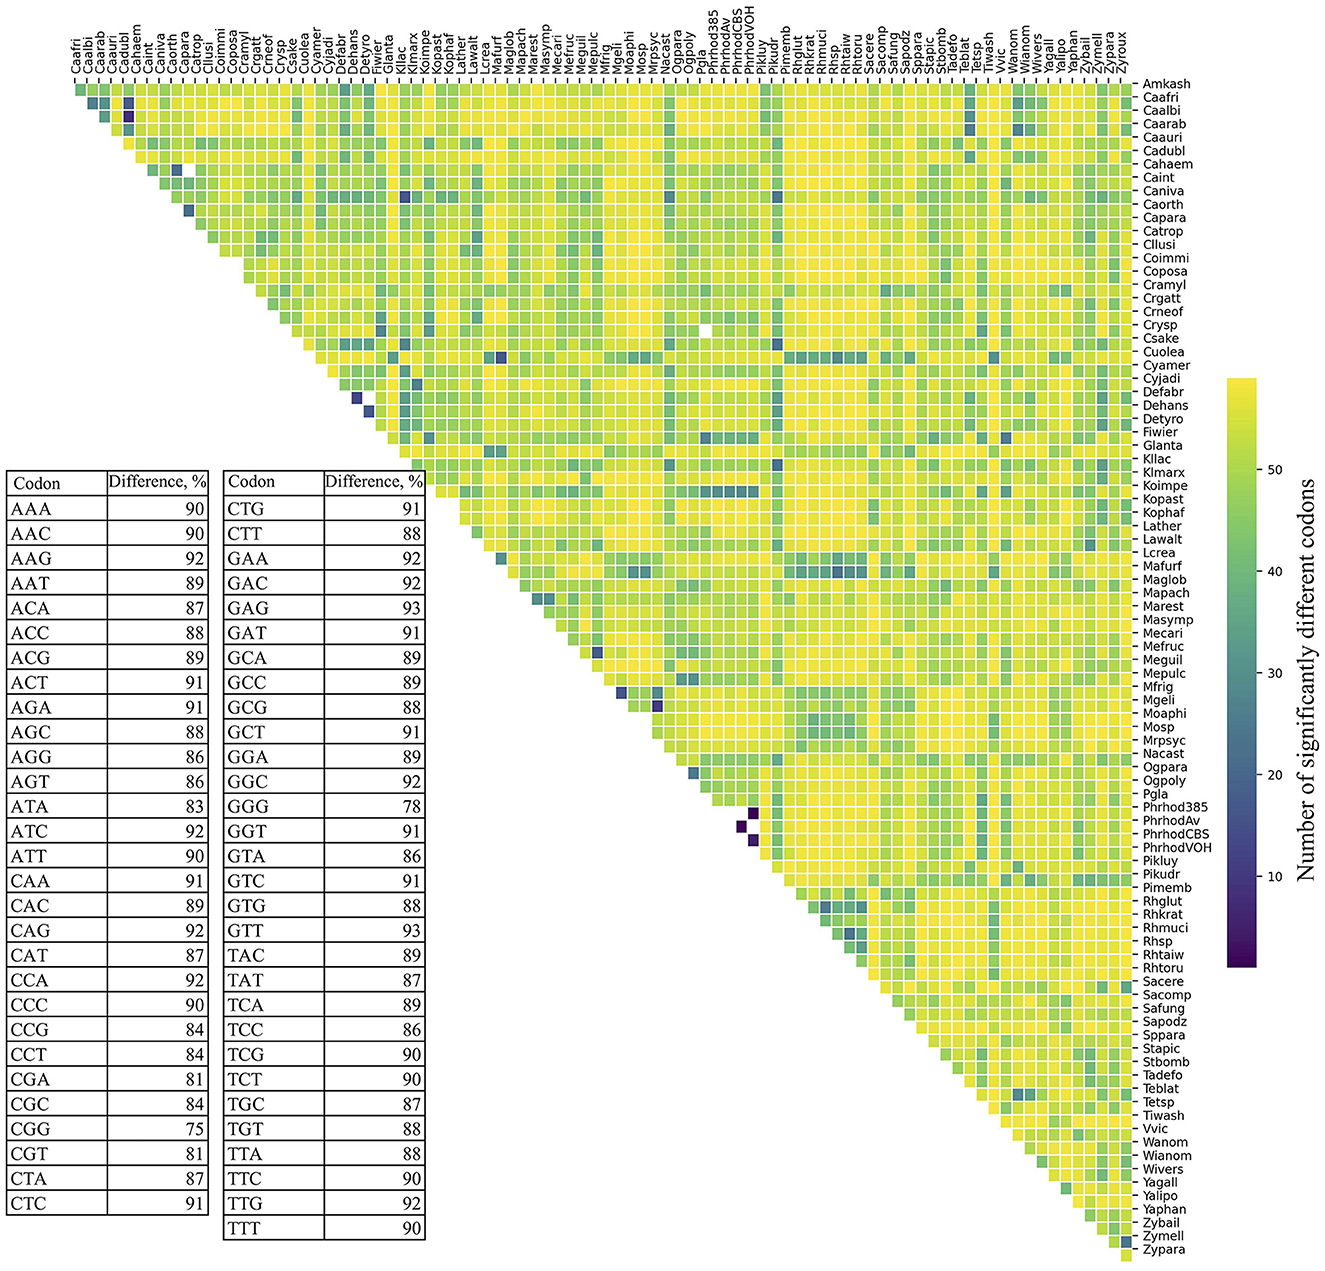
Figure 1. Variation in synonymous codon usage among yeasts. The RSCU values of each codon in all ORFs were compared between different pairs of yeasts. The table shows the percentage of significant differences (p ≤ 0.05) for each codon in all comparisons. The number of significantly different codons between yeast pairs is shown in the heatmap, and their distribution is in the box plot. The full names of the species are listed in the Supplementary Table 3.
The RSCU values for each codon were compared between ORFs grouped by expression level and by %GC within and between yeasts. As shown in Figure 2, significant differences in RSCU between groups increase on average as their difference in expression level increases, being maximum between groups of ORFs with RPKM values between 10 and 100 (L1) and those with RPKM higher than 1,000 (L5; Figure 2A). Regarding %GC, minor RSCU differences were found between the group with 1–20 %GC (gc1) and the others, probably due to the low number of yeasts (15) and ORFs (21–542) in this category. Among the other groups, the average difference was variable in all yeasts analyzed, with the highest differences between those with 41–60 %GC (gc3) and 61–80 %GC (gc4), and the lowest between those with 21–40 %GC (gc2) and 61–80 %GC (gc4; Figure 2D). When comparing RSCU values between yeasts, higher similarities were found between highly expressed groups, whether comparing the same or different groups (Figures 2B, C). Regarding the %GC, the 41–60 %GC group showed the highest difference across yeasts. When comparing different %GC groups, the observed differences were similar, ranging from 48–50 %GC, except for the 1–20 %GC group (Figures 2E, F). These results suggest that, between the two parameters analyzed, codon usage appears to be more significantly influenced by the expression level of genes than by their GC content.
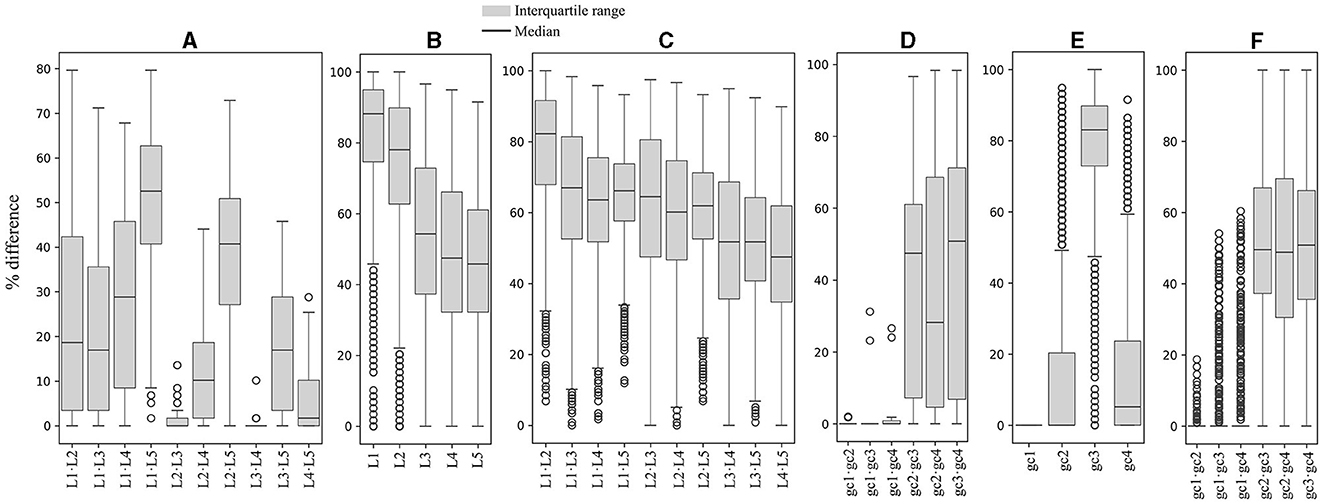
Figure 2. Variation in synonymous codon usage within and across yeasts considering the ORF expression level and %GC. The RSCU of each codon was compared between ORFs grouped by their expression level and %GC within and between yeasts. Median and distribution of significant differences (p ≤ 0.05) between expression level groups within (A) and between (B, C) yeasts. Median and distribution of significant differences (p ≤ 0.05) between %GC groups within (D) and between (E, F) yeasts. L1–L5 or gc1–gc4 correspond to the groups of ORFs classified by expression level or %GC from lowest to highest.
Since the analysis based on the expression level groups gave more consistent results, this parameter was selected for further correlation analyses, including the yeast optimal temperature of growth (OTG). In the analyses of correlations between RSCU and OTG, considering only correlation values ≥ |0.4|, inverse correlations were found for the codons GGA (Gly), AGG (Arg), TTC (Phe), TCC (Ser), CGA (Arg), and GTC (Val), and direct correlations for the codons ATT (Ile), TTT (Phe), and GTG (Val) when considering the whole data set (Figure 3A). The same tendency was observed in analyses of OTG values grouped by expression level group, comparing the same or different expression level groups, with additional inverse correlations for ATC (Ile) and ACC (Thr). Regarding correlations between RSCU and expression level, no correlations were observed when considering the entire data set. However, when different expression level groups were compared, direct correlations for GGG (Gly), ATA (Ile), AGT (Ser), CTA (Leu), GTA (Val), GCA (Ala), TAT (Tyr), ACA (Thr), and AAT (Asn) were observed in the highly expressed groups.
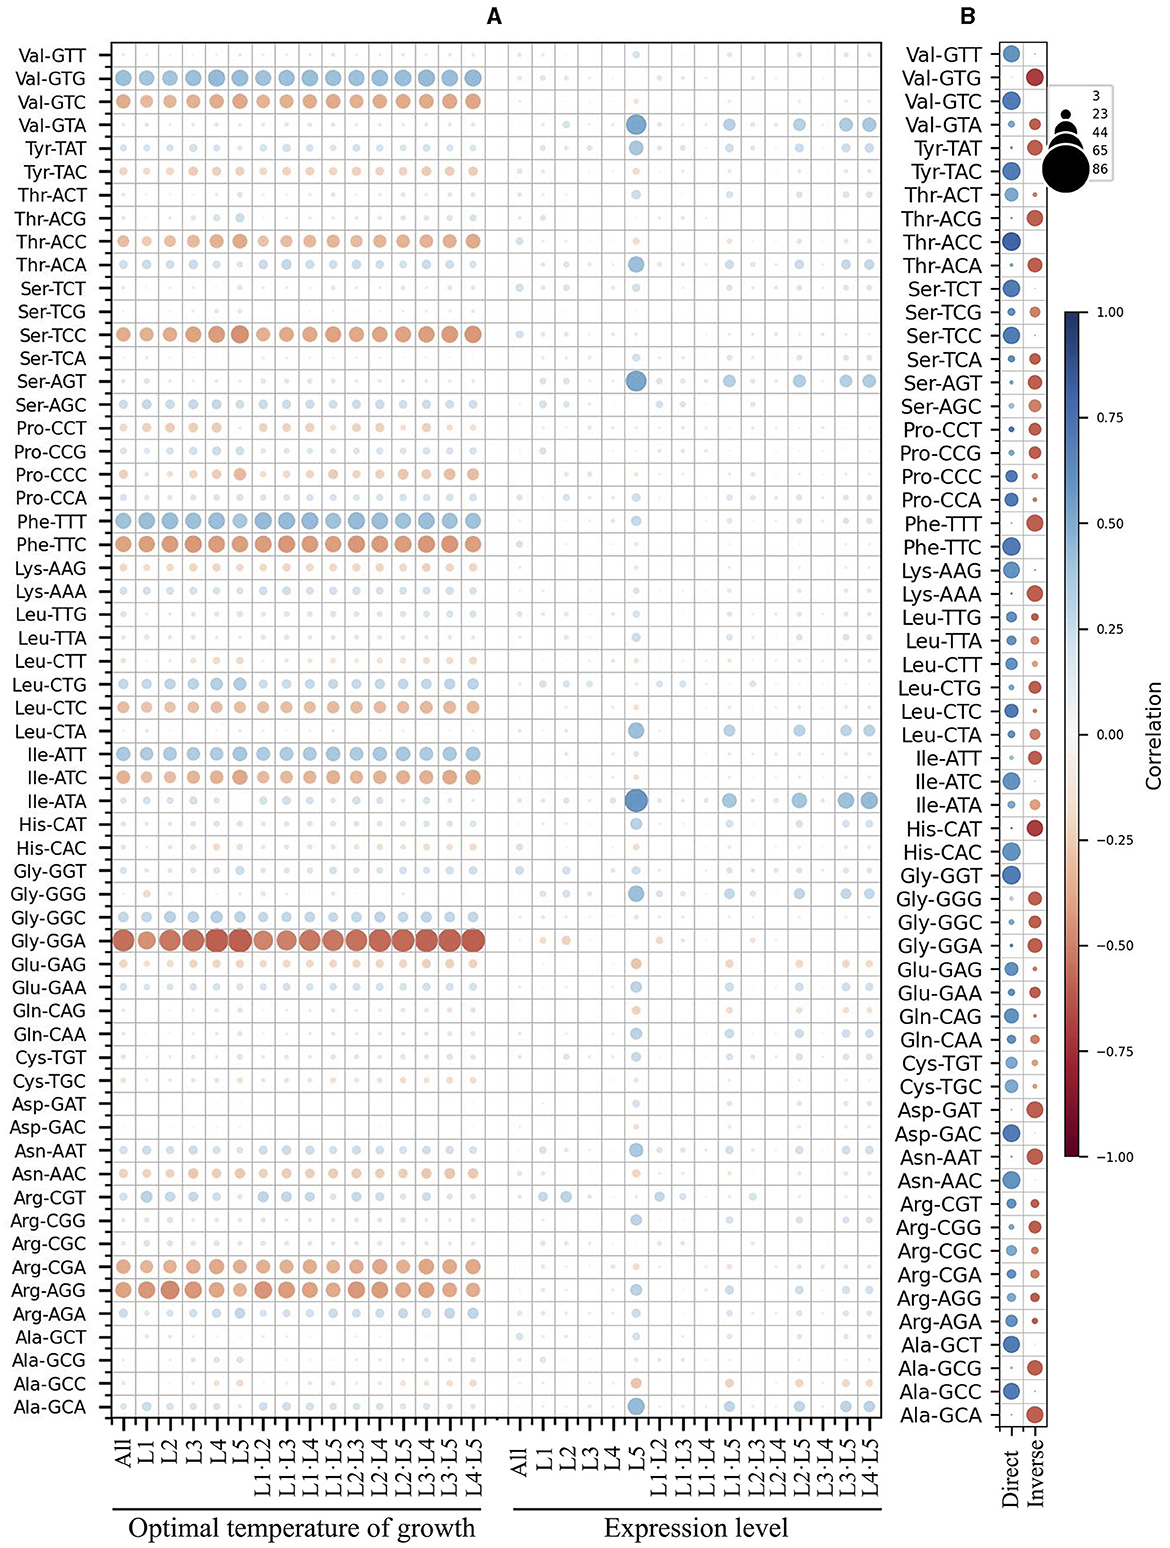
Figure 3. Correlation between synonymous codon usage and the yeast optimal temperature of growth or ORF expression level. A matrix was created containing all combinations of yeast strains and expression level groups for each codon. The differences in the corresponding values of RSCU, optimal temperature of growth, and expression level were calculated. These differences were used for principal component analysis (PCA) between different yeast strains (A) and within each yeast strain (B), as well as between the same or different expression level groups. In (A), the color and size of the circle represent the correlation values. In (B), the circle color corresponds to the correlation value, and its size represents the number of yeasts with the corresponding correlation. L1–L5 correspond to the ORF expression level groups from lowest to highest.
When comparing the expression level groups in each yeast, more codons having correlations to expression level were identified (Figure 3B). Considering only correlations ≥ |0.5| found in most yeasts (in at least 60 of them), direct correlations were detected for ACC (Thr), GGT (Gly), GTC (Val), TTC (Phe), CAC (His), TAC (Tyr), AAC (Asn), GAC (Asp), ATC (Ile), TCT (Ser), TCC (Ser), GCT (Ala), GTT (Val), GCC (Ala), AAG (Lys), CAG (Gln), CTC (Leu), CCA (Pro), GAG (Glu), ACT (Thr), and TGC (Cys). Inverse correlations were found for GTG (Val), TTT (Phe), GCA (Ala), GAT (Asp), CAT (His), ACG (Thr), AAT (Asn), AAA (Lys), GCG (Ala), TAT (Tyr), GGA (Gly), ACA (Thr), AGT (Ser), GGG (Gly), ATT (Ile), GGC (Gly), CGG (Arg), CCT (Pro), CTG (Leu), and AGC (Ser). These results suggest some correlation between codon usage and OTG in yeast, but it was less pronounced than expression level, both in terms of codon numbers and correlation values. Furthermore, the correlation between codon usage and expression level was more noticeable when comparisons were made between expression level groups within each yeast.
Similarity in codon usage among different yeasts
The yeasts were hierarchically clustered according to their codon usage calculated from ORFs from the highest expressed group (L5, RPKM >1,000, Supplementary Table 4), resulting in a dendrogram with nine main groups (Figure 4). There were five groups that contained at least 10 members from different yeast genera that showed a similar OTG (Figure 4, boxplot). One group, group 6, had only species of the genus Malassezia with an OTG of 28–30°C. Group 2 was the most numerous with 28 members, the majority with OTG between 24 and 25°C. Antarctic yeasts with OTG of 22°C (Candida sake and Wickerhamomyces anomalus) grouped with other 13 yeasts with OTG from 22 to 30°C (group 3), while the Antarctic yeasts with OTG of 15 and 19°C grouped with other 12 yeasts with OTG mainly from 20 to 27°C. Antarctic yeast isolates M. gelida and P. rhodozyma, with the lowest OTG values determined by our group, grouped with other cold-adapted Mrakia species, and with Yarrowia species, corresponding to the group with the lowest median for OTG (16°C) of all groups. It can be observed that mesophilic yeasts (OTG ≥ 20°C) generally group in ways that cannot be attributed only to their OTG. On the other hand, although seven yeasts with the lowest OTG were grouped with two mesophilic yeasts in group 8, they formed a separate subgroup, suggesting a more similar codon usage among psychrophilic yeasts.
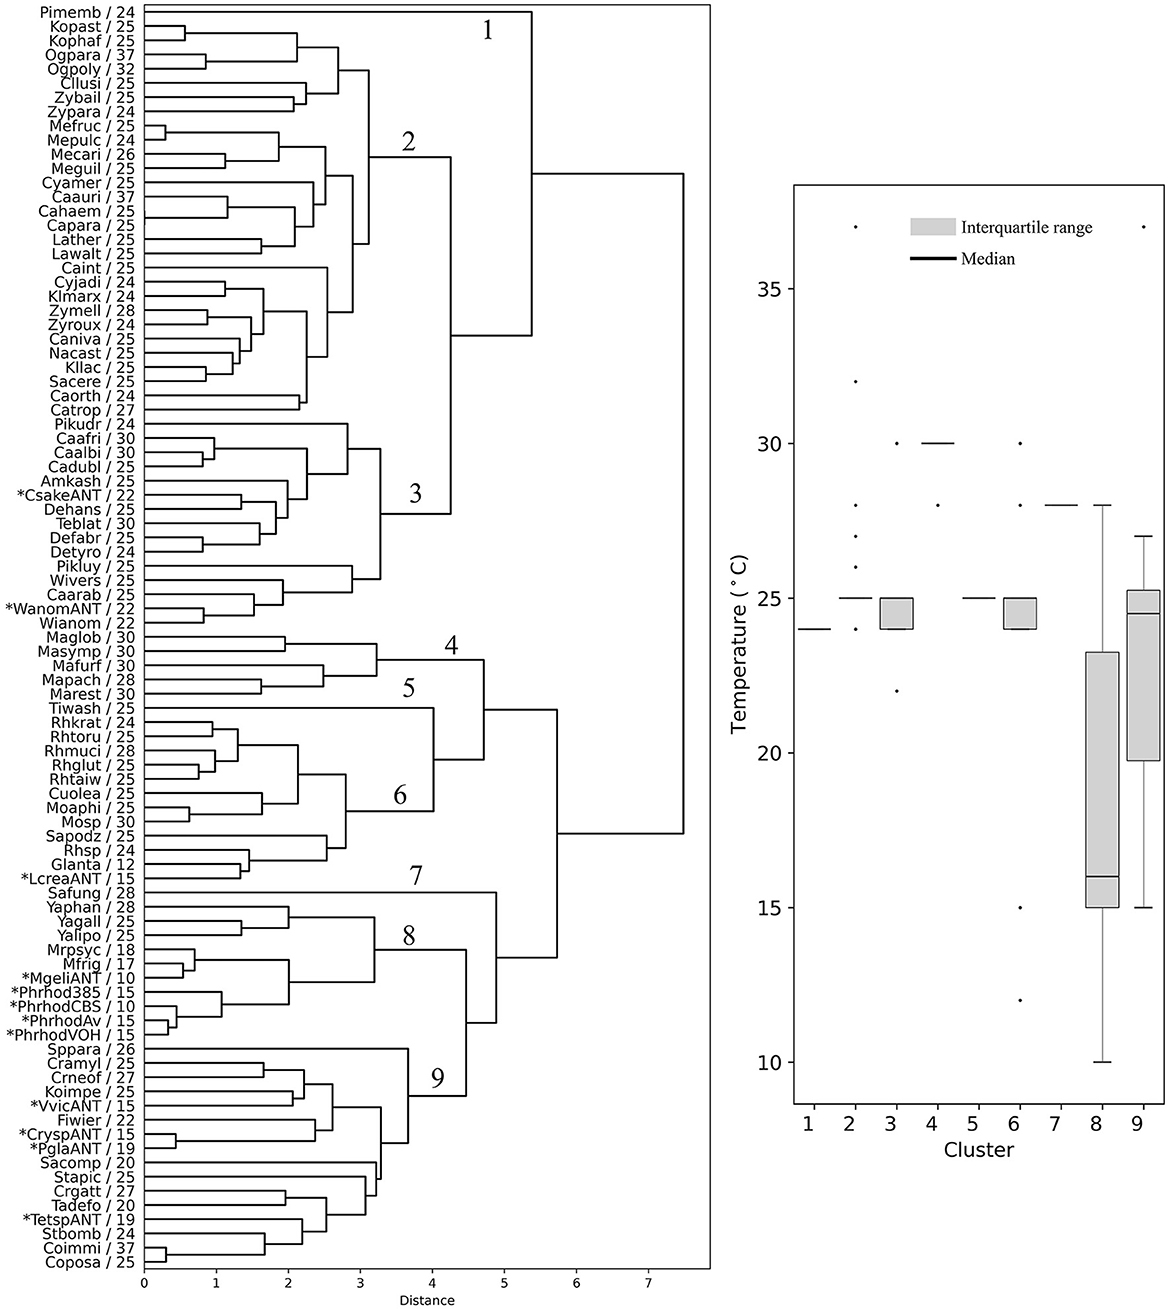
Figure 4. Hierarchical clustering of yeasts based on codon usage. Dendrograms were constructed considering the RSCU of codons calculated from the highest expression level group of ORFs. The yeast abbreviation and optimal temperature of growth are indicated in the dendrograms (the full names of the species are given in the Supplementary Table 3). Asterisks indicate yeasts isolated from Antarctica and P. rhodozyma isolates for which the optimal temperature of growth was determined in this work. The box plot shows the distribution of the yeasts' optimal temperature of growth in each hierarchical group (1–9).
Preferred codon content in cellular pathways and regulated ORFs
The codons with an RSCU ≥ 1.5 calculated from highly expressed ORFs (L5, RPKM >1,000, Supplementary Table 4) were considered “preferred” in this work. The content of preferred codons was calculated in each ORF, grouped according to the cellular pathways in which the encoded protein was predicted to be involved, and compared within each yeast. As shown in Supplementary Figure 1 and summarized in Figure 5A, the pathways with the highest percentage of preferred codons in most yeasts were “translation,” ranging from 32% in Kockovaella imperatae to 58% in Naumovozyma castellii (a median of 40%), and “energy metabolism,” ranging from 30% in Coccidioides posadasii to 56% in Tilletiopsis washingtonensis (a median of 41%). When each pathway was compared with the others, “translation” and “energy metabolism” were significantly different in the largest number of yeasts (Figure 5B). In addition, when estimating the difference in the percentage of preferred codons between each pathway vs. the others with significant differences, these two pathways showed the highest percentage of preferred codons (Figure 5C).
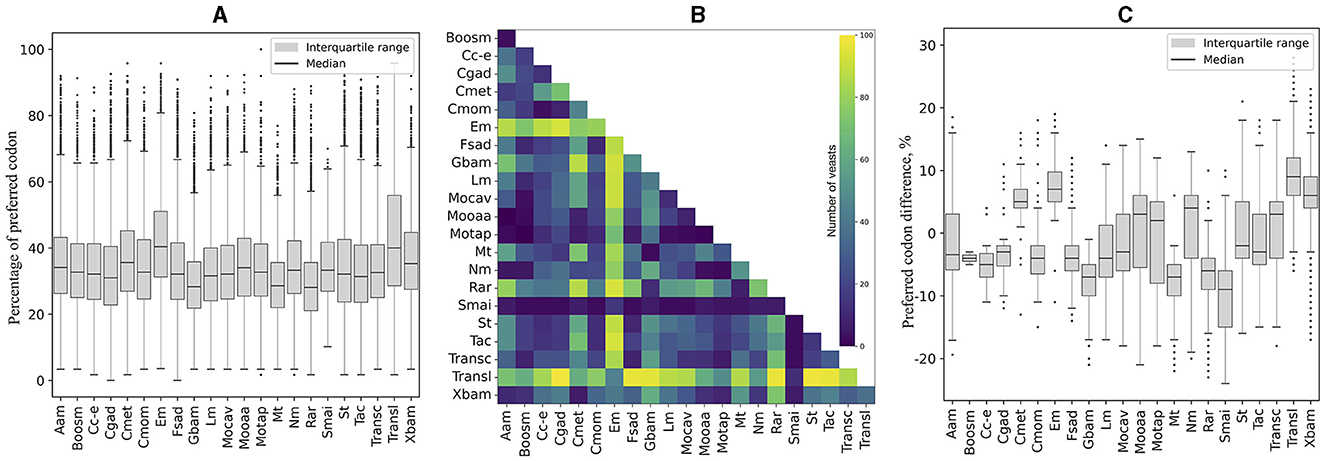
Figure 5. Comparison of preferred codon content in cellular pathways. The content of preferred codons was calculated in each ORF classified according to its predicted cellular pathway and compared across yeasts. (A) Distribution of the percentage of preferred codons considering all ORFs. (B) Number of yeasts with significant differences between the compared cellular pathways. (C) Distribution of significant differences in the content of preferred codons between a pathway and the others. The full names of the cellular pathways are listed Table 1.
The content of preferred codons was also analyzed in ORFs that were up- or down-regulated in Antarctic yeasts subjected to cold stress and in P. rhodozyma UCD 67-385 cultivated on different carbon sources (glucose or maltose). As shown in Figure 6A, the distribution of the percentage of preferred codons and the median in up- and down-regulated ORFs was similar in most of the yeasts analyzed, except for C. sake in which down-regulated ORFs showed a higher percentage of preferred codons than up-regulated ORFs. When comparing the preferred codon content between up- and down-regulated ORFs classified by cellular pathways, significant differences were detected only in a few pathways (from one to seven) in C. sake, P. glacialis, P. rhodozyma UCD 67-385, and W. anomalus, with a generally lower percentage of preferred codons in up-regulated ORFs than in down-regulated ones, except for “signal transduction” in P. glacialis (Figure 6B). Therefore, in general, there is no difference in the content of preferred codons between up- and down-regulated ORFs, at least under the conditions analyzed here.
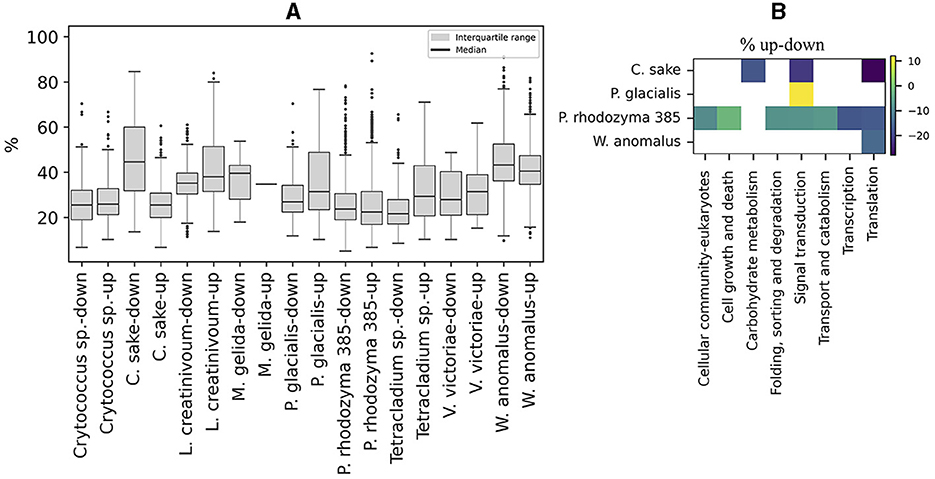
Figure 6. Codon preference content in regulated ORFs. (A) Percentage of preferred codons in upregulated (log2 ≥ 1) and downregulated (log2 ≤ −1) ORFs after cold stress in Antarctic yeasts and after growth in two different carbon sources (glucose or maltose), in P. rhodozyma 385 isolates. (B) Difference in the percentage of up- minus down-regulated (% up-down) ORFs in cellular pathways that are significantly different in each yeast.
Distribution of preferred codons in ORFs and structural properties of coded proteins
The ORFs were fragmented in silico into non-overlapping segments of 30 nt, and the percentage of preferred codons within each segment was calculated and compared in each yeast. Figure 7A shows the median differences in the percentage of preferred codons between a single segment and the contiguous 20 downstream segments for the first 5′ end 20 segments of the ORFs from all yeasts. An evident lower content of preferred codons was observed when comparing the first segments to the others, a tendency that gradually decreased for the downstream segments and was more pronounced in ORFs with higher expression levels. Figure 7B shows the median difference in the percentage of preferred codons between the first 5′ segment of the ORFs and the subsequent 20 segments in each yeast. In most yeasts, the first segments of the ORFs had a lower percentage of preferred codons, which was more noticeable in the groups of ORFs with higher expression levels. This pattern was particularly pronounced in the P. rhodozyma isolates, Moesziomyces sp., Moesziomyces aphidis, M. gelida, L. creatinivorum, Lachancea thermotolerans, and M. frigida. These results showed a general tendency for ORFs in the yeasts analyzed here to have a lower content of preferred codons at the 5′ end, more pronounced in highly expressed ORFs, which would imply a slower translation start, as discussed below.
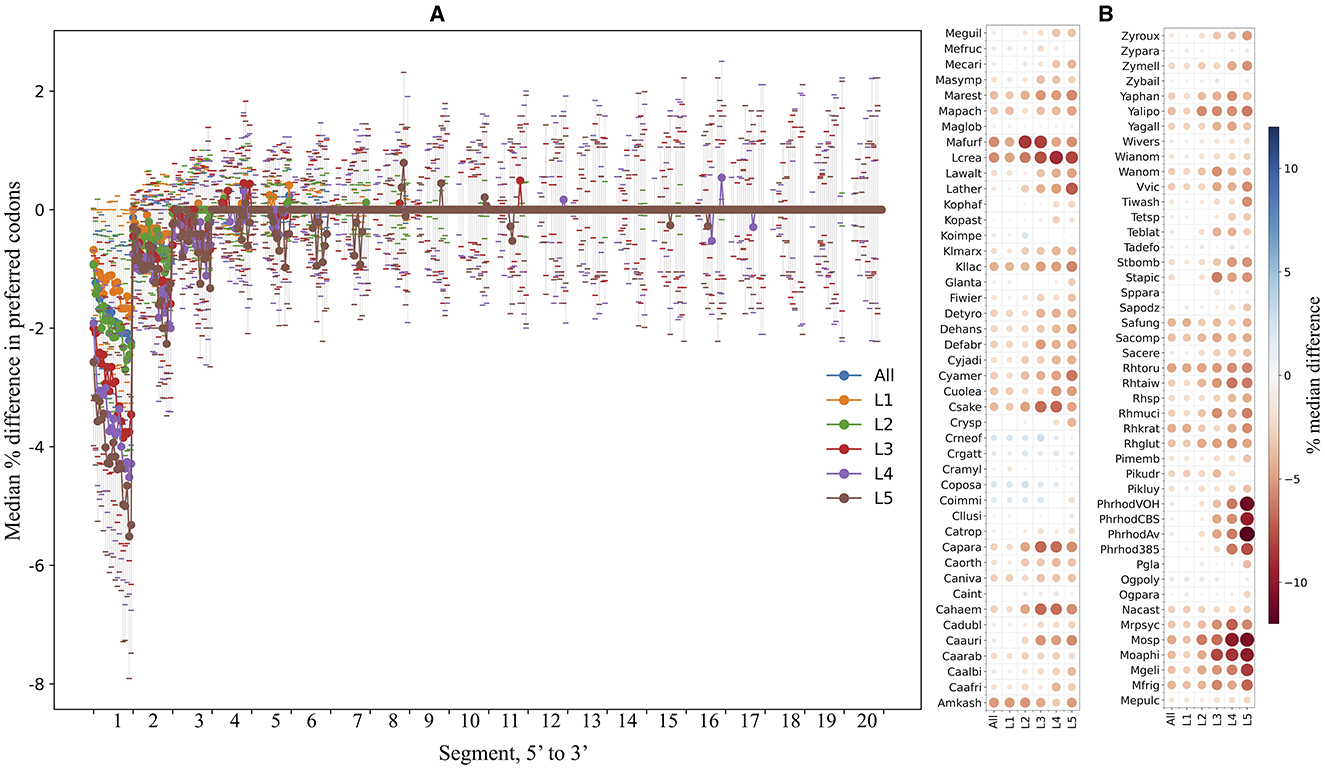
Figure 7. Preferred codon content analysis along ORFs. The yeast ORFs were fragmented in silico into non-overlapping segments of 30 nt, and the percentage of preferred codons in each segment was calculated. (A) The median differences in preferred codon content between a segment and the contiguous downstream segments for the first 20 5′-end segments of the ORFs. (B) The median differences (color of circles; sizes of circles represent absolute values of median) in preferred codon content between the first 5′-end segment and the 20 downstream segments in each yeast. Analyses were performed using the entire data set (“All”) or subsets of ORFs classified by expression level (“L1–L5”). L1–L5 correspond to the ORF expression level group from lowest to highest. See Supplementary Table 3 for the full names of yeasts.
The secondary structures (beta-strands, alpha-helices, turns, and coils) and subcellular localizations (cytoplasmic, extracellular, and transmembrane) in the translated ORFs were predicted, and the percentage of preferred codons in the corresponding coding segments was calculated and compared in each yeast. The percentage of preferred codons in all secondary structures increased as the expression level of the ORF group increased. In all expression level groups, the beta strand showed a higher percentage of preferred codons than the other secondary structures (Figure 8A), and no clear trend was observed between the alpha helix with respect to coil and turn. The percentage of preferred codons in subcellular localizations was lower in extracellular and transmembrane than in cytoplasmic, a tendency that was more pronounced in ORFs with higher expression levels (Figure 8A). When comparing the categories in each yeast, the beta strand does indeed show a higher percentage of preferred codons than the other secondary structures at all expression levels; however, the number of yeasts that showed significant differences in these comparisons tended to decrease as the expression level of the group increased (Figure 8B). In the case of subcellular localizations, the cytoplasmic showed a higher content of preferred codons than the other two, especially in the groups of ORFs with higher expression levels (L4 and L5). However, only a small fraction of the analyzed yeasts (between 7 and 22%) were the ones that showed significant differences in these comparisons (Figure 8B). Thus, the higher content of the preferred codon in predicted beta strands and cytoplasmic proteins was the more consistent trend.
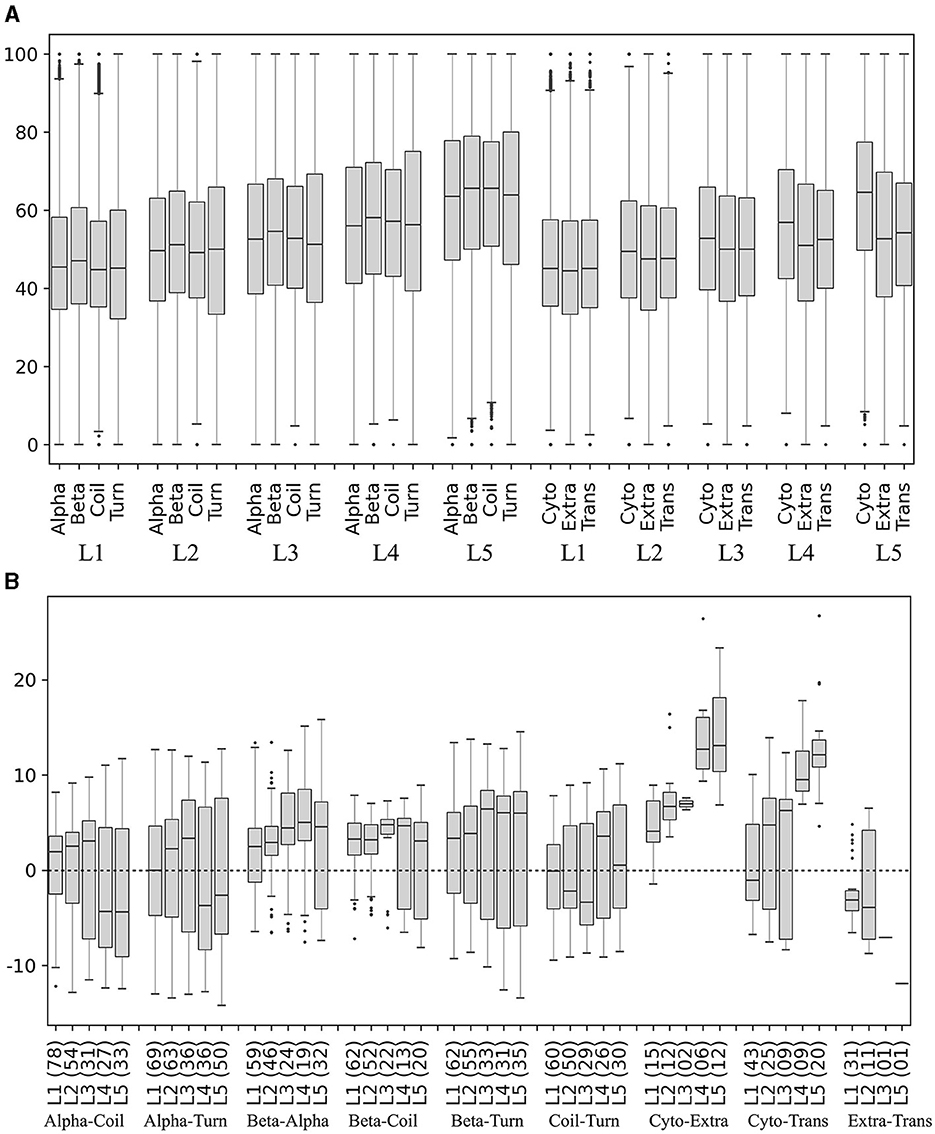
Figure 8. Preferred codon content in ORF segments encoding secondary structures and subcellular localizations. The secondary structures and subcellular localizations were predicted in the translated ORFs, and the percentage of preferred codons in the corresponding ORF segments was calculated in each yeast. (A) Distribution of preferred codon percentage in each category in each ORF expression level group, considering data from all yeasts. (B) Difference of preferred codon percentages between categories in each ORF expression level group in each yeast. Only the distribution of the percentage differences between significantly different categories (p ≤ 0.05) is shown in the box plot, and the number of yeasts in which significant differences were found is given in parentheses. Alpha, alpha helix; Beta, beta strand; Cyto, cytoplasmic; Trans, transmembrane; Extra, extracellular. L1–L5 correspond to the ORF expression level group from lowest to highest.
Discussion
In this work, the use of synonymous codons in different yeasts was analyzed in relation to various factors including their temperature of growth, gene expression levels, protein structure and subcellular localization, and cellular pathways where proteins would be involved. Our results showed that highly expressed ORFs tend to have a more similar RSCU in both, within a yeast and among different yeasts. These findings are consistent with the significant bias observed in highly expressed genes, for which it has been suggested that selective pressures would favor certain codons to optimize the efficiency and speed of protein translation (dos Reis et al., 2003; Goetz and Fuglsang, 2005; Klumpp et al., 2012; Novoa and Ribas de Pouplana, 2012; Frumkin et al., 2018; Liu, 2020; Iriarte et al., 2021). When analyzing the relationship between RSCU and yeast OTG, correlations (ranging from |0.4| to |0.6|) were found for 11 codons, eight inverse and three direct. Five of 16 codons ending in C showed an inverse correlation, two of 14 codons ending in A showed an inverse correlation, two of 16 codons ending in T showed a direct correlation, and of the 13 codons ending in G, one had an inverse correlation, and one had a direct correlation. These findings are not consistent with the A/T preference at the third codon position reported in prokaryotes growing at low temperatures (Liu et al., 2020; Duan and Guo, 2021). However, other work suggested that CUB could not be attributed to a selective pressure related to the microorganism temperature for growth as an unusual clustering based on CUB of an archaeal psychrophile with thermophiles and hyperthermophiles was obtained (Lobry and Necşulea, 2006). Regarding ORF expression levels, it has been reported that highly expressed genes with low translation rates are severely depleted in fast growing cells (Hausser et al., 2019), which aligns with the hypothesis that highly expressed genes would require a rapid translation elongation to minimize ribosome sequestration and alleviate ribosome shortage (Yang et al., 2014). In the yeasts studied in this work, stronger correlations (between |0.5| and |0.8|) were observed between CUB and ORF expression levels. These correlations were generally direct for C, especially for codons varying only between C and T, and both inverse and direct for G, being direct when the only possibility of variation was between G and A. These findings do not align with results described in S. cerevisiae, where genes with AT-rich codons had a faster translation than GC-rich ones (Gardin et al., 2014).
CUB has also been related to cellular fitness, the lifestyle of microorganisms, and their need to adapt efficiently to different environments (Botzman and Margalit, 2011; Roller et al., 2013; Hart et al., 2018; Arella et al., 2021). The yeasts selected for this study were those for which transcriptomic and growth temperature data were available, either in databases or determined by us, resulting in a collection of yeasts isolated from different locations and substrates. For Antarctic yeasts and P. rhodozyma isolates, the clustering of yeasts based on their CUB was generally consistent with OTG, as those with higher OTG (22°C) grouped with yeasts with OTG around 25°C, and those with lower OTG (19°C or below) clustered with other cold-adapted yeasts with OTG below 25°C. However, this consistency was not observed in the clusters of most of the other yeasts analyzed. In the case of Antarctic yeasts and P. rhodozyma isolates, their OTG is consistent with their growth rates (Baeza et al., 2021; Supplementary Table 1); however, the growth rate is unknown for most of the yeasts included in this work and could be one of the factors influencing clustering, as yeasts with similar OTG may not have similar growth rates.
The number of preferred codons (with RSCU ≥ 1.5 in highly expressed ORFs) varied among yeasts from 12 to 25 (19 on average), and codons such as ACC (Thr), TAC (Tyr), ATC (Ile), AAG (Lys), TCC (Ser), and AAC (Asn) were preferred by most yeasts. Among the predicted cellular pathways, “translation” and “energy metabolism” were the ones whose associated ORFs had the highest content of preferred codons in most yeasts. This is an interesting result as it has been suggested that codon usage bias in bacteria is likely to initially evolve in genes related to the translation machinery rather than in other cellular functions, thereby improving the efficiency of translation machinery, which in turn significantly boosts the translation efficiency of other genes (González-Serrano et al., 2022).
In transcriptomic studies of organisms such as S. cerevisiae, Schizosaccharomyces pombe, and C. elegans subjected to various stress conditions, an overrepresentation of codons read by rare tRNAs was observed (Gingold et al., 2012). In the analysis of Antarctic yeasts subjected to cold stress and of P. rhodozyma UCD 67-385 cultured on different carbon sources in this work, the percentage of preferred codons was similar in up and down regulated ORFs. Although significant differences were found in the content of preferred codons between up and down regulated ORFs classified by metabolic pathways, generally lower in up regulated ORFs, differences were found only in four yeasts in a few pathways in each. These variable results are expected, as the stress response in yeasts involves complex and extensive mechanisms, including a global reduction of the cellular metabolism, activation of specific stress response genes, and translational adaptation requiring a coordinated balance between the tRNA epitranscriptome and codon bias (Chan et al., 2018).
CUB has been implicated in the regulation of gene expression and protein structure by influencing the translation efficiency and accuracy, cotranslational protein folding, and mRNA stability (Higgs and Ran, 2008; Shah and Gilchrist, 2010; Angov, 2011; Trotta, 2013; Liu, 2020). The presence of “rare” codons at the 5′ end of mRNAs has been proposed to create a “slow ramp” effect that reduces ribosome collisions along the coding sequence, thereby preventing the detrimental activation of ribosome quality control mechanisms dependent on colliding ribosomes (Tuller et al., 2010; Verma et al., 2019). A general trend toward a lower content of preferred codons at the 5′ end of ORFs was observed in the yeasts analyzed in this study, which was more pronounced in highly expressed than in low expressed ORFs, supporting the “slow ramp” hypothesis and this effect would be more relevant in genes under faster translation. Other aspects that could be related to the content and distribution of preferred codons along mRNAs include segments encoding structural or functional regions of proteins or their subcellular localization. It has been reported in N. crassa, E. coli, S. cerevisiae, C. elegans, and Drosophila melanogaster that protein regions predicted to be structured are mainly encoded by optimal codons, whereas unstructured regions are encoded by non-optimal ones (Zhou et al., 2015). However, in another study in E. coli it was found that alpha helices are encoded mainly by optimal codons, while beta strands and coils by non-optimal codons (Thanaraj and Argos, 1996). In addition, it has been reported in E. coli and some yeasts that ORFs encoding membrane-associated proteins involved in targeting, insertion, or interaction with other proteins, as well as ORF regions encoding secondary structures of polypeptides, tend to be rich in rare codon clusters (Zhang et al., 2009; Chartier et al., 2012; Pechmann and Frydman, 2013; Fluman et al., 2014). In most of the yeasts analyzed in this work, the ORF segments encoding beta strands had a higher percentage of preferred codons than those encoding alpha helices, coil, or turn, and those encoding transmembrane protein segments or extracellular proteins had a lower percentage than cytoplasmic. Several lines of evidence support the existence of a balance between optimal and non-optimal codons in mRNAs, including the presence of codon clusters that would contribute to the regulation of global and local rates of protein synthesis. It has been hypothesized that this balance would help to generate translation pauses to ensure proper protein folding, availability of free ribosomes for highly expressed ORFs under rapid growth conditions, regulation of translation initiation, and proper protein targeting (Chaney and Clark, 2015; González-Serrano et al., 2022; Parvathy et al., 2022). For example, the cross-pathway control protein 1 (CPC-1) gene from N. crassa, has a non-optimal RSCU profile rich in NNU codons, which was suggested to be important for maintaining a proper protein structure and function (Lyu and Liu, 2020). Supporting this idea, studies using cell-free translation systems from Neurospora and Drosophila showed that while optimal synonymous codons can enhance the translation elongation rate, non-optimal codons can decelerate it, with consequential impacts on the structure and function of proteins (Yu et al., 2015; Zhao et al., 2017).
Finally, assuming that highly expressed ORFs tend to be translated faster, the findings from this work strongly suggest a relationship between CUB and the rate of protein synthesis, which in turn is related to cellular growth rate and gene expression levels in yeasts. Regulation of protein synthesis rates contributes to proper protein folding and subcellular targeting, where the abundance and distribution of preferred and non-preferred codons along mRNAs would play an important role, especially under conditions requiring rapid protein synthesis in yeast.
Data availability statement
The datasets generated and analyzed during the current study are available at: https://doi.org/10.34691/UCHILE/9OAUT6. The raw data statistics are available in the NCBI repository, BioProject accession number PRJNA966916.
Author contributions
MB: Conceptualization, Formal analysis, Funding acquisition, Investigation, Methodology, Project administration, Writing – original draft, Writing – review & editing. DS: Investigation, Methodology, Validation, Writing – review & editing. VC: Formal analysis, Writing – review & editing, Conceptualization. JA: Conceptualization, Formal analysis, Writing – original draft, Writing – review & editing.
Funding
The author(s) declare that financial support was received for the research, authorship, and/or publication of this article. The present work was financed by grants ENL03/22 from Vicerrectoria de Investigacion y Desarrollo, Universidad de Chile, and Fondecyt 1230427 from Agencia Nacional de Investigacion y Desarrollo.
Conflict of interest
The authors declare that the research was conducted in the absence of any commercial or financial relationships that could be construed as a potential conflict of interest.
Publisher's note
All claims expressed in this article are solely those of the authors and do not necessarily represent those of their affiliated organizations, or those of the publisher, the editors and the reviewers. Any product that may be evaluated in this article, or claim that may be made by its manufacturer, is not guaranteed or endorsed by the publisher.
Supplementary material
The Supplementary Material for this article can be found online at: https://www.frontiersin.org/articles/10.3389/fmicb.2024.1414422/full#supplementary-material
Supplementary Figure 1. Distribution of preferred codons percentages in ORFs classified by cellular pathways in all yeasts. The full names of the yeast species are given in the Supplementary Table 3.
Supplementary Table 1. Growth rates (h-1) of P. rhodozyma isolates.
Supplementary Table 2. Yeast culture conditions, and method for RNAseq and raw data statistics.
Supplementary Table 3. Yeast name abbreviations, optimal temperature for growth (OTG), and SRA files of yeasts studied in this work.
Supplementary Table 4. Relative synonymous codon usage (RSCU) in the yeasts studied in this work.
Abbreviations
CUB, codon usage bias; OTG, optimal temperature of growth; RSCU, Relative synonymous codon usage.
References
Angov, E. (2011). Codon usage: nature's roadmap to expression and folding of proteins. Biotechnol. J. 6, 650–659. doi: 10.1002/biot.201000332
Arella, D., Dilucca, M., and Giansanti, A. (2021). Codon usage bias and environmental adaptation in microbial organisms. Mol. Genet. Genom. 296, 751–762. doi: 10.1007/s00438-021-01771-4
Baeza, M., Zúñiga, S., Peragallo, V., Barahona, S., Alcaino, J., and Cifuentes, V. (2021). Identification of stress-related genes and a comparative analysis of the amino acid compositions of translated coding sequences based on draft genome sequences of antarctic yeasts. Front. Microbiol. 12, 1–17. doi: 10.3389/fmicb.2021.623171
Baeza, M., Zúñiga, S., Peragallo, V., Gutierrez, F., Barahona, S., Alcaino, J., et al. (2022). Response to cold: a comparative transcriptomic analysis in eight cold-adapted yeasts. Front. Microbiol. 13, 1–15. doi: 10.3389/fmicb.2022.828536
Botzman, M., and Margalit, H. (2011). Variation in global codon usage bias among prokaryotic organisms is associated with their lifestyles. Genome Biol. 12:R109. doi: 10.1186/gb-2011-12-10-r109
Bulmer, M. (1991). The selection-mutation-drift theory of synonymous codon usage. Genetics 129, 897–907. doi: 10.1093/genetics/129.3.897
Chan, C., Pham, P., Dedon, P. C., and Begley, T. J. (2018). Lifestyle modifications: coordinating the tRNA epitranscriptome with codon bias to adapt translation during stress responses. Genome Biol. 19:228. doi: 10.1186/s13059-018-1611-1
Chaney, J. L., and Clark, P. L. (2015). Roles for synonymous codon usage in protein biogenesis. Annu. Rev. Biophys. 44, 143–166. doi: 10.1146/annurev-biophys-060414-034333
Chartier, M., Gaudreault, F., and Najmanovich, R. (2012). Large-scale analysis of conserved rare codon clusters suggests an involvement in co-translational molecular recognition events. Bioinformatics 28, 1438–1445. doi: 10.1093/bioinformatics/bts149
Chen, S. L., Lee, W., Hottes, A. K., Shapiro, L., and McAdams, H. H. (2004). Codon usage between genomes is constrained by genome-wide mutational processes. Proc. Natl. Acad. Sci. U. S. A. 101, 3480–3485. doi: 10.1073/pnas.0307827100
D'Onofrio, G., Ghosh, T. C., and Bernardi, G. (2002). The base composition of the genes is correlated with the secondary structures of the encoded proteins. Gene 300, 179–187. doi: 10.1016/S0378-1119(02)01045-4
dos Reis, M., Wernisch, L., and Savva, R. (2003). Unexpected correlations between gene expression and codon usage bias from microarray data for the whole Escherichia coli K-12 genome. Nucl. Acids Res. 31, 6976–6985. doi: 10.1093/nar/gkg897
Duan, J., and Guo, W. (2021). The cold adaption profiles of Pseudoalteromonas shioyasakiensis D1497 from Yap trench to cope with cold. Biotechnol. Rep. 32:e00689. doi: 10.1016/j.btre.2021.e00689
Fluman, N., Navon, S., Bibi, E., and Pilpel, Y. (2014). mRNA-programmed translation pauses in the targeting of E. coli membrane proteins. Elife 3:3440. doi: 10.7554/eLife.03440
Frumkin, I., Lajoie, M. J., Gregg, C. J., Hornung, G., Church, G. M., and Pilpel, Y. (2018). Codon usage of highly expressed genes affects proteome-wide translation efficiency. Proc. Natl. Acad. Sci. U. S. A. 115, E4940–E4949. doi: 10.1073/pnas.1719375115
Gardin, J., Yeasmin, R., Yurovsky, A., Cai, Y., Skiena, S., and Futcher, B. (2014). Measurement of average decoding rates of the 61 sense codons in vivo. eLife 3:3735. doi: 10.7554/eLife.03735
Gingold, H., Dahan, O., and Pilpel, Y. (2012). Dynamic changes in translational efficiency are deduced from codon usage of the transcriptome. Nucl. Acids Res. 40, 10053–10063. doi: 10.1093/nar/gks772
Goetz, R. M., and Fuglsang, A. (2005). Correlation of codon bias measures with mRNA levels: analysis of transcriptome data from Escherichia coli. Biochem. Biophys. Res. Commun. 327, 4–7. doi: 10.1016/j.bbrc.2004.11.134
González-Serrano, F., Abreu-Goodger, C., and Delaye, L. (2022). Translation comes first: ancient and convergent selection of codon usage bias across prokaryotic genomes. J. Mol. Evol. 22:10074. doi: 10.1007/s00239-022-10074-0
Hart, A., Cortés, M. P., Latorre, M., and Martinez, S. (2018). Codon usage bias reveals genomic adaptations to environmental conditions in an acidophilic consortium. PLoS ONE 13:e0195869. doi: 10.1371/journal.pone.0195869
Hausser, J., Mayo, A., Keren, L., and Alon, U. (2019). Central dogma rates and the trade-off between precision and economy in gene expression. Nat. Commun. 10:68. doi: 10.1038/s41467-018-07391-8
Hershberg, R., and Petrov, D. A. (2008). Selection on codon bias. Annu. Rev. Genet. 42, 287–299. doi: 10.1146/annurev.genet.42.110807.091442
Higgs, P. G., and Ran, W. (2008). Coevolution of codon usage and tRNA genes leads to alternative stable states of biased codon usage. Mol. Biol. Evol. 25, 2279–2291. doi: 10.1093/molbev/msn173
Hooper, S. D., and Berg, O. G. (2000). Gradients in nucleotide and codon usage along Escherichia coli genes. Nucl. Acids Res. 28, 3517–3523. doi: 10.1093/nar/28.18.3517
Ikemura, T. (1985). Codon usage and tRNA content in unicellular and multicellular organisms. Mol. Bio. Evol. 2, 13–34.
Iriarte, A., Lamolle, G., and Musto, H. (2021). Codon usage bias: an endless tale. J. Mol. Evol. 89, 589–593. doi: 10.1007/s00239-021-10027-z
Khan, M. F., and Patra, S. (2018). Deciphering the rationale behind specific codon usage pattern in extremophiles. Sci. Rep. 8:15548. doi: 10.1038/s41598-018-33476-x
Klumpp, S., Dong, J., and Hwa, T. (2012). On ribosome load, codon bias and protein abundance. PLoS ONE 7:e48542. doi: 10.1371/journal.pone.0048542
Liu, Q., Song, W. Z., Zhou, Y. G., Dong, X. Z., and Xin, Y. H. (2020). Phenotypic divergence of thermotolerance: molecular basis and cold adaptive evolution related to intrinsic DNA flexibility of glacier-inhabiting Cryobacterium strains. Environ. Microbiol. 22, 1409–1420. doi: 10.1111/1462-2920.14957
Liu, Y. (2020). A code within the genetic code: codon usage regulates co-translational protein folding. Cell Commun. Signal. 18:6. doi: 10.1186/s12964-020-00642-6
Lobry, J. R., and Necşulea, A. (2006). Synonymous codon usage and its potential link with optimal growth temperature in prokaryotes. Gene 385, 128–136. doi: 10.1016/j.gene.2006.05.033
Loto, I., Gutiérrez, M. S., Barahona, S., Sepúlveda, D., Martínez-Moya, P., Baeza, M., et al. (2012). Enhancement of carotenoid production by disrupting the C22-sterol desaturase gene (CYP61) in Xanthophyllomyces dendrorhous. BMC Microbiol. 12:235. doi: 10.1186/1471-2180-12-235
Lyu, X., and Liu, Y. (2020). Nonoptimal codon usage is critical for protein structure and function of the master general amino acid control regulator CPC-1. mBio 11, e02605–e02620. doi: 10.1128/mBio.02605-20
Moriya, Y., Itoh, M., Okuda, S., Yoshizawa, A. C., and Kanehisa, M. (2007). KAAS: an automatic genome annotation and pathway reconstruction server. Nucl. Acids Res. 35, W182–W185. doi: 10.1093/nar/gkm321
Mortazavi, A., Williams, B. A., McCue, K., Schaeffer, L., and Wold, B. (2008). Mapping and quantifying mammalian transcriptomes by RNA-Seq. Nat. Methods 5, 621–628. doi: 10.1038/nmeth.1226
Novoa, E. M., and Ribas de Pouplana, L. (2012). Speeding with control: codon usage, tRNAs, and ribosomes. Trends Genet. 28, 574–581. doi: 10.1016/j.tig.2012.07.006
Parvathy, S. T., Udayasuriyan, V., and Bhadana, V. (2022). Codon usage bias. Mol. Biol. Rep. 49, 539–565. doi: 10.1007/s11033-021-06749-4
Pechmann, S., and Frydman, J. (2013). Evolutionary conservation of codon optimality reveals hidden signatures of cotranslational folding. Nat. Struct. Mol. Biol. 20, 237–243. doi: 10.1038/nsmb.2466
Plotkin, J. B., and Kudla, G. (2011). Synonymous but not the same: the causes and consequences of codon bias. Nat. Rev. Genet. 12, 32–42. doi: 10.1038/nrg2899
Presnyak, V., Alhusaini, N., Chen, Y. H., Martin, S., Morris, N., Kline, N., et al. (2015). Codon optimality is a major determinant of mRNA stability. Cell 160, 1111–1124. doi: 10.1016/j.cell.2015.02.029
Rice, P., Longden, I., and Bleasby, A. (2000). EMBOSS: the European molecular biology open software suite. Trends Genet. 16, 276–277. doi: 10.1016/S0168-9525(00)02024-2
Roller, M., Luci,ć, V., Nagy, I., Perica, T., and Vlahovicek, K. (2013). Environmental shaping of codon usage and functional adaptation across microbial communities. Nucl. Acids Res. 41, 8842–8852. doi: 10.1093/nar/gkt673
Shah, P., and Gilchrist, M. A. (2010). Effect of correlated tRNA abundances on translation errors and evolution of codon usage bias. PLoS Genet. 6:e1001128. doi: 10.1371/journal.pgen.1001128
Su, Y., Jiang, X., Wu, W., Wang, M., Hamid, M. I., Xiang, M., et al. (2016). Genomic, transcriptomic and proteomic analysis provide insights into the cold adaptation mechanism of the obligate psychrophilic fungus Mrakia psychrophila. G3 6, 3603–3613. doi: 10.1534/g3.116.033308
Suzuki, S., Kakuta, M., Ishida, T., and Akiyama, Y. (2014). GHOSTX: an improved sequence homology search algorithm using a query suffix array and a database suffix array. PLoS ONE 9:e103833. doi: 10.1371/journal.pone.0103833
Thanaraj, T. A., and Argos, P. (1996). Protein secondary structural types are differentially coded on messenger RNA. Protein Sci. 5, 1973–1983. doi: 10.1002/pro.5560051003
Trotta, E. (2013). Selection on codon bias in yeast: a transcriptional hypothesis. Nucl. Acids Res. 41, 9382–9395. doi: 10.1093/nar/gkt740
Tuller, T., Carmi, A., Vestsigian, K., Navon, S., Dorfan, Y., Zaborske, J., et al. (2010). An evolutionarily conserved mechanism for controlling the efficiency of protein translation. Cell 141, 344–354. doi: 10.1016/j.cell.2010.03.031
Verma, M., Choi, J., Cottrell, K. A., Lavagnino, Z., Thomas, E. N., Pavlovic-Djuranovic, S., et al. (2019). A short translational ramp determines the efficiency of protein synthesis. Nat. Commun. 10:5774. doi: 10.1038/s41467-019-13810-1
Viklund, H., and Elofsson, A. (2004). Best alpha-helical transmembrane protein topology predictions are achieved using hidden Markov models and evolutionary information. Protein Sci. 13, 1908–1917. doi: 10.1110/ps.04625404
Yang, J. R., Chen, X., and Zhang, J. (2014). Codon-by-codon modulation of translational speed and accuracy via mRNA folding. PLoS Biol. 12:e1001910. doi: 10.1371/journal.pbio.1001910
Yu, C. H., Dang, Y., Zhou, Z., Wu, C., Zhao, F., Sachs, M. S., et al. (2015). Codon usage influences the local rate of translation elongation to regulate co-translational protein folding. Mol. Cell 59, 744–754. doi: 10.1016/j.molcel.2015.07.018
Zhang, G., Hubalewska, M., and Ignatova, Z. (2009). Transient ribosomal attenuation coordinates protein synthesis and co-translational folding. Nat. Struct. Mol. Biol. 16, 274–280. doi: 10.1038/nsmb.1554
Zhao, F., Yu, C. H., and Liu, Y. (2017). Codon usage regulates protein structure and function by affecting translation elongation speed in Drosophila cells. Nucl. Acids Res. 45, 8484–8492. doi: 10.1093/nar/gkx501
Keywords: codon usage bias (CUB), relative synonymous codon usage (RSCU), preferred and non-preferred codons, codon clusters, environmental yeasts
Citation: Baeza M, Sepulveda D, Cifuentes V and Alcaíno J (2024) Codon usage bias in yeasts and its correlation with gene expression, growth temperature, and protein structure. Front. Microbiol. 15:1414422. doi: 10.3389/fmicb.2024.1414422
Received: 08 April 2024; Accepted: 25 June 2024;
Published: 08 July 2024.
Edited by:
María-Isabel González-Siso, University of A Coruña, SpainReviewed by:
Tobias von der Haar, University of Kent, United KingdomMichael McMurray, University of Colorado Denver, United States
Copyright © 2024 Baeza, Sepulveda, Cifuentes and Alcaíno. This is an open-access article distributed under the terms of the Creative Commons Attribution License (CC BY). The use, distribution or reproduction in other forums is permitted, provided the original author(s) and the copyright owner(s) are credited and that the original publication in this journal is cited, in accordance with accepted academic practice. No use, distribution or reproduction is permitted which does not comply with these terms.
*Correspondence: Marcelo Baeza, bWJhZXphQHVjaGlsZS5jbA==