 Tianfeng An1‡Shuya Zhang2‡Jinjin Li3‡
 Hui Wang1,4,5Li Chen1,4,5,6Yiran Shi1Jingyi Wang7Sirui Han7Ruoxi Wang1Linyuan Wang1Zijing Huan1Ruiqi Yang1Desong Hao1Yanfang Liu1Xuehua Liu3*†
 Chao Yuan1,4,5,6*†
- 1The School of Public Health, Tianjin Medical University, Tianjin, China
- 2The School of Medicine, Nankai University, Tianjin, China
- 3Department of General Practice, Tianjin Union Medical Center, The First Affiliated Hospital of Nankai University, Tianjin, China
- 4Tianjin Key Laboratory of Environment, Nutrition and Public Health, Tianjin Medical University, Tianjin, China
- 5Center for International Collaborative Research on Environment, Nutrition and Public Health, School of Public Health, Tianjin Medical University, Tianjin, China
- 6Department of Toxicology and Sanitary Chemistry, School of Public Health, Tianjin Medical University, Tianjin, China
- 7The School of Clinical Medical, Tianjin Medical University, Tianjin, China
Introduction: Human microbiota is a major factor contributing to the immune system, offering an opportunity to develop non-invasive methods for disease diagnosis. In some research on Autoimmune Diseases (AIDs), gut microbiota variation has been observed. However, there remains a paucity of research that explores the potential of gut microbiota as a microbial signature for the classification and diagnosis of multi-AIDs.
Methods: In this study, we analyzed 1,954 gut microbiota sequencing datasets from public databases collected from 1,043 patients with 10 AIDs to identify common or unique microbial signatures for AIDs through differential abundance testing and machine learning techniques. We evaluated five popular algorithms: Random Forest (RF), Support Vector Machine (SVM), K-Nearest Neighbors (KNN), Multilayer Perceptron (MLP), and eXtreme Gradient Boosting (XGBoost) models. Five-fold cross-validation and grid search were used to select the model parameters.
Results: After comparing the performance of five models, the XGBoost model showed superior performance and achieved an area under the receiver operating characteristic curve (AUROC) ranging from 0.75 to 0.99 when predicting different diseases in the test set. At a specificity of 0.7 to 0.96, the sensitivity ranged from 0.66 to 1. By correlating the top 77 microbiota genera with the disease phenotypes, 126 significant associations were identified [false discovery rate (FDR) < 0.05]. We improved the detection accuracy and disease specificity for AIDs and revealed microbiota features specific to 10 different AIDs. Moreover, we found changing trends in shared microbiota features across some AID phenotypes, such as Crohn's Disease (CD) and Ulcerative Colitis (UC). At the same time, opposite changing trends were observed in the shared microbial signatures, such as Psoriasis and Myasthenia Gravis (MG). These results suggest that specific gut microbiota genera may affect the host immunity and induce different AID phenotypes.
Discussion: This research holds potential for clinical application in the auxiliary diagnostic evaluation and monitoring of treatment responses. Simultaneously, it provides important clues for research on the characteristics of the intestinal immune microenvironment for different AIDs.
Introduction
The gut microbiota represents a highly intricate community of microorganisms, encompassing bacteria, archaea, and eukaryotes, that inhabit the intestine. It is estimated that in approximately 100 trillion cells (Ley et al., 2006), the symbiotic microbes within the human gut exceed the number of host cells by at least an order of magnitude and possess a substantially larger repertoire of unique genes when compared to the host genome. Overall, the intestinal microbiota is composed of approximately 500–1,000 species, which belong to only a limited number of known bacterial phyla (Zoetendal et al., 2008). Emerging research suggests that the gut microbiota demonstrates vast enzymatic potential and plays a pivotal role in modulating diverse aspects of host physiology, such as pathogen resistance, host immunity, and metabolic processes (Sommer and Bäckhed, 2013; Belkaid and Hand, 2014; Blaser and Falkow, 2009).
The gut microbiota plays a crucial role in maintaining a delicate equilibrium between host defense and immune tolerance (Yang et al., 2021). The microenvironment within the gut is shaped by complex and intricate interactions between the gut microbiota and the local innate immune system (Piccioni et al., 2022; Gensollen et al., 2016). Optimally, the interaction between the immune system and microbiota functions in harmony, integrating both the innate and adaptive components of immunity to select, calibrate, and terminate immune responses, thus preserving homeostasis. Nevertheless, this immune balance between the gut flora and host is not invariably stable. A variety of pathologies affecting humans, including allergies, autoimmune disorders, and inflammatory conditions, stem from the inability to regulate misdirected immune responses against self-antigens, microbiota-derived antigens, or environmental antigens (Zoetendal et al., 2008; Jiao et al., 2020; Mu et al., 2017; Wang et al., 2015).
Autoimmune diseases (AIDs) occur when an individual's immune system mistakenly attacks its own tissues, with an estimated global incidence of approximately 3–5% (Miller et al., 2012; Ramos-Casals et al., 2015). Human microbiota is thought to be a crucial factor in the development of autoimmunity, as alterations in the microbial composition can result in the breakdown of immune tolerance (Belkaid and Hand, 2014; Shamriz et al., 2016). Systematic analysis of the human gut microbiota holds promise for developing non-invasive diagnostic methods for major AIDs. With the emergence of next-generation sequencing (NGS), novel strategies have been developed to investigate the association between gut microbiota dysregulation and AIDs. These strategies entail bioinformatic analysis to characterize the microbial compositions of samples, including the identification of microbial taxa and their relative abundance. Moreover, in case–control studies, researchers have attempted to identify differentially abundant microbial taxa as potential disease biomarkers (Quince et al., 2017; Liu et al., 2021; Knight et al., 2018). This approach has been applied to a variety of AIDs, such as systemic lupus erythematosus (SLE), rheumatoid arthritis (RA), inflammatory bowel diseases (IBD), and systemic sclerosis (SS) (Hevia et al., 2014; Chen et al., 2022; Volkmann et al., 2016; Andréasson et al., 2016; da Silva Brito et al., 2022; Vich Vila et al., 2018; Vaahtovuo et al., 2008; Chen et al., 2016).
However, the existence of shared microbial signatures across diverse diseases and overlapping gut microbiota signatures among most health states poses challenges for accurate diagnosis when using single-disease models, which can result in misclassification (Gacesa et al., 2022). To address this, multi-class diagnostic models have been developed to predict disease-specific signatures across the microbiota, enabling more accurate diagnostic purposes (Khan and Kelly, 2020; Su et al., 2022; Li M. et al., 2023). Machine learning (ML) classifiers are often employed for disease diagnosis, either using gut microbiota data alone or in conjunction with clinically relevant features, to differentiate patients from healthy controls (Ghannam and Techtmann, 2021; Marcos-Zambrano et al., 2021; Curry et al., 2021). ML-based gut microbiota classifiers have been developed for a variety of diseases, including inflammatory bowel disease (IBD), liver cirrhosis (LC), autism spectrum disorder (ASD), Alzheimer's disease (AD), and numerous others (Jiang et al., 2021; Qin et al., 2014; Oh et al., 2020; Kartal et al., 2022; Nagata et al., 2022; Dan et al., 2020; Liu et al., 2019; Li et al., 2019).
In the present study, we conducted a comprehensive meta-analysis of multiple AIDs. A total of 1,954 samples were used in this study. These diseases spanned 10 major disease categories. To comprehensively characterize the gut microbiota in relation to 10 AIDs, namely rheumatoid arthritis (RA), ankylosing spondylitis (SpA), multiple sclerosis (MS), psoriasis, Crohn's disease (CD), ulcerative colitis (UC), celiac disease (CeD), myasthenia gravis (MG), systemic lupus erythematosus (SLE), and type 1 diabetes (T1D), we utilized gut microbiota sequencing data to evaluate the abundance of taxonomic units. Furthermore, we developed a machine learning multi-classification model for the diagnosis of multi-AIDs and identification of microbial signatures that are either common across or specific to these 10 AIDs.
Materials and methods
The main framework for dataset partitioning, model training, and validation of this research was shown in Figure 1A.
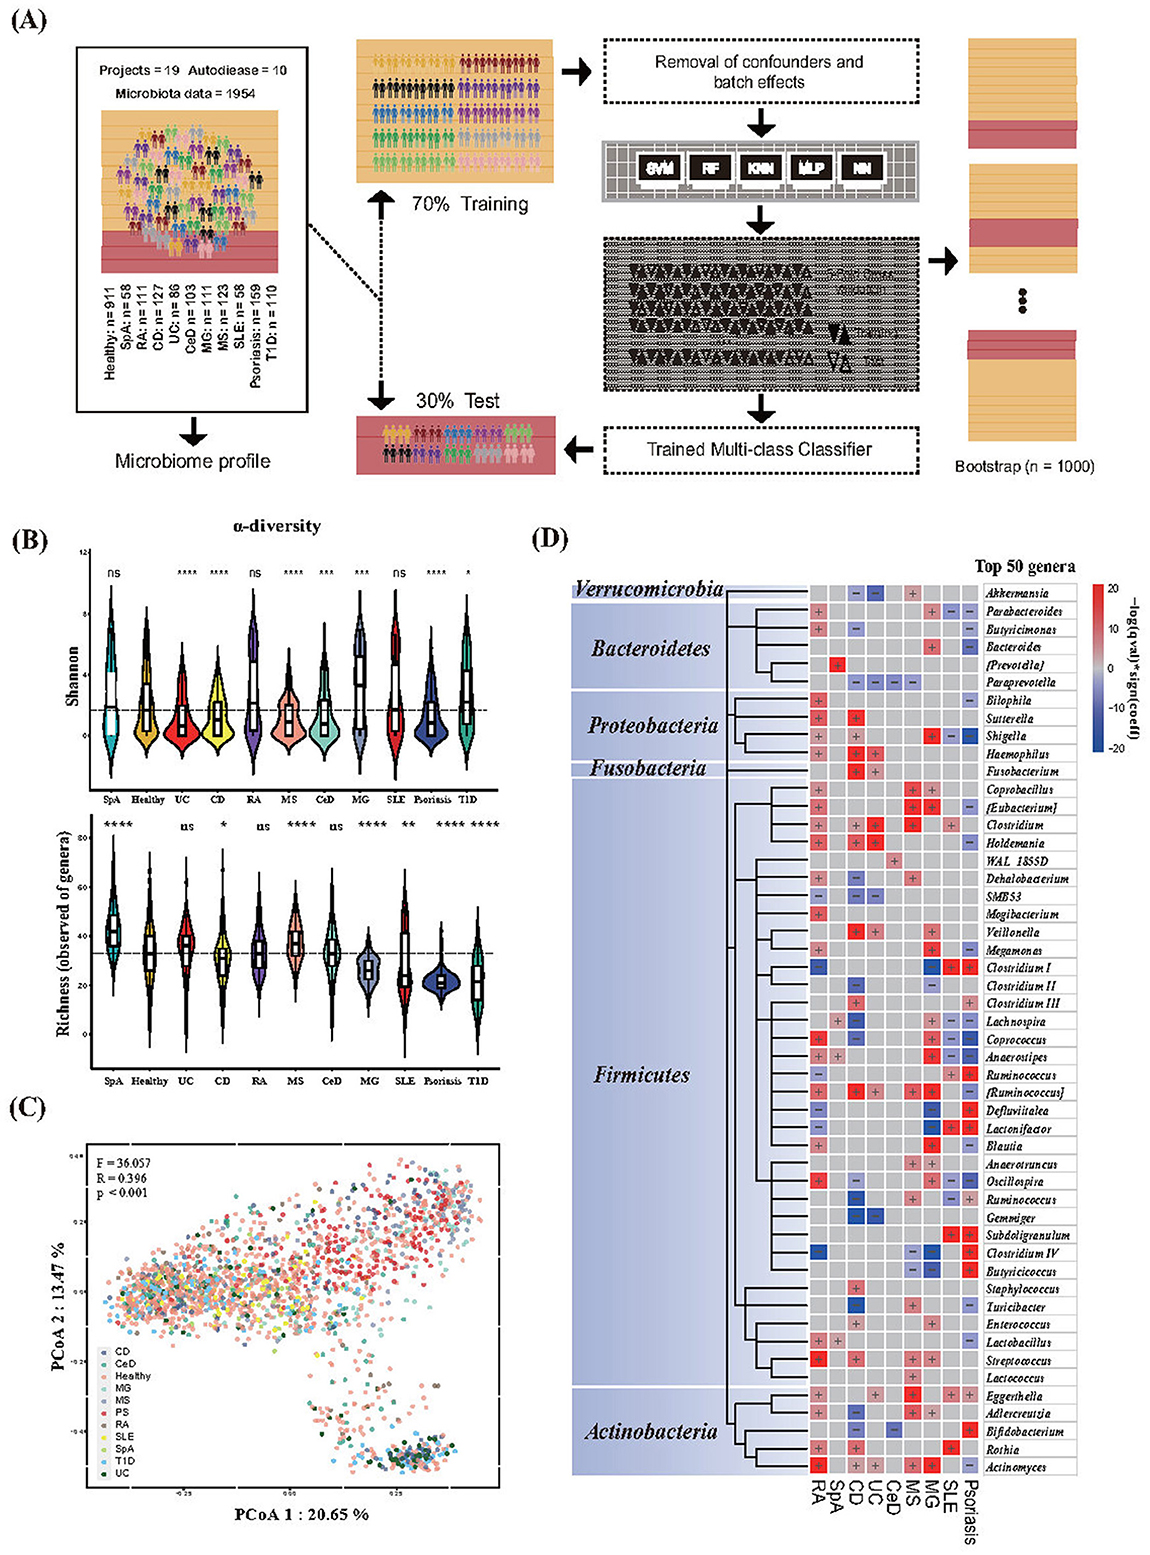
Figure 1. Gut microbiota features of healthy individuals and those with diseases. (A) Framework for dataset partitioning, model training, and validation. (B) Alpha diversity metrics for Shannon diversity and richness (number of microbial genera) in different phenotypes. The centerline represents the median, and the boundaries of the box represent the upper and lower quartiles. Kruskal–Wallis test. (C) Bray–Curtis dissimilarity-based principal coordinate analysis (PCoA) of genus-level. Each data point represented an individual sample. The F-, R-, and P-values were calculated using PERMANOVA with 999 permutations. (D) Heat map of microbial genera associated with different phenotypes. The top 50 microbial genera with the highest numbers of associations were identified. The significance (p-value) of the associations was calculated using MaAsLin 2, and FDR was determined using the Benjamini–Hochberg correction. Associations are colored by direction of effect (red, positive; blue, negative), with associations significant at FDR < 0.05, marked with a plus (positive correlations) or negative (negative correlations), respectively. RA, Rheumatoid Arthritis; SpA, Spondylitis ankylosing; CD, Crohn's disease; UC, Ulcerative colitis; CeD, Celiac disease; MS, Multiple sclerosis; MG, Myasthenia gravis; SLE, Systemic lupus erythematosus; T1D, Type 1 diabetes. For all the P-values in the figure, *p < 0.05; **p < 0.01; ***p < 0.001; ****p < 0.0001.
Data collection
A comprehensive list of human autoimmune disease-related case–control studies on gut microbiota was performed in public databases, including NCBI BioProject (https://www.ncbi.nlm.nih.gov/bioproject) and GMrepo (a curated database of human gut metagenomes; https://gmrepo.humangut.info) (Dai et al., 2022; Wu et al., 2020). A total of 1,954 gut microbiota sequences on 10 different autoimmune diseases (Supplementary Table S1, run-level data including 1,043 cases and 911 controls) were collected. AIDs included RA, SpA, MS, Psoriasis, CD, UC, CeD, MG, SLE, and T1D. The specific inclusion and exclusion criteria are as follows: our inclusion criteria included: (1) Study on 16S rRNA amplicon sequencing of gut microbiota with complete disease phenotype metadata. (2) Case–control studies with at least nine valid samples in each case and control group. (3) No antibiotics or probiotic supplements were administered in the past 3 months. The exclusion criteria were as follows: (1) post-treatment follow-up after medication. We divided these 10 diseases into 7 categories, including 3 digestive system diseases, 2 AIDs of the nervous system diseases, 2 musculoskeletal diseases, 1 endocrine system disease, 1 connective tissue disease, and 1 skin disease, according to the NCBI Medical Subject Headings (MeSH, https://meshb.nlm.nih.gov/) database and Human Disease Ontology (DO) database (Schriml et al., 2022).
Sequencing data extraction and microbiota profiling
We extracted all SRA_ID (listed in Supplementary Table S1) from the NCBI SRA database (https://www.ncbi.nlm.nih.gov/sra) (Katz et al., 2022) or European Nucleotide Archive (ENA) (Harrison et al., 2021) and obtained related information on samples from the NCBI BioSample database (https://www.ncbi.nlm.nih.gov/biosample). Raw sequencing data (FATSQ files) were then downloaded using the SRA toolkit, and metadata, including age, gender, and country, were collected. Trimmomatic (Bolger et al., 2014) was used to trim the reads and to remove sequencing vectors and low-quality bases. Reads shorter than 50 base pairs were discarded after trimming. To preprocess the sequences, we used QIIME (2023.5) (Bolyen et al., 2019) to demultiplex and quality-filter the data. Representative sequences and their abundances were extracted using the feature table (McDonald et al., 2012a) to generate tables containing amplicon sequence variants (ASVs). Taxonomic assignment of the individual dataset was classified against the Greengenes database (version 13.8123) (McDonald et al., 2012b). Genus-level relative abundance results were retained for subsequent analyses. Subsequently, samples with only two or fewer taxa were excluded from subsequent analyses. Additionally, to minimize the noise caused by low-abundance taxa, we filtered out those with a relative abundance of < 0.001 across all samples.
Microbiota analysis
All statistical analyses were performed using R, version 4.2.2. The ggpubr package (https://github.com/kassambara/ggpubr) was used to perform non-parametric statistical testing between groups and to account for multiple hypothesis testing corrections when necessary. Significant differences in alpha diversity (Shannon index and richness) were determined using the non-parametric Kruskal–Wallis test. Differences in beta diversity (Bray–Curtis distance matrix calculated using the relative abundances of microbial genera) were determined by PERMANOVA using distance matrices (adonis) in the adonis function of the vegan R package with 999 permutations. Principal coordinate analysis (PCoA) based on beta-diversity was used to visualize the clustering of samples based on their genus-level compositional profiles. To adjust these findings for other factors that may affect microbiota, we used microbiota multivariable associations with linear models (MaAsLin) to identify compositional differences while adjusting for age, sex, and country. To account for the sequencing batch effects of all samples treated at different periods, we used the adjust_batch function implemented in the “MMUPHin” R package using project ID as the controlling factor before model development. Detailed information on the effectiveness of the batch effect removal in this study is shown in Supplementary Figure S1.
Classification model for multiple-autoimmune-diseases
Binary sub-cohorts were composed of one AID phenotype and its corresponding healthy control, resulting in a total of 10 binary subgroups. The random forest (RF) model was chosen as the binary classifier because its classification performance has been shown to outperform other methods for microbiota data (Pasolli et al., 2016). The RF model was first trained on a randomly selected training set (5-fold stratified cross-validation) and then applied to the withheld test set to assess the final performance. This process was repeated 20 times to obtain a distribution of RF prediction evaluations for the test set, and the mean AUROC value was calculated.
Multi-class models can be implemented in Python 3.8 using standard libraries that are publicly available, including pandas (2.0.3), numpy (1.22.4), scikit-learn (1.3.1), and matplotlib (3.7.3). For each phenotype, the samples were randomly divided into training (70%, n = 1,368) and test (30%, n = 586) sets. Random forest (RF), support vector machine (SVM), K-nearest neighbors (KNN), multilayer perceptron (MLP), and eXtreme Gradient Boosting (XGBoost) were used as classifier models to diagnose different phenotypes based on the taxonomic profiles at the genus level of the gut microbiota. We employed a 5-fold cross-validation and grid search to select the optimal model parameters for the RF, SVM, KNN, and XGBoost models. For the MLP models, we implemented the default settings provided by Scikit-learn. Finally, we evaluated the performance of the five models on the test dataset as the final performance for predicting different diseases. The highly ranked and frequently selected microbiota features were considered predictive signatures for further interpretation.
Model validation and performance evaluation
The area under the receiver operating characteristic curve (AUROC) is a widely used metric for evaluating the performance of classification models and provides a comprehensive assessment of the model's sensitivity and specificity trade-off at different thresholds. The range of AUROC values is typically explained from 0.5 to 1, with a higher value indicating a better ability to distinguish between different classes of samples. The area under the precision-recall curve (AUPRC), as a complementary assessment, considers the trade-offs between precision (or positive predictive value) and recall (or sensitivity) and is more robust for imbalanced datasets. The AUPRC ranges from 0 to 1, with a value of 0 signifying no positive examples identified and a value of 1 indicating perfect identification of all positive examples. In addition, for a more comprehensive evaluation of the model's performance, we employed the F1 score. It is a metric that considers the precision and recall of a model. The F1 score ranges from 0 to 1, with a higher value indicating better overall performance of the model.
We employed the bootstrap method to address the data imbalance and obtain more robust performance evaluations for each model. The bootstrap method involves iteratively resampling the training data, training a new model, and evaluating the model 1,000 times (Wang et al., 2023; Ning et al., 2025). The performance of the model was calculated as the average performance of the individual models developed using the bootstrap method. Bootstrap methods can considerably reduce overfitting in the developed models. To identify the most discriminative features among many bacterial genus features, minimize model complexity, and enhance computational efficiency and interpretability, we generated a learning curve relating the number of features to the model performance.
Sensitivity analysis
Considering the potential influence of the three factors, “gender,” “age,” and “geographical location,” on the gut microbiota, we conducted the sensitivity analysis. For the factor “geographical location,” >75% of the samples in this study were collected from the United States (746) and China (724). We evaluated our model using country-based stratification. For factors “gender” and “age,” the Kruskal–Wallis test was conducted to verify the significance of the differences in the abundance of the corresponding genus in the gut microbiota among different age groups and different genders regarding the AID phenotype. Age groups: Juvenile (3–20), Young Adult (21–45), Older Adult (46–65), and Elderly (65+); Gender groups: Female and Male (Supplementary Table S1, “Sensitivity analysis”).
Results
Summary of available data
A total of 1,954 gut microbiota sequencing data (1,043 AIDs cases and 911 non-disease controls; sequences based on Illumina platforms) were collected from the NCBI database based on 19 case–control studies. These data could contain up to 127 cases and 247 controls; however, most studies were conducted on a limited number of samples, with median sizes of 55 cases and 48 controls, respectively. The fecal samples for the gut microbiota sequencing data were mainly collected from five continents and 13 countries, most of which were from the United States of America (38.18%), China (32.44%), and Canada (11.36%) (related information was shown in Supplementary Table S1, “Data availability”).
Gut microbiota features across different phenotypes
Ecological indices may not be robust indicators for distinguishing disease from healthy status, which results in changes in the structure of the gut microbiota. First, we aimed to determine the differences in the composition of the gut microbiota among the different AIDs. Compared to healthy controls, significant differences in bacterial diversity (Shannon) and richness (number of genera) were observed in AIDs, except for RA. The Shannon index of the digestive system AIDs decreased. Moreover, we found that both indices (Shannon and richness) varied across phenotypes (Figure 1B). The results of microbial diversity among different phenotypes are consistent with a recent study on multi-class disease diagnosis based on gut microbiota and meta-analysis (Su et al., 2022; Gupta et al., 2020). Beta diversity based on Bray–Curtis dissimilarity showed significant differences in gut microbiota composition among individuals with different phenotypes (R = 0.396; F = 36.057; p < 0.001) (Figure 1C). We then used the linear model of MaALin2 after adjusting for age, sex, country, and technical confounders to explore the associations of microbial composition at the genus level with disease phenotypes. We found 192 significant associations between the 11 phenotypes and 62 bacterial taxa at the genus level (FDR < 0.05). Among the 62 genera, > 67.7% were significantly associated with two or more diseases. The genera Haemophilus, Veillonella, Eggerthella, and Rothia were positively associated with AIDs in our results, whereas the opposite was observed with the genera Paraprevotella, SMB53, and Gemmiger (Figure 1D, Supplementary Table S1 “Gut microbiota data”).
Development of a gut microbiota-based diagnosis model
The binary classifier of the RF model based on the microbiota could significantly distinguish between healthy and most AIDs (Figure 2A), which indicated that AIDs had different degrees of intestinal flora disturbance compared with the control. To further investigate the discriminatory ability of the gut microbiota in various AIDs and to distinguish between AIDs and healthy controls, we constructed multi-class classifiers.

Figure 2. Comparison of different classifiers for phenotype classification using fecal microbiota data at the genus level. (A) Area under the receiver operating characteristic curve (AUROC) of random forest binary classifiers for disease vs. healthy control discrimination. (B) Performance across models was measured using the AUROC and area under the precision-recall curve (AUPRC) for predicting one phenotype vs. all others in the test set. (C) Mean AUROC, AUPRC, and F1-score, along with their corresponding 95% confidence intervals (95% CI), were calculated for the five machine learning models using the bootstrap method. (D) Learning curve of the relationship between the number of microbial genera and AUROC values. RA, Rheumatoid Arthritis; SpA, Spondylitis ankylosing; CD, Crohn's disease; UC, Ulcerative colitis; CeD, Celiac disease; MS, Multiple sclerosis; MG, Myasthenia gravis; SLE, Systemic lupus erythematosus; T1D, Type 1 diabetes; RF, Random forest; SVM, support vector machine; KNN, K-nearest neighbors; MLP, multilayer perception; XGBoost, eXtreme Gradient Boosting.
To select the best multi-class machine learning algorithm, we evaluated five popular algorithms: RF, SVM, KNN, MLP, and XGBoost models. Five models achieved a mean AUROC of all phenotypes of 0.72–0.89 (Figure 2B), suggesting that muti-class disease classification based on the gut microbiota was feasible. Amongst them, the XGBoost multi-class model had an optimal performance and achieved a mean AUROC of 0.89 [interquartile range, IQR (0.87–0.90)], a mean AUPRC of 0.48 [interquartile range, IQR (0.44–0.51)], and a mean F1-score of 0.538 [interquartile range, IQR (0.51–0.57)] for different disease phenotypes in the test set (Figure 2C). Therefore, the XGBoost multi-class classifier was used for further analysis.
The XGBoost model is constructed using a complete training set. The importance rankings of all features at the genus level were obtained by leveraging this model. Subsequently, the features were incorporated in descending order of importance. For each step of adding a feature, the AUROC value of the model was computed, thereby generating a learning curve that depicted the relationship between the number of features and model performance (Figure 2D). The results indicate that the model performance reached a plateau when 77 features were employed. At this stage, a further increase in the number of features did not lead to a significant improvement in performance. Consequently, the first 77 features were selected as the input variables for the final model. The AUROC values for most phenotypes exceed 0.9 (Figure 3A). The macro-AUROC value was 0.9 [IQR (0.88–0.91)], indicating superior performance compared to the binary classifier we trained. This classifier proved to be valuable for effectively distinguishing AIDs based on features derived from the gut microbiota. At the optimal Youden's index threshold, the sensitivities of our XGBoost multi-class model range from 0.66 to 1 at specificities of 0.70 to 0.95 for different diseases with accuracy from 0.74 to 0.94, highlighting good diagnostic performance (Figure 3B). For example, our model achieved an AUROC of 0.95, CD with a sensitivity of 0.94, and a specificity of 0.89 (Figures 3A, B). To better characterize the XGBoost model, we compared its performance on datasets with different split ratios and obtained similar results, which indicated that the model exhibited high stability and good predictive capability without the risk of overfitting (Figure 3C).

Figure 3. Gut microbiota-based XGBoost model for multi-class disease diagnosis. (A) Receiver operating characteristic curve of the XGBoost multi-class model, including 77 microbial genera. (B) Performance metric details of the trained XGBoost multi-class classifier for classifying one phenotype from all others using genus-level fecal microbiota data in the test set. (C) AUROC of the XGBoost multi-class model across different split ratios. (D) Microbial genera associated with different phenotypes. The top 77 microbial genera that contributed to the XGBoost multi-class classifier were clustered by taxonomy. The significance (p-value) of the associations was calculated using MaAsLin 2, and FDR was determined using the Benjamini–Hochberg correction. Associations are colored by direction of effect (red, positive; blue, negative; p < 0.05), with associations significant at FDR < 0.05, marked with a plus (positive correlations) or minus (negative correlations), respectively. RA, Rheumatoid Arthritis; SpA, Spondylitis ankylosing; CD, Crohn's disease; UC, Ulcerative colitis; CeD, Celiac disease; MS, Multiple sclerosis; MG, Myasthenia gravis; SLE, Systemic lupus erythematosus; T1D, Type 1 diabetes.
Associations between microbiota features and phenotypes
Next, we correlated the top 77 bacterial genera that contributed to the model with the different disease phenotypes. Among the 77 genera, 126 significant associations were found between 42 genera and the different disease phenotypes. These 42 genera belonged to the phyla Firmicutes (28 genera), Actinobacteria (6 genera), Proteobacteria (5 genera), Fusobacteria (1 genus), and Bacteroidetes (3 genera) (Figure 3D). Among the selected bacterial genera, significant associations were found between the phenotypes and several genera, except for T1D (genera only). From the perspective of AID phenotypes, CD (23 genera), RA (21 genera), and psoriasis (20 genera) were the three phenotypes with the highest number of related genera (FDR < 0.05). However, in SpA and CeD, fewer related genera were found (n < 5). From the perspective of the gut microbiota, the genera Actinobacteria and Ruminococcaceae II correlated with the largest number of AID phenotypes (six AID phenotypes). The genera Shigella, Clostridium, and Eggerthella also correlated with many AID phenotypes (five AID phenotypes). These genera could serve as shared microbiota features, which may suggest an association with AID phenotypes except for T1D. The genus Dorea, Lachnobacterium, WAL_1855D, Bulleidia, Pseudomonas, and the special genus Prevotella are only associated with one AID phenotype. This may imply that specific changes in the gut microbiota are related to the corresponding AID phenotype. The genera Clostridium, Eggerthella, Haemophilus, Fusobacterium, Subdoligranulum, and Rothia positively correlated with several AID phenotypes. However, Paraprevotella, SMB53, Clostridium II, Gemmiger, and Slackia were negatively correlated with several AID phenotypes. Only Fusobacterium, which belongs to Fusobacteria, was positively correlated with two inflammatory bowel diseases (CD and UC), indicating a potential microbiota feature of inflammatory bowel diseases.
Interestingly, we noted a higher degree of similarity in microbial alterations between diseases within the same system, such as inflammatory bowel diseases (CD and UC). Among these two phenotypes, 11 genera (approximately 50%) were shared between these two phenotypes, exhibiting similar trends in microbial changes. CeD, also an autoimmune disease of the digestive system, presents a completely distinct profile of related genera. Analogous results have also been reported in Psoriasis and SLE. Although shared microbiota features were relatively scarce, eight genera with similar trends in microbial changes were identified. In autoimmune diseases of the nervous system (MS and MG) and musculoskeletal system (RA and SpA), such similarities in microbial changes were not observed. On the other hand, in some AID phenotypes, alterations in the microbiota showed an opposite trend compared to the healthy group. For example, in Psoriasis and MG, ten microbiota features were shared between the two AID phenotypes, including the genera Actinobacteria, Butyricicoccus, Clostridium IV, Blautia, Lactonifactor, Shigella, Anaerostipes, Clostridium I, Parabacteroides, and Ruminococcus II. However, opposite trends were observed. Similar findings were obtained in a comparison of psoriasis and RA. These results suggest that, in different AIDs, the gut microbiota microenvironment may possess completely opposing characteristics.
Sensitivity analysis
The data collected for this study were sourced from multiple countries. More than 70% of the study participants were from the United States and China. The model's performance was evaluated using country-based stratification, revealing consistent results (Figure 4). Moreover, the model attained a mean Area Under the Receiver Operating Characteristic Curve (AUROC) of 0.90 (Interquartile Range, IQR: 0.88–0.93) in the United States and 0.91 (0.88–0.93) in China, respectively. Given the potential influence of “gender” and “age” on the gut microbiota, we performed a stratified analysis based on age and gender (Supplementary Table S1, “Sensitivity analyses”). The sensitivity analysis results indicated that “Geographic location,” “Age,” and “Sex” are not the primary factors affecting classification outcomes.

Figure 4. Performance of the XGBoost multi-class classifier for AIDs samples stratified by country. RA, Rheumatoid Arthritis; SpA, Spondylitis ankylosing; CD, Crohn's disease; UC, Ulcerative colitis; CeD, Celiac disease; MS, Multiple sclerosis; MG, Myasthenia gravis; SLE, Systemic lupus erythematosus.
Discussion
The human gut microbiota has assumed growing significance as a biomarker for non-invasive disease screening and as a target for disease intervention owing to its profound association with human diseases. In this study, we comprehensively aggregated publicly available datasets of gut microbiota sequencing. Moreover, we integrated microbiota features among diverse AIDs and utilized advanced and reproducible machine learning approaches that are highly relevant to clinical practice. Overall, this study demonstrated the feasibility of using a multi-classifier based on gut microbiota for the identification of AIDs. We propose that this multi-class model shows great potential for clinical applications in auxiliary diagnosis evaluation and assessment of the efficacy of interventions. Simultaneously, it offers crucial clues for the investigation of the characteristics of the intestinal immune microenvironment in different AIDs that primarily affect various body sites.
Our analysis of the gut microbiota revealed microbiota features associated with the 10 AIDs. Most of these findings are consistent with previous research on the correlation between the gut microbiota and AIDs. For example, Actinomyces spp., which act as both pathogens and constituents of human microbiota, have been reported to be enriched in patients with IBD or colorectal cancer (Yachida et al., 2019; Pittayanon et al., 2020). Bifidobacterium spp. are important probiotics, particularly during infancy. In the infant gut microbiota, a relationship between Bifidobacterium spp. and allergies has been identified, which plays a vital role in immune modulation and tolerance (Cukrowska et al., 2020; Gavzy et al., 2023; Derrien et al., 2022). Adlercreutzia spp. and Clostridium spp. were decreased in the gut microbiota of patients with CD (Leibovitzh et al., 2022). Haemophilus spp., a type of gut microbiota, has been reported to be associated with several immune-related disorders, including RA, IBD, and Hashimoto's thyroiditis (Liu et al., 2022; Zhang et al., 2015; Dunalska et al., 2023). Similarly, in our study, we also detected significant enrichment of this bacterial genus in patients with RA and IBD. Meanwhile, in studies exploring the gut microbiota of patients with type 2 diabetes (T2D), Parkinson's disease, and Alzheimer's disease, differences in the genus Haemophilus were observed between the disease groups and healthy control groups (Li Z. et al., 2023; Letchumanan et al., 2022). Eggerthella spp. and Prevotella spp., as typical gut microbiota signatures, were reported to be enriched in SLE, which is consistent with our results (Bixio et al., 2024; Yao et al., 2023). Genus Eggerthella levels have been implicated in inflammatory diseases, especially human gut Eggerthella lenta in AIDs and other conditions (Plichta et al., 2021; Xiang et al., 2021; Chang and Choi, 2023). Veillonella spp. are closely related to the genus Clostridiales, which are recognized as probiotic organisms in the host (Furusawa et al., 2013). Other studies have indicated that Veillonella spp. act as inflammophilic pathobionts, thriving in an inflammatory milieu, and possess the inherent ability to stimulate IL-6-mediated inflammation (van den Bogert et al., 2014). Notably, in a study of the gut microbiota in autoimmune hepatitis (AIH), the genus Veillonella was identified as the key genus strongly associated with the disease (Wei et al., 2020; Yuming et al., 2024). The genus Fusobacterium was significantly increased in IBD in our study, and previous research has found a similar association (Volkmann et al., 2016; de Paiva et al., 2016; Hong et al., 2023; Cornejo-Pareja et al., 2020; Islam et al., 2022). In particular, Fusobacterium nucleatum exhibits a wide range of characteristics under certain conditions. It can adhere to a large number of phylogenetically unrelated bacterial species, potentially leading to the translocation of non-invasive, yet pro-inflammatory species across the compromised intestinal epithelium, thereby exacerbating the disease state (Uitto et al., 2005; Strauss et al., 2011). Given that the AIDs included in this study preferentially targeted distinct body organs, it is unsurprising that we detected differences, as prior studies have reported analogous conclusions (Forbes et al., 2016). In our study, the number of microbiota features corresponding to each AID phenotype was lower than the number of significant differential microbiota abundances found in existing studies based on basic case–control studies. This is attributable to the fact that our model was constructed using data from 10 AIDs. In addition to considering the differences between AIDs and controls, it also accounts for potential disparities among the various AID phenotypes. Consequently, the selected microbiota features are relatively fewer. However, some of our findings deviated from those of previous studies. For example, previous studies have indicated that Prevotella spp. are more abundant in the early/preclinical stages of RA, whereas Bifidobacterium spp. are less abundant. Nevertheless, our study did not yield similar results (Ajith and Anita, 2025). Our findings also identified several bacterial genera that were scarcely observed in previous investigations of the 10 AIDs. Rothia spp. have been mentioned in research on treatable periodontitis, endocarditis, and joint infections (Michels et al., 2007; Verrall et al., 2010; Colombo et al., 2012). Our study revealed a potential association between the genus Rothia and SLE, RA, and IBD, which has not been previously reported. Paraprevotella spp., encompassing numerous opportunistic pathogens, has only been reported in the fecal samples of patients with rare AIDs, such as Behcet's disease (BD), Vogt-Koyanagi-Harada (VKH) disease, and the dextran sulfate sodium-induced IBD model (Ye et al., 2020, 2018; Sabater et al., 2022). In our study, there was a significant reduction in Paraprevotella in MS, CD, UC, and CeD. In the colorectal cancer mouse model, the Paraprevotella spp.-derived metabolite agmatine triggered inflammation to promote colorectal tumorigenesis through the Wnt signaling pathway (Lu et al., 2024). This might be the key mechanism by which Paraprevotella spp. regulates the gut immune microenvironment in various AIDs. Although disease phenotypes were not observed in this study, the genus Slackia was found to be more abundant in patients with APECED-associated hepatitis (APAH) (Chascsa et al., 2021). The discovery of these bacterial genera suggests that multi-classifiers based on deep machine learning are more conducive to uncovering gut microbiota features that have not been easily discerned in previous studies across a broader range of data.
As described in the “Results” section, we observed a higher degree of similarity in microbial alterations among the two inflammatory bowel diseases (CD and UC). Among these two phenotypes, 11 shared genera exhibited similar trends in terms of microbial changes. Analogous findings were also noted in Psoriasis and SLE, where eight shared genera with similar trends in microbial changes were identified. In contrast, in the nervous system, AIDs (MS and MG) and musculoskeletal system (RA and SpA) AIDs, such similarities in microbial changes were not detected. IBD is a consequence of the interaction between the host and microorganisms, encompassing intestinal microbial factors, abnormal immune responses, and a damaged intestinal mucosal barrier. CD and UC are two subtypes of IBD that may have similar intestinal immune microenvironments, leading to numerous shared microbiota features with comparable trends of microbial changes (Danne et al., 2024; Anderson et al., 2021). Psoriasis and SLE are chronic autoimmune diseases that affect multiple organs. Although their specific pathogenic mechanisms differ, they all involve abnormal activation of immune cells, abnormal secretion of cytokines, and T cell-mediated inflammation (Griffiths et al., 2021; Durcan et al., 2019). In our results, eight genera, Eggerthella, Subdoligranulum, Ruminococcus, Lactonifactor, Anaerotruncus, Clostridium, Parabacteroides, and Shigella, shared microbiota features with similar trends. Eggerthella spp. can induce intestinal Th17 activation by lifting inhibition of the Th17 transcription factor Rorγt through cell- and antigen-independent mechanisms (Bixio et al., 2024). Subdoligranulum spp. are arthritogenic strains that trigger RA and can stimulate Th17 cell expansion in mice (Zhu et al., 2020). In colorectal cancer, Ruminococcus spp. can maintain the immune surveillance function of CD8+ T cells through its metabolic characteristics (Schirmer et al., 2019). The remaining three genera were also associated with other AIDs, including MS, RA, and IBD (Bixio et al., 2024; Ajith and Anita, 2025; Anderson et al., 2021; Yousefi et al., 2023; Caruso et al., 2020).
On the other hand, in some AID phenotypes, alterations in the microbiota exhibited an opposing trend compared to the healthy control group. For example, in Psoriasis and MG, 10 microbiota features were shared between these two AID phenotypes, including the genera Actinobacteria, Butyricicoccus, Clostridium IV, Shigella, Blautia, Lactonifactor, Anaerostipes, Clostridium I, Parabacteroides, and Ruminococcus II; however, opposite trends of change were found. Similar results were also found in Psoriasis and RA (opposite-trend-genera: Actinobacteria, Clostridium IV, Blautia, Clostridium I, Ruminococcus I, Ruminococcus II, Parabacteroides, Bilophila Lactonifactor, Megamonas, Anaerostipe, Holdemania, and Shigella). Th17 cells play a crucial role in the pathogenesis of AIDs. Although specific pathological regions vary among different AID phenotypes, Psoriasis, RA, and MG involve an imbalance in Th17/Treg cells (Alexander et al., 2022; Zhang et al., 2024; Szekanecz et al., 2021). Almost all the above-mentioned genera with opposite trends have been reported to be associated with Th17 cells or T-cell-related inflammatory responses, except for the genera Holdemania and Bilophila (Bixio et al., 2024; Ajith and Anita, 2025; Sun et al., 2023; Schirmer et al., 2019; Lian et al., 2024; Yu et al., 2025; Lu et al., 2024; Zou et al., 2024). Numerous investigations have demonstrated that the gut microbiota can exert an impact on host immunity via its metabolites. This process, in turn, affects AID phenotypes, and this mechanism represents a key strategy for treating AIDs (Yang and Cong, 2021). Our findings indicate that, within distinct AIDs, the gut microbiota microenvironment may exhibit completely opposing characteristics. The variations in AID phenotypes may be attributed to the influence of specific gut microbiota patterns on the host immune response process. Combined with the role of genetic factors, this leads to an imbalance of Th17/Treg cells in different regions of the body, ultimately giving rise to the emergence of corresponding pathological phenotypes.
Strengths and limitations
The strengths of this study include the use of gut microbiota data covering a variety of disease phenotypes (10 AIDs), including gut microbiota sequencing data from almost 2,000 participants. However, this study has some limitations that should be acknowledged. First, we aimed to include gut microbiota sequencing data covering the widest possible range of AIDs and the corresponding healthy controls. However, microbiota sequencing data in public databases often lack relevant information, such as host comorbidities, diet, BMI, and treatment/medication conditions. In our study, only sex (70.5%), age (86.9%), and geographical location (100%) were comprehensively available. Previous research has shown that age and geographical location influence gut microbiota composition, and in some diseases, such as systemic lupus erythematosus (SLE), sex also plays a role (Pang et al., 2023; Bradley and Haran, 2024; He et al., 2018). Therefore, we conducted sensitivity analyses based on these three factors (Figure 4 and Supplementary Table S1, “Sensitivity analyses”). Most genera showed significant differences; however, in the ≥65 age group, some genera did not, likely due to the limited sample size rather than age-related effects. Moreover, because of the limitations of publicly available sequencing data (16S limitations), our analyses were restricted to the genus level, and species-level analyses could not be performed. Second, all datasets were retrospectively obtained, and the classifier was not validated in an external prospective cohort. The complex phenotypes of AIDs, prolonged sample collection periods, and limited availability of prospective data in public databases preclude such validation. Future studies should involve collaboration with relevant clinical teams to prospectively collect fecal samples, utilize gut metagenomic sequencing to obtain deep-level microbiota information, assess the classifier's predictive value for disease progression or prognosis, and enhance its clinical applicability. Finally, the data were cross-sectional, limiting our ability to determine the temporal sequence and causality between abnormal gut microbiota and the onset of AIDs.
Conclusion
In conclusion, this study offers a comprehensive analysis of the composition of stool microbiota in AIDs. Our findings show that the composition of gut microbiota changes in rheumatoid arthritis (RA), spondyloarthritis (SpA), Crohn's disease (CD), ulcerative colitis (UC), celiac disease (CeD), multiple sclerosis (MS), myasthenia gravis (MG), systemic lupus erythematosus (SLE), and psoriasis. These changes are notably associated with varying degrees of gut dysbiosis. Moreover, through differential abundance testing and machine learning techniques, we identified several microbial signatures that exhibit consistently higher or lower abundances in AIDs patients than in healthy controls. Subsequent research is imperative to delve into the specific roles and functions of this genus within the host. This is crucial for establishing causal associations in disease pathogenesis and for exploring their potential as targets for future therapeutic interventions.
Data availability statement
The data that supports the findings of this study are available in NCBI SRA database (https://www.ncbi.nlm.nih.gov/sra); accession numbers listed in Supplementary Table S1.
Author contributions
TA: Writing – review & editing, Investigation, Resources, Software, Supervision, Writing – original draft, Data curation, Validation, Formal analysis, Visualization, Methodology. SZ: Validation, Methodology, Data curation, Investigation, Conceptualization, Resources, Writing – original draft. JL: Data curation, Investigation, Resources, Funding acquisition, Writing – review & editing. HW: Resources, Data curation, Writing – review & editing, Conceptualization. LC: Resources, Project administration, Data curation, Writing – review & editing. YS: Data curation, Resources, Writing – review & editing. JW: Writing – review & editing, Resources, Data curation. SH: Writing – review & editing, Resources, Data curation. RW: Data curation, Resources, Writing – review & editing. LW: Writing – review & editing, Resources, Data curation. ZH: Resources, Data curation, Writing – review & editing. RY: Data curation, Resources, Writing – review & editing. DH: Data curation, Writing – review & editing, Resources. YL: Data curation, Resources, Writing – review & editing. XL: Supervision, Data curation, Resources, Funding acquisition, Project administration, Writing – review & editing. CY: Formal analysis, Resources, Writing – review & editing, Funding acquisition, Visualization, Project administration, Writing – original draft, Supervision, Software, Methodology, Data curation, Conceptualization, Investigation, Validation.
Funding
The author(s) declare that financial support was received for the research and/or publication of this article. This work was funded by the National Natural Science Foundation of China (NSFC) Program (Grant No. 82273688) and the Tianjin Municipal Education Commission (No. 2020KJ202 and No. 2022KJ202).
Conflict of interest
The authors declare that the research was conducted in the absence of any commercial or financial relationships that could be construed as a potential conflict of interest.
Generative AI statement
The author(s) declare that no Gen AI was used in the creation of this manuscript.
Any alternative text (alt text) provided alongside figures in this article has been generated by Frontiers with the support of artificial intelligence and reasonable efforts have been made to ensure accuracy, including review by the authors wherever possible. If you identify any issues, please contact us.
Publisher's note
All claims expressed in this article are solely those of the authors and do not necessarily represent those of their affiliated organizations, or those of the publisher, the editors and the reviewers. Any product that may be evaluated in this article, or claim that may be made by its manufacturer, is not guaranteed or endorsed by the publisher.
Supplementary material
The Supplementary Material for this article can be found online at: https://www.frontiersin.org/articles/10.3389/fmicb.2025.1660775/full#supplementary-material
Supplementary Figure S1 | (A) Detailed information on the effectiveness of batch effect removal. Shrinkage of the batch mean parameters. X-axis: estimated batch mean parameter (Gamma); Y-axis: batch mean parameter after shrinkage (Gamma-shrunk). Shrinkage can stably adjust the batch mean parameters. (B) Original/adjusted mean abundance. X-axis: overall mean; Y-axis: mean values from the different batches. The correction process makes the originally scattered batch expressions more compact and closer to the overall average expression, thereby significantly reducing the batch effect.
Supplementary Table S1 | Comprehensive information on autoimmune diseases (AIDs) was collected for this study. Details of gut microbiota sequencing data and related samples (Bioproject_ID, SRA_ID, AIDs, Age, Gender, Country) were listed in sheet 1, “Data availability.” Ten autoimmune diseases (AIDs) are listed in Table 1. Microbial abundance results of gut microbiota sequencing data and related ID were shown in sheet 2, “Gut microbiota sequencing.” Sensitivity analysis on two factors (gender and age) was shown in sheet 3, “Sensitivity analysis.” For each genus, the Kruskal–Wallis test was conducted to verify the significance of the differences in the abundance of the corresponding genus in the gut microbiota among different age groups and sexes regarding the AID phenotype.
References
Ajith, T. A., and Anita, B. (2025). Impact of gut microbiota and probiotics on rheumatoid arthritis,: a., potential treatment challenge. Int. J. Rheum. Dis. 28:E70266. doi: 10.1111/1756-185X.70266
Alexander, M., Ang, Q. Y., Nayak, R. R., Bustion, A. E., Sandy, M., Zhang, B., et al. (2022). Human gut bacterial metabolism drives Th17 activation and colitis. Cell Host Microbe 30, 17–30.e9. doi: 10.1016/j.chom.2021.11.001
Anderson, C. J., Medina, C. B., Barron, B. J., Karvelyte, L., Aaes, T. L., Lambertz, I., et al. (2021). Microbes exploit death-induced nutrient release by gut epithelial cells. Nature 596, 262–267. doi: 10.1038/s41586-021-03785-9
Andréasson, K., Alrawi, Z., Persson, A., Jönsson, G., and Marsal, J. (2016). Intestinal dysbiosis is common in systemic sclerosis and associated with gastrointestinal and extraintestinal features of disease. Arthritis Res. Ther. 18:278. doi: 10.1186/s13075-016-1182-z
Belkaid, Y., and Hand, T. W. (2014). Role of the microbiota in immunity and inflammation. Cell 157, 121–141. doi: 10.1016/j.cell.2014.03.011
Bixio, R., Bertelle, D., Bertoldo, E., Morciano, A., and Rossini, M. (2024). The potential pathogenic role of gut microbiota in rheumatic diseases: a human-centred narrative review. Intern. Emerg. Med. 19, 891–900. doi: 10.1007/s11739-023-03496-1
Blaser, M. J., and Falkow, S. (2009). What are the consequences of the disappearing human microbiota? Nat. Rev. Microbiol. 7, 887–894. doi: 10.1038/nrmicro2245
Bolger, A. M., Lohse, M., and Usadel, B. (2014). Trimmomatic: a flexible trimmer for Illumina sequence data. Bioinformatics 30, 2114–2120. doi: 10.1093/bioinformatics/btu170
Bolyen, E., Rideout, J. R., Dillon, M. R., Bokulich, N. A., Abnet, C. C., Al-Ghalith, G. A., et al. (2019). Reproducible, interactive, scalable and extensible microbiota data science using QIIME 2. Nat. Biotechnol. 37, 852–857. doi: 10.1038/s41587-019-0209-9
Bradley, E., and Haran, J. (2024). The human gut microbiome and aging. Gut Microbes 16:2359677. doi: 10.1080/19490976.2024.2359677
Caruso, R., Lo, B. C., and Nunez, G. (2020). Host-microbiota interactions in inflammatory bowel disease. Nat. Rev. Immunol. 20, 411–426. doi: 10.1038/s41577-019-0268-7
Chang, S. H., and Choi, Y. (2023). Gut dysbiosis in autoimmune diseases: association with mortality. Front. Cell. Infect. Microbiol. 13:1157918. doi: 10.3389/fcimb.2023.1157918
Chascsa, D. M., Ferré, E. M. N., Hadjiyannis, Y., Alao, H., Natarajan, M., Quinones, M., et al. (2021). APECED-associated hepatitis: clinical, biochemical, histological and treatment data from a large, predominantly American cohort. Hepatology 73, 1088–1104. doi: 10.1002/hep.31421
Chen, C., Yan, Q., Yao, X., Li, S., Lv, Q., Wang, G., et al. (2022). Alterations of the gut virome in patients with systemic lupus erythematosus. Front. Immunol. 13:1050895. doi: 10.3389/fimmu.2022.1050895
Chen, J., Wright, K., Davis, J. M., Jeraldo, P., Marietta, E. V., Murray, J., et al. (2016). An expansion of rare lineage intestinal microbes characterizes rheumatoid arthritis. Genome Med. 8:43. doi: 10.1186/s13073-016-0299-7
Colombo, A. P., Bennet, S., Cotton, S. L., Goodson, J. M., Kent, R., Haffajee, A. D., et al. (2012). Impact of periodontal therapy on the subgingival microbiota of severe periodontitis: comparison between good responders and individuals with refractory periodontitis using the human oral microbe identification microarray. J. Periodontol. 83, 1279–1287. doi: 10.1902/jop.2012.110566
Cornejo-Pareja, I., Ruiz-Limón, P., Gómez-Pérez, A. M., Molina-Vega, M., Moreno-Indias, I., and Tinahones, F. J. (2020). Differential microbial pattern description in subjects with autoimmune-based thyroid diseases: a pilot study. J. Pers. Med. 10:192. doi: 10.3390/jpm10040192
Cukrowska, B., Bierła, J. B., Zakrzewska, M., Klukowski, M., and Maciorkowska, E. (2020). The relationship between the infant gut microbiota and allergy. The role of bifidobacterium breve and prebiotic oligosaccharides in the activation of anti-allergic mechanisms in early life. Nutrients 12:946. doi: 10.3390/nu12040946
Curry, K. D., Nute, M. G., and Treangen, T. J. (2021). It takes guts to learn: machine learning techniques for disease detection from the gut microbiota. Emerg. Top. Life Sci. 5, 815–827. doi: 10.1042/ETLS20210213
da Silva Brito, W. A., Mutter, F., Wende, K., Cecchini, A. L., Schmidt, A., and Bekeschus, S. (2022). Consequences of nano and microplastic exposure in rodent models: the known and unknown. Part. Fibre Toxicol. 19:28. doi: 10.1186/s12989-022-00473-y
Dai, D., Zhu, J., Sun, C., Li, M., Liu, J., Wu, S., et al. (2022). GMrepo v2: a curated human gut microbiota database with special focus on disease markers and cross-dataset comparison. Nucleic Acids Res. 50, D777–D784. doi: 10.1093/nar/gkab1019
Dan, Z., Mao, X., Liu, Q., Guo, M., Zhuang, Y., Liu, Z., et al. (2020). Altered gut microbial profile is associated with abnormal metabolism activity of Autism Spectrum Disorder. Gut Microbes 11, 1246–1267. doi: 10.1080/19490976.2020.1747329
Danne, C., Skerniskyte, J., Marteyn, B., and Sokol, H. (2024). Neutrophils: from IBD to the gut microbiota. Nat. Rev. Gastroenterol. Hepatol. 21, 184–197. doi: 10.1038/s41575-023-00871-3
de Paiva, C. S., Jones, D. B., Stern, M. E., Bian, F., Moore, Q. L., Corbiere, S., et al. (2016). Altered mucosal microbiota diversity and disease severity in Sjögren syndrome. Sci. Rep. 6:23561. doi: 10.1038/srep23561
Derrien, M., Turroni, F., Ventura, M., and van Sinderen, D. (2022). Insights into endogenous Bifidobacterium species in the human gut microbiota during adulthood. Trends Microbiol. 30, 940–947. doi: 10.1016/j.tim.2022.04.004
Dunalska, A., Saramak, K., and Szejko, N. (2023). The role of gut microbiota in the pathogenesis of multiple sclerosis and related disorders. Cells 12:1760. doi: 10.3390/cells12131760
Durcan, L., O'Dwyer, T., and Petri, M. (2019). Management strategies and future directions for systemic lupus erythematosus in adults. Lancet 393, 2332–2343. doi: 10.1016/S0140-6736(19)30237-5
Forbes, J. D., Van Domselaar, G., and Bernstein, C. N. (2016). Microbiota survey of the inflamed and noninflamed gut at different compartments within the gastrointestinal tract of inflammatory bowel disease patients. Inflamm. Bowel Dis. 22, 817–825. doi: 10.1097/MIB.0000000000000684
Furusawa, Y., Obata, Y., Fukuda, S., Endo, T. A., Nakato, G., Takahashi, D., et al. (2013). Commensal microbe-derived butyrate induces the differentiation of colonic regulatory T cells. Nature 504, 446–450. doi: 10.1038/nature12721
Gacesa, R., Kurilshikov, A., Vich Vila, A., Sinha, T., Klaassen, M. A. Y., Bolte, L. A., et al. (2022). Environmental factors shaping the gut microbiota in a Dutch population. Nature 604, 732–739. doi: 10.1038/s41586-022-04567-7
Gavzy, S. J., Kensiski, A., Lee, Z. L., Mongodin, E. F., Ma, B., and Bromberg, J. S. (2023). Bifidobacterium mechanisms of immune modulation and tolerance. Gut Microbes 15:2291164. doi: 10.1080/19490976.2023.2291164
Gensollen, T., Iyer, S. S., Kasper, D. L., and Blumberg, R. S. (2016). How colonization by microbiota in early life shapes the immune system. Science 352, 539–544. doi: 10.1126/science.aad9378
Ghannam, R. B., and Techtmann, S. M. (2021). Machine learning applications in microbial ecology, human microbiota studies, and environmental monitoring. Comput. Struct. Biotechnol. J. 19, 1092–1107. doi: 10.1016/j.csbj.2021.01.028
Griffiths, C. E. M., Armstrong, A. W., Gudjonsson, J. E., and Barker, J. N. W. N. (2021). Psoriasis. Lancet 397, 1301–1315. doi: 10.1016/S0140-6736(20)32549-6
Gupta, V. K., Kim, M., Bakshi, U., Cunningham, K. Y., Davis, J. M. III., Lazaridis, K. N., et al. (2020). A predictive index for health status using species-level gut microbiota profiling. Nat. Commun. 11:4635. doi: 10.1038/s41467-020-18476-8
Harrison, P. W., Ahamed, A., Aslam, R., Alako, B. T. F., Burgin, J., Buso, N., et al. (2021). The European Nucleotide archive in 2020. Nucleic Acids Res. 49, D82–D85. doi: 10.1093/nar/gkaa1028
He, Y., Wu, W., Zheng, H. M., Li, P., McDonald, D., Sheng, H. F., et al. (2018). Regional variation limits applications of healthy gut microbiota reference ranges and disease models. Nat. Med. 24, 1532–1535. doi: 10.1038/s41591-018-0164-x
Hevia, A., Milani, C., López, P., Cuervo, A., Arboleya, S., Duranti, S., et al. (2014). Intestinal dysbiosis associated with systemic lupus erythematosus. MBio 5, e01548–e01514. doi: 10.1128/mBio.01548-14
Hong, M., Li, Z., Liu, H., Zheng, S., Zhang, F., Zhu, J., et al. (2023). Fusobacterium nucleatum aggravates rheumatoid arthritis through FadA-containing outer membrane vesicles. Cell Host Microbe 31, 798–810.e7. doi: 10.1016/j.chom.2023.03.018
Islam, M. Z., Tran, M., Xu, T., Tierney, B. T., Patel, C., and Kostic, A. D. (2022). Reproducible and opposing gut microbiota signatures distinguish autoimmune diseases and cancers: a systematic review and meta-analysis. Microbiota 10:218. doi: 10.1186/s40168-022-01373-1
Jiang, P., Wu, S., Luo, Q., Zhao, X. M., and Chen, W. H. (2021). Metagenomic analysis of common intestinal diseases reveals relationships among microbial signatures and powers multidisease diagnostic models. mSystems 6:e00112-21. doi: 10.1128/mSystems.00112-21
Jiao, Y., Wu, L., Huntington, N. D., and Zhang, X. (2020). Crosstalk between gut microbiota and innate immunity and its implication in autoimmune diseases. Front. Immunol. 11:282. doi: 10.3389/fimmu.2020.00282
Kartal, E., Schmidt, T. S. B., Molina-Montes, E., Rodríguez-Perales, S., Wirbel, J., Maistrenko, O. M., et al. (2022). A faecal microbiota signature with high specificity for pancreatic cancer. Gut 71, 1359–1372. doi: 10.1136/gutjnl-2021-324755
Katz, K., Shutov, O., Lapoint, R., Kimelman, M., Brister, J. R., and O'Sullivan, C. (2022). The sequence read archive: a decade more of explosive growth. Nucleic Acids Res. 50, D387–D390. doi: 10.1093/nar/gkab1053
Khan, S., and Kelly, L. (2020). Multiclass disease classification from microbial whole-community metagenomes. Pac. Symp. Biocomput. 25, 55–66. doi: 10.1101/726901
Knight, R., Vrbanac, A., Taylor, B. C., Aksenov, A., Callewaert, C., Debelius, J., et al. (2018). Best practices for analysing microbiotas. Nat. Rev. Microbiol. 16, 410–422. doi: 10.1038/s41579-018-0029-9
Leibovitzh, H., Lee, S. H., Xue, M., Raygoza Garay, J. A., Hernandez-Rocha, C., Madsen, K. L., et al. (2022).K. Altered gut microbiome composition and function are associated with gut barrier dysfunction in healthy relatives of patients with Crohn's disease. Gastroenterology 163, 1364–1376.e10. doi: 10.1053/j.gastro.2022.07.004
Letchumanan, G., Abdullah, N., Marlini, M., Baharom, N., Lawley, B., Omar, M. R., et al. (2022). Gut microbiota composition in prediabetes and newly diagnosed type 2 diabetes: a systematic review of observational studies. Front. Cell. Infect. Microbiol. 12:943427. doi: 10.3389/fcimb.2022.943427
Ley, R. E., Peterson, D. A., and Gordon, J. I. (2006). Ecological and evolutionary forces shaping microbial diversity in the human intestine. Cell 124, 837–848. doi: 10.1016/j.cell.2006.02.017
Li, B., He, Y., Ma, J., Huang, P., Du, J., Cao, L., et al. (2019). Mild cognitive impairment has similar alterations as Alzheimer's disease in gut microbiota. Alzheimers Dement. 15, 1357–1366. doi: 10.1016/j.jalz.2019.07.002
Li, M., Liu, J., Zhu, J., Wang, H., Sun, C., Gao, N. L., et al. (2023). Performance of gut microbiota as an independent diagnostic tool for 20 diseases: cross-cohort validation of machine-learning classifiers. Gut Microbes 15:2205386. doi: 10.1080/19490976.2023.2205386
Li, Z., Liang, H., Hu, Y., Lu, L., Zheng, C., Fan, Y., et al. (2023). Gut bacterial profiles in Parkinson's disease: a systematic review. CNS Neurosci. Ther. 29, 140–157. doi: 10.1111/cns.13990
Lian, F. P., Zhang, F., Zhao, C. M., Wang, X. X., Bu, Y. J., Cen, X., et al. (2024). Gut microbiota regulation of T lymphocyte subsets during systemic lupus erythematosus. BMC Immunol. 25:41. doi: 10.1186/s12865-024-00632-0
Liu, J., Qin, X., Lin, B., Cui, J., Liao, J., Zhang, F., et al. (2022). Analysis of gut microbiota diversity in Hashimoto's thyroiditis patients. BMC Microbiol. 22:318. doi: 10.1186/s12866-022-02739-z
Liu, P., Wu, L., Peng, G., Han, Y., Tang, R., Ge, J., et al. (2019). Altered microbiotas distinguish Alzheimer's disease from amnestic mild cognitive impairment and health in a Chinese cohort. Brain Behav. Immun. 80, 633–643. doi: 10.1016/j.bbi.2019.05.008
Liu, Y. X., Qin, Y., Chen, T., Lu, M., Qian, X., Guo, X., et al. (2021). A practical guide to amplicon and metagenomic analysis of microbiota data. Protein Cell 12, 315–330. doi: 10.1007/s13238-020-00724-8
Lu, Y., Cui, A., and Zhang, X. (2024). Commensal microbiota-derived metabolite agmatine triggers inflammation to promote colorectal tumorigenesis. Gut Microbes. 16, 2348441. doi: 10.1080/19490976.2024.2348441
Marcos-Zambrano, L. J., Karaduzovic-Hadziabdic, K., Loncar Turukalo, T., Przymus, P., Trajkovik, V., Aasmets, O., et al. (2021). Applications of machine learning in human microbiota studies: a review on feature selection, biomarker identification, disease prediction and treatment. Front. Microbiol. 12:634511. doi: 10.3389/fmicb.2021.634511
McDonald, D., Clemente, J. C., Kuczynski, J., Rideout, J. R., Stombaugh, J., Wendel, D., et al. (2012a). The Biological Observation Matrix (BIOM) format or: how I learned to stop worrying and love the ome-ome. Gigascience 1:7. doi: 10.1186/2047-217X-1-7
McDonald, D., Price, M. N., Goodrich, J., Nawrocki, E. P., DeSatis, T. Z., Probst, A., et al. (2012b). An improved Greengenes taxonomy with explicit ranks for ecological and evolutionary analyses of bacteria and archaea. ISME J. 6, 610–618. doi: 10.1038/ismej.2011.139
Michels, F., Colaert, J., Gheysen, F., and Scheerlinck, T. (2007). Late prosthetic joint infection due to Rothia mucilaginosa. Acta Orthop. Belg. 73, 263–267.
Miller, F. W., Pollard, K. M., Parks, C. G., Germolec, D. R., Leung, P. S., Selmi, C., et al. (2012). Criteria for environmentally associated autoimmune diseases. J. Autoimmun. 39, 253–258. doi: 10.1016/j.jaut.2012.05.001
Mu, Q., Kirby, J., Reilly, C. M., and Luo, X. M. (2017). Leaky gut as a danger signal for autoimmune diseases. Front. Immunol. 8:598. doi: 10.3389/fimmu.2017.00598
Nagata, N., Nishijima, S., Kojima, Y., Hisada, Y., Imbe, K., Miyoshi-Akiyama, T., et al. (2022). Metagenomic identification of microbial signatures predicting pancreatic cancer from a multinational study. Gastroenterology 163, 222–238. doi: 10.1053/j.gastro.2022.03.054
Ning, C., Ouyang, H., Xiao, J., Wu, D., Sun, Z., and Liu, B. Development validation of an explainable machine learning model for mortality prediction among patients with infected pancreatic necrosis. EClinicalMedicine (2025) 80:103074. doi: 10.1016/j.eclinm.2025.103074.
Oh, T. G., Kim, S. M., Caussy, C., Fu, T., Guo, J., Bassirian, S., et al. (2020). A universal gut-microbiota-derived signature predicts cirrhosis. Cell Metab. 32, 878–888.e6. doi: 10.1016/j.cmet.2020.06.005
Pang, S., Chen, X., Lu, Z., Meng, L., Huang, Y., Yu, X., et al. (2023). Longevity of centenarians is reflected by the gut microbiome with youth-associated signatures. Nat. Aging 3, 436–449. doi: 10.1038/s43587-023-00389-y
Pasolli, E., Truong, D. T., Malik, F., Waldron, L., and Segata, N. (2016). Machine learning meta-analysis of large metagenomic datasets: tools and biological insights. PLoS Comput. Biol. 12:e1004977. doi: 10.1371/journal.pcbi.1004977
Piccioni, A., Cicchinelli, S., Valletta, F., De Luca, G., Longhitano, Y., Candelli, M., et al. (2022). Gut microbiota and autoimmune diseases: a charming real world together with probiotics. Curr. Med. Chem. 29, 3147–3159. doi: 10.2174/0929867328666210922161913
Pittayanon, R., Lau, J. T., Leontiadis, G. I., Tse, F., Yuan, Y., Surette, M., et al. (2020). Differences in gut microbiota in patients with vs without inflammatory bowel diseases: a systematic review. Gastroenterology. 158, 930–946.e1. doi: 10.1053/j.gastro.2019.11.294
Plichta, D. R., Somani, J., Pichaud, M., Wallace, Z. S., Fernandes, A. D., Perugino, C. A., et al. (2021). Congruent microbiota signatures in fibrosis-prone autoimmune diseases: IgG4-related disease and systemic sclerosis. Genome Med. 13:35. doi: 10.1186/s13073-021-00853-7
Qin, N., Yang, F., Li, A., Prifti, E., Chen, Y., Shao, L., et al. (2014). Alterations of the human gut microbiota in liver cirrhosis. Nature 513, 59–64. doi: 10.1038/nature13568
Quince, C., Walker, A. W., Simpson, J. T., Loman, N. J., and Segata, N. (2017). Shotgun metagenomics, from sampling to analysis. Nat. Biotechnol. 35, 833–844. doi: 10.1038/nbt.3935
Ramos-Casals, M., Brito-Zerón, P., Kostov, B., Sisó-Almirall, A., Bosch, X., Buss, D., et al. (2015). Google-driven search for big data in autoimmune geoepidemiology: analysis of 394,827 patients with systemic autoimmune diseases. Autoimmun. Rev. 14, 670–679. doi: 10.1016/j.autrev.2015.03.008
Sabater, C., Calvete-Torre, I., Ruiz, L., and Margolles, A. (2022). Arabinoxylan and pectin metabolism in crohn's disease microbiota: an in silico study. Int. J. Mol. Sci. 23:7093. doi: 10.3390/ijms23137093
Schirmer, M., Garner, A., Vlamakis, H., and Xavier, R. J. (2019). Microbial genes and pathways in inflammatory bowel disease. Nat. Rev. Microbiol. 17, 497–511. doi: 10.1038/s41579-019-0213-6
Schriml, L. M., Munro, J. B., Schor, M., Olley, D., McCracken, C., Felix, V., et al. (2022). The human disease ontology 2022 update. Nucleic Acids Res. 50, D1255–D1261. doi: 10.1093/nar/gkab1063
Shamriz, O., Mizrahi, H., Werbner, M., Shoenfeld, Y., Avni, O., and Koren, O. (2016). Microbiota at the crossroads of autoimmunity. Autoimmun. Rev. 15, 859–869. doi: 10.1016/j.autrev.2016.07.012
Sommer, F., and Bäckhed, F. (2013). The gut microbiota–masters of host development and physiology. Nat. Rev. Microbiol. 11, 227–238. doi: 10.1038/nrmicro2974
Strauss, J., Kaplan, G. G., Beck, P. L., Rioux, K., Panaccione, R., Devinney, R., et al. (2011). Invasive potential of gut mucosa-derived Fusobacterium nucleatum positively correlates with IBD status of the host. Inflamm. Bowel Dis. 17, 1971–1978. doi: 10.1002/ibd.21606
Su, Q., Liu, Q., Lau, R. I., Zhang, J., Xu, Z., Yeoh, Y. K., et al. (2022). Faecal microbiota-based machine learning for multi-class disease diagnosis. Nat. Commun. 13, 6818. doi: 10.1038/s41467-022-34405-3
Sun, H., Guo, Y., Wang, H., Yin, A., Hu, J., Yuan, T., et al. (2023). Gut commensal Parabacteroides distasonis alleviates inflammatory arthritis. Gut 72, 1664–1677. doi: 10.1136/gutjnl-2022-327756
Szekanecz, Z., McInnes, I. B., Schett, G., Szamosi, S., Benko, S., and Szucs, G. (2021). Autoinflammation and autoimmunity across rheumatic and musculoskeletal diseases. Nat. Rev. Rheumatol. 17, 585–595. doi: 10.1038/s41584-021-00652-9
Uitto, V. J., Baillie, D., Wu, Q., Gendron, R., Grenier, D., Putnins, E. E., et al. (2005). Fusobacterium nucleatum increases collagenase 3 production and migration of epithelial cells. Infect. Immun. 73, 1171–1179. doi: 10.1128/IAI.73.2.1171-1179.2005
Vaahtovuo, J., Munukka, E., Korkeamäki, M., Luukkainen, R., and Toivanen, P. (2008). Fecal microbiota in early rheumatoid arthritis. J. Rheumatol. 35, 1500–1505.
van den Bogert, B., Meijerink, M., Zoetendal, E. G., Wells, J. M., and Kleerebezem, M. (2014). Immunomodulatory properties of Streptococcus and Veillonella isolates from the human small intestine microbiota. PLoS ONE 9:e114277. doi: 10.1371/journal.pone.0114277
Verrall, A. J., Robinson, P. C., Tan, C. E., Mackie, W. G., and Blackmore, T. K. (2010). Rothia aeria as a cause of sepsis in a native joint. J. Clin. Microbiol. 48, 2648–2650. doi: 10.1128/JCM.02217-09
Vich Vila, A., Imhann, F., Collij, V., Jankipersadsing, S. A., Gurry, T., Mujagic, Z., et al. (2018). Gut microbiota composition and functional changes in inflammatory bowel disease and irritable bowel syndrome. Sci. Transl. Med. 10:eaap8914. doi: 10.1126/scitranslmed.aap8914
Volkmann, E. R., Chang, Y. L., Barroso, N., Furst, D. E., Clements, P. J., Gorn, A. H., et al. (2016). Association of systemic sclerosis with a unique colonic microbial consortium. Arthrit. Rheumatol. 68, 1483–1492. doi: 10.1002/art.39572
Wang, L., Wang, F. S., and Gershwin, M. E. (2015). Human autoimmune diseases: a comprehensive update. J. Intern. Med. 278, 369–395. doi: 10.1111/joim.12395
Wang, Y., Hou, R., Ni, B., Jiang, Y., and Zhang, Y. (2023). Development and validation of a prediction model based on machine learning algorithms for predicting the risk of heart failure in middle-aged and older US people with prediabetes or diabetes. Clin. Cardiol. 46, 1234–1243. doi: 10.1002/clc.24104
Wei, Y., Li, Y., Yan, L., Sun, C., Miao, Q., Wang, Q., et al. (2020). Alterations of gut microbiota in autoimmune hepatitis. Gut 69, 569–577. doi: 10.1136/gutjnl-2018-317836
Wu, S., Sun, C., Li, Y., Wang, T., Jia, L., Lai, S., et al. (2020). GMrepo: a database of curated and consistently annotated human gut metagenomes. Nucleic Acids Res. 48, D545–D553. doi: 10.1093/nar/gkz764
Xiang, K., Wang, P., Xu, Z., Hu, Y. Q., He, Y. S., Chen, Y., et al. (2021). Causal effects of gut microbiota on systemic lupus erythematosus: a two-sample mendelian randomization study. Front. Immunol. 12:667097. doi: 10.3389/fimmu.2021.667097
Yachida, S., Mizutani, S., Shiroma, H., Shiba, S., Nakajima, T., Sakamoto, T., et al. (2019). Metagenomic and metabolomic analyses reveal distinct stage-specific phenotypes of the gut microbiota in colorectal cancer. Nat. Med. 25, 968–976. doi: 10.1038/s41591-019-0458-7
Yang, G., Wei, J., Liu, P., Zhang, Q., Tian, Y., Hou, G., et al. (2021). Role of the gut microbiota in type 2 diabetes and related diseases. Metab. Clin. Exp. 117:154712. doi: 10.1016/j.metabol.2021.154712
Yang, W., and Cong, Y. (2021). Gut microbiota-derived metabolites in the regulation of host immune responses and immune-related inflammatory diseases. Cell. Mol. Immunol. 18, 866–877. doi: 10.1038/s41423-021-00661-4
Yao, K., Xie, Y., Wang, J., Lin, Y., Chen, X., and Zhou, T. (2023). Gut microbiota: a newly identified environmental factor in systemic lupus erythematosus. Front. Immunol. 14, 1202850. doi: 10.3389/fimmu.2023.1202850
Ye, Z., Wu, C., Zhang, N., Du, L., Cao, Q., Huang, X., et al. (2020). Altered gut microbiota composition in patients with Vogt-Koyanagi-Harada disease. Gut Microbes 11, 539–555. doi: 10.1080/19490976.2019.1700754
Ye, Z., Zhang, N., Wu, C., Zhang, X., Wang, Q., Huang, X., et al. (2018). A metagenomic study of the gut microbiota in Behcet's disease. Microbiota 6:135. doi: 10.1186/s40168-018-0520-6
Yousefi, B., Babaeizad, A., Banihashemian, S. Z., Feyzabadi, Z. K., Dadashpour, M., Pahlevan, D., et al. (2023). Gastrointestinal tract, microbiota and multiple sclerosis (MS) and the link between gut microbiota and CNS. Curr. Microbiol. 80:38. doi: 10.1007/s00284-022-03150-7
Yu, Z., Wang, Y., Guo, Y., Zhu, R., Fang, Y., Yao, Q., et al. (2025). Exploring the therapeutic and gut microbiota-modulating effects of qingreliangxuefang on IMQ-induced psoriasis. Drug Des. Devel. Ther. 19, 3269–3291. doi: 10.2147/DDDT.S492044
Yuming, Z., Ruqi, T., Gershwin, M. E., and Xiong, M. (2024). Autoimmune hepatitis: pathophysiology. Clin. Liver Dis. 28, 15–35. doi: 10.1016/j.cld.2023.06.003
Zhang, J., Chen, Y., Li, L., Liu, R., and Li, P. (2024). MNAM enhances Blautia abundance and modulates Th17/Treg balance to alleviate diabetes in T2DM mice. Biochem. Pharmacol. 230(Pt 2):116593. doi: 10.1016/j.bcp.2024.116593
Zhang, X., Zhang, D., Jia, H., Feng, Q., Wang, D., Liang, D., et al. (2015). The oral and gut microbiotas are perturbed in rheumatoid arthritis and partly normalized after treatment. Nat. Med. 21, 895–905. doi: 10.1038/nm.3914
Zhu, L., Xu, L. Z., Zhao, S., Shen, Z. F., Shen, H., and Zhan, L. B. (2020). Protective effect of baicalin on the regulation of Treg/Th17 balance, gut microbiota and short-chain fatty acids in rats with ulcerative colitis. Appl. Microbiol. Biotechnol. 104, 5449–5460. doi: 10.1007/s00253-020-10527-w
Zoetendal, E. G., Rajilic-Stojanovic, M., and de Vos, W. M. (2008). High-throughput diversity and functionality analysis of the gastrointestinal tract microbiota. Gut 57, 1605–1615. doi: 10.1136/gut.2007.133603
Keywords: gut microbiota, autoimmune diseases, machine learning, microbial signature, auxiliary diagnostic evaluation
Citation: An T, Zhang S, Li J, Wang H, Chen L, Shi Y, Wang J, Han S, Wang R, Wang L, Huan Z, Yang R, Hao D, Liu Y, Liu X and Yuan C (2025) Gut microbiota analysis reveals microbial signature for multi-autoimmune diseases based on machine learning model. Front. Microbiol. 16:1660775. doi: 10.3389/fmicb.2025.1660775
Received: 06 July 2025; Accepted: 18 August 2025;
Published: 25 September 2025.
Edited by:
Yanfen Cheng, Nanjing Agricultural University, ChinaReviewed by:
Yuqi Li, University of Illinois at Urbana-Champaign, United StatesShahzaib Khoso, University Hospital Maggiore of Carita, Italy
Copyright © 2025 An, Zhang, Li, Wang, Chen, Shi, Wang, Han, Wang, Wang, Huan, Yang, Hao, Liu, Liu and Yuan. This is an open-access article distributed under the terms of the Creative Commons Attribution License (CC BY). The use, distribution or reproduction in other forums is permitted, provided the original author(s) and the copyright owner(s) are credited and that the original publication in this journal is cited, in accordance with accepted academic practice. No use, distribution or reproduction is permitted which does not comply with these terms.
*Correspondence: Chao Yuan, aGVsbGdlbF95Y0AxMjYuY29t; Xuehua Liu, bGx4eGhoMTIxMkAxMjYuY29t
†Present Address: Chao Yuan and Xuehua Liu, Tianjin Medical University, Tianjin, China
‡These authors have contributed equally to this work